The Middle Rideau Subwatershed, as its name suggests, is nicely nestled in the middle of the Rideau system. Water flows from the higher, rocky lake country of the Rideau Lakes Subwatershed into the flatter farmland of the Middle Rideau Subwatershed. Water flows through the Middle Rideau on to the Lower Rideau at Burritts Rapids.
Drainage Area: 822 square kilometres Length of River: 36 kilometres
Catchments:Barbers Creek,Black Creek (a.k.a. Cockburn Creek),Dales Creek,Hutton Creek,Irish Creek,Otter Creek,Rideau Creek,Rosedale Creek
Catchment Reports
The RVCA produces individual reports on the Rideau watershed’s catchments. These catchment reports are a compilation of data collected through the RVCA’s watershed monitoring and land cover classification programs.
Catchment information is used to develop subwatershed reports that summarize the health of the Rideau’s six main subwatersheds.
Middle Rideau Subwatershed Report 2015
BARBERS CREEK CATCHMENT
The Rideau Valley Conservation Authority produces individual reports for ten catchments in the Middle Rideau subwatershed. Using data collected and analysed by the RVCA through its watershed monitoring and land cover classification programs, surface water quality conditions are reported for Barbers Creek along with a summary of environmental conditions for the surrounding countryside every six years.
This information is used to better understand the effects of human activity on our water resources, allows us to better track environmental change over time and helps focus watershed management actions where they are needed the most to help sustain the ecosystem services (cultural, aesthetic and recreational values; provisioning of food, fuel and clean water; regulation of erosion/natural hazard protection and water purification; supporting nutrient/water cycling and habitat provision) provided by the catchment’s lands and forests and waters (Millennium Ecosystem Assessment 2005).
The following pages of this report are a compilation of that work and contain information on surface water quality, riparian conditions, land cover, stewardship activity and hazard land and water resources protection.
1. Catchment Facts

General Geography
- The Rideau River flows through the heart of the Middle Rideau and is a focal point for residents and visitors to the area. It extends from the outlet of Lower Rideau Lake at Poonamalie (where there is one dam and one lock) to Burritts Rapids (where there is also a dam and lock), at which point it enters the Lower Rideau on its way to Rideau Falls. The Rideau River is also an integral part of the Rideau Canal National Historic Site of Canada and is a significant tourist attraction which draws boaters, cottagers, and campers to the area
- Smiths Falls, Merrickville and Burritts Rapids are the main settlements in the Middle Rideau subwatershed. The Barbers Creek catchment is predominantly rural in character with agriculture being the main land use
- Parks Canada staff manage water levels for recreational purposes along the Rideau Canal/Waterway that flows by the catchment, ensuring 1.5 metres of draft during the navigation season. In this managed system, water levels on the Rideau Canal are manipulated by operation of numerous dams. In the Middle Rideau subwatershed, Parks Canada staff operate 9 dam and lock complexes with 13 locks for a fall of 36.2 metres over 35.6 kilometres. Water levels are maintained as close as possible to set objectives through the May to October navigation season. The levels are lowered through the rest of October and into November and held at the winter levels until the spring freshet in late March or early April naturally increases inflows to the system. To reduce the impact of the higher flows in the spring, the amount of snow water equivalent, forecast rain, ice cover, flows and levels are assessed and the dams in the Middle Rideau reach are operated accordingly to quickly pass as much water as possible. In late April and early May, the dams are gradually closed and water levels are brought up to be ready, once again, for the navigation season
Physical Geography
- All of the Barbers Creek catchment and the rest of the Middle Rideau subwatershed primarily resides within the Smith Falls Limestone Plain, which in this area, consists mainly of older Paleozoic quartz sandstone and dolostone of the March Formation. Oxford Formation dolostone is, however, found at the northern tip of the catchment. A small area of the bedrock in the lower (northern) catchment is overlain with a rocky, sandy glacial till plain, which may host drumlins. The rest of the bedrock in the catchment is overlain by a thin veneer of glacial sediment, referred to as ‘drift’ that is generally less than a metre in thickness along with organic deposits underlying the two main wetlands in the catchment
- Sixty percent of the catchment lies within the Village of Merrickville-Wolford and 40 percent within the Township of Elizabethtown-Kitley
- Barbers Creek catchment drainage area is 48 square kilometres and occupies about six percent of the Middle Rideau subwatershed and one percent of the Rideau Valley watershed
Vulnerable Areas
- Lower reach of Barbers Creek is subject to a flooding hazard during the regional storm flood (the 100 year flood). Surveys and studies undertaken in accordance with provincial standards have determined that the 100 year flood elevation in this area ranges from 108.7 metres above mean sea level at Barber Road to 103.8 metres above mean sea level at its outlet to the Rideau River
- The Assessment Report developed under the Ontario Clean Water Act identifies the upper bedrock aquifer underlying all of the catchment area as a Highly Vulnerable Aquifer, although, where sediments are thicker in a local area, the vulnerability would be less
Development
- Land uses in the catchment are Rural and Agriculture with some Wetland
Conditions at a Glance
Water Quality
- Surface chemistry water quality rating in Barbers Creek is “Fair” over two reporting periods (2003-2008 and 2009-2014). Elevated bacterial counts and nutrient concentrations from inflows of nutrients (from private septic systems, agricultural and residential surface water runoff) are a feature of Barbers Creek. Decreased nutrient and bacterial counts are needed to improve the overall health of the creek
- Instream biological water quality conditions at the Barbers Creek sample location range from “Very Poor” to “Good” from 2003 to 2014 (using a grading scheme developed by Ontario Conservation Authorities in Ontario for benthic invertebrates) with an overall benthic invertebrate water quality rating of “Poor” to “Good” determined for this period
Instream and Riparian
- Overall instream and riparian condition for the Barbers creek catchment as assessed by the stream characterization and headwater drainage feature assessment programs show that Barbers Creek and its tributaries are in generally fair condition. The majority of the system has low erosion levels and a healthy riparian corridor. Instream diversity of aquatic habitat is fairly uniform. An opportunity was identified along one of the headwater drainage features to enhance riparian habitat conditions
- The Barbers Creek catchment has 28 species of recreational and bait fish and is classified as having a warm/cool water thermal guild that supports the Barbers Creek/Rideau River fishery
- In the Barbers Creek catchment, the riparian buffer (30 m. wide strip along the shoreline of all lakes and streams) is comprised of wetland (46 percent), crop and pastureland (34 percent), woodland (17 percent), roads (two percent) and settlement areas (one percent)
Land Cover
- Dominant land cover is crop and pastureland (40 percent), followed by wetland (29 percent), woodland (26 percent), settlement areas (three percent) and roads (two percent). From 2008 to 2014, there was an overall change of 102 hectares (from one land cover class to another). While a large portion of change for Barbers Creek is a result of the conversion of woodland to crop and pastureland, it also appears that a similar proportion of change is associated with crop and pastureland emerging as young woodland
- Woodland cover in the catchment has decreased by 13 hectares between 2008 and 2014 and interior forest habitat has increased by six hectares
- Wetland cover has decreased by four percent (209 ha) from pre-settlement times to the present and now occupies 29 percent of the catchment area
Other
- Approximately 98 in-use water wells with provincial records exist in this catchment. While most water wells are used for domestic water supply, several are also used for agricultural purposes along with one other that is used as a public water supply
- There are no active Permits to Take Water or Environmental Compliance Approvals in the catchment; nor are there any open or closed aggregate operations in the catchment
Catchment Care
- Eight stewardship projects have been completed with assistance from the RVCA’s Rural Clean Water and Tree Planting Programs (see Section 5 of this report for details)
- Barbers Creek surface water quality has been monitored by the RVCA through its Baseline Monitoring Program since 2003. The surface water quality at site BAR-01 is monitored once a month from April to November
- RVCA has been collecting benthic invertebrates in Barbers Creek at the Weedmark Road site since 2003
- RVCA conducted a fish survey along Barbers Creek in 2014
- RVCA completed a stream characterization survey on Barbers Creek in 2014, working upstream to the headwaters from the mouth of the creek where it empties into the Rideau River taking measurements and recording observations on instream habitat, bank stability, other attributes and preparing a temperature profile
- RVCA completed five headwater drainage feature assessments at road crossings in the Barbers Creek catchment in 2014. This protocol measures zero and first order headwater drainage features and is a rapid assessment method characterizing the amount of water, sediment transport, and storage capacity within headwater drainage features
- A watershed model developed by the RVCA in 2009 was used to study the hydrologic function of wetlands in the Rideau Valley Watershed, including those found in the Barbers Creek catchment
- The Township of Elizabethtown-Kitley and the Village of Merrickville-Wolford have land use planning policies and zoning provisions - on water setbacks, frontage and naturalized shorelines and wetland protection - and in some instances use site plan control to implement these policies and provisions. Together with RVCA, these municipalities work with landowners on a case by case basis to enable new development while ensuring the scale is suitable on the lot, impacts on neighbours are minimized and development maximizes the watercourse setback
- Development in and adjacent to the Provincially Significant Wetlands in the catchment (Barber’s Creek Marsh, Irish Lake-Barber Creek, Wolford Bog Part 1) are subject to Ontario Regulation 174-06 (entitled “Development, Interference with Wetlands and Alterations to Shorelines and Watercourses”) that protects the hydrologic function of the wetland and also protects landowners and their property from natural hazards (flooding, fluctuating water table, unstable soils) associated with them
2. Surface Water Quality Conditions
Surface water quality conditions in the Barbers Creek catchment are monitored by the Rideau Valley Conservation Authority’s (RVCA) Baseline Water Quality Monitoring Program. The Baseline Water Quality Program focuses on streams; data is collected for 22 parameters including nutrients (total phosphorus, total Kjeldahl nitrogen and ammonia), E. coli, metals (like aluminum and copper) and additional chemical/physical parameters (such as alkalinity, chlorides, pH and total suspended solids). Figure 1 shows the location of the monitoring site in the catchment.
Figure 1 Water quality monitoring site on Barbers Creek
Barbers Creek Water Quality
Water Quality Rating
The water quality ratings for the Barbers Creek catchment is “Fair” (Table 1) as determined by the Canadian Council of Ministers of the Environment (CCME) Water Quality Index CCME and is largely influenced by high nutrient concentrations, metals and high bacterial counts. A "Fair" rating indicates that water quality is usually protected but is occasionally threatened or impaired; conditions sometimes depart from natural or desirable levels. Each parameter is evaluated against established guidelines to determine water quality conditions. Those parameters that frequently exceed guidelines are presented below. Analysis of the data has been broken into two periods; 2003 to 2008 and 2009 to 2014 for the stream monitoring site located on Barbers Creek (BAR-01) to examine if conditions have changed between these periods. Table 1 shows the overall rating for the monitored surface water quality site within the Barbers Creek catchment and Table 2 outlines the Water Quality Index (WQI) scores and their corresponding ratings.
Table 1 Water Quality Ratings for the Barbers Creek catchment
Table 2 WQI ratings and corresponding index scores (RVCA terminology, original WQI category names in brackets)
Nutrients
Total phosphorus (TP) is used as a primary indicator of excessive nutrient loading and may contribute to abundant aquatic vegetation growth and depleted dissolved oxygen levels. The Provincial Water Quality Objective (PWQO) is used as the TP Guideline and states that in streams concentrations greater than 0.030 mg/l indicate an excessive amount of TP.
Total Kjeldahl nitrogen (TKN) and ammonia (NH3) are used as secondary indicators of nutrient loadings. RVCA uses a guideline of 0.500 mg/l to assess TKN[1] and the PWQO of 0.020 mg/l to assess NH3 concentrations in Barbers Creek.
Tables 3, 4 and 5 summarize average nutrient concentrations at monitored sites within the Barbers Creek catchment and show the proportion of results that meet the guidelines.
Table 3 Summary of total phosphorus results for Barbers Creek, 2003-2008 and 2009-2014. Highlighted values indicate average concentrations exceed the guideline
Table 4 Summary of total Kjeldahl nitrogen results for Barbers Creek from 2003-2008 and 2009-2014. Highlighted values indicate average concentrations exceed the guideline
Table 5 Summary of ammonia results for Barbers Creek from 2003-2008 and 2009-2014. Highlighted values indicate average concentrations exceed the guideline
Elevated TP results were a regular occurrence at site BAR-01; 43 percent of samples were below the guideline in the 2003-2008 period (Figure 2); this increased to 49 percent of samples in the 2009-2014 period (Figure 3). The average TP concentration also decreased slightly from 0.064 mg/l (2003- 2008) to 0.052 mg/l (2009-2014).
Figure 2 Total phosphorous concentrations in Barbers Creek, 2003-2008
Figure 3 Total phosphorous concentrations in Barbers Creek, 2009-2014
TKN data show that the majority of results exceeded the guideline (Figures 4 and 5); there were very few samples (4 percent) below the guideline in the 2003-2008 period and this declined to no samples below the guideline in the 2009-2014 period. The average concentration increased from 1.011 mg/l (2003-2008) to 1.127 mg/l (2003-2008) (Table 4).
Figure 4 Total Kjeldahl nitrogen concentrations in Barbers Creek, 2003-2008
Figure 5 Total Kjeldahl nitrogen concentrations in Barbers Creek, 2009-2014
NH3 data also reported regular instances of exceedances and results at this site were generally above the guideline of 0.020 mg/l (Figures 6 and 7); the proportion of samples below the guideline declined slightly from 38 percent to 33 percent. The average concentration in the 2003-2008 monitoring period was 0.068 mg/l, well above the PWQO. In the 2009-2014 period the average concentration declined to 0.018 mg/l which is still slightly above the PWQO (Table 5).
Figure 6 Ammonia concentrations in Barbers Creek, 2003-2008
Figure 7 Ammonia concentrations in Barbers Creek, 2009-2014
Summary
The data shows that nutrient enrichment is a characteristic of Barbers Creek. High nutrient concentrations can help stimulate the growth of algae blooms and other aquatic vegetation in a waterbody and deplete oxygen levels as the vegetation dies off.
E. Coli
E. coli is used as an indicator of bacterial pollution from human or animal waste; in elevated concentrations it can pose a risk to human health. The PWQO of 100 colony forming units/100 milliliters (CFU/100 ml) is used to assess E. coli. Counts greater than this guideline indicate that bacterial contamination may be a problem within the watercourse.
Table 6 summarizes the geometric mean[2] for the monitored site on Barbers Creek and shows the proportion of samples that meet the E. coli guideline of 100 CFU/100 ml. The results of the geometric mean with respect to the guideline for the two periods, 2003-2008 and 2009- 2014, are shown in Figures 8 and 9 respectively.
Table 6 Summary of E. coli results for Otter Creek, 2003-2008 and 2009-2014. Highlighted values indicated average concentrations have exceeded the guideline.
E. coli counts at site BAR-01 indicate an improvement with regard to bacterial contamination. The proportion of samples below the guideline increased from 24 percent (Figure 8) to 41 percent (Figure 9) and the count at the geometric mean decreased from 215 (2003-2008) to 193 (2009-2014) CFU/100ml.
Figure 8 Geometric mean of E.coli counts in Barbers Creek, 2003-2008
Figure 9 Geometric mean of E.coli counts in Barbers Creek, 2009-2014
Summary
This data shows that bacterial contamination is a concern on Barbers Creek. There has been an improvement from the 2003-2008 to the 2009-2014 monitoring period, however the count at the geometric mean is above the PWQO for both monitoring periods. Properly maintaining septic systems, enhancing shoreline buffers and restricting cattle access can help to improve E.coli levels in Barbers Creek.
Metals
Of the metals routinely monitored in Barbers Creek, aluminum (Al), iron (Fe) and copper (Cu) occasionally reported concentrations above their respective PWQOs. In elevated concentrations, these metals can have toxic effects on sensitive aquatic species.
Tables 7, 8 and 9 summarize metal concentrations at site BAR-01 and show the proportion of samples that meet guidelines. Figures 10 to 15 show metal concentrations with respect to the guidelines for the two periods of interest, 2003–2008 and 2009–2014. The guideline metal concentrations as described by the PWQO are 0.75mg/L Al, 0.300mg/L Fe and 0.005mg/L Cu.
Table 7 Summary of Aluminum results for Barbers Creek from 2003-2008 and 2009-2014; highlighted values indicate the average concentration exceeds the guideline
Results from BAR-01 shows that Al concentrations had some exceedances with 63 percent of samples below the guideline in the 2003-2008 period (Figure 10). This improved to 84 percent of samples in the 2009-2014 period (Figure 11). The average concentration of Al was 0.120 mg/l from 2003-2008 which exceeds the guideline. From 2009-2014 the average concentration improved to 0.031 mg/l which is below the guideline.
Figure 10 Aluminum concentrations in Barbers Creek, 2003-2008
Figure 11 Aluminum concentrations in Barbers Creek, 2009-2014
Table 8 Summary of Iron results for Barbers Creek from 2003-2008 and 2009-2014
Concentrations of Fe also exceeded the PWQO guideline at times but were generally lower than Al. The proportion of Fe samples below the guideline increased from 67 percent to 96 percent (Figures 12 and 13). Although there were observed exceedances, the average concentration of Fe did not exceed the guideline in both monitoring periods; 0.280 mg/l in 2003-2008 and .083 mg/l in 2009-2014.
Figure 12 Iron concentrations in Barbers Creek, 2003-2008
 Figure 13
 Iron concentrations in Barbers Creek, 2009-2014
Table 9 Summary of Copper results for Barbers Creek from 2003-2008 and 2009-2014; highlighted values indicate the average concentration exceeds the guideline
Copper concentrations have occasionally exceeded the guidelines. In the 2003-2008 period 93 percent of samples were below the guideline (Figure 14) and declined to 88 percent of samples in the 2009–2014 period (Figure 15). This contributed to an increase in the average concentration from 0.002 mg/l (2003–2008) to 0.009 mg/l (2009–2014).
Figure 14 Copper concentrations in Barbers Creek, 2003-2008
Figure 15 Copper concentrations in Barbers Creek, 2009-2014
Summary
Aluminum and Iron concentrations declined, while Copper concentrations increased slightly between the two periods of interest. Efforts should continue to be made to identify pollution sources and implement best management practices to reduce any inputs such as runoff, metal alloys, fungicides and pesticides to improve overall stream health and lessen downstream impacts.
[1] No Ontario guideline for TKN is presently available; however, waters not influenced by excessive organic inputs typically range from 0.100 to 0.500 mg/l, Environment Canada (1979) Water Quality Sourcebook, A Guide to Water Quality Parameters, Inland Waters Directorate, Water Quality Branch, Ottawa, Canada
[2] A type of mean or average, which indicates the central tendency or typical value of a set of numbers by using the product of their values (as opposed to the arithmetic mean which uses their sum). It is often used to summarize a variable that varies over several orders of magnitude, such as E. coli counts.
3. Barbers Creek Riparian Conditions
Shoreline Buffer Land Cover Evaluation
The riparian or shoreline zone is that special area where the land meets the water. Well-vegetated shorelines are critically important in protecting water quality and creating healthy aquatic habitats, lakes and rivers. Natural shorelines intercept sediments and contaminants that could impact water quality conditions and harm fish habitat in streams. Well established buffers protect the banks against erosion, improve habitat for fish by shading and cooling the water and provide protection for birds and other wildlife that feed and rear young near water. A recommended target (from Environment Canada’s Guideline: How Much Habitat is Enough?) is to maintain a minimum 30 meter wide vegetated buffer along at least 75 percent of the length of both sides of rivers, creeks and streams.
Figure 16 shows the extent of the naturally vegetated riparian zone along a 30 metre strip of the shoreline of Barbers Creek and its tributaries. This information is derived from a dataset developed by the RVCA’s Land Cover Classification Program through heads-up digitization of 20cm DRAPE ortho-imagery at a 1:4000 scale, which details the catchment landscape using 10 land cover classes.
Figure 16 Natural and other riparian land cover in the Barbers Creek catchment
This analysis shows that the riparian buffer in the Barbers Creek catchment is comprised of wetland (46 percent), crop and pastureland (34 percent), woodland (17 percent), roads (two percent) and settlement areas (one percent). Additional statistics for the Barbers Creek catchment are presented in Table 10. Of particular interest is the observed increase in the area of “Crop and Pasture” along the shoreline of Barbers Creek over a six year period.
Table 10 Riparian land cover (2008 vs. 2014) in the Barbers Creek catchment
Barbers Creek Overbank Zone
Riparian Buffer Width Evaluation
Figure 17 demonstrates the buffer conditions of the left and right banks separately. Barbers Creek had a buffer of greater than 30 meters along 77 percent of the right bank and 82 percent of the left bank.
Figure 17 Riparian Buffer Evaluation along Barbers Creek
Adjacent Land Use
The RVCA’s Stream Characterization Program identifies eight different land uses beside Barbers Creek (Figure 18). Surrounding land use is considered from the beginning to end of the survey section (100m) and up to 100m on each side of the creek. Land use outside of this area is not considered for the surveys but is nonetheless part of the subwatershed and will influence the creek. Natural areas made up 62 percent of the stream, characterized by wetlands, forest, scrubland and meadow. The remaining land use consisted of active agriculture, pasture, residential and infrastructure in the form of road crossings.
Figure 18 Land Use along Barbers Creek
Barbers Creek Shoreline Zone
Instream Erosion
Erosion is a normal, important stream process and may not affect actual bank stability; however, excessive erosion and deposition of sediment within a stream can have a detrimental effect on important fish and wildlife habitat. Poor bank stability can greatly contribute to the amount of sediment carried in a waterbody as well as loss of bank vegetation due to bank failure, resulting in trees falling into the stream and the potential to impact instream migration. Figure 19 shows low levels of erosion along Barbers Creek.
Figure 19 Erosion along Barbers Creek
Undercut Stream Banks
Undercut banks are a normal and natural part of stream function and can provide excellent refuge areas for fish. Figure 20 shows that Barbers Creek did not have any undercut banks identified along the system.
Figure 20 Undercut stream banks along Barbers Creek
Stream Shading
Grasses, shrubs and trees all contribute towards shading a stream. Shade is important in moderating stream temperature, contributing to food supply and helping with nutrient reduction within a stream. Figure 21 shows low to moderate levels of stream shading conditions along Barbers Creek.
Figure 21 Stream shading along Barbers Creek
Instream Woody Debris
Figure 22 shows that the majority of Barbers Creek had low to moderate levels of instream woody debris in the form of branches and trees. Instream woody debris is important for fish and benthic invertebrate habitat, by providing refuge and feeding areas.
Figure 22 Instream woody debris along Barbers Creek
Overhanging Trees and Branches
Figure 23 shows low to moderate levels of overhanging branches and trees along Barbers Creek. Overhanging branches and trees provide a food source, nutrients and shade which helps to moderate instream water temperatures.
Figure 23 Overhanging trees and branches along Barbers Creek
Anthropogenic Alterations
Figure 24 shows 95 percent of Barbers Creek remains “unaltered” with no anthropogenic alterations. Five percent of Barbers Creek was classified as natural with minor anthropogenic changes in the form of road crossings.
Figure 24 Anthropogenic alterations along Barbers Creek
Barbers Creek Instream Aquatic Habitat
Benthic Invertebrates
Freshwater benthic invertebrates are animals without backbones that live on the stream bottom and include crustaceans such as crayfish, molluscs and immature forms of aquatic insects. Benthos represent an extremely diverse group of aquatic animals and exhibit wide ranges of responses to stressors such as organic pollutants, sediments and toxicants, which allows scientists to use them as bioindicators. As part of the Ontario Benthic Biomonitoring Network (OBBN), the RVCA has been collecting benthic invertebrates at the Weedmark road site on Barbers Creek since 2003. Monitoring data is analyzed for each sample site and the results are presented using the Family Biotic Index, Family Richness and percent Ephemeroptera, Plecoptera and Trichoptera.
The Hilsenhoff Family Biotic Index (FBI) is an indicator of organic and nutrient pollution and provides an estimate of water quality conditions for each site using established pollution tolerance values for benthic invertebrates. FBI results for Barbers Creek are separated by reporting period 2003 to 2008 and 2009 to 2014. “Very Poor” to “Good” water quality conditions being observed at the Barbers Creek sample location for the period from 2003 to 2014 (Fig.25) using a grading scheme developed by Conservation Authorities in Ontario for benthic invertebrates.
Figure 25 Hilsenhoff Family Biotic Index on Barbers Creek
Family Richness measures the health of the community through its diversity and increases with increasing habitat diversity suitability and healthy water quality conditions. Family Richness is equivalent to the total number of benthic invertebrate families found within a sample. Barbers Creek is reported to have “Fair” to “Good” family richness (Fig.26).
Figure 26 Family Richness in Barbers Creek
Ephemeroptera (Mayflies), Plecoptera (Stoneflies), and Trichoptera (Caddisflies) are species considered to be very sensitive to poor water quality conditions. High abundance of these organisms is generally an indication of good water quality conditions at a sample location. During more recent sampling years the community structure has been shifting to species that are more tolerant to poor water quality conditions. As a result, the EPT indicates that Barbers Creek is reported to have “Poor” to “Fair” water quality (Fig.27) from 2003 to 2014.
Figure 27 EPT in Barbers Creek
Conclusion
Overall Barbers Creek aquatic habitat conditions from a benthic invertebrate perspective range from “Poor” to “Fair” from 2003 to 2014.
Habitat Complexity
Streams are naturally meandering systems and move over time; there are varying degrees of habitat complexity, depending on the creek. Examples of habitat complexity include variable habitat types such as pools and riffles as well as substrate variability and woody debris structure. A high percentage of habitat complexity (heterogeneity) typically increases the biodiversity of aquatic organisms within a system. Only twenty one percent of Barbers Creek was considered heterogeneous, as shown in Figure 28.
Figure 28 Habitat complexity along Barbers Creek
Instream Substrate
Diverse substrate is important for fish and benthic invertebrate habitat because some species have specific substrate requirements and for example will only reproduce on certain types of substrate. Figure 29 shows that 28 percent of the substrate observed on Barbers Creek was dominated by silt. Overall substrate conditions were highly variable along Barbers Creek. Figure 30 shows the dominant substrate type observed for each section surveyed along Barbers Creek.
Figure 29 Instream substrate along Barbers Creek
Figure 30 shows the dominant substrate type along Barbers Creek.
Cobble and Boulder Habitat
Boulders create instream cover and back eddies for large fish to hide and/or rest out of the current. Cobble provides important spawning habitat for certain fish species like walleye and various shiner species who are an important food source for larger fish. Cobble can also provide habitat conditions for benthic invertebrates that are a key food source for many fish and wildlife species. Figure 31 shows where cobble and boulder substrate are found in Barbers Creek.
Figure 31 Instream substrate cobble and boulder along Barbers Creek
Instream Morphology
Pools and riffles are important habitat features for fish. Riffles are areas of agitated water and they contribute higher dissolved oxygen to the stream and act as spawning substrate for some species of fish, such as walleye. Pools provide shelter for fish and can be refuge pools in the summer if water levels drop and water temperature in the creek increases. Pools also provide important over wintering areas for fish. Runs are usually moderately shallow, with unagitated surfaces of water and areas where the thalweg (deepest part of the channel) is in the center of the channel. Figure 32 shows that Barbers Creek is fairly uniform; 93 percent consists of runs, 3 percent riffles and 4 percent pools. Figure 33 shows where riffle habitat was observed along Barbers Creek.
Figure 32 Instream morphology along Barbers Creek
Figure 33 Riffle habitat locations along Barbers Creek
Vegetation Type
Instream vegetation provides a variety of functions and is a critical component of the aquatic ecosystem. For example emergent plants along the shoreline can provide shoreline protection from wave action and important rearing habitat for species of waterfowl. Submerged plants provide habitat for fish to find shelter from predator fish while they feed. Floating plants such as water lilies shade the water and can keep temperatures cool while reducing algae growth. The dominant vegetation type recorded at thirty six percent consisted of algae. Barbers Creek had high levels of diversity for instream vegetation. Figure 34 depicts the plant community structure for Barbers Creek. Figure 35 shows the dominant vegetation type observed for each section surveyed along Barbers Creek.
Figure 34 Vegetation type along Barbers Creek
Figure 35 Dominant vegetation type along Barbers Creek
Instream Vegetation Abundance
Instream vegetation is an important factor for a healthy stream ecosystem. Vegetation helps to remove contaminants from the water, contributes oxygen to the stream, and provides habitat for fish and wildlife. Too much vegetation can also be detrimental. Figure 36 demonstrates that Barbers Creek had common and normal levels of instream vegetation for 50 percent of its length. Low and rare vegetation was measured at 33 percent, while extensive levels were recorded at 17 percent of stream surveys.
Figure 36 Instream vegetation abundance along Barbers Creek
Invasive Species
Invasive species can have major implications on streams and species diversity. Invasive species are one of the largest threats to ecosystems throughout Ontario and can out compete native species, having negative effects on local wildlife, fish and plant populations. One hundred percent of the sections surveyed along Barbers Creek had invasive species (Figure 37). The invasive species observed in Barbers Creek were European frogbit, purple loosestrife, glossy and common buckthorn, poison/wild parsnip and Manitoba maple. Figure 38 shows the frequency of the invasive species observed along Barbers Creek.
Figure 37 Invasive species along Barbers Creek
Figure 38 Invasive species frequency along Barbers Creek
Water Chemistry
During the stream characterization survey, a YSI probe is used to collect water chemistry information. Dissolved oxygen, conductivity and pH are measured at the start and end of each section.
Dissolved Oxygen
Dissolved oxygen is a measure of the amount of oxygen dissolved in water. The Canadian Environmental Quality Guidelines of the Canadian Council of Ministers of the Environment (CCME) suggest that for the protection of aquatic life the lowest acceptable dissolved oxygen concentration should be 6 mg/L for warmwater biota and 9.5 mg/L for coldwater biota (CCME, 1999). Figure 39 shows that the dissolved oxygen in Barbers Creek was within the threshold for warmwater biota in most reaches of the system, however areas in the middle reaches were below the warmwater threshold. The average dissolved oxygen levels observed within the main stem of Barbers Creek was 6. 8 mg/L which is within the recommended levels for warmwater biota.
Figure 39 Dissolved oxygen ranges in Barbers Creek
Conductivity
Conductivity in streams is primarily influenced by the geology of the surrounding environment, but can vary drastically as a function of surface water runoff. Currently there are no CCME guideline standards for stream conductivity; however readings which are outside the normal range observed within the system are often an indication of unmitigated discharge and/or stormwater input. The average conductivity observed within the main stem of Barbers Creek was 311 µs/cm. Figure 40 shows the conductivity readings for Barbers Creek.
Figure 40 Specific conductivity ranges in Barbers Creek
pH
Based on the PWQO for pH, a range of 6.5 to 8.5 should be maintained for the protection of aquatic life. Average pH values for Barbers Creek averaged 7.66 thereby meeting the provincial standard (Figure 41).
Figure 41 pH ranges in Barbers Creek
Thermal Regime
Many factors can influence fluctuations in stream temperature, including springs, tributaries, precipitation runoff, discharge pipes and stream shading from riparian vegetation. Water temperature is used along with the maximum air temperature (using the Stoneman and Jones method) to classify a watercourse as either warm water, cool water or cold water. Figure 42 shows where the thermal sampling sites were located along Barbers Creek. Analysis of the data collected indicates that Barbers Creek is classified as a cool-warm water system with warm water reaches (Figure 43).
Figure 42 Temperature logger locations on Barbers Creek
Figure 43 Temperature logger data for three sites on Barbers Creek
Each point on the graph represents a temperature that meets the following criteria:
- Sampling dates between July 1st and September 7th
- Sampling date is preceded by two consecutive days above 24.5 °C, with no rain
- Water temperatures are collected at 4pm
- Air temperature is recorded as the max temperature for that day
Groundwater
Groundwater discharge areas can influence stream temperature, contribute nutrients, and provide important stream habitat for fish and other biota. During stream surveys, indicators of groundwater discharge are noted when observed. Indicators include: springs/seeps, watercress, iron staining, significant temperature change and rainbow mineral film. Figure 44 shows an area where one or more of the above groundwater indicators were observed during stream surveys and headwater assessments.
Figure 44 Groundwater indicators observed in the Barbers Creek catchment
Headwaters Drainage Features Assessment
The RVCA Stream Characterization program assessed Headwater Drainage Features for the Middle Rideau subwatershed in 2014. This protocol measures zero, first and second order headwater drainage features (HDF). It is a rapid assessment method characterizing the amount of water, sediment transport, and storage capacity within headwater drainage features (HDF). RVCA is working with other Conservation Authorities and the Ministry of Natural Resources and Forestry to implement the protocol with the goal of providing standard datasets to support science development and monitoring of headwater drainage features. An HDF is a depression in the land that conveys surface flow. Additionally, this module provides a means of characterizing the connectivity, form and unique features associated with each HDF (OSAP Protocol, 2013). In 2014 the program sampled 5 sites at road crossings in the Barbers Creek catchment area (Figure 45).

Figure 45 Locations of the headwater sampling sites in the Barbers Creek catchment
Spring photo of a headwater sample site in the Barbers Creek catchment on County Road 7
Summer photo of a headwater sample site in the Barbers Creek catchment on County Road 7
Feature Type
The headwater sampling protocol assesses the feature type in order to understand the function of each feature. The evaluation includes the following classifications: defined natural channel, channelized or constrained, multi-thread, no defined feature, tiled, wetland, swale, roadside ditch and pond outlet. By assessing the values associated with the headwater drainage features in the catchment area we can understand the ecosystem services that they provide to the watershed in the form of hydrology, sediment transport, and aquatic and terrestrial functions. The Barbers Creek catchment is dominated by wetland headwater drainage features. One feature was classified as having been channelized. Figure 46 shows the feature type of the primary feature at the sampling locations.
Figure 46 Headwater feature types in the Barbers Creek catchment
Headwater Feature Flow
The observed flow condition within headwater drainage features can be highly variable depending on timing relative to the spring freshet, recent rainfall, soil moisture, etc. Flow conditions are assessed in the spring and in the summer to determine if features are perennial and flow year round, if they are intermittent and dry up during the summer months or if they are ephemeral systems that do not flow regularly and generally respond to specific rainstorm events or snowmelt. Flow conditions in headwater systems can change from year to year depending on local precipitation patterns. Figure 47 shows the observed flow conditions at the sampling locations in the Barbers Creek catchment.
Figure 47 Headwater feature flow conditions in the Barbers Creek catchment
Feature Channel Modifications
Channel modifications were assessed at each headwater drainage feature sampling location. Modifications include channelization, dredging, hardening and realignments. Three sampling locations for the Barbers Creek catchment area were classified as having no channel modifications and two appeared to have been historically dredged. Figure 48 shows the channel modifications observed at the sampling locations for Barbers Creek.
Figure 48 Headwater feature channel modifications in the Barbers Creek catchment
Headwater Feature Vegetation
Headwater feature vegetation evaluates the type of vegetation that is found within the drainage feature. The type of vegetated within the channel influences the aquatic and terrestrial ecosystem values that the feature provides. For some types of headwater features the vegetation within the feature plays a very important role in flow and sediment movement and provides wildlife habitat. The following classifications are evaluated no vegetation, lawn, wetland, meadow, scrubland and forest. The features assessed in the Barbers Creek catchment were classified as wetland or meadow. Figure 49. Depicts the dominant vegetation observed at the sampled headwater sites in the Barbers Creek catchment.
Figure 49 Headwater feature vegetation types in the Barbers Creek catchment
Headwater Feature Riparian Vegetation
Headwater riparian vegetation evaluates the type of vegetation that is found along the adjacent lands of a headwater drainage feature. The type of vegetation within the riparian corridor influences the aquatic and terrestrial ecosystem values that the feature provides to the watershed. The sample locations in Barbers Creek were dominated by natural vegetation in the form of meadow, scrubland, forest and wetland vegetation. Figure 50. Depicts the type of riparian vegetation observed at the sampled headwater sites in the Barbers Creek catchment.
Figure 50 Headwater feature riparian vegetation types in the Barbers Creek catchment
Headwater Feature Sediment Deposition
Assessing the amount of recent sediment deposited in a channel provides an index of the degree to which the feature could be transporting sediment to downstream reaches (OSAP, 2013). Evidence of excessive sediment deposition might indicate the requirement to follow up with more detailed targeted assessments upstream of the site location to identify potential best management practices to be implemented. Conditions ranged from no deposition observed to moderate deposition recorded. Figure 51. Depicts the degree of sediment deposition observed at the sampled headwater sites in the Barbers Creek catchment.
Figure 51 Headwater feature sediment deposition in the Barbers Creek catchment
Headwater Feature Upstream Roughness
Feature roughness will provide a measure of the amount of materials within the bankfull channel that could slow down the velocity of water flowing within the headwater feature (OSAP, 2013). Materials on the channel bottom that provide roughness include vegetation, woody debris and boulders/cobble substrates. Roughness can provide benefits in mitigating downstream erosion on the headwater drainage feature and the receiving watercourse by reducing velocities. Roughness also provides important habitat conditions to aquatic organisms. The sample locations in the Barbers Creek catchment area were dominated by extreme roughness conditions. Figure 52 shows the feature roughness conditions at the sampling locations in the Barbers Creek catchment.
Figure 52 Headwater feature roughness in the Barbers Creek catchment
Fish Community
The Barbers Creek catchment is classified as a mixed community of warm and cool water recreational and baitfish fishery with 28 species observed. Figure 53 shows the sampling locations along Barbers Creek. Table 11 lists those species observed in the catchment (Source: MNR/RVCA).
Figure 53 Barbers Creek fish community sampling locations
Table 11 Fish species observed in Barbers Creek
RVCA staff sorting fish captured in Barbers Creek into containers by species for identification
Migratory Obstructions
It is important to know locations of migratory obstructions because these can prevent fish from accessing important spawning and rearing habitat. Migratory obstructions can be natural or manmade, and they can be permanent or seasonal. Figure 54 shows that Barbers Creek had one beaver dam at the time of the survey in 2014.
Figure 54 Migratory obstructions along Barbers Creek
Riparian Restoration
Figure 55 depicts the location of a riparian restoration opportunity as a result of observations made during the stream survey and headwater drainage feature assessments. One site was identified on a headwater drainage feature.
Figure 55 Riparian restoration opportunities along Barbers Creek
4. Land Cover
Land cover and any change in coverage that has occurred over a six year period is summarized for the Barbers Creek catchment using spatially continuous vector data representing the catchment during the spring of 2008 and 2014. This dataset was developed by the RVCA through heads-up digitization of 20cm DRAPE ortho-imagery at a 1:4000 scale and details the surrounding landscape using 10 land cover classes.
As shown in Table 12, the dominant land cover type in 2008 and 2014 was crop and pastureland, followed by wetland and woodland.
Table 12 Land cover (2008 vs. 2014) in the Barbers Creek catchment
* Does not include treed swamps ** Includes treed swamps
From 2008 to 2014, there was an overall change of 102 hectares (from one land cover class to another). While a large portion of change for Barbers Creek is a result of the conversion of woodland to crop and pastureland, it also appears that a similar proportion of change is associated with crop and pastureland (i.e., previously cultivated areas/fallow fields) emerging as young woodland (i.e., regenerative and/or plantation) (see Figure 56 for the location of the major changes).
Figure 56 Dominant land cover change in the Barbers Creek catchment (2014)
Table 13 shows the type of land cover change that has taken place between land cover classes/types from 2008 to 2014.
Overall, the net area of woodland change (loss) is small at 13 hectares relative to the remaining area of woodland in the catchment (as of 2014). Similarly, the net area of crop and pastureland change (gain) is also small at eight hectares relative to the remaining area of crop and pastureland in the catchment (as of 2014).
Table 13 Land cover change in the Barbers Creek catchment (2008 to 2014)
Woodland Cover
In the Environment Canada Guideline (Third Edition) entitled “How Much Habitat Is Enough?” (hereafter referred to as the “Guideline”) the opening narrative under the Forest Habitat Guidelines section states that prior to European settlement, forest was the predominant habitat in the Mixedwood Plains ecozone. The remnants of this once vast forest now exist in a fragmented state in many areas (including the Rideau Valley watershed) with woodland patches of various sizes distributed across the settled landscape along with higher levels of forest cover associated with features such as the Frontenac Axis (within the on-Shield areas of the Rideau Lakes and Tay River subwatersheds). The forest legacy, in terms of the many types of wildlife species found, overall species richness, ecological functions provided and ecosystem complexity is still evident in the patches and regional forest matrices (found in the Middle Rideau subwatershed and elsewhere in the Rideau Valley watershed). These ecological features are in addition to other influences which forests have on water quality and stream hydrology including reducing soil erosion, producing oxygen, storing carbon along with many other ecological services that are essential not only for wildlife but for human well-being.
The Guideline also notes that forests provide a great many habitat niches that are in turn occupied by a great diversity of plant and animal species. They provide food, water and shelter for these species - whether they are breeding and resident locally or using forest cover to help them move across the landscape. This diversity of species includes many that are considered to be species at risk. Furthermore, from a wildlife perspective, there is increasing evidence that the total forest cover in a given area is a major predictor of the persistence and size of bird populations, and it is possible or perhaps likely that this pattern extends to other flora and fauna groups. The overall effect of a decrease in forest cover on birds in fragmented landscapes is that certain species disappear and many of the remaining ones become rare, or fail to reproduce, while species adapted to more open and successional habitats, as well as those that are more tolerant to human-induced disturbances in general, are able to persist and in some cases thrive. Species with specialized-habitat requirements are most likely to be adversely affected. The overall pattern of distribution of forest cover, the shape, area and juxtaposition of remaining forest patches and the quality of forest cover also play major roles in determining how valuable forests will be to wildlife and people alike.
The current science generally supports minimum forest habitat requirements between 30 and 50 percent, with some limited evidence that the upper limit may be even higher, depending on the organism/species phenomenon under investigation or land-use/resource management planning regime being considered/used.
As shown in Figure 57, 32 percent of the Barbers Creek catchment contains 1252 hectares of upland forest and 279 hectares of lowland forest (treed swamps) versus the 34 percent of woodland cover in the Middle Rideau subwatershed. This is greater than the 30 percent of forest cover that is identified as the minimum threshold required to sustain forest birds according to the Guideline and which may only support less than one half of potential species richness and marginally healthy aquatic systems. When forest cover drops below 30 percent, forest birds tend to disappear as breeders across the landscape.
Figure 57 Woodland cover and forest interior (2014)
Woodland (Patch) Size
According to the Ministry of Natural Resources’ Natural Heritage Reference Manual (Second Edition), larger woodlands are more likely to contain a greater diversity of plant and animal species and communities than smaller woodlands and have a greater relative importance for mobile animal species such as forest birds.
Bigger forests often provide a different type of habitat. Many forest birds breed far more successfully in larger forests than they do in smaller woodlots and some rely heavily on forest interior conditions. Populations are often healthier in regions with more forest cover and where forest fragments are grouped closely together or connected by corridors of natural habitat. Small forests support small numbers of wildlife. Some species are “area-sensitive” and tend not to inhabit small woodlands, regardless of forest interior conditions. Fragmented habitat also isolates local populations, especially small mammals, amphibians and reptiles with limited mobility. This reduces the healthy mixing of genetic traits that helps populations survive over the long run (Conserving the Forest Interior. Ontario Extension Notes, 2000).
The Environment Canada Guideline also notes that for forest plants that do not disperse broadly or quickly, preservation of some relatively undisturbed large forest patches is needed to sustain them because of their restricted dispersal abilities and specialized habitat requirements and to ensure continued seed or propagation sources for restored or regenerating areas nearby.
The Natural Heritage Reference Manual continues by stating that a larger size also allows woodlands to support more resilient nutrient cycles and food webs and to be big enough to permit different and important successional stages to co-exist. Small, isolated woodlands are more susceptible to the effects of blowdown, drought, disease, insect infestations, and invasions by predators and non-indigenous plants. It is also known that the viability of woodland wildlife depends not only on the characteristics of the woodland in which they reside, but also on the characteristics of the surrounding landscape where the woodland is situated. Additionally, the percentage of forest cover in the surrounding landscape, the presence of ecological barriers such as roads, the ability of various species to cross the matrix surrounding the woodland and the proximity of adjacent habitats interact with woodland size in influencing the species assemblage within a woodland.
In the Barbers Creek catchment (in 2014), forty-one (33 percent) of the 125 woodland patches are very small, being less than one hectare in size. Another 62 (50 percent) of the woodland patches ranging from one to less than 20 hectares in size tend to be dominated by edge-tolerant bird species. The remaining 22 (18 percent of) woodland patches range between 20 and 155 hectares in size. Eighteen of these patches contain woodland between 20 and 100 hectares and may support a few area-sensitive species and some edge intolerant species, but will be dominated by edge tolerant species.
Conversely, four (three percent) of the 125 woodland patches in the drainage area exceed the 100 plus hectare size needed to support most forest dependent, area sensitive birds and are large enough to support approximately 60 percent of edge-intolerant species. No patch tops 200 hectares, which according to the Environment Canada Guideline will support 80 percent of edge-intolerant forest bird species (including most area sensitive species) that prefer interior forest habitat conditions.
Table 14 presents a comparison of woodland patch size in 2008 and 2014 along with any changes that have occurred over that time. A decrease (of 13 ha) has been observed in the overall woodland patch area between the two reporting periods with most change occurring in the 20 to 50 hectare woodland patch size class range.
Table 14 Woodland patches in the Barbers Creek catchment (2008 and 2014)
*Includes treed swamps
Forest Interior
The forest interior is habitat deep within woodlands. It is a sheltered, secluded environment away from the influence of forest edges and open habitats. Some people call it the “core” or the “heart” of a woodland. The presence of forest interior is a good sign of woodland health, and is directly related to the woodland’s size and shape. Large woodlands with round or square outlines have the greatest amount of forest interior. Small, narrow woodlands may have no forest interior conditions at all. Forest interior habitat is a remnant natural environment, reminiscent of the extensive, continuous forests of the past. This increasingly rare forest habitat is now a refuge for certain forest-dependent wildlife; they simply must have it to survive and thrive in a fragmented forest landscape (Conserving the Forest Interior. Ontario Extension Notes, 2000).
The Natural Heritage Reference Manual states that woodland interior habitat is usually defined as habitat more than 100 metres from the edge of the woodland and provides for relative seclusion from outside influences along with a moister, more sheltered and productive forest habitat for certain area sensitive species. Woodlands with interior habitat have centres that are more clearly buffered against the edge effects of agricultural activities or more harmful urban activities than those without.
In the Barbers Creek catchment (in 2014), the 125 woodland patches contain 51 forest interior patches (Figure 58) that occupy five percent (253 ha.) of the catchment land area (which is the same as the five percent of interior forest in the Middle Rideau Subwatershed). This is below the ten percent figure referred to in the Environment Canada Guideline that is considered to be the minimum threshold for supporting edge intolerant bird species and other forest dwelling species in the landscape.
Most patches (43) have less than 10 hectares of interior forest, 22 of which have small areas of interior forest habitat less than one hectare in size. The remaining eight patches contain interior forest ranging between 10 and 34 hectares in area.
Between 2008 and 2014, there has been a notable change in the number of woodland patches containing smaller areas of interior habitat (Table 15). For example, there has been an increase of 13 woodlands containing less than one hectare of interior forest over this period and seven woodlands with one to 10 hectares of interior habitat. This appears to have occurred as a result of the loss of interior forest habitat in the largest woodland patches in the catchment over this period.
Table 15 Woodland Interior in the Barbers Creek catchment (2008 and 2014)
Wetland Cover
Wetlands are habitats forming the interface between aquatic and terrestrial systems. They are among the most productive and biologically diverse habitats on the planet. By the 1980s, according to the Natural Heritage Reference Manual, 68 percent of the original wetlands south of the Precambrian Shield in Ontario had been lost through encroachment, land clearance, drainage and filling.
Wetlands perform a number of important ecological and hydrological functions and provide an array of social and economic benefits that society values. Maintaining wetland cover in a watershed provides many ecological, economic, hydrological and social benefits that are listed in the Reference Manual and which may include:
- contributing to the stabilization of shorelines and to the reduction of erosion damage through the mitigation of water flow and soil binding by plant roots
- mitigating surface water flow by storing water during periods of peak flow (such as spring snowmelt and heavy rainfall events) and releasing water during periods of low flow (this mitigation of water flow also contributes to a reduction of flood damage)
- contributing to an improved water quality through the trapping of sediments, the removal and/or retention of excess nutrients, the immobilization and/or degradation of contaminants and the removal of bacteria
- providing renewable harvesting of timber, fuel wood, fish, wildlife and wild rice
- contributing to a stable, long-term water supply in areas of groundwater recharge and discharge
- providing a high diversity of habitats that support a wide variety of plants and animals
- acting as “carbon sinks” making a significant contribution to carbon storage
- providing opportunities for recreation, education, research and tourism
Historically, the overall wetland coverage within the Great Lakes basin exceeded 10 percent, but there was significant variability among watersheds and jurisdictions, as stated in the Environment Canada Guideline. In the Rideau Valley Watershed, it has been estimated that pre-settlement wetland cover averaged 35 percent using information provided by Ducks Unlimited Canada (2010) versus the 21 percent of wetland cover existing in 2014 derived from DRAPE imagery analysis.
Using the same dataset, it is estimated that pre-settlement (historic) wetland cover averaged 32 percent in the Middle Rideau subwatershed versus the 27 percent of cover existing in 2014. This decline in wetland cover is also evident in the Barbers Creek catchment (as seen in Figure 58) where there has been a four percent decrease in the area of wetland cover from pre-settlement times to the present (as summarized in Table 16).
Figure 58 Catchment wetland cover
While there has been a reported decrease in wetland cover in the Barbers Creek catchment from pre-settlement times, the remaining wetland cover in 2014 remains above the ecological thresholds cited in the Environment Canada Guideline. Nonetheless, in order to maintain critical hydrological, ecological functions along with related recreational and economic benefits provided by these wetland habitats in the catchment, a “no net loss” of currently existing wetlands should be employed to ensure the continued provision of tangible benefits accruing from them for landowners and surrounding communities.
Table 16 Wetland cover in the Middle Rideau subwatershed and Barbers Creek catchment (Historic to 2014)
5. Stewardship and Protection
The RVCA and its partners are working to protect and enhance environmental conditions in the Middle Rideau Subwatershed. Figure 59 shows the location of all stewardship projects completed in the Barbers Creek catchment along with sites identified for potential shoreline restoration.
Rural Clean Water Projects
From 2003 to 2008, two well decommissionings and one well replacement were completed. Prior to 2003, two manure storage facilities, two livestock fencing projects and one milkhouse washwater treatment facility were completed. No projects were undertaken between 2009 and 2014. Total value of all eight projects is $119,772 with $51,500 of that amount funded through grant dollars from the RVCA.
Figure 59 Stewardship and restoration locations
Tree Planting Projects
Through the RVCA Butternut Recovery Program, 40 butternut trees were planted in the Barbers Creek catchment between 2009 and 2014, as part of efforts to introduce healthy seedlings from tolerant butternuts into various locations across Eastern Ontario.
Valley, Stream, Wetland and Hazard Land Regulation
The Barbers Creek catchment covers 48 square kilometres with 13 square kilometres (or 27 percent) of the drainage area being within the regulation limit of Ontario Regulation 174/06 (Figure 60), giving protection to wetland areas and river or stream valleys that are affected by flooding and erosion hazards.
Wetlands occupy 13.7 sq. km. (or 29 percent) of the catchment. Of these wetlands, 7.7 sq. km (or 56 percent) are designated as provincially significant and included within the RVCA regulation limit. This leaves the remaining 6.0 sq. km (or 44 percent) of wetlands in the catchment outside the regulated area limit.
Of the 60.9 kilometres of stream in the catchment, regulation limit mapping has been plotted along 23.5 kilometers of streams (representing 39 percent of all streams in the catchment). Some of these regulated watercourses (13.8 km or 23 percent of all streams) flow through regulated wetlands; the remaining 9.7 km (or 41 percent) of regulated streams are located outside of those wetlands. Plotting of the regulation limit on the remaining 37.5 km (or 61 percent) of streams requires identification of flood and erosion hazards and valley systems.
Within the regulation limit, “development” and “site alteration” require RVCA permission. The “alteration to waterways” provision of Ontario Regulation 174/06 applies to all watercourses.
Figure 60 RVCA regulation limits
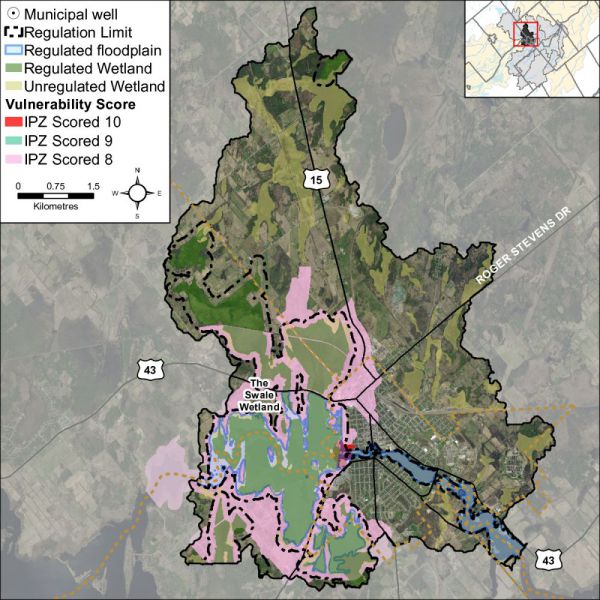
Vulnerable Drinking Water Areas
The Barbers Creek drainage catchment is considered to have a Highly Vulnerable Aquifer. This means that the nature of the overburden (thin soils, fractured bedrock) does not provide a high level of protection for the underlying groundwater making the aquifer more vulnerable to contaminants released on the surface. The Mississippi-Rideau Source Protection Plan includes policies that focus on the protection of groundwater region-wide due to the fact that most of the region, which encompasses the Mississippi and Rideau watersheds, is considered Highly Vulnerable Aquifer. For detailed maps and policies that have been developed to protect drinking water sources, please go to the Mississippi-Rideau Source Protection Region website at www.mrsourcewater.ca to view the Mississippi-Rideau Source Protection Plan.
6. Challenges/Issues
Water Quality
-
Surface water quality rating in Barbers Creek is “Fair” over two reporting periods (2003-2008 and 2009-2014) as determined by surface water chemistry data. Frequent exceedances of nutrients and E.coli as well as occasional exceedances of aluminum, copper and iron contributed to the rating
-
Instream biological water quality conditions at the Barbers Creek sample location range from “Very Poor” to “Good” from 2003 to 2014 (using a grading scheme developed by Ontario Conservation Authorities in Ontario for benthic invertebrates) with an overall benthic invertebrate water quality rating of “Poor” to “Good” determined for this period
Shorelines/Headwaters
-
The riparian buffer along Barbers Creek (30 m. wide strip along the shoreline of all lakes and streams) is comprised of wetland (46 percent), crop and pastureland (34 percent), woodland (17 percent), roads (two percent) and settlement areas (one percent) and (at 63 percent) is below the recommended target to maintain a minimum 30 metre wide, naturally vegetated buffer along at least 75 percent of the length of both sides of rivers, creeks and streams
-
Altered instream and riparian conditions exist along Barbers Creek and its tributaries
-
Emerald ash borer poses a significant threat to the ecology of the subwatershed, given the prominence of ash trees along shorelines and in riparian and wetland areas. Many tree stands are predominantly ash and with their anticipated loss, it is unclear what will replace them and the overall effect of their collective demise on the physical and natural functions/values they provide for erosion, water quality and fish and wildlife habitat protection
Land Cover
- The catchment contains 602 ha of unevaluated wetland (occupying 13 percent of its total area) that provides many important social, hydrological, biological and ecological functions/services. Although not under imminent threat from development activity, they do remain vulnerable to drainage and land clearing activities in the absence of any regulatory and planning controls that would otherwise protect them
7. Opportunities/Actions
Water Quality
- Investigate the source of possible pollutants along Barbers Creek and its tributaries and consider implementing measures to reduce nutrient and bacterial loadings
- Implement agricultural best management practices to address the elevated nutrient concentrations, high bacterial counts and occasional metal exceedances on Barbers Creek by restricting livestock access to the creek, limiting the use of fertilizers and pesticide applications and improving or maintaining a shoreline buffer
- Continue to protect Barbers Creek and its tributaries through implementation of municipal and agency land use planning and development policies and practices
- Continue to offer the suite of water quality improvement projects provided by the Rideau Valley Rural Clean Water Program to landowners
Shorelines/Headwaters
- Continue to promote the Rideau Valley Shoreline Naturalization and Tree Planting Programs to landowners
- RVCA and its partners (Township of Elizabethtown-Kitley, Village of Merrickville-Wolford) are to continue educating landowners about the value and importance of headwater drainage features, natural shorelines and waterfront property best management practices with respect to shoreline use and development, septic system installation and maintenance and shoreline vegetation retention and enhancement
- Protect the riparian buffer along the shoreline of Barbers Creek and other catchment streams (headwaters) during the development approvals process through adherence to and enforcement of municipal land-use policies and zoning standards
- Target shoreline restoration at sites identified in this report (shown as “Other riparian land cover” in Figure 16 and “Potential Riparian/Shoreline Restoration” in Figure 55) and explore other restoration and enhancement opportunities along Barbers Creek and its tributaries
Development
- Collectively work with approval authorities (Township of Elizabethtown-Kitley, Village of Merrickville-Wolford, Conservation Authority) to consistently implement current land use planning and development policies for water quality and shoreline protection adjacent to Barbers Creek and other catchment streams (e.g., a minimum 30 metre development setback from water
- Explore ways and means to more effectively enforce and implement conditions of land-use planning and development approval to achieve net environmental gains (particularly with respect to rehabilitating or protecting naturally vegetated shorelines and water quality)
- Municipalities and agencies are encouraged to strengthen natural heritage and water resources official plan policies and zoning provisions (water setbacks, frontage and naturalized shorelines and wetland protection) where deemed appropriate
- Utilize RVCA subwatershed and catchment reports to help develop/revise official plan policies to protect surface water resources and the natural environment (including woodlands, wetlands and shoreline cover)
- Consider establishing RVCA regulations limits to protect additional wetlands
Full Catchment Report
Middle Rideau Subwatershed Report 2015
BLACK CREEK CATCHMENT
The RVCA produces individual reports for ten catchments in the Middle Rideau subwatershed. Using data collected and analysed by the RVCA through its watershed monitoring and land cover classification programs, surface water quality conditions are reported for Black Creek along with a summary of environmental conditions for the surrounding countryside every six years.
This information is used to better understand the effects of human activity on our water resources, allows us to better track environmental change over time and helps focus watershed management actions where they are needed the most to help sustain the ecosystem services (cultural, aesthetic and recreational values; provisioning of food, fuel and clean water; regulation of erosion/natural hazard protection and water purification; supporting nutrient/water cycling and habitat provision) provided by the catchment’s lands and forests and waters (Millennium Ecosystem Assessment 2005).
The following pages of this report are a compilation of that work and contain information on surface water quality, riparian conditions, land cover, stewardship activity and hazard land and water resources protection.
1. Catchment Facts

General Geography
- The Rideau River flows through the heart of the Middle Rideau and is a focal point for residents and visitors to the area. It extends from the outlet of Lower Rideau Lake at Poonamalie (where there is one dam and one lock) to Burritts Rapids (where there is also a dam and lock), at which point it enters the Lower Rideau on its way to Rideau Falls. The Rideau River is also an integral part of the Rideau Canal National Historic Site of Canada and is a significant tourist attraction which draws boaters, cottagers, and campers to the area
- Smiths Falls, Merrickville and Burritts Rapids are the main settlements in the Middle Rideau subwatershed. Elsewhere, the Black Creek catchment is rural with agricultural land use and wetland
- Parks Canada staff manage water levels for recreational purposes along the Rideau Canal/Waterway that flows by the catchment, ensuring 1.5 metres of draft during the navigation season. In this managed system, water levels on the Rideau Canal are manipulated by operation of numerous dams. In the Middle Rideau subwatershed, Parks Canada staff operate 9 dam and lock complexes with 13 locks for a fall of 36.2 metres over 35.6 kilometres. Water levels are maintained as close as possible to set objectives through the May to October navigation season. The levels are lowered through the rest of October and into November and held at the winter levels until the spring freshet in late March or early April naturally increases inflows to the system. To reduce the impact of the higher flows in the spring, the amount of snow water equivalent, forecast rain, ice cover, flows and levels are assessed and the dams in the Middle Rideau reach are operated accordingly to quickly pass as much water as possible. In late April and early May, the dams are gradually closed and water levels are brought up to be ready, once again, for the navigation season.
Physical Geography
- All of the Black Creek catchment and the rest of the Middle Rideau subwatershed primarily resides within the Smith Falls Limestone Plain, which in this area, happens to consist of older Paleozoic quartz sandstone and dolostone of the March Formation. A small section of the Nepean sandstone, however, is also found along the northern boundary of the catchment. The bedrock in the southern part of the catchment is mainly overlain by a thin veneer of glacial sediment, referred to as ‘drift’ that is generally less than a metre in thickness;, although the landscape is also dotted with organic soils and some glacial till. The bedrock across the northern half of the catchment is mainly overlain by sandy glacial till and organic deposits associated with wetlands. Drumlins are found near the south eastern boundary of the catchment and a geologic fault likely transects the north western corner of the catchment
- Seventy-five percent of the catchment lies within the Township of Drummond/North Elmsley, 13 percent is in Beckwith Township and 12 percent is in the Township of Montague
- Black Creek catchment drainage area is 131 square kilometres and occupies about sixteen percent of the Middle Rideau subwatershed and three percent of the Rideau Valley watershed
Vulnerable Areas
- Lower reach of Black Creek is subject to a flooding hazard during the regional storm flood (the 100 year flood). Surveys and studies undertaken in accordance with provincial standards have determined that the 100 year flood elevation in this area ranges from 122.97 metres above mean sea level at the upper, mapped extent of the regulation limit at Poonamalie Side Road to 122.81 metres above mean sea level at its outlet to the Rideau River
- The Assessment Report developed under the Ontario Clean Water Act identifies the upper bedrock aquifer underlying all of the catchment area as a Highly Vulnerable Aquifer, although, where sediments are thicker in a local area, the vulnerability would be less. It also identifies the area of Nepean Sandstone found at the surface as a Significant Groundwater Recharge area along with a small part of the Village of Merrickville municipal Wellhead Protection Area being located in this catchment. Within a much more narrowly defined area along Poonamalie Road and Carroll Road is an area designated as an Intake Protection Zone to the Smiths Falls water supply and may be subject to Mississippi-Rideau Source Water Protection Zone policies
Development/Trends
- The catchment is dominated by the Township of Drummond/North Elmsley (D/NE). Those inland areas away from the Rideau River include mostly farms (livestock and pasturing) with less cropping than in other parts of the Township. Farming areas interspersed with large Provincially Significant Wetlands and other wooded areas. It should be noted that several hundred acres in the subwatershed has recently been developed with a total of four solar farms. Residential development is very scattered with single family residences and no major subdivisions. There are commercial and industrial uses along County Road 43, including the GIM salvage yard; however, in the larger catchment, other non- residential and non-agricultural uses are small and typically oriented locally and to the farming sector and no significant active recreational or tourism oriented area exists
- The main watercourse through the catchment is Black Creek. As it rarely exceeds 20 feet in width (and has been known to be essentially dry in extremely dry years), it is not a focus of development the way a larger waterbody would be. Impacts of farming on the watercourse are much the same as they are in any other setting
- Residential development in D/NE is generally very scattered with single family residences and no major subdivisions. Along County Road 43 to the west of Smiths Falls, there are some commercial and industrial uses (including GIM salvage yard) and a greater concentration of single family residences. Elsewhere, other non-residential and non-agricultural uses are small and typically oriented locally to the farming sector. No significant, active recreational or tourism oriented areas exist, other than the un-operational Donnybrooke site
- In recent years there has been limited development pressure in the general area (other than the four solar farms), with few severances and no subdivisions. There is a modest amount of development and more often redevelopment of commercial and industrial uses along Highway 43. It is unknown whether there will be a change in development pressure in coming years. For the most part, development in D/NE tends to follow along the Highway 7 corridor and closer to Perth, however if Smiths Falls were to grow there would likely be a spill-over. This area does not have easy or quick access to Ottawa
- Within the Beckwith Township and the Township of Montague areas of the catchment, development is comprised mainly of scattered single family residences along with farms. Gillies Corners is the main settlement in this area of the catchment, located along the Perth Road at its northeastern edge
Conditions at a Glance
Water Quality
- Surface chemistry water quality rating in Black Creek is “Fair” over two reporting periods (2003-2008 and 2009-2014). Elevated bacterial counts and nutrient concentrations from inflows of nutrients (from private septic systems, agricultural and residential surface water runoff) are a feature of Black Creek. Decreased nutrient and bacterial counts are needed to improve the overall health of the creek
- Instream biological water quality conditions at the Black Creek sample location range from “Poor” to “Fair” from 2003 to 2014 (using a grading scheme developed by Ontario Conservation Authorities in Ontario for benthic invertebrates) with an overall benthic invertebrate water quality rating of “Poor” determined for this period
Instream and Riparian
- Overall instream and riparian condition for the Black creek catchment as assessed by the stream characterization and headwater drainage feature assessment programs show that Black Creek and its tributaries are in generally good condition. The majority of the system has low erosion levels, a healthy riparian corridor with good instream diversity of aquatic habitat. The headwater areas in the upper catchment are dominated by wetland habitat and as you move downstream the creek is classified as a municipal drain. There are opportunities along some of the drainage features and smaller tributaries to enhance riparian habitat conditions
- The Black Creek catchment has 26 species of recreational and bait fish and is classified as having a warm/cool water thermal guild that supports the Black Creek/Rideau River fishery
- In the Black Creek catchment, the riparian buffer (30 m. wide strip along the shoreline of all lakes and streams) is comprised of wetland (55 percent), crop and pastureland (28 percent), woodland (12 percent), roads (three percent) and settlement areas (two percent)
Land Cover
- Dominant land cover is crop and pastureland (35 percent) and wetland (35 percent) followed by woodland (23 percent), settlement areas (five percent) and roads (two percent). From 2008 to 2014, there was an overall change of 190 hectares (from one land cover class to another). Within the Black Creek catchment, change is primarily associated with crop and pastureland being converted to settlement (solar farms) and woodland to settlement (solar farms)
- Woodland cover in the catchment has decreased by two hectares between 2008 and 2014 and interior forest habitat has increased by 30 hectares
- Wetland cover has decreased by 16 percent (2181 ha) from pre-settlement times to the present and now occupies 36 percent of the catchment area
Other
- There are approximately 675 in-use water wells with provincial records in this catchment. While most water wells are used for domestic water supply, in this catchment, many are used for agricultural purposes and several are used as commercial, public and municipal water supplies or monitoring wells
- There are no active Permits to Take Water, nor are there any open or closed bedrock quarries in the catchment. There are five sand and gravel pit licenses in the catchment but no primary sand and gravel aggregate resource
- An Environmental Compliance Approval has been issued for a renewable energy system in the vicinity of Armstrong and Glenview Roads
Catchment Care
- Thirty-seven stewardship projects have been completed with assistance from the RVCA’s Rural Clean Water and Tree Planting Programs (see Section 5 of this report for details)
- Black Creek surface chemistry water quality has been monitored by the RVCA through its Baseline Monitoring Program since 2003. The surface chemistry water quality at site COC-02 is monitored once a month from April to November
- RVCA has been collecting benthic invertebrates in Black Creek at the Poonamalie Road site since 2003
- RVCA conducted a fish survey along Black Creek in 2014
- RVCA completed a stream characterization survey on Black Creek in 2014, working upstream to the headwaters from the mouth of the creek where it empties into the Rideau River taking measurements and recording observations on instream habitat, bank stability, other attributes and preparing a temperature profile
- RVCA completed 30 headwater drainage feature assessments at road crossings in the Black Creek catchment in 2014. This protocol measures zero and first order headwater drainage features and is a rapid assessment method characterizing the amount of water, sediment transport, and storage capacity within headwater drainage features
- A watershed model developed by the RVCA in 2009 was used to study the hydrologic function of wetlands in the Rideau Valley Watershed, including those found in the Black Creek catchment
- The Townships of Beckwith, Drummond/North Elmsley and Montague have land use planning policies and zoning provisions - on water setbacks, frontage and naturalized shorelines and wetland protection - and in some instances use site plan control to implement these policies and provisions. Together with RVCA, the Townships work with landowners on a case by case basis to enable new development while ensuring the scale is suitable on the lot, impacts on neighbours are minimized and development maximizes the watercourse setback
- Development in and adjacent to the Provincially Significant Wetlands in the catchment (Black Creek, Port Elmsley No.2) are subject to Ontario Regulation 174-06 (entitled “Development, Interference with Wetlands and Alterations to Shorelines and Watercourses”) that protects the hydrologic function of the wetland and also protects landowners and their property from natural hazards (flooding, fluctuating water table, unstable soils) associated with them
2. Surface Water Quality Conditions
Surface water quality conditions in the Black Creek catchment are monitored by the Rideau Valley Conservation Authority’s (RVCA) Baseline Water Quality Monitoring Program. The Baseline Water Quality Program focuses on streams; data is collected for 22 parameters including nutrients (total phosphorus, total Kjeldahl nitrogen and ammonia), E. coli, metals (like aluminum and copper) and additional chemical/physical parameters (such as alkalinity, chlorides, pH and total suspended solids). Figure 1 shows the location of the monitoring site in the catchment.
Figure 1 Water quality monitoring site on Black Creek
Black Creek Water Quality
Water Quality Rating
The water quality rating for the Black Creek (COC-02) is “Fair” (Table 1) as determined by the Canadian Council of Ministers of the Environment (CCME) Water Quality Index and is largely influenced by high nutrient concentrations, metals and high bacterial counts. A "Fair" rating indicates that water quality is usually protected but is occasionally threatened or impaired; conditions sometimes depart from natural or desirable levels. Each parameter is evaluated against established guidelines to determine water quality conditions. Those parameters that frequently exceed guidelines are presented below. Analysis of the data has been broken into two periods; 2003 to 2008 and 2009 to 2014 to examine if conditions have changed between these periods. Table 1 shows the overall rating for the monitored surface water quality sites within the Black Creek catchment and Table 2 outlines the Water Quality Index (WQI) scores and their corresponding ratings.
Table 1 Water Quality Index ratings for the Otter Creek catchment
Table 2 Water Quality Index ratings and corresponding index scores (RVCA terminology, original WQI category names in bracket)
Nutrients
Total phosphorus (TP) is used as a primary indicator of excessive nutrient loading and may contribute to abundant aquatic vegetation growth and depleted dissolved oxygen levels. The Provincial Water Quality Objective (PWQO) is used as the TP Guideline and states that in streams concentrations greater than 0.030 mg/l indicate an excessive amount of TP.
Total Kjeldahl nitrogen (TKN) and ammonia (NH3) are used as secondary indicators of nutrient loadings. RVCA uses a guideline of 0.500 mg/l to assess TKN[1] and the PWQO of 0.020 mg/l to assess NH3 concentrations in Barbers Creek.
Tables 3, 4 and 5 summarize average nutrient concentrations at monitored sites within the Black Creek catchment and show the proportion of results that meet the guidelines.
Table 3 Summary of total phosphorus results for Black Creek, 2003-2008 and 2009-2014. Highlighted values indicate average concentrations exceed the guideline
Table 4 Summary of total Kjeldahl nitrogen results for Black Creek from 2003-2008 and 2009-2014. Highlighted values indicate average concentrations exceed the guideline
Table 5 Summary of ammonia results for Black Creek from 2003-2008 and 2009-2014. Highlighted values indicate average concentrations exceed the guideline
The majority of samples at site COC-02 were above the TP guideline for both time periods (Figures 2 and 3), 38 percent of samples were below the guideline in the 2003–2008 period, this declined to 35 percent of samples in the 2009–2014 period. Average TP concentration decreased from 0.037 mg/l (2003–2008) to 0.033 mg/l (2009–2014).
Figure 2 Total phosphorous concentrations in Black Creek, 2003-2008
Figure 3 Total phosphorous concentrations in Black Creek, 2009-2014
All of the TKN results exceeded the guideline for both monitoring periods (2003-2008 and 2009-2014). The average concentration from 2003-2008 in Black Creek was 1.244 mg/l (Figure 4), this decreased to .994 mg/l (Figure 5) from 2009-2014.
Figure 4 Total Kjeldahl nitrogen concentrations in Black Creek, 2003-2008
Figure 5 Total Kjeldahl nitrogen concentrations in Black Creek, 2009-2014
In the 2003-2008 reporting period a majority of NH3 results were below the guideline with an average concentration of 0.017 mg/l (Figure 6). The percentage of results below the guideline decreased from 67 percent in 2003-2008 to 10 percent. The average concentration in 2009-2014 increased to 0.032 mg/l (Figure 7).
Figure 6 Ammonia concentrations in Black Creek, 2003-2008
Figure 7 Ammonia concentrations in Black Creek, 2009-2014
Summary
The data shows that nutrient enrichment continues to be a feature of Black Creek. Water quality guidelines for TP, TKN and NH3 are often exceeded at the monitored site on Black Creek. The frequent elevated TKN concentrations may be influenced by organic matter held by wetland areas found upstream in the Middle Rideau Subwatershed, resulting in naturally high concentrations of organic nitrogen. High nutrient concentrations can help stimulate the growth of algae blooms and other aquatic vegetation in a waterbody and deplete oxygen levels as the vegetation dies off.
E. Coli
E. coli is used as an indicator of bacterial pollution from human or animal waste; in elevated concentrations it can pose a risk to human health. The PWQO of 100 colony forming units/100 millilitres (CFU/100 ml) is used. E. coli counts greater than this guideline indicate that bacterial contamination may be a problem within a waterbody.
Table 6 summarizes the geometric mean[2] for the monitored site on Black Creek and shows the proportion of samples that meet the E. coli guideline of 100 CFU/100 ml. The results of the geometric mean with respect to the guideline for the two periods, 2003-2008 and 2009- 2014, are shown in Figures 8 and 9 respectively.
Table 6 Summary of E. coli results for Black Creek, 2003-2008 and 2009-2014. Highlighted values indicated average concentrations have exceeded the guideline.
E. coli results at site COC-02 indicate bacterial counts are frequently above the E. coli guideline. The proportion of samples below the guideline decreased from 63 percent (Figure 8) to 47 percent (Figure 9). E.coli counts increased between the two monitoring periods (2003-2008 and 2009-2014) with a geometric mean of 66 CFU/100ml to 104 CFU/100ml (Table 6).
Figure 8 E.coli concentrations in Black Creek, 2003-2008
Figure 9 E.coli concentrations in Black Creek, 2009-2014
Summary
Bacterial contamination continues to be a concern at site COC-02 in Black Creek. E.coli counts have increased between the two monitoring periods (2003-2008 and 2009-2014), with the geometric mean being above the PWQO for the 2009-20014 reporting period. Properly maintaining septic systems, enhancing shoreline buffers and restricting cattle access can help to improve E.coli levels in Black Creek.
Metals
Of the metals routinely monitored in Black Creek, aluminum (Al), copper (Cu) and iron (Fe) occasionally reported concentrations above their respective PWQOs. In elevated concentrations, these metals can have toxic effects on sensitive aquatic species. Tables 7, 8 and 9 summarize metal concentrations at the monitored site and show the proportion of samples that meet guidelines. Figures 10 to 15 show metal concentrations with respect to the guidelines for the two periods of interest, 2003–2008 and 2009–2014. For Al the PWQO is 0.075 mg/l, Cu it is 0.005 mg/l and for Fe it is 0.300 mg/l.
Table 7 Summary of Aluminum concentrations in Black Creek, 2003-2008 and 2009-2014. Highlighted values indicate average concentrations that exceed the guideline.
Table 8 Summary of Copper concentrations in Black Creek, 2003-2008 and 2009-2014
Table 9 Summary of Iron Concentrations in Black Creek, 2003-2008 and 2009-2014. Highlighted values indicate average concentrations that exceed the guideline.
Results from COC-02 shows that Al concentrations had some exceedances with 22 percent of samples below the guideline in the 2003-2008 period (Figure 10). This improved to 69 percent of samples in the 2009-2014 period (Figure 11). The average concentration of Al was 0.128 mg/l from 2003-2008 which exceeds the guideline. From 2009-2014 the average concentration improved to 0.060 mg/l which is below the guideline.
Figure 10 Average aluminum concentrations in Black Creek, 2003-2008
Figure 11 Average aluminum concentrations in Black Creek, 2009-2014
Copper concentrations occasionally exceeded the PWQO, with 89% of samples below the guideline in 2003-2008 (Figure 12). This decreased to 79% of samples being below the guideline in 2009-2014 (Figure 13). The average concentration of Cu marginally decreased during the two reporting periods from 0.003 mg/l to 0.002 mg/l (Table 8).
Figure 12 Average copper concentration in Black Creek, 2003-2008
Figure 13 Average copper concentrations in Black Creek, 2009-2014
Iron concentrations also surpassed the PWQO guideline. The proportion of samples below the guideline increased from 52 percent to 79 percent (Figures 14 and 15). The average concentration of Fe in 2003-2008 reporting period was 0.309 mg/l which is above the guideline. Between 2009-2014 Fe concentrations decreased below the guideline to an average of 0.130mg/L (Table 9).
Figure 14 Average Iron concentrations in Black Creek, 2003-2008
Figure 15 Average Iron concentrations in Black Creek, 2009-2014
Summary
Overall, a general decline in metal concentrations was observed between the two periods of interest, with the exception of copper which slightly increased. Efforts should continue to be made to identify pollution sources and implement best management practices to reduce any inputs such as runoff, metal alloys, fungicides and pesticides to improve overall stream health and lessen downstream impacts.
[1] No Ontario guideline for TKN is presently available; however, waters not influenced by excessive organic inputs typically range from 0.100 to 0.500 mg/l, Environment Canada (1979) Water Quality Sourcebook, A Guide to Water Quality Parameters, Inland Waters Directorate, Water Quality Branch, Ottawa, Canada
[2] A type of mean or average, which indicates the central tendency or typical value of a set of numbers by using the product of their values (as opposed to the arithmetic mean which uses their sum). It is often used to summarize a variable that varies over several orders of magnitude, such as E. coli counts.
3. Riparian Conditions
Shoreline Buffer Land Cover Evaluation
The riparian or shoreline zone is that special area where the land meets the water. Well-vegetated shorelines are critically important in protecting water quality and creating healthy aquatic habitats, lakes and rivers. Natural shorelines intercept sediments and contaminants that could impact water quality conditions and harm fish habitat in streams. Well established buffers protect the banks against erosion, improve habitat for fish by shading and cooling the water and provide protection for birds and other wildlife that feed and rear young near water. A recommended target (from Environment Canada’s Guideline: How Much Habitat is Enough?) is to maintain a minimum 30 metre wide vegetated buffer along at least 75 percent of the length of both sides of rivers, creeks and streams.
Figure 16 shows the extent of the naturally vegetated riparian zone along a 30 metre wide strip of shoreline of Black Creek and its tributaries. This information is derived from a dataset developed by the RVCA’s Land Cover Classification Program through heads-up digitization of 20cm DRAPE ortho-imagery at a 1:4000 scale, which details the catchment landscape using 10 land cover classes.
Figure 16 Natural and other riparian land cover in the Black Creek catchment
This analysis shows that the riparian buffer in the Black Creek catchment is comprised of wetland (55 percent), crop and pastureland (28 percent), woodland (12 percent), roads (three percent) and settlement areas (two percent). Additional statistics for the Black Creek catchment are presented in Table 10 and show that there has been very little change in shoreline cover from 2008 to 2014.
Table 10 Riparian land cover (2008 vs. 2014) in the Black Creek catchment
Black Creek Overbank Zone
Riparian Buffer Width Evaluation
Figure 17 demonstrates the buffer conditions of the left and right banks separately. Black Creek had a buffer of greater than 30 meters along 100 percent of the right bank and 97 percent of the left bank.
Figure 17 Riparian Buffer Evaluation along Black Creek
Adjacent Land Use
The RVCA’s Stream Characterization Program identifies eight different land uses beside Black Creek (Figure 18). Surrounding land use is considered from the beginning to end of the survey section (100m) and up to 100m on each side of the creek. Land use outside of this area is not considered for the surveys but is nonetheless part of the subwatershed and will influence the creek. Natural areas made up 92 percent of the stream, characterized by wetlands, forest, scrubland and meadow. The remaining land use consisted of active agriculture and infrastructure in the form of road crossings.
Figure 18 Land Use along Black Creek
Black Creek Shoreline Zone
Instream Erosion
Erosion is a normal, important stream process and may not affect actual bank stability; however, excessive erosion and deposition of sediment within a stream can have a detrimental effect on important fish and wildlife habitat. Poor bank stability can greatly contribute to the amount of sediment carried in a waterbody as well as loss of bank vegetation due to bank failure, resulting in trees falling into the stream and the potential to impact instream migration. Figure 19 shows low to moderate levels of erosion observed along Black Creek.
Figure 19 Erosion along Black Creek
Undercut Stream Banks
Undercut banks are a normal and natural part of stream function and can provide excellent refuge areas for fish. Figure 20 shows that Black Creek had low to moderate levels of undercut banks.
Figure 20 Undercut stream banks along Black Creek
Stream Shading
Grasses, shrubs and trees all contribute towards shading a stream. Shade is important in moderating stream temperature, contributing to food supply and helping with nutrient reduction within a stream. Figure 21 shows variable stream shading conditions ranging from low levels to high levels along Black Creek.
Figure 21 Stream shading along Black Creek
Instream Woody Debris
Figure 22 shows that the majority of Black Creek had low to moderate levels of instream woody debris in the form of branches and trees. Instream woody debris is important for fish and benthic invertebrate habitat, by providing refuge and feeding areas.
Figure 22 Instream woody debris along Black Creek
Overhanging Trees and Branches
Figure 23 shows low to high levels of overhanging branches and trees along Black Creek. Overhanging branches and trees provide a food source, nutrients and shade which helps to moderate instream water temperatures.
Figure 23 Overhanging trees and branches along Black Creek
Anthropogenic Alterations
Figure 24 shows 90 percent of Black Creek remains “unaltered” with no anthropogenic alterations. Ten percent of Black Creek was classified as natural with minor anthropogenic changes in the form of road crossings.
Figure 24 Anthropogenic alterations along Black Creek
Black Creek Instream Aquatic Habitat
Benthic Invertebrates
Freshwater benthic invertebrates are animals without backbones that live on the stream bottom and include crustaceans such as crayfish, molluscs and immature forms of aquatic insects. Benthos represent an extremely diverse group of aquatic animals and exhibit wide ranges of responses to stressors such as organic pollutants, sediments and toxicants, which allows scientists to use them as bioindicators. As part of the Ontario Benthic Biomonitoring Network (OBBN), the RVCA has been collecting benthic invertebrates at the Poonamalie Road site on Black Creek since 2003. Monitoring data is analyzed for each sample site and the results are presented using the Family Biotic Index, Family Richness and percent Ephemeroptera, Plecoptera and Trichoptera.
The Hilsenhoff Family Biotic Index (FBI) is an indicator of organic and nutrient pollution and provides an estimate of water quality conditions for each site using established pollution tolerance values for benthic invertebrates. FBI results for Black Creek are separated by reporting period 2003 to 2008 and 2009 to 2014. “Poor” to “Fair” water quality conditions being observed at the Black Creek sample location for the period from 2003 to 2014 (Fig.25) using a grading scheme developed by Conservation Authorities in Ontario for benthic invertebrates.
Figure 25 Hilsenhoff Family Biotic Index on Black Creek
Family Richness measures the health of the community through its diversity and increases with increasing habitat diversity suitability and healthy water quality conditions. Family Richness is equivalent to the total number of benthic invertebrate families found within a sample. Black Creek is reported to have “Fair” to “Good” family richness (Fig.26).
Figure 26 Family Richness in Black Creek
Ephemeroptera (Mayflies), Plecoptera (Stoneflies), and Trichoptera (Caddisflies) are species considered to be very sensitive to poor water quality conditions. High abundance of these organisms is generally an indication of good water quality conditions at a sample location. The community structure is dominated by species that are not sensitive to poor water quality conditions. As a result, the EPT indicates that Black Creek is reported to have “Poor” to “Fair” water quality (Fig.27) from 2003 to 2014.
Figure 27 EPT in Black Creek
Conclusion
Overall Black Creek aquatic habitat conditions from a benthic invertebrate perspective range from “Poor” to "Fair" from 2003 to 2014.
Habitat Complexity
Streams are naturally meandering systems and move over time; there are varying degrees of habitat complexity, depending on the creek. Examples of habitat complexity include variable habitat types such as pools and riffles as well as substrate variability and woody debris structure. A high percentage of habitat complexity (heterogeneity) typically increases the biodiversity of aquatic organisms within a system. Fifty nine percent of Black Creek was considered heterogeneous, as shown in Figure 28.
Figure 28 Habitat complexity along Black Creek
Instream Substrate
Diverse substrate is important for fish and benthic invertebrate habitat because some species have specific substrate requirements and for example will only reproduce on certain types of substrate. Figure 29 shows that 28 percent of the substrate observed on Black Creek was dominated by cobble. Overall substrate conditions were highly variable along Black Creek. Figure 30 shows the dominant substrate type observed for each section surveyed along Black Creek.
Figure 29 Instream substrate along Black Creek
Figure 30 shows the dominant substrate type along Black Creek
Cobble and Boulder Habitat
Boulders create instream cover and back eddies for large fish to hide and/or rest out of the current. Cobble provides important spawning habitat for certain fish species like walleye and various shiner species who are an important food source for larger fish. Cobble can also provide habitat conditions for benthic invertebrates that are a key food source for many fish and wildlife species. Figure 31 shows where cobble and boulder substrate are found in Black Creek.
Figure 31 Instream substrate cobble and boulder along Black Creek
Instream Morphology
Pools and riffles are important habitat features for fish. Riffles are areas of agitated water and they contribute higher dissolved oxygen to the stream and act as spawning substrate for some species of fish, such as walleye. Pools provide shelter for fish and can be refuge pools in the summer if water levels drop and water temperature in the creek increases. Pools also provide important over wintering areas for fish. Runs are usually moderately shallow, with unagitated surfaces of water and areas where the thalweg (deepest part of the channel) is in the center of the channel. Figure 32 shows that Black Creek is fairly uniform; 88 percent consists of runs, 7 percent riffles and 5 percent pools. Figure 33 shows where riffle habitat was observed along Black Creek.
Figure 32 Instream morphology along Black Creek
Figure 33 Riffle habitat locations along Black Creek
Vegetation Type
Instream vegetation provides a variety of functions and is a critical component of the aquatic ecosystem. For example emergent plants along the shoreline can provide shoreline protection from wave action and important rearing habitat for species of waterfowl. Submerged plants provide habitat for fish to find shelter from predator fish while they feed. Floating plants such as water lilies shade the water and can keep temperatures cool while reducing algae growth. The dominant vegetation type recorded at thirty percent consisted of submerged plants. Black Creek had high levels of diversity for instream vegetation. Figure 34 depicts the plant community structure for Black Creek. Figure 35 shows the dominant vegetation type observed for each section surveyed along Black Creek.
Figure 34 Vegetation type along Black Creek
Figure 35 Dominant vegetation type along Black Creek
Instream Vegetation Abundance
Instream vegetation is an important factor for a healthy stream ecosystem. Vegetation helps to remove contaminants from the water, contributes oxygen to the stream, and provides habitat for fish and wildlife. Too much vegetation can also be detrimental. Figure 36 demonstrates that Black Creek had sections dominated by common and normal low levels of instream vegetation for fifty two percent of its length.
Figure 36 Instream vegetation abundance along Black Creek
Invasive Species
Invasive species can have major implications on streams and species diversity. Invasive species are one of the largest threats to ecosystems throughout Ontario and can out compete native species, having negative effects on local wildlife, fish and plant populations. One hundred percent of the sections surveyed along Black Creek had invasive species (Figure 37). The invasive species observed in Black Creek were European frogbit, purple loosestrife, glossy and common buckthorn, banded mystery snail, curly leafed pondweed, flowering rush, bull thistle, honey suckle, wild parsnip and Manitoba maple. Figure 38 shows the frequency of the invasive species observed along Black Creek.
Figure 37 Invasive species along Black Creek
Figure 38 Invasive species observed along Black Creek
Black Creek Water Chemistry
During the stream characterization survey, a YSI probe is used to collect water chemistry information. Dissolved oxygen, conductivity and pH are measured at the start and end of each section.
RVCA staff using a water chemistry probe on Black Creek
Dissolved Oxygen
Dissolved oxygen is a measure of the amount of oxygen dissolved in water. The Canadian Environmental Quality Guidelines of the Canadian Council of Ministers of the Environment (CCME) suggest that for the protection of aquatic life the lowest acceptable dissolved oxygen concentration should be 6 mg/L for warmwater biota and 9.5 mg/L for coldwater biota (CCME, 1999). Figure 39 shows that the dissolved oxygen in Black Creek was within the threshold for warmwater biota in most reaches of the system, however areas in the headwaters were below the warmwater threshold. The average dissolved oxygen levels observed within the main stem of Black Creek was 6.02mg/L which is within the recommended levels for warmwater biota.
Figure 39 Dissolved oxygen ranges in Black Creek
Conductivity
Conductivity in streams is primarily influenced by the geology of the surrounding environment, but can vary drastically as a function of surface water runoff. Currently there are no CCME guideline standards for stream conductivity, however readings which are outside the normal range observed within the system are often an indication of unmitigated discharge and/or stormwater input. The average conductivity observed within the main stem of Black Creek was 328 µs/cm. Figure 40 shows that the conductivity readings for Black Creek.
Figure 40 Specific conductivity ranges in Black Creek
pH
Based on the PWQO for pH, a range of 6.5 to 8.5 should be maintained for the protection of aquatic life. Average pH values for Black Creek averaged 7.5 thereby meeting the provincial standard (Figure 41).
Figure 41 pH ranges in Black Creek
Thermal Regime
Many factors can influence fluctuations in stream temperature, including springs, tributaries, precipitation runoff, discharge pipes and stream shading from riparian vegetation. Water temperature is used along with the maximum air temperature (using the Stoneman and Jones method) to classify a watercourse as either warm water, cool water or cold water. Analysis of the data collected indicates that Black Creek is classified as a cool - warm water system with warm water reaches. Figure 42 shows the thermal sampling locations.
Figure 42 Temperature loggers in Black Creek

Figure 43 Temperature logger data for two sites on Black Creek.
Each point on the graph represents a temperature that meets the following criteria:
- Sampling dates between July 1st and September 7th
- Sampling date is preceded by two consecutive days above 24.5 °C, with no rain
- Water temperatures are collected at 4pm
- Air temperature is recorded as the max temperature for that day
Groundwater
Groundwater discharge areas can influence stream temperature, contribute nutrients, and provide important stream habitat for fish and other biota. During stream surveys, indicators of groundwater discharge are noted when observed. Indicators include: springs/seeps, watercress, iron staining, significant temperature change and rainbow mineral film. Figure 44 shows areas where one or more of the above groundwater indicators were observed during stream surveys and headwater assessments.
Figure 44 Groundwater indicators observed
Headwaters Drainage Features Assessment
The RVCA Stream Characterization program assessed Headwater Drainage Features for the Middle Rideau subwatershed in 2014. This protocol measures zero, first and second order headwater drainage features (HDF). It is a rapid assessment method characterizing the amount of water, sediment transport, and storage capacity within headwater drainage features (HDF). RVCA is working with other Conservation Authorities and the Ministry of Natural Resources and Forestry to implement the protocol with the goal of providing standard datasets to support science development and monitoring of headwater drainage features. An HDF is a depression in the land that conveys surface flow. Additionally, this module provides a means of characterizing the connectivity, form and unique features associated with each HDF (OSAP Protocol, 2013). In 2014 the program sampled 30 sites at road crossings in the Black Creek catchment area (Figure 45).

Figure 45 Locations of the headwater sampling sites in the Black Creek catchment
Spring conditions at a headwater sampling site on Concession Road 5B in the Black Creek catchment
Spring conditions at a headwater sampling site on Carroll Road in the Black Creek catchment
Feature Type
The headwater sampling protocol assesses the feature type in order to understand the function of each feature. The evaluation includes the following classifications: defined natural channel, channelized or constrained, multi-thread, no defined feature, tiled, wetland, swale, roadside ditch and pond outlet. By assessing the values associated with the headwater drainage features in the catchment area we can understand the ecosystem services that they provide to the watershed in the form of hydrology, sediment transport, and aquatic and terrestrial functions. The Black Creek catchment is dominated by natural channel and wetland headwater drainage features. However, there were several features classified as channelized, while there were three features that ran along the road. Two features were classified as not having a defined channel. Figure 46 shows the feature type of the primary feature at the sampling locations.
Figure 46 Headwater feature types in the Black Creek catchment
Feature Channel Modifications
Channel modifications were assessed at each headwater drainage feature sampling location. Modifications include channelization, dredging, hardening and realignments. The sampling locations for the Black Creek catchment were classified with a variety of channel modifications. Many of the features had no channel modifications, however several were classified as having mixed modifications or had been recently dredged/cleaned out. Figure 47 shows the channel modifications observed at the sampling locations for Black Creek.
Figure 47 Headwater feature channel modifications in the Black Creek catchment
Headwater Feature Vegetation
Headwater feature vegetation evaluates the type of vegetation that is found within the drainage feature. The type of vegetated within the channel influences the aquatic and terrestrial ecosystem values that the feature provides. For some types of headwater features the vegetation within the feature plays a very important role in flow and sediment movement and provides wildlife habitat. The following classifications are evaluated no vegetation, lawn, wetland, meadow, scrubland and forest. Figure 48 depicts the dominant vegetation observed at the sampled headwater sites in the Black Creek catchment.
Figure 48 Headwater feature vegetation types in the Black Creek catchment
Headwater Feature Riparian Vegetation
Headwater riparian vegetation evaluates the type of vegetation that is found along the adjacent lands of a headwater drainage feature. The type of vegetation within the riparian corridor influences the aquatic and terrestrial ecosystem values that the feature provides to the watershed. The majority of the sample locations in Black Creek were dominated by natural vegetation in the form of scrubland, forest and wetland vegetation. Figure 49 depicts the type of riparian vegetation observed at the sampled headwater sites in the Black Creek catchment.
Figure 49 Headwater feature riparian vegetation types in the Black Creek catchment
Headwater Feature Sediment Deposition
Assessing the amount of recent sediment deposited in a channel provides an index of the degree to which the feature could be transporting sediment to downstream reaches (OSAP, 2013). Evidence of excessive sediment deposition might indicate the requirement to follow up with more detailed targeted assessments upstream of the site location to identify potential best management practices to be implemented. Conditions ranged from no deposition observed to a site with substantial deposition recorded. Overall most sites had minimal to moderate levels of sediment deposition. Figure 50 depicts the degree of sediment deposition observed at the sampled headwater sites in the Black Creek catchment.
Figure 50 Headwater feature sediment deposition in the Black Creek catchment
Headwater Feature Upstream Roughness
Feature roughness will provide a measure of the amount of materials within the bankfull channel that could slow down the velocity of water flowing within the headwater feature (OSAP, 2013). Materials on the channel bottom that provide roughness include vegetation, woody debris and boulders/cobble substrates. Roughness can provide benefits in mitigating downstream erosion on the headwater drainage feature and the receiving watercourse by reducing velocities. Roughness also provides important habitat conditions to aquatic organisms. Many of the sample locations in the Black Creek catchment area had extreme to moderate levels of feature roughness. Figure 51 shows the feature roughness conditions at the sampling locations in the Black Creek catchment.
Figure 51 Headwater feature roughness in the Black Creek catchment
Fish Community
The Black Creek catchment is classified as a mixed community of warm and cool water recreational and baitfish fishery with 26 species observed. Table 11 lists the species observed in the catchment (Source: MNR/RVCA). Figure 52 shows the fish sampling locations for Black Creek.
Figure 52 Black Creek fish community
Table 11 Fish species observed in Black Creek
Fish sampling location on Black Creek where a fyke net was set
Migratory Obstructions
It is important to know locations of migratory obstructions because these can prevent fish from accessing important spawning and rearing habitat. Migratory obstructions can be natural or manmade, and they can be permanent or seasonal. Figure 53 shows that the headwaters and the main stem of Black Creek had a beaver dam, perched culvert and a grade barrier at the time of the survey in 2014.
Figure 53 Migratory obstructions along Black Creek
Riparian Restoration
Figure 54 depicts the locations where various riparian restoration activities can be implemented as a result of observations made during the stream survey and headwater drainage feature assessments. The surveys identified one riparian planting opportunity on a headwater feature.
Figure 54 Riparian restoration opportunities along Black Creek
4. Land Cover
Land cover and any change in coverage that has occurred over a six year period is summarized for the Black Creek catchment using spatially continuous vector data representing the catchment during the spring of 2008 and 2014. This dataset was developed by the RVCA through heads-up digitization of 20cm DRAPE ortho-imagery at a 1:4000 scale and details the surrounding landscape using 10 land cover classes.
As shown in Table 12, the dominant land cover types in the catchment through 2008 and 2014 were crop and pastureland and wetland followed by woodland.
Table 12 Land cover (2008 vs. 2014) in the Black Creek catchment
* Does not include treed swamps ** Includes treed swamps
From 2008 to 2014, there was an overall change of 190 hectares (from one land cover class to another). Change within the Black Creek catchment is primarily associated with ‘crop and pasture’ being converted to ‘settlement’ and ‘woodland’ to ‘settlement’. These areas are largely associated with newly constructed solar farms which are identified as the four large pink polygons in Figure 55.
Figure 55 Dominant land cover change in the Black Creek catchment (2014)
Table 13 shows the type of land cover change that has taken place between land cover classes/types from 2008 to 2014.
Overall, the net area of crop and pasture change (loss) is relatively small at 140 hectares relative to the remaining area of crop and pasture in the catchment (as of 2014). Similarly, the net area of woodland change (loss) is very small at 29 hectares relative to the remaining area of woodland in the catchment (as of 2014).
Table 13 Land cover change in the Black Creek catchment (2008 to 2014)
Woodland Cover
In the Environment Canada Guideline (Third Edition) entitled “How Much Habitat Is Enough?” (hereafter referred to as the “Guideline”) the opening narrative under the Forest Habitat Guidelines section states that prior to European settlement, forest was the predominant habitat in the Mixedwood Plains ecozone. The remnants of this once vast forest now exist in a fragmented state in many areas (including the Rideau Valley watershed) with woodland patches of various sizes distributed across the settled landscape along with higher levels of forest cover associated with features such as the Frontenac Axis (within the on-Shield areas of the Rideau Lakes and Tay River subwatersheds). The forest legacy, in terms of the many types of wildlife species found, overall species richness, ecological functions provided and ecosystem complexity is still evident in the patches and regional forest matrices (found in the Middle Rideau subwatershed and elsewhere in the Rideau Valley watershed). These ecological features are in addition to other influences which forests have on water quality and stream hydrology including reducing soil erosion, producing oxygen, storing carbon along with many other ecological services that are essential not only for wildlife but for human well-being.
The Guideline also notes that forests provide a great many habitat niches that are in turn occupied by a great diversity of plant and animal species. They provide food, water and shelter for these species - whether they are breeding and resident locally or using forest cover to help them move across the landscape. This diversity of species includes many that are considered to be species at risk. Furthermore, from a wildlife perspective, there is increasing evidence that the total forest cover in a given area is a major predictor of the persistence and size of bird populations, and it is possible or perhaps likely that this pattern extends to other flora and fauna groups. The overall effect of a decrease in forest cover on birds in fragmented landscapes is that certain species disappear and many of the remaining ones become rare, or fail to reproduce, while species adapted to more open and successional habitats, as well as those that are more tolerant to human-induced disturbances in general, are able to persist and in some cases thrive. Species with specialized-habitat requirements are most likely to be adversely affected. The overall pattern of distribution of forest cover, the shape, area and juxtaposition of remaining forest patches and the quality of forest cover also play major roles in determining how valuable forests will be to wildlife and people alike.
The current science generally supports minimum forest habitat requirements between 30 and 50 percent, with some limited evidence that the upper limit may be even higher, depending on the organism/species phenomenon under investigation or land-use/resource management planning regime being considered/used.
As shown in Figure 56, 29 percent of the Black Creek catchment contains 2924 hectares of upland forest and 886 hectares of lowland forest (treed swamps) versus the 34 percent of woodland cover in the Middle Rideau subwatershed. This is less than the 30 percent of forest cover that is identified as the minimum threshold required to sustain forest birds according to the Guideline and which may only support less than one half of potential species richness and marginally healthy aquatic systems. When forest cover drops below 30 percent, forest birds tend to disappear as breeders across the landscape.
Figure 56 Woodland cover and forest interior (2014)
Woodland (Patch) Size
According to the Ministry of Natural Resources’ Natural Heritage Reference Manual (Second Edition), larger woodlands are more likely to contain a greater diversity of plant and animal species and communities than smaller woodlands and have a greater relative importance for mobile animal species such as forest birds.
Bigger forests often provide a different type of habitat. Many forest birds breed far more successfully in larger forests than they do in smaller woodlots and some rely heavily on forest interior conditions. Populations are often healthier in regions with more forest cover and where forest fragments are grouped closely together or connected by corridors of natural habitat. Small forests support small numbers of wildlife. Some species are “area-sensitive” and tend not to inhabit small woodlands, regardless of forest interior conditions. Fragmented habitat also isolates local populations, especially small mammals, amphibians and reptiles with limited mobility. This reduces the healthy mixing of genetic traits that helps populations survive over the long run (Conserving the Forest Interior. Ontario Extension Notes, 2000).
The Environment Canada Guideline also notes that for forest plants that do not disperse broadly or quickly, preservation of some relatively undisturbed large forest patches is needed to sustain them because of their restricted dispersal abilities and specialized habitat requirements and to ensure continued seed or propagation sources for restored or regenerating areas nearby.
The Natural Heritage Reference Manual continues by stating that a larger size also allows woodlands to support more resilient nutrient cycles and food webs and to be big enough to permit different and important successional stages to co-exist. Small, isolated woodlands are more susceptible to the effects of blowdown, drought, disease, insect infestations, and invasions by predators and non-indigenous plants. It is also known that the viability of woodland wildlife depends not only on the characteristics of the woodland in which they reside, but also on the characteristics of the surrounding landscape where the woodland is situated. Additionally, the percentage of forest cover in the surrounding landscape, the presence of ecological barriers such as roads, the ability of various species to cross the matrix surrounding the woodland and the proximity of adjacent habitats interact with woodland size in influencing the species assemblage within a woodland.
In the Black Creek catchment (in 2014), 152 (37 percent) of the 410 woodland patches are very small, being less than one hectare in size. Another 209 (51 percent) of the woodland patches ranging from one to less than 20 hectares in size tend to be dominated by edge-tolerant bird species. The remaining 49 (12 percent of) woodland patches range between 21 and 271 hectares in size. Forty-four of these patches contain woodland between 20 and 100 hectares and may support a few area-sensitive species and some edge intolerant species, but will be dominated by edge tolerant species.
Conversely, five (one percent) of the 410 woodland patches in the drainage area exceed the 100 plus hectare size needed to support most forest dependent, area sensitive birds and are large enough to support approximately 60 percent of edge-intolerant species. One patch tops 200 hectares, which according to the Environment Canada Guideline will support 80 percent of edge-intolerant forest bird species (including most area sensitive species) that prefer interior forest habitat conditions.
Table 14 presents a comparison of woodland patch size in 2008 and 2014 along with any changes that have occurred over that time. A decrease (of 2 ha) has been observed in the overall woodland patch area between the two reporting periods with most change occurring in the 50 to 100 and 100 to 200 hectare woodland patch size class ranges.
Table 14 Woodland patches in the Black Creek catchment (2008 and 2014)
*Includes treed swamps
Forest Interior
The forest interior is habitat deep within woodlands. It is a sheltered, secluded environment away from the influence of forest edges and open habitats. Some people call it the “core” or the “heart” of a woodland. The presence of forest interior is a good sign of woodland health, and is directly related to the woodland’s size and shape. Large woodlands with round or square outlines have the greatest amount of forest interior. Small, narrow woodlands may have no forest interior conditions at all. Forest interior habitat is a remnant natural environment, reminiscent of the extensive, continuous forests of the past. This increasingly rare forest habitat is now a refuge for certain forest-dependent wildlife; they simply must have it to survive and thrive in a fragmented forest landscape (Conserving the Forest Interior. Ontario Extension Notes, 2000).
The Natural Heritage Reference Manual states that woodland interior habitat is usually defined as habitat more than 100 metres from the edge of the woodland and provides for relative seclusion from outside influences along with a moister, more sheltered and productive forest habitat for certain area sensitive species. Woodlands with interior habitat have centres that are more clearly buffered against the edge effects of agricultural activities or more harmful urban activities than those without.
In the Black Creek catchment (in 2014), the 410 woodland patches contain 136 forest interior patches (Figure 56) that occupy three percent (423 ha.) of the catchment land area (which is less than the five percent of interior forest in the Middle Rideau Subwatershed). This is below the ten percent figure referred to in the Environment Canada Guideline that is considered to be the minimum threshold for supporting edge intolerant bird species and other forest dwelling species in the landscape.
Most patches (122) have less than 10 hectares of interior forest, 82 of which have small areas of interior forest habitat less than one hectare in size. The remaining 14 patches contain interior forest ranging between 10 and 38 hectares in area.
Between 2008 and 2014, there has been a notable change in the number of woodland patches containing smaller areas of interior habitat (Table 15) with an increase of 56 woodlands containing less than one hectare of interior forest over this period and 10 woodlands with one to 10 hectares of interior habitat. This appears to have occurred as a result of the loss of interior forest habitat in the largest woodland patch in the catchment over this period.
Table 15 Woodland interior in the Black Creek catchment (2008 and 2014)
Wetland Cover
Wetlands are habitats forming the interface between aquatic and terrestrial systems. They are among the most productive and biologically diverse habitats on the planet. By the 1980s, according to the Natural Heritage Reference Manual, 68 percent of the original wetlands south of the Precambrian Shield in Ontario had been lost through encroachment, land clearance, drainage and filling.
Wetlands perform a number of important ecological and hydrological functions and provide an array of social and economic benefits that society values. Maintaining wetland cover in a watershed provides many ecological, economic, hydrological and social benefits that are listed in the Reference Manual and which may include:
- contributing to the stabilization of shorelines and to the reduction of erosion damage through the mitigation of water flow and soil binding by plant roots
- mitigating surface water flow by storing water during periods of peak flow (such as spring snowmelt and heavy rainfall events) and releasing water during periods of low flow (this mitigation of water flow also contributes to a reduction of flood damage)
- contributing to an improved water quality through the trapping of sediments, the removal and/or retention of excess nutrients, the immobilization and/or degradation of contaminants and the removal of bacteria
- providing renewable harvesting of timber, fuel wood, fish, wildlife and wild rice
- contributing to a stable, long-term water supply in areas of groundwater recharge and discharge
- providing a high diversity of habitats that support a wide variety of plants and animals
- acting as “carbon sinks” making a significant contribution to carbon storage
- providing opportunities for recreation, education, research and tourism
Historically, the overall wetland coverage within the Great Lakes basin exceeded 10 percent, but there was significant variability among watersheds and jurisdictions, as stated in the Environment Canada Guideline. In the Rideau Valley Watershed, it has been estimated that pre-settlement wetland cover averaged 35 percent using information provided by Ducks Unlimited Canada (2010) versus the 21 percent of wetland cover existing in 2014 derived from DRAPE imagery analysis.
Using the same dataset, it is estimated that pre-settlement (historic) wetland cover averaged 32 percent in the Middle Rideau subwatershed versus the 27 percent of cover existing in 2014. This decline in wetland cover is also evident in the Black Creek catchment (as seen in Figure 57) where there has been a 16 percent decrease in the area of wetland cover from pre-settlement times to the present (as summarized in Table 16).
Figure 57 Catchment wetland cover
While there has been a reported decrease in wetland cover in the Barbers Creek catchment from pre-settlement times, the remaining wetland cover in 2014 remains above the ecological thresholds cited in the Environment Canada Guideline. Nonetheless, in order to maintain critical hydrological, ecological functions along with related recreational and economic benefits provided by these wetland habitats in the catchment, a “no net loss” of currently existing wetlands should be employed to ensure the continued provision of tangible benefits accruing from them for landowners and surrounding communities.
Table 16 Wetland cover in the Middle Rideau subwatershed and Black Creek catchment (Historic to 2014)
5. Stewardship and Protection
The RVCA and its partners are working to protect and enhance environmental conditions in the Middle Rideau Subwatershed. Figure 58 shows the location of all stewardship projects completed in the Black Creek catchment along with sites identified for potential shoreline restoration.
Rural Clean Water Projects
From 2009 to 2014, two well upgrades, one septic system replacement and one wastewater runoff project were completed. Between 2003 and 2008, six well upgrades, three well decommissionings, one well replacement and one fuel storage and handling facility were completed. Prior to 2003, one livestock fencing project and one manure storage facility were completed. Total value of all 17 projects is $69,105 with $42,133 of that amount funded through grant dollars from the RVCA.
Figure 58 Stewardship and potential restoration locations
Tree Planting Projects
The location of RVCA Tree Planting Program projects is shown in Figure 58. From 2009 to 2014, 41.880 trees were planted at five sites. Between 2003 and 2008, 13,170 trees were planted at five sites and prior to 2003, 49,810 trees were planted at ten sites, resulting in the reforestation of 56 hectares. Total value of all 20 projects is $299,751 with $80,886 of that amount coming from various fundraising sources.
Through the RVCA Butternut Recovery Program, an additional 60 butternut trees were planted in the Black Creek catchment between 2003 and 2008, as part of efforts to introduce healthy seedlings from tolerant butternuts into various locations across Eastern Ontario.
Valley, Stream, Wetland and Hazard Land Regulation
The Black Creek catchment covers 131 square kilometres with 30 square kilometres (or 23 percent) of the drainage area being within the regulation limit of Ontario Regulation 174/06 (Figure 59), giving protection to wetland areas and river or stream valleys that are affected by flooding and erosion hazards.
Wetlands occupy 46.5 sq. km. (or 36 percent) of the catchment. Of these wetlands, 17.4 sq. km (or 37 percent) are designated as provincially significant and included within the RVCA regulation limit. This leaves the remaining 29.1 sq. km (or 63 percent) of wetlands in the catchment outside the regulated area limit.
Of the 190.1 kilometres of stream in the catchment, regulation limit mapping has been plotted along 50 kilometers of streams (representing 26 percent of all streams in the catchment). Some of these regulated watercourses (32.7 km or 17 percent of all streams) flow through regulated wetlands; the remaining 17.3 km (or 35 percent) of regulated streams are located outside of those wetlands. Plotting of the regulation limit on the remaining 140.1 km (or 74 percent) of streams requires identification of flood and erosion hazards and valley systems.
Within the regulation limit, “development” and “site alteration” require RVCA permission. The “alteration to waterways” provision of Ontario Regulation 174/06 applies to all watercourses.
Figure 59 RVCA regulation limits
Vulnerable Drinking Water Areas
The Black Creek drainage catchment is considered to have a Highly Vulnerable Aquifer. This means that the nature of the overburden (thin soils, fractured bedrock) does not provide a high level of protection for the underlying groundwater making the aquifer more vulnerable to contaminants released on the surface. The Mississippi-Rideau Source Protection Plan includes policies that focus on the protection of groundwater region-wide due to the fact that most of the region, which encompasses the Mississippi and Rideau watersheds, is considered Highly Vulnerable Aquifer.
The area around the headwaters of Black Creek is also considered a Significant Groundwater Recharge Area. This means that there is a volume of water moving from the surface into the ground and groundwater serves either as a municipal drinking water source or supplies a stream ecosystem. The Plan was not required to include policies to specifically address Significant Groundwater Recharge Areas.
For detailed maps and policies that have been developed to protect drinking water sources, please go to the Mississippi-Rideau Source Protection Region website at www.mrsourcewater.ca to view the Mississippi-Rideau Source Protection Plan.
6. Issues
Water Quality
- Surface water quality along Black Creek is “Fair” over two reporting periods (2003-2008 and 2009-2014) as determined by surface water chemistry data. Frequent exceedances of nutrients and occasional exceedances of E.coli, aluminum, copper and iron contributed to the rating. E.coli counts have increased in the 2009-2014 reporting period
- Instream biological water quality conditions at the Black Creek sample location range from “Poor” to “Fair” from 2003 to 2014 (using a grading scheme developed by Ontario Conservation Authorities in Ontario for benthic invertebrates) with an overall benthic invertebrate water quality rating of “Poor” determined for this period
Shorelines
-
The riparian buffer along Black Creek (30 m. wide strip along the shoreline of all lakes and streams) is comprised of wetland (55 percent), crop and pastureland (28 percent), woodland (12 percent), roads (three percent) and settlement areas (two percent) and (at 67 percent) is below the recommended target to maintain a minimum 30 metre wide, naturally vegetated buffer along at least 75 percent of the length of both sides of rivers, creeks and streams
-
Altered instream and riparian conditions exist along Black Creek and some tributaries
-
Emerald ash borer poses a significant threat to the ecology of the subwatershed, given the prominence of ash trees along shorelines and in riparian and wetland areas. Many tree stands are predominantly ash and with their anticipated loss, it is unclear what will replace them and the overall effect of their collective demise on the physical and natural functions/values they provide for erosion, water quality and fish and wildlife habitat
Land Cover
- The catchment contains 2906 ha of unevaluated wetland (occupying 22 percent of its total area) that provides many important social, hydrological, biological and ecological functions/services. Although not under imminent threat from development activity, they do remain vulnerable to drainage and land clearing activities in the absence of any regulatory and planning controls that would otherwise protect them
7. Opportunities/Actions
Water Quality
- Investigate the source of pollutants along Black Creek and its tributaries
- Implement agricultural and residential best management practices to address the elevated nutrient concentrations, occasional high bacterial counts and metal exceedances on Black Creek by restricting livestock access to the creek, limiting the use of fertilizers and pesticide applications and improving or maintaining a shoreline buffer
- Continue to offer the suite of water quality improvement projects provided by the Rideau Valley Rural Clean Water Program to landowners
- Continue to protect Black Creek and its tributaries through implementation of municipal and agency land use planning and development policies and practices
Shorelines/Headwaters
- Continue to promote the Rideau Valley Shoreline Naturalization and Tree Planting Programs to landowners
- RVCA and its partners (Beckwith Township, Township of Drummond/North Elmsley, Township of Montague) are to continue educating landowners about the value and importance of headwater drainage features, natural shorelines and waterfront property best management practices with respect to shoreline use and development, septic system installation and maintenance and shoreline vegetation retention and enhancement
- Protect the riparian buffer along the shoreline of Black Creek and other catchment streams (headwaters) during the development approvals process through adherence to and enforcement of municipal land-use policies and zoning standards
- Target shoreline restoration at sites identified in this report (shown as “Other riparian land cover” in Figure 16 and “Potential Riparian/Shoreline Restoration” in Figure 54) and explore other restoration and enhancement opportunities along Black Creek and its tributaries
Development
- Collectively work with approval authorities (Beckwith Township, Township of Drummond/North Elmsley, Township of Montague, Conservation Authority) to consistently implement current land use planning and development policies for water quality and shoreline protection adjacent to Black Creek and other catchment streams (e.g., a minimum 30 metre development setback from water)
- Explore ways and means to more effectively enforce and implement conditions of land-use planning and development approval to achieve net environmental gains (particularly with respect to rehabilitating or protecting naturally vegetated shorelines and water quality)
- Municipalities and agencies are encouraged to strengthen natural heritage and water resources official plan policies and zoning provisions (water setbacks, frontage and naturalized shorelines and wetland protection) where deemed appropriate
- Utilize RVCA subwatershed and catchment reports to help develop/revise official plan policies to protect surface water resources and the natural environment (including woodlands, wetlands and shoreline cover)
- Consider establishing RVCA regulations limits to protect additional wetlands
Full Catchment Report
Middle Rideau Subwatershed Report 2015
DALES CREEK CATCHMENT
The RVCA produces individual reports for ten catchments in the Middle Rideau subwatershed. Using data collected and analysed by the RVCA through its watershed monitoring and land cover classification programs, surface water quality conditions are reported for Dales Creek along with a summary of environmental conditions for the surrounding countryside every six years.
This information is used to better understand the effects of human activity on our water resources, allows us to better track environmental change over time and helps focus watershed management actions where they are needed the most to help sustain the ecosystem services (cultural, aesthetic and recreational values; provisioning of food, fuel and clean water; regulation of erosion/natural hazard protection and water purification; supporting nutrient/water cycling and habitat provision) provided by the catchment’s lands and forests and waters (Millennium Ecosystem Assessment 2005).
The following pages of this report are a compilation of that work and contain information on surface water quality, riparian conditions, land cover, stewardship activity and hazard land and water resources protection.
1. Catchment Facts
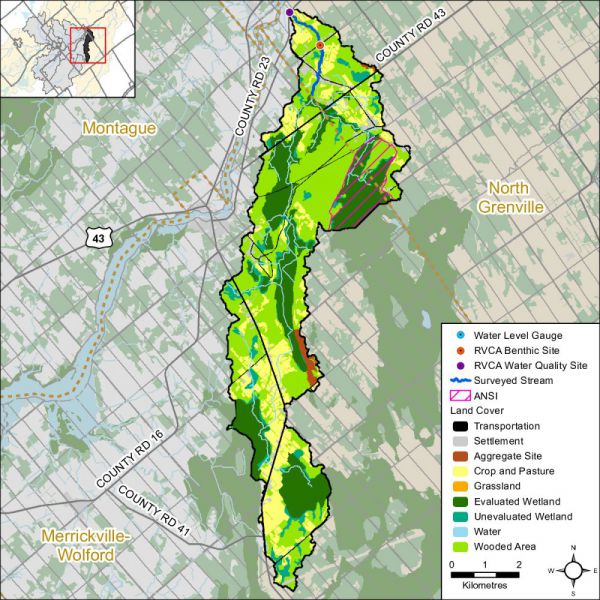
General Geography
- The Rideau River flows through the heart of the Middle Rideau and is a focal point for residents and visitors to the area. It extends from the outlet of Lower Rideau Lake at Poonamalie (where there is one dam and one lock) to Burritts Rapids (where there is also a dam and lock), at which point it enters the Lower Rideau on its way to Rideau Falls. The Rideau River is also an integral part of the Rideau Canal National Historic Site of Canada and is a significant tourist attraction which draws boaters, cottagers, and campers to the area
- Smiths Falls, Merrickville and Burritts Rapids are the main urban settlements in the Middle Rideau subwatershed. The Dales Creek catchment is predominantly rural in character with agriculture being the main land use
- Parks Canada staff manage water levels for recreational purposes along the Rideau Canal/Waterway that flows by the catchment, ensuring 1.5 metres of draft during the navigation season. In this managed system, water levels on the Rideau Canal are manipulated by operation of numerous dams. In the Middle Rideau subwatershed, Parks Canada staff operate 9 dam and lock complexes with 13 locks for a fall of 36.2 metres over 35.6 kilometres. Water levels are maintained as close as possible to set objectives through the May to October navigation season. The levels are lowered through the rest of October and into November and held at the winter levels until the spring freshet in late March or early April naturally increases inflows to the system. To reduce the impact of the higher flows in the spring, the amount of snow water equivalent, forecast rain, ice cover, flows and levels are assessed and the dams in the Middle Rideau reach are operated accordingly to quickly pass as much water as possible. In late April and early May, the dams are gradually closed and water levels are brought up to be ready, once again, for the navigation season
Physical Geography
- All of Dales Creek Catchment and the rest of the Middle Rideau Subwatershed primarily resides within the Smith Falls Limestone Plain, which in this area, happens to consist of Paleozoic dolostone of the Oxford Formation. The bedrock across the catchment is mainly overlain by a thin veneer of glacial sediment, referred to as ‘drift’ that is generally less than a metre in thickness; the landscape is also dotted with organic soils and some glacial till
- Seventy-nine percent of the catchment lies within the Village of Merrickville-Wolford and 21 percent within the Municipality of North Grenville
- Dales Creek catchment drainage area is 39 square kilometres and occupies about five percent of the Middle Rideau subwatershed and one percent of the Rideau Valley watershed
Vulnerable Areas
- The Assessment Report developed under the Ontario Clean Water Act identifies the upper bedrock aquifer underlying all of the catchment area as a Highly Vulnerable Aquifer, although, where sediments are thicker in a local area, the vulnerability would be less. It also identifies the northern half of the catchment being within the Wellhead Protection Area of the Town of Kemptville municipal wells
Development/Trends
- Land uses in the catchment within the Village of Merrickville-Wolford are Rural and Wetland with some Agriculture and Aggregate Resource; within the Municipality of North Grenville, land uses are Rural and Agriculture with some Provincially Significant Wetland
Conditions at a Glance
Water Quality
- Surface chemistry water quality rating in Dales Creek is “Fair” over two reporting periods (2003-2008 and 2009-2014). Elevated bacterial counts and nutrient concentrations from inflows of nutrients (from private septic systems, agricultural and residential surface water runoff) are occasionally a feature of Dales Creek. Decreased nutrient and bacterial counts are needed to improve the overall health of the creek
- Instream (biological) water quality conditions at the Dales Creek sample location range from “Poor” to “Good” from 2003 to 2014 (using a grading scheme developed by Ontario Conservation Authorities in Ontario for benthic invertebrates) with an overall benthic invertebrate water quality rating of “Poor” to “Good” determined for this period
Instream and Riparian
- Overall instream and riparian condition for the Dales creek catchment as assessed by the stream characterization and headwater drainage feature assessment programs show that Dales Creek and its tributaries are in generally good condition. The majority of the system has low erosion levels, a healthy riparian corridor with good instream diversity of aquatic habitat. An opportunity was identified along one of the headwater drainage features to enhance riparian habitat conditions
- The Dales Creek catchment has 24 species of recreational and bait fish and is classified as having a warm/cool/cold water thermal guild that supports the Dales Creek/Rideau River fishery
- In the Dales Creek catchment, the riparian buffer (30 m. wide strip along the shoreline of all lakes and streams) is comprised of wetland (72 percent), woodland (13 percent), crop and pastureland (12 percent), roads (two percent) and settlement areas (one percent)
Land Cover
- Dominant land cover is woodland (43 percent) and wetland (32 percent) followed by crop and pastureland (19 percent), settlement areas (three percent), roads (two percent) and aggregate (one percent). From 2008 to 2014, there was an overall change of 64 hectares (from one land cover class to another). Within the Dales Creek catchment, change is primarily associated with wetland encroaching into woodland and the transitioning of crop and pastureland to woodland and conversion to settlement
- Woodland cover in the catchment has decreased by 13 hectares between 2008 and 2014 and interior forest habitat has decreased by 38 hectares
- Wetland cover has increased by one percent (22 ha) from pre-settlement times to the present and now occupies 32 percent of the catchment area
Other
- There are approximately 197 in-use water wells with provincial records in this catchment. While most water wells are used for domestic water supply many are used for agricultural activities in this catchment; and several are also used for commercial, industrial, and public water supplies or heating and cooling
- There are two active bedrock quarry licenses in the catchment and one active Permit to Take Water for dewatering at a local bedrock quarry located along the northern catchment boundary and no active Environmental Compliance Approvals. There is one active sand and gravel pit and several closed pits and a small reserve of material of secondary significance
Catchment Care
- Six stewardship projects have been completed with assistance from the RVCA’s Rural Clean Water and Tree Planting Programs (see Section 5 of this report for details)
- Dales Creek surface water quality has been monitored by the RVCA through its Baseline Monitoring Program since 2003. The surface water quality at site DAL-01 is monitored once a month from April to November
- RVCA has been collecting benthic invertebrates in Dales Creek at the Haskins Road site since 2003
- RVCA conducted a fish survey along Dales Creek in 2014
- RVCA completed a stream characterization survey on Dales Creek in 2014, working upstream to the headwaters from the mouth of the creek where it empties into the Rideau River taking measurements and recording observations on instream habitat, bank stability, other attributes and preparing a temperature profile
- RVCA completed seven headwater drainage feature assessments at road crossings in the Dales Creek catchment in 2014. This protocol measures zero and first order headwater drainage features and is a rapid assessment method characterizing the amount of water, sediment transport, and storage capacity within headwater drainage features
- A watershed model developed by the RVCA in 2009 was used to study the hydrologic function of wetlands in the Rideau Valley Watershed, including those found in the Dales Creek catchment
- The Village of Merrickville-Wolford and Municipality of North Grenville have land use planning policies and zoning provisions - on water setbacks, frontage and naturalized shorelines and wetland protection - and in some instances use site plan control to implement these policies and provisions. Together with RVCA, these municipalities work with landowners on a case by case basis to enable new development while ensuring the scale is suitable on the lot, impacts on neighbours are minimized and development maximizes the watercourse setback
- Development in and adjacent to the Wolford Bog Provincially Significant Wetland in the catchment is subject to Ontario Regulation 174-06 (entitled “Development, Interference with Wetlands and Alterations to Shorelines and Watercourses”) that protects the hydrologic function of the wetland and also protects landowners and their property from natural hazards (flooding, fluctuating water table, unstable soils) associated with them
2. Surface Water Quality Conditions
Surface water quality conditions in the Dales Creek catchment are monitored by the Rideau Valley Conservation Authority’s (RVCA) Baseline Water Quality Monitoring Program. The Baseline Water Quality Program focuses on streams; data is collected for 22 parameters including nutrients (total phosphorus, total Kjeldahl nitrogen and ammonia), E. coli, metals (like aluminum and copper) and additional chemical/physical parameters (such as alkalinity, chlorides, pH and total suspended solids). Figure 1 shows the location of the monitoring site in the catchment.
Figure 1 Water quality monitoring site on Dales Creek
Dales Creek Water Quality
Water Quality Rating
The water quality ratings for the Dales Creek catchment is “Fair” (Table 1) as determined by the Canadian Council of Ministers of the Environment (CCME) Water Quality Index and is largely influenced by high nutrient concentrations, metals and high bacterial counts. A "Fair" rating indicates that water quality is usually protected but is occasionally threatened or impaired; conditions sometimes depart from natural or desirable levels. Each parameter is evaluated against established guidelines to determine water quality conditions. Those parameters that frequently exceed guidelines are presented below. Analysis of the data has been broken into two periods; 2003 to 2008 and 2009 to 2014 for the stream monitoring site located on Dales Creek (DAL-01) to examine if conditions have changed between these periods. Table 1 shows the overall rating for the monitored surface water quality site within the Dales Creek catchment and Table 2 outlines the Water Quality Index (WQI) scores and their corresponding ratings.
Table 1 Water Quality Index Ratings for the Dales Creel catchment
Table 2 WQI ratings and corresponding index scores (RVCA terminology, original WQI category names in brackets)
Nutrients
Total phosphorus (TP) is used as a primary indicator of excessive nutrient loading and may contribute to abundant aquatic vegetation growth and depleted dissolved oxygen levels. The Provincial Water Quality Objective (PWQO) is used as the TP Guideline and states that in streams concentrations greater than 0.030 mg/l indicate an excessive amount of TP.
Total Kjeldahl nitrogen (TKN) and ammonia (NH3) are used as secondary indicators of nutrient loadings. RVCA uses a guideline of 0.500 mg/l to assess TKN[1] and the PWQO of 0.020 mg/l to assess NH3 concentrations in Dales Creek.
Tables 3, 4 and 5 summarize average nutrient concentrations at monitored sites within the Creek catchment and show the proportion of results that meet the guidelines.
Table 3 Summary of total phosphorus results for Dales Creek, 2003-2008 and 2009-2014. Highlighted values indicate average concentrations exceed the guideline
Table 4 Summary of total Kjeldahl Nitrogen results for Dales Creek, 2003-2008 and 2009-2014. Highlighted values indicate average concentrations exceed the guideline
Table 5 Summary of Ammonia results for Dales Creek, 2003-2008 and 2009-2014
Elevated TP results were an occasional occurrence in the 2003-2008 and 2009-2014 monitoring periods at site DAL-01. The 2009-2014 monitoring period saw a marginal improvement with less exceedances. Site DAL-01 had 83 percent of samples that were below the guideline in the 2003-2008 period (Figure 2); this increased to 89 percent of samples in the 2009-2014 period (Figure 3). The average TP concentration for both reporting periods were below the PWQO which slightly decreased from 0.021 mg/l to 0.020 mg/l (Table 3).
Figure 2 Total Phosphorous concentrations in Dales Creek, 2003-2008
Figure 3 Total phosphorous concentrations in Dales Creek, 2009-2014
TKN concentrations show that the bulk of results exceeded the guideline (Figures 4 and 5); there were few samples (15 percent) below the guideline in the 2003-2008 period and this slightly increased to 19 percent in the 2009-2014 period. The average concentration was generally elevated and increased from 0.663 mg/l to 0.737 mg/l (Table 8).
Figure 4 Total Kjeldahl nitrogen concentrations in Dales Creek, 2003-2008
Figure 5 Total Kjeldahl nitrogen concentrations in Dales Creek, 2009-2014
Occasional elevated nutrients were observed in NH3 data. The proportion of results that were below the guideline were 82 percent in 2003-2008 (Figure 6); this decreased to 75 percent in the 2009-2014 reporting periods (Figure 7). The average NH3 concentration slightly increased from 0.007 mg/l to 0.008 mg/l (Table 5).
Figure 6 Ammonia concentrations in Dales Creek, 2003-2008
Figure 7 Ammonia concentrations in Dales Creek, 2009-2014
Summary
The data shows that nutrient enrichment is a feature of Dales Creek. Total phosphorous and NH3 occasionally exceed the guidelines while TKN concentrations frequently exceeded the guideline. Elevated TKN concentrations may be influenced by organic matter held by wetland areas found upstream in the Middle Rideau Subwatershed, resulting in naturally high concentrations of organic nitrogen. High nutrient concentrations can help stimulate the growth of algae blooms and other aquatic vegetation in a waterbody and deplete oxygen levels as the vegetation dies off. It is important to reduce human impacts wherever possible. Strategies to reduce nutrient inputs may include diversion of runoff to the creek and enhanced shoreline buffers.
E. Coli
E. coli is used as an indicator of bacterial pollution from human or animal waste; in elevated concentrations it can pose a risk to human health. The PWQO of 100 colony forming units/100 millilitres (CFU/100 ml) is used. E. coli counts greater than this guideline indicate that bacterial contamination may be a problem within a waterbody.
Table 6 summarizes the geometric mean[2] for the monitored site on Dales Creek and shows the proportion of samples that meet the E. coli guideline of 100 CFU/100 ml. The results of the geometric mean with respect to the guideline for the two periods, 2003-2008 and 2009- 2014, are shown in Figures 8 and 9 respectively.
Table 6 Summary of E. coli results for Dales Creek, 2003-2008 and 2009-2014
E. coli results at site DAL-01 indicate bacterial counts are occasionally above the E. coli guideline. The proportion of samples below the guideline increased from 34 percent (Figure 8) to 51 percent (Figure 9). E.coli counts decreased slightly between the two monitoring periods (2003-2008 and 2009-2014) with a geometric mean of 81 CFU/100ml to 79 CFU/100ml (Table 6).
Figure 8 Geometric mean of E.coli counts in Dales Creek, 2003-2008
Figure 9 Geometric mean of E.coli counts in Dales Creek, 2009-2014
Summary
This data shows that E.coli results occasionally exceed the guidelines at site DAL-01 in Dales Creek. The geometric mean is below the PWQO for both monitoring periods and there has been a decrease in E.coli counts between 2003-2008 and 2009-2014. Properly maintaining septic systems, enhancing shoreline buffers and restricting cattle access can help to improve E.coli levels in Dales Creek.
Metals
Of the metals routinely monitored in Dales Creek, aluminum (Al), iron (Fe) and copper (Cu) occasionally reported concentrations above their respective PWQOs. In elevated concentrations, these metals can have toxic effects on sensitive aquatic species.
Tables 7, 8 and 9 summarize metal concentrations at site DAL-01 and show the proportion of samples that meet guidelines. Figures 10 to 15 show metal concentrations with respect to the guidelines for the two periods of interest, 2003–2008 and 2009–2014. For Al, the PWQO is 0.075 mg/l, Cu it is 0.005 mg/l and Fe it is 0.300 mg/l.
Table 7 Summary of Aluminum results for Dales Creek from 2003-2008 and 2009-2014
Table 8 Summary of Copper results for Dales Creek from 2003-2008 and 2009-2014
Table 9 Summary of Iron results for Dales Creek from 2003-2008 and 2009-2014
Results from DAL-01 show that Al concentrations had few exceedances with 85 percent of samples below the guideline in the 2003-2008 period (Figure 10). This improved to 100 percent of samples in the 2009-2014 period (Figure 11). The average concentration of Al was 0.046 mg/l from 2003-2008 and 0.010 mg/l from 2009-2014 which are both below the guideline.
Figure 10 Average aluminum concentrations in Dales Creek, 2003-2008
Figure 11 Average aluminum concentrations in Dales Creek, 2009-2014
Copper concentrations occasionally exceeded the PWQO, with 89 percent of samples below the guideline in 2003-2008 (Figure 12). This decreased to 84 percent of samples being below the guideline in 2009-2014 (Figure 13). The average concentration of Cu was 0.002 mg/l for both reporting periods (Table 8).
Figure 12 Average copper concentrations in Dales Creek, 2003-2008
Figure 13 Average copper concentrations in Dales Creek, 2009-2014
Iron concentrations also surpassed the PWQO guideline. The proportion of samples below the guideline increased from 89 percent to 96 percent (Figures 14 and 15). Although there were observed exceedances, the average concentration did not exceed the guideline in both monitoring periods; 0.225 mg/l in 2003-2008 and .071 mg/l in 2009-2014.
Figure 14 Average iron concentrations in Dales Creek, 2003-2008
Figure 15 Average iron concentrations in Dales Creek, 2009-2014
Summary
Overall, a general decline in metal concentrations was observed between the two periods of interest, with the exception of copper which slightly increased. Efforts should continue to be made to identify pollution sources and implement best management practices to reduce any inputs such as runoff, metal alloys, fungicides and pesticides to improve overall stream health and lessen downstream impacts.
[1] No Ontario guideline for TKN is presently available; however, waters not influenced by excessive organic inputs typically range from 0.100 to 0.500 mg/l, Environment Canada (1979) Water Quality Sourcebook, A Guide to Water Quality Parameters, Inland Waters Directorate, Water Quality Branch, Ottawa, Canada
[2] A type of mean or average, which indicates the central tendency or typical value of a set of numbers by using the product of their values (as opposed to the arithmetic mean which uses their sum). It is often used to summarize a variable that varies over several orders of magnitude, such as E. coli counts.
3. Riparian Conditions
Shoreline Buffer Land Cover Evaluation
The riparian or shoreline zone is that special area where the land meets the water. Well-vegetated shorelines are critically important in protecting water quality and creating healthy aquatic habitats, lakes and rivers. Natural shorelines intercept sediments and contaminants that could impact water quality conditions and harm fish habitat in streams. Well established buffers protect the banks against erosion, improve habitat for fish by shading and cooling the water and provide protection for birds and other wildlife that feed and rear young near water. A recommended target (from Environment Canada’s Guideline: How Much Habitat is Enough?) is to maintain a minimum 30 meter wide vegetated buffer along at least 75 percent of the length of both sides of rivers, creeks and streams.
Figure 16 shows the extent of the naturally vegetated riparian zone along a 30 metre strip of the shoreline of Dales Creek and its tributaries. This information is derived from a dataset developed by the RVCA’s Land Cover Classification Program through heads-up digitization of 20cm DRAPE ortho-imagery at a 1:4000 scale, which details the catchment landscape using 10 land cover classes.
Figure 16 Natural and other riparian land cover in the Dales Creek catchment
This analysis shows that the riparian buffer in the Dales Creek catchment is comprised of wetland (72 percent), woodland (13 percent), crop and pastureland (12 percent), roads (two percent) and settlement areas (one percent). Additional statistics for the Dales Creek catchment are presented in Table 10 and show that there has been very little change in shoreline cover from 2008 to 2014.
Table 10 Riparian land cover (2008 vs. 2014) in the Dales Creek catchment
Dales Creek Overbank Zone
Riparian Buffer Width Evaluation
Figure 17 demonstrates the buffer conditions of the left and right banks separately. Dales Creek had a buffer of greater than 30 meters along 95 percent of the right bank and 89 percent of the left bank (Figure 17).
Figure 17 Riparian Buffer Evaluation along Dales Creek
Adjacent Land Use
The RVCA’s Stream Characterization Program identifies seven different land uses beside Dales Creek (Figure 18). Surrounding land use is considered from the beginning to end of the survey section (100m) and up to 100m on each side of the creek. Land use outside of this area is not considered for the surveys but is nonetheless part of the subwatershed and will influence the creek. Natural areas made up 96 percent of the stream, characterized by wetlands, forest, scrubland and meadow. The remaining land use consisted of pasture, residential and infrastructure in the form of road crossings.
Figure 18 Land Use along Dales Creek
Dales Creek Shoreline Zone
Instream Erosion
Erosion is a normal, important stream process and may not affect actual bank stability; however, excessive erosion and deposition of sediment within a stream can have a detrimental effect on important fish and wildlife habitat. Poor bank stability can greatly contribute to the amount of sediment carried in a waterbody as well as loss of bank vegetation due to bank failure, resulting in trees falling into the stream and the potential to impact instream migration. Figure 19 shows low levels of erosion are dominant along Dales Creek.
Figure 19 Erosion along Dales Creek
Undercut Stream Banks
Undercut banks are a normal and natural part of stream function and can provide excellent refuge areas for fish. Figure 20 shows that Dales Creek was dominated by low levels of undercut banks with an area in the middle reach having high levels of undercut banks.
Figure 20 Undercut stream banks along Dales Creek
Stream Shading
Grasses, shrubs and trees all contribute towards shading a stream. Shade is important in moderating stream temperature, contributing to food supply and helping with nutrient reduction within a stream. Figure 21 shows highly variable stream shading conditions ranging from low levels to high levels along Dales Creek.
Figure 21 Stream shading along Dales Creek
Instream Woody Debris
Figure 22 shows that the majority of Dales Creek had low to moderate levels of instream woody debris in the form of branches and trees. Instream woody debris is important for fish and benthic invertebrate habitat, by providing refuge and feeding areas.
Figure 22 Instream woody debris along Dales Creek
Overhanging Trees and Branches
Figure 23 shows low to moderate levels of overhanging branches and trees along Dales Creek. Overhanging branches and trees provide a food source, nutrients and shade which helps to moderate instream water temperatures.
Figure 23 Overhanging trees and branches along Dales Creek
Anthropogenic Alterations
Figure 24 shows 81 percent of Dales Creek remains “unaltered” with no anthropogenic alterations. Nineteen percent of Dales Creek was classified as natural with minor anthropogenic changes in the form of road crossings.
Figure 24 Anthropogenic alterations along Dales Creek
Instream Aquatic Habitat
Benthic Invertebrates
Freshwater benthic invertebrates are animals without backbones that live on the stream bottom and include crustaceans such as crayfish, molluscs and immature forms of aquatic insects. Benthos represent an extremely diverse group of aquatic animals and exhibit wide ranges of responses to stressors such as organic pollutants, sediments and toxicants, which allows scientists to use them as bioindicators. As part of the Ontario Benthic Biomonitoring Network (OBBN), the RVCA has been collecting benthic invertebrates at the Haskins Road site on Dales Creek since 2003. Monitoring data is analyzed for each sample site and the results are presented using the Family Biotic Index, Family Richness and percent Ephemeroptera, Plecoptera and Trichoptera.
The Hilsenhoff Family Biotic Index (FBI) is an indicator of organic and nutrient pollution and provides an estimate of water quality conditions for each site using established pollution tolerance values for benthic invertebrates. FBI results for Dales Creek are separated by reporting period 2003 to 2008 and 2009 to 2014. “Poor” to “Excellent” water quality conditions being observed at the Dales Creek sample location for the period from 2003 to 2014 (Fig.25) using a grading scheme developed by Conservation Authorities in Ontario for benthic invertebrates.
Figure 25 Hilsenhoff Family Biotic Index on Dales Creek
Family Richness measures the health of the community through its diversity and increases with increasing habitat diversity suitability and healthy water quality conditions. Family Richness is equivalent to the total number of benthic invertebrate families found within a sample. Dales Creek is reported to have “Fair” to “Good” family richness (Fig.26).
Figure 26 Family Richness in Dales Creek
Ephemeroptera (Mayflies), Plecoptera (Stoneflies), and Trichoptera (Caddisflies) are species considered to be very sensitive to poor water quality conditions. High abundance of these organisms is generally an indication of good water quality conditions at a sample location. During certain sampling years the community structure has a relatively high number of species that are sensitive to poor water quality conditions. As a result, the EPT indicates that Dales Creek is reported to have “Poor” to “Good” water quality (Fig.27) from 2003 to 2014.
Figure 27 EPT in Dales Creek
Conclusion
Overall Dales Creek aquatic habitat conditions from a benthic invertebrate perspective are highly variable ranging from “Poor” to “Good” from 2003 to 2014.
Habitat Complexity
Streams are naturally meandering systems and move over time; there are varying degrees of habitat complexity, depending on the creek. Examples of habitat complexity include variable habitat types such as pools and riffles as well as substrate variability and woody debris structure. A high percentage of habitat complexity (heterogeneity) typically increases the biodiversity of aquatic organisms within a system. One hundred percent of Dales Creek was considered heterogeneous, as shown in Figure 28.
Figure 28 Habitat complexity along Dales Creek
Instream Substrate
Diverse substrate is important for fish and benthic invertebrate habitat because some species have specific substrate requirements and for example will only reproduce on certain types of substrate. Figure 29 shows that 29 percent of the substrate observed on Dales Creek was dominated by bedrock. Overall substrate conditions were highly variable along Dales Creek. Figure 30 shows the dominant substrate type observed for each section surveyed along Dales Creek.
Figure 29 Instream substrate along Dales Creek
Figure 30 shows the dominant substrate type along Dales Creek.
Cobble and Boulder Habitat
Boulders create instream cover and back eddies for large fish to hide and/or rest out of the current. Cobble provides important spawning habitat for certain fish species like walleye and various shiner species who are an important food source for larger fish. Cobble can also provide habitat conditions for benthic invertebrates that are a key food source for many fish and wildlife species. Figure 31 shows where cobble and boulder substrate are found in Dales Creek.
Figure 31 Instream substrate cobble and boulder along Dales Creek
Instream Morphology
Pools and riffles are important habitat features for fish. Riffles are areas of agitated water and they contribute higher dissolved oxygen to the stream and act as spawning substrate for some species of fish, such as walleye. Pools provide shelter for fish and can be refuge pools in the summer if water levels drop and water temperature in the creek increases. Pools also provide important over wintering areas for fish. Runs are usually moderately shallow, with unagitated surfaces of water and areas where the thalweg (deepest part of the channel) is in the center of the channel. Figure 32 shows that Dales Creek is highly variable; 64 percent consists of runs, 22 percent riffles and 15 percent pools. Figure 33 shows where riffle habitat was observed along Dales Creek.
Figure 32 Instream morphology along Dales Creek
Figure 33 Riffle habitat locations along Dales Creek
Vegetation Type
Instream vegetation provides a variety of functions and is a critical component of the aquatic ecosystem. For example emergent plants along the shoreline can provide shoreline protection from wave action and important rearing habitat for species of waterfowl. Submerged plants provide habitat for fish to find shelter from predator fish while they feed. Floating plants such as water lilies shade the water and can keep temperatures cool while reducing algae growth. The dominant vegetation type recorded at thirty six percent consisted of algae. Dales Creek had high levels of diversity for instream vegetation. Figure 34 depicts the plant community structure for Dales Creek. Figure 35 shows the dominant vegetation type observed for each section surveyed along Dales Creek.
Figure 34 Vegetation type along Dales Creek
Figure 35 Dominant vegetation type along Dales Creek
Instream Vegetation Abundance
Instream vegetation is an important factor for a healthy stream ecosystem. Vegetation helps to remove contaminants from the water, contributes oxygen to the stream, and provides habitat for fish and wildlife. Too much vegetation can also be detrimental. Figure 36 demonstrates that Dales Creek had common and normal low levels of instream vegetation for only 34 percent of its length. Low, rare and no vegetation was dominate for a total of 65 percent of stream sections. Part of the reason for low levels of vegetation could be due to a high percentage of the stream bottom consisting of bedrock which does not allow aquatic vegetation to become established.
Figure 36 Instream vegetation abundance along Dales Creek
Invasive Species
Invasive species can have major implications on streams and species diversity. Invasive species are one of the largest threats to ecosystems throughout Ontario and can out compete native species, having negative effects on local wildlife, fish and plant populations. One hundred percent of the sections surveyed along Dales Creek had invasive species (Figure 37). The invasive species observed in Dales Creek were European frogbit, purple loosestrife, glossy and common buckthorn, curly leafed pondweed, flowering rush, Eurasian milfoil and Manitoba maple. Figure 38 shows the frequency of the invasive species observed along Dales Creek.
Figure 37 Invasive species along Dales Creek
Figure 38 Frequency of Invasive species along Dales Creek
Water Chemistry
During the stream characterization survey, a YSI probe is used to collect water chemistry information. Dissolved oxygen, conductivity and pH are measured at the start and end of each section.
Dissolved Oxygen
Dissolved oxygen is a measure of the amount of oxygen dissolved in water. The Canadian Environmental Quality Guidelines of the Canadian Council of Ministers of the Environment (CCME) suggest that for the protection of aquatic life the lowest acceptable dissolved oxygen concentration should be 6 mg/L for warmwater biota and 9.5 mg/L for coldwater biota (CCME, 1999). Figure 39 shows that the dissolved oxygen in Dales Creek was within the threshold for warmwater biota in most reaches of the system, however areas in the headwaters were below the warmwater threshold. The average dissolved oxygen levels observed within the main stem of Dales Creek was 6. 29mg/L which is within the recommended levels for warmwater biota.
Figure 39 Dissolved oxygen ranges in Dales Creek
Conductivity
Conductivity in streams is primarily influenced by the geology of the surrounding environment, but can vary drastically as a function of surface water runoff. Currently there are no CCME guideline standards for stream conductivity; however readings which are outside the normal range observed within the system are often an indication of unmitigated discharge and/or stormwater input. The average conductivity observed within the main stem of Dales Creek was 354 µs/cm. Figure 40 shows the conductivity readings for Dales Creek.
Figure 40 Specific conductivity ranges in Dales Creek
pH
Based on the PWQO for pH, a range of 6.5 to 8.5 should be maintained for the protection of aquatic life. Average pH values for Dales Creek averaged 7.95 thereby meeting the provincial standard.
Figure 41 pH ranges in Dales Creek
Thermal Regime
Many factors can influence fluctuations in stream temperature, including springs, tributaries, precipitation runoff, discharge pipes and stream shading from riparian vegetation. Water temperature is used along with the maximum air temperature (using the Stoneman and Jones method) to classify a watercourse as either warm water, cool water or cold water. Figure 42 shows the locations of the thermal sampling sites along Dales Creek. Analysis of the data collected indicates that Dales Creek is classified as a cool water system with cool to warm water reaches (Figure 43).
Figure 42 Temperature logger locations on Dales Creek
Figure 43 Temperature logger data for two sites on Dales Creek
Each point on the graph represents a temperature that meets the following criteria:
- Sampling dates between July 1st and September 7th
- Sampling date is preceded by two consecutive days above 24.5 °C, with no rain
- Water temperatures are collected at 4pm
- Air temperature is recorded as the max temperature for that day
Groundwater
Groundwater discharge areas can influence stream temperature, contribute nutrients, and provide important stream habitat for fish and other biota. During stream surveys, indicators of groundwater discharge are noted when observed. Indicators include: springs/seeps, watercress, iron staining, significant temperature change and rainbow mineral film. Figure 44 shows areas where one or more of the above groundwater indicators were observed during stream surveys and headwater assessments.
Figure 44 Groundwater indicators observed in the Dales Creek catchment
Headwaters Drainage Features Assessment
The RVCA Stream Characterization program assessed Headwater Drainage Features for the Middle Rideau subwatershed in 2014. This protocol measures zero, first and second order headwater drainage features (HDF). It is a rapid assessment method characterizing the amount of water, sediment transport, and storage capacity within headwater drainage features (HDF). RVCA is working with other Conservation Authorities and the Ministry of Natural Resources and Forestry to implement the protocol with the goal of providing standard datasets to support science development and monitoring of headwater drainage features. An HDF is a depression in the land that conveys surface flow. Additionally, this module provides a means of characterizing the connectivity, form and unique features associated with each HDF (OSAP Protocol, 2013). In 2014 the program sampled 7 sites at road crossings in the Dales Creek catchment area. Figure 45 spring photos of two sample locations in the Dales Creek catchment from 2014.

Figure 45 Locations of the headwater sampling sites in the Dales Creek catchment
Spring photo from a headwater sample site in the Dales Creek catchment on Scotch Line road west
Summer photo from a headwater sample site in the Dales Creek catchment on Scotch Line road west
Feature Type
The headwater sampling protocol assesses the feature type in order to understand the function of each feature. The evaluation includes the following classifications: defined natural channel, channelized or constrained, multi-thread, no defined feature, tiled, wetland, swale, roadside ditch and pond outlet. By assessing the values associated with the headwater drainage features in the catchment area we can understand the ecosystem services that they provide to the watershed in the form of hydrology, sediment transport, and aquatic and terrestrial functions. The Dales Creek catchment is dominated by natural channel and wetland headwater drainage features. One feature was classified as having been channelized. Figure 46 shows the feature type of the primary feature at the sampling locations.
Figure 46 Headwater feature types in the Dales Creek catchment
Headwater Feature Flow
The observed flow condition within headwater drainage features can be highly variable depending on timing relative to the spring freshet, recent rainfall, soil moisture, etc. Flow conditions are assessed in the spring and in the summer to determine if features are perennial and flow year round, if they are intermittent and dry up during the summer months or if they are ephemeral systems that do not flow regularly and generally respond to specific rainstorm events or snowmelt. Flow conditions in headwater systems can change from year to year depending on local precipitation patterns. Figure 47 shows the observed flow conditions at the sampling locations in the Dales Creek catchment.
Figure 47 Headwater feature flow conditions in the Dales Creek catchment
Feature Channel Modifications
Channel modifications were assessed at each headwater drainage feature sampling location. Modifications include channelization, dredging, hardening and realignments. The sampling locations for the Dales Creek catchment area were classified as having no channel modifications. Figure 48 shows the channel modifications observed at the sampling locations for Dales Creek.
Figure 48 Headwater feature channel modifications in the Dales Creek catchment
Headwater Feature Vegetation
Headwater feature vegetation evaluates the type of vegetation that is found within the drainage feature. The type of vegetated within the channel influences the aquatic and terrestrial ecosystem values that the feature provides. For some types of headwater features the vegetation within the feature plays a very important role in flow and sediment movement and provides wildlife habitat. The following classifications are evaluated no vegetation, lawn, wetland, meadow, scrubland and forest. The features assessed in the Dales Creek catchment were classified as having wetland or meadow vegetation in the feature. Figure 49. Depicts the dominant vegetation observed at the sampled headwater sites in the Dales Creek catchment.
Figure 49 Headwater feature vegetation types in the Dales Creek catchment
Headwater Feature Riparian Vegetation
Headwater riparian vegetation evaluates the type of vegetation that is found along the adjacent lands of a headwater drainage feature. The type of vegetation within the riparian corridor influences the aquatic and terrestrial ecosystem values that the feature provides to the watershed. The majority of the sample locations in Dales Creek were dominated by natural vegetation in the form of meadow, scrubland, forest and wetland vegetation. Figure 50. Depicts the type of riparian vegetation observed at the sampled headwater sites in the Dales Creek catchment.
Figure 50 Headwater feature riparian vegetation types in the Dales Creek catchment
Headwater Feature Sediment Deposition
Assessing the amount of recent sediment deposited in a channel provides an index of the degree to which the feature could be transporting sediment to downstream reaches (OSAP, 2013). Evidence of excessive sediment deposition might indicate the requirement to follow up with more detailed targeted assessments upstream of the site location to identify potential best management practices to be implemented. Conditions ranged from no deposition observed to a site with substantial deposition recorded. Overall the sites had minimal to moderate levels of sediment deposition. Figure 51. Depicts the degree of sediment deposition observed at the sampled headwater sites in the Dales Creek catchment.
Figure 51 Headwater feature sediment deposition in the Dales Creek catchment
Headwater Feature Upstream Roughness
Feature roughness will provide a measure of the amount of materials within the bankfull channel that could slow down the velocity of water flowing within the headwater feature (OSAP, 2013). Materials on the channel bottom that provide roughness include vegetation, woody debris and boulders/cobble substrates. Roughness can provide benefits in mitigating downstream erosion on the headwater drainage feature and the receiving watercourse by reducing velocities. Roughness also provides important habitat conditions to aquatic organisms. The sample locations in the Dales Creek catchment area had variable roughness conditions ranging from extreme to minimal levels. Figure 52 shows the feature roughness conditions at the sampling locations in the Dales Creek catchment.
Figure 52 Headwater feature roughness in the Dales Creek catchment
Fish Community
The Dales Creek catchment is classified as a mixed community of warm and cool water recreational and baitfish fishery with 24 species observed. Table 11 lists those species observed in the catchment (Source: RVCA). Figure 53 depicts the fish sampling locations along Dales Creek.
Figure 53 Dales Creek fish community
Table 11 Fish species observed in Dales Creek
A mottled sculpin captured on Dales Creek which is a sign of cold water habitat conditions
Migratory Obstructions
It is important to know locations of migratory obstructions because these can prevent fish from accessing important spawning and rearing habitat. Migratory obstructions can be natural or manmade, and they can be permanent or seasonal. Figure 54 shows that Dales Creek had several beaver dams at the time of the survey in 2014.
Figure 54 Migratory obstructions along Dales Creek
Riparian Restoration
Figure 55 depicts the location of a riparian restoration opportunity as a result of observations made during the stream survey and headwater drainage feature assessments.
Figure 55 Riparian restoration opportunities along Dales Creek
4. Land Cover
Land cover and any change in coverage that has occurred over a six year period is summarized for the Dales Creek catchment using spatially continuous vector data representing the catchment during the spring of 2008 and 2014. This dataset was developed by the RVCA through heads-up digitization of 20cm DRAPE ortho-imagery at a 1:4000 scale and details the surrounding landscape using 10 land cover classes.
As shown in Table 12, the dominant land cover types in 2008 and 2014 were woodland along with wetland.
Table 12 Land cover (2008 vs. 2014) in the Dales Creek catchment
* Does not include treed swamps ** Includes treed swamps
From 2008 to 2014, there was an overall change of 64 hectares from one land cover class to another. Change within the Dales Creek catchment is primarily associated with wetland encroaching into woodland and the transitioning of crop and pastureland to woodland and conversion to settlement (see Figure 56 for the location of the major changes).
Figure 56 Dominant land cover change in the Dales Creek catchment (2014)
Table 13 shows the type of land cover change that has taken place between land cover classes/types from 2008 to 2014. Overall, the net area of crop and pasture change (loss) is relatively small at 24 hectares relative to the remaining area of crop and pasture in the catchment (as of 2014). Similarly, the net area of woodland change (loss) is very small at 17 hectares relative to the remaining area of woodland in the catchment (as of 2014).
Table 13 Land cover change in the Dales Creek catchment (2008 to 2014)
Woodland Cover
In the Environment Canada Guideline (Third Edition) entitled “How Much Habitat Is Enough?” (hereafter referred to as the “Guideline”) the opening narrative under the Forest Habitat Guidelines section states that prior to European settlement, forest was the predominant habitat in the Mixedwood Plains ecozone. The remnants of this once vast forest now exist in a fragmented state in many areas (including the Rideau Valley watershed) with woodland patches of various sizes distributed across the settled landscape along with higher levels of forest cover associated with features such as the Frontenac Axis (within the on-Shield areas of the Rideau Lakes and Tay River subwatersheds). The forest legacy, in terms of the many types of wildlife species found, overall species richness, ecological functions provided and ecosystem complexity is still evident in the patches and regional forest matrices (found in the Middle Rideau subwatershed and elsewhere in the Rideau Valley watershed). These ecological features are in addition to other influences which forests have on water quality and stream hydrology including reducing soil erosion, producing oxygen, storing carbon along with many other ecological services that are essential not only for wildlife but for human well-being.
The Guideline also notes that forests provide a great many habitat niches that are in turn occupied by a great diversity of plant and animal species. They provide food, water and shelter for these species - whether they are breeding and resident locally or using forest cover to help them move across the landscape. This diversity of species includes many that are considered to be species at risk. Furthermore, from a wildlife perspective, there is increasing evidence that the total forest cover in a given area is a major predictor of the persistence and size of bird populations, and it is possible or perhaps likely that this pattern extends to other flora and fauna groups. The overall effect of a decrease in forest cover on birds in fragmented landscapes is that certain species disappear and many of the remaining ones become rare, or fail to reproduce, while species adapted to more open and successional habitats, as well as those that are more tolerant to human-induced disturbances in general, are able to persist and in some cases thrive. Species with specialized-habitat requirements are most likely to be adversely affected. The overall pattern of distribution of forest cover, the shape, area and juxtaposition of remaining forest patches and the quality of forest cover also play major roles in determining how valuable forests will be to wildlife and people alike.
The current science generally supports minimum forest habitat requirements between 30 and 50 percent, with some limited evidence that the upper limit may be even higher, depending on the organism/species phenomenon under investigation or land-use/resource management planning regime being considered/used.
As shown in Figure 57, 47 percent of the Dales Creek catchment contains 1659 hectares of upland forest and 182 hectares of lowland forest (treed swamps) versus the 34 percent of woodland cover in the Middle Rideau subwatershed. This is greater than the 30 percent of forest cover that is identified as the minimum threshold required to sustain forest birds according to the Guideline and which may only support less than one half of potential species richness and marginally healthy aquatic systems. When forest cover drops below 30 percent, forest birds tend to disappear as breeders across the landscape.
Figure 57 Woodland cover and forest interior (2014)
Woodland (Patch) Size
According to the Ministry of Natural Resources’ Natural Heritage Reference Manual (Second Edition), larger woodlands are more likely to contain a greater diversity of plant and animal species and communities than smaller woodlands and have a greater relative importance for mobile animal species such as forest birds.
Bigger forests often provide a different type of habitat. Many forest birds breed far more successfully in larger forests than they do in smaller woodlots and some rely heavily on forest interior conditions. Populations are often healthier in regions with more forest cover and where forest fragments are grouped closely together or connected by corridors of natural habitat. Small forests support small numbers of wildlife. Some species are “area-sensitive” and tend not to inhabit small woodlands, regardless of forest interior conditions. Fragmented habitat also isolates local populations, especially small mammals, amphibians and reptiles with limited mobility. This reduces the healthy mixing of genetic traits that helps populations survive over the long run (Conserving the Forest Interior. Ontario Extension Notes, 2000).
The Environment Canada Guideline also notes that for forest plants that do not disperse broadly or quickly, preservation of some relatively undisturbed large forest patches is needed to sustain them because of their restricted dispersal abilities and specialized habitat requirements and to ensure continued seed or propagation sources for restored or regenerating areas nearby.
The Natural Heritage Reference Manual continues by stating that a larger size also allows woodlands to support more resilient nutrient cycles and food webs and to be big enough to permit different and important successional stages to co-exist. Small, isolated woodlands are more susceptible to the effects of blowdown, drought, disease, insect infestations, and invasions by predators and non-indigenous plants. It is also known that the viability of woodland wildlife depends not only on the characteristics of the woodland in which they reside, but also on the characteristics of the surrounding landscape where the woodland is situated. Additionally, the percentage of forest cover in the surrounding landscape, the presence of ecological barriers such as roads, the ability of various species to cross the matrix surrounding the woodland and the proximity of adjacent habitats interact with woodland size in influencing the species assemblage within a woodland.
In the Dales Creek catchment (in 2014), thirty-seven (41 percent) of the 91 woodland patches are very small, being less than one hectare in size. Another 35 (38 percent) of the woodland patches ranging from one to less than 20 hectares in size tend to be dominated by edge-tolerant bird species. The remaining 19 (21 percent of) woodland patches range between 24 and 321 hectares in size. Fifteen of these patches contain woodland between 20 and 100 hectares and may support a few area-sensitive species and some edge intolerant species, but will be dominated by edge tolerant species.
Conversely, four (four percent) of the 91 woodland patches in the drainage area exceed the 100 plus hectare size needed to support most forest dependent, area sensitive birds and are large enough to support approximately 60 percent of edge-intolerant species. Two patches top 200 hectares, which according to the Environment Canada Guideline will support 80 percent of edge-intolerant forest bird species (including most area sensitive species) that prefer interior forest habitat conditions.
Table 14 presents a comparison of woodland patch size in 2008 and 2014 along with any changes that have occurred over that time. A decrease (of 13 ha) has been observed in the overall woodland patch area between the two reporting periods with most change occurring in the 100 to 200 hectare woodland patch size class range.
Table 14 Woodland patches in the Dales Creek catchment (2008 and 2014)
*Includes treed swamps
Forest Interior
The forest interior is habitat deep within woodlands. It is a sheltered, secluded environment away from the influence of forest edges and open habitats. Some people call it the “core” or the “heart” of a woodland. The presence of forest interior is a good sign of woodland health, and is directly related to the woodland’s size and shape. Large woodlands with round or square outlines have the greatest amount of forest interior. Small, narrow woodlands may have no forest interior conditions at all. Forest interior habitat is a remnant natural environment, reminiscent of the extensive, continuous forests of the past. This increasingly rare forest habitat is now a refuge for certain forest-dependent wildlife; they simply must have it to survive and thrive in a fragmented forest landscape (Conserving the Forest Interior. Ontario Extension Notes, 2000).
The Natural Heritage Reference Manual states that woodland interior habitat is usually defined as habitat more than 100 metres from the edge of the woodland and provides for relative seclusion from outside influences along with a moister, more sheltered and productive forest habitat for certain area sensitive species. Woodlands with interior habitat have centres that are more clearly buffered against the edge effects of agricultural activities or more harmful urban activities than those without.
In the Dales Creek catchment (in 2014), the 91 woodland patches contain 56 forest interior patches (Figure 57) that occupy 11 percent (423 ha.) of the catchment land area (which is greater than the five percent of interior forest in the Middle Rideau Subwatershed). This is above the ten percent figure referred to in the Environment Canada Guideline that is considered to be the minimum threshold for supporting edge intolerant bird species and other forest dwelling species in the landscape.
Most patches (47) have less than 10 hectares of interior forest, 26 of which have small areas of interior forest habitat less than one hectare in size. The remaining nine patches contain interior forest ranging between 16 and 121 hectares in area.
Between 2008 and 2014, there has been a change in the number of woodland patches containing smaller areas of interior habitat (Table 15). For example, there has been an increase of 19 woodlands containing less than one hectare of interior forest over this period and 12 woodlands with one to 10 hectares of interior habitat.
Table 15 Woodland interior in the Dales Creek catchment (2008 and 2014)
Wetland Cover
Wetlands are habitats forming the interface between aquatic and terrestrial systems. They are among the most productive and biologically diverse habitats on the planet. By the 1980s, according to the Natural Heritage Reference Manual, 68 percent of the original wetlands south of the Precambrian Shield in Ontario had been lost through encroachment, land clearance, drainage and filling.
Wetlands perform a number of important ecological and hydrological functions and provide an array of social and economic benefits that society values. Maintaining wetland cover in a watershed provides many ecological, economic, hydrological and social benefits that are listed in the Reference Manual and which may include:
- contributing to the stabilization of shorelines and to the reduction of erosion damage through the mitigation of water flow and soil binding by plant roots
- mitigating surface water flow by storing water during periods of peak flow (such as spring snowmelt and heavy rainfall events) and releasing water during periods of low flow (this mitigation of water flow also contributes to a reduction of flood damage)
- contributing to an improved water quality through the trapping of sediments, the removal and/or retention of excess nutrients, the immobilization and/or degradation of contaminants and the removal of bacteria
- providing renewable harvesting of timber, fuel wood, fish, wildlife and wild rice
- contributing to a stable, long-term water supply in areas of groundwater recharge and discharge
- providing a high diversity of habitats that support a wide variety of plants and animals
- acting as “carbon sinks” making a significant contribution to carbon storage
- providing opportunities for recreation, education, research and tourism
Historically, the overall wetland coverage within the Great Lakes basin exceeded 10 percent, but there was significant variability among watersheds and jurisdictions, as stated in the Environment Canada Guideline. In the Rideau Valley Watershed, it has been estimated that pre-settlement wetland cover averaged 35 percent using information provided by Ducks Unlimited Canada (2010) versus the 21 percent of wetland cover existing in 2014 derived from DRAPE imagery analysis.
Using the same dataset, it is estimated that pre-settlement (historic) wetland cover averaged 32 percent in the Middle Rideau subwatershed versus the 27 percent of cover existing in 2014. This decline in wetland cover is not evident in the Dales Creek catchment (as seen in Figure 58) where there has been a very slight increase (of less than one percent) in the area of wetland cover from pre-settlement times to the present (as summarized in Table 16).
Figure 58 Catchment wetland cover
While there has been a reported increase in wetland cover in the Dales Creek catchment from pre-settlement times and wetland cover in 2014 remains above the ecological thresholds cited in the Environment Canada Guideline, a “no net loss” of currently existing wetlands should be employed to maintain critical hydrological and ecological functions and to ensure the continued provision of related recreational and economic benefits provided by these wetland habitats in the catchment for landowners and surrounding communities.
Table 16 Wetland cover in the Middle Rideau subwatershed and Dales Creek catchment (Historic to 2014)
5. Stewardship and Protection
The RVCA and its partners are working to protect and enhance environmental conditions in the Middle Rideau Subwatershed. Figure 59 shows the location of all stewardship projects completed in the Dales Creek catchment along with sites identified for potential shoreline restoration.
Rural Clean Water Projects
From 2009 to 2014, two well decommissionings were completed for a total project value of $2,260 with $1,900 of that amount funded through grant dollars from the RVCA. No projects were carried out before 2009 in the catchment.
Figure 59 Stewardship and potential restoration locations
Tree Planting Projects
The location of RVCA Tree Planting Program projects is shown in Figure 59. From 2009 to 2014, 24,600 trees were planted at three sites. Prior to 2003, 4,000 trees were planted at one site, resulting in the reforestation of 14 hectares. Total value of all four projects is $99,734 with $31,143 of that amount coming from various fundraising sources. No projects were carried out in the catchment between 2003 and 2008.
Through the RVCA Butternut Recovery Program, an additional 10 butternut trees were planted in the Dales Creek catchment between 2009 and 2014, as part of efforts to introduce healthy seedlings from tolerant butternuts into various locations across Eastern Ontario.
Valley, Stream, Wetland and Hazard Land Regulation
The Dales Creek catchment covers 39 square kilometres with 10.5 square kilometres (or 27 percent) of the drainage area being within the regulation limit of Ontario Regulation 174/06 (Figure 60), giving protection to wetland areas and river or stream valleys that are affected by flooding and erosion hazards.
Wetlands occupy 12.5 sq. km. (or 32 percent) of the catchment. Of these wetlands, 7.1 sq. km (or 57 percent) are designated as provincially significant and included within the RVCA regulation limit. This leaves the remaining 5.4 sq. km (or 43 percent) of wetlands in the catchment outside the regulated area limit.
Of the 46.5 kilometres of stream in the catchment, regulation limit mapping has been plotted along 17.5 kilometers of streams (representing 38 percent of all streams in the catchment). Some of these regulated watercourses (15.5 km or 33 percent of all streams) flow through regulated wetlands; the remaining 2 km (or 11 percent) of regulated streams are located outside of those wetlands. Plotting of the regulation limit on the remaining 29 km (or 62 percent) of streams requires identification of flood and erosion hazards and valley systems.
Within the regulation limit, “development” and “site alteration” require RVCA permission. The “alteration to waterways” provision of Ontario Regulation 174/06 applies to all watercourses.
Figure 60 RVCA regulation limits
Vulnerable Drinking Water Areas
The Dales Creek drainage catchment is considered to have a Highly Vulnerable Aquifer. This means that the nature of the overburden (thin soils, fractured bedrock) does not provide a high level of protection for the underlying groundwater making the aquifer more vulnerable to contaminants released on the surface. The Mississippi-Rideau Source Protection Plan includes policies that focus on the protection of groundwater region-wide due to the fact that most of the region, which encompasses the Mississippi and Rideau watersheds, is considered Highly Vulnerable Aquifer. For detailed maps and policies that have been developed to protect drinking water sources, please go to the Mississippi-Rideau Source Protection Region website at www.mrsourcewater.ca to view the Mississippi-Rideau Source Protection Plan.
6. Challenges/Issues
Water Quality
-
Surface water quality along Dales Creek is “Fair” over two reporting periods (2003-2008 and 2009-2014) as determined by surface water chemistry data. Frequent exceedances of total Kjeldahl nitrogen and occasional exceedances of total phosphorous, E.coli, aluminum, copper and iron contributed to the rating
-
Instream (biological) water quality conditions at the Dales Creek sample location range from “Poor” to “Good” from 2003 to 2014 (using a grading scheme developed by Ontario Conservation Authorities in Ontario for benthic invertebrates) with an overall benthic invertebrate water quality rating of “Poor” to “Good” determined for this period
Shorelines
- Emerald ash borer poses a significant threat to the ecology of the subwatershed, given the prominence of ash trees along shorelines and in riparian and wetland areas. Many tree stands are predominantly ash and with their anticipated loss, it is unclear what will replace them and the overall effect of their collective demise on the physical and natural functions/values they provide for erosion, water quality and fish and wildlife habitat protection
Land Cover
- The catchment contains 250 ha of unevaluated wetland (occupying six percent of its total area) that provides many important social, hydrological, biological and ecological functions/services. Although not under imminent threat from development activity, they do remain vulnerable to drainage and land clearing activities in the absence of any regulatory and planning controls that would otherwise protect them
7. Opportunities/Actions
Water Quality
- Investigate “Fair” surface water quality rating along Dales Creek and its tributaries
- Implement agricultural and residential best management practices to address the elevated total Kjeldahl nitrogen concentrations and occasional high bacterial counts and metal exceedances on Dales Creek by restricting livestock access to the creek, limiting the use of fertilizers and pesticide applications and improving or maintaining a shoreline buffer
- Continue to offer the suite of water quality improvement projects provided by the Rideau Valley Rural Clean Water Program to landowners
- Continue to protect Dales Creek and its tributaries through implementation of municipal and agency land use planning and development policies and practices
Shorelines/Headwaters
- Continue to promote the Rideau Valley Shoreline Naturalization and Tree Planting Programs to landowners
- RVCA and its partners (Village of Merrickville-Wolford, Municipality of North Grenville) are to continue educating landowners about the value and importance of headwater drainage features, natural shorelines and waterfront property best management practices with respect to shoreline use and development, septic system installation and maintenance and shoreline vegetation retention and enhancement
- Protect the riparian buffer along the shoreline of Dales Creek and other catchment streams (headwaters) during the development approvals process through adherence to and enforcement of municipal land-use policies and zoning standards
- Target shoreline restoration at sites identified in this report (shown as “Other riparian land cover” in Figure 16 and “Potential Riparian/Shoreline Restoration” in Figure 55) and explore other restoration and enhancement opportunities along Dales Creek and its tributaries
Development
- Municipalities and agencies are encouraged to strengthen natural heritage and water resources official plan policies and zoning provisions (water setbacks, frontage and naturalized shorelines and wetland protection) where deemed appropriate
- Collectively work with approval authorities (Village of Merrickville-Wolford, Municipality of North Grenville, Conservation Authority) to consistently implement current land use planning and development policies for water quality and shoreline protection adjacent to Dales Creek and other catchment streams (e.g., a minimum 30 metre development setback from water)
- Explore ways and means to more effectively enforce and implement conditions of land-use planning and development approval to achieve net environmental gains (particularly with respect to rehabilitating or protecting naturally vegetated shorelines and water quality)
- Utilize RVCA subwatershed and catchment reports to help develop/revise official plan policies to protect surface water resources and the natural environment (including woodlands, wetlands and shoreline cover)
- Consider establishing RVCA regulations limits to protect additional wetlands
Full Catchment Report
Middle Rideau Subwatershed Report 2015
HUTTON CREEK CATCHMENT
The RVCA produces individual reports for ten catchments in the Middle Rideau subwatershed. Using data collected and analysed by the RVCA through its watershed monitoring and land cover classification programs, surface water quality conditions are reported for Hutton Creek along with a summary of environmental conditions for the surrounding countryside every six years.
This information is used to better understand the effects of human activity on our water resources, allows us to better track environmental change over time and helps focus watershed management actions where they are needed the most to help sustain the ecosystem services (cultural, aesthetic and recreational values; provisioning of food, fuel and clean water; regulation of erosion/natural hazard protection and water purification; supporting nutrient/water cycling and habitat provision) provided by the catchment’s lands and forests and waters (Millennium Ecosystem Assessment 2005).
The following pages of this report are a compilation of that work and contain information on surface water quality, riparian conditions, land cover, stewardship activity and hazard land and water resources protection.
1. Catchment Facts
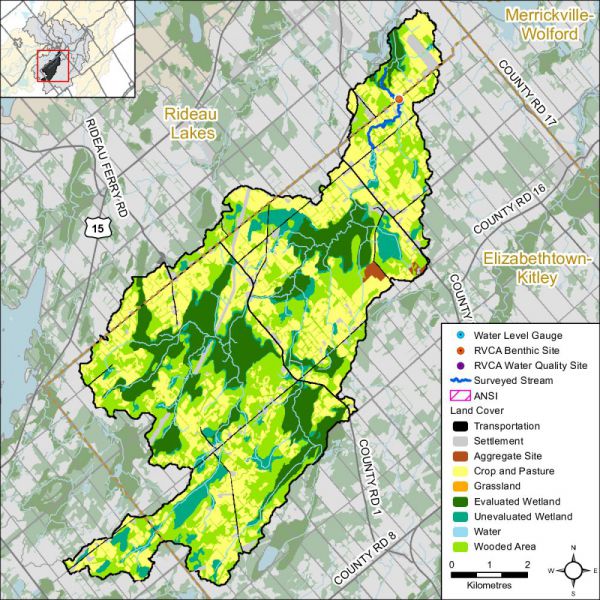
General Geography
- The Rideau River flows through the heart of the Middle Rideau and is a focal point for residents and visitors to the area. It extends from the outlet of Lower Rideau Lake at Poonamalie (where there is one dam and one lock) to Burritts Rapids (where there is also a dam and lock), at which point it enters the Lower Rideau on its way to Rideau Falls. The Rideau River is also an integral part of the Rideau Canal National Historic Site of Canada and is a significant tourist attraction which draws boaters, cottagers, and campers to the area
- Smiths Falls, Merrickville and Burritts Rapids are the main settlements in the Middle Rideau subwatershed. The Hutton Creek catchment is predominantly rural in character with agriculture being the main land use
- Parks Canada staff manage water levels for recreational purposes along the Rideau Canal/Waterway that flows by the catchment, ensuring 1.5 metres of draft during the navigation season. In this managed system, water levels on the Rideau Canal are manipulated by operation of numerous dams. In the Middle Rideau subwatershed, Parks Canada staff operate 9 dam and lock complexes with 13 locks for a fall of 36.2 metres over 35.6 kilometres. Water levels are maintained as close as possible to set objectives through the May to October navigation season. The levels are lowered through the rest of October and into November and held at the winter levels until the spring freshet in late March or early April naturally increases inflows to the system. To reduce the impact of the higher flows in the spring, the amount of snow water equivalent, forecast rain, ice cover, flows and levels are assessed and the dams in the Middle Rideau reach are operated accordingly to quickly pass as much water as possible. In late April and early May, the dams are gradually closed and water levels are brought up to be ready, once again, for the navigation season
Physical Geography
- All of Hutton Creek Catchment and the rest of the Middle Rideau Subwatershed primarily resides within the Smith Falls Limestone Plain. The northern part of this catchment is underlain by dolostone of the Oxford Formation; while the central catchment is underlain by the quartz sandstone and dolostone of the March Formation and a small section of the upper watershed is underlain by the Nepean Formation sandstones. The bedrock across the catchment is mainly overlain by a thin veneer of glacial sediment, referred to as ‘drift’ that is generally less than a metre in thickness; although the landscape is also dotted with organic soils and some glacial till and sand. A geologic fault likely cut through the western part of the catchment
- Eighty-six percent of the catchment lies within the Township of Elizabethtown-Kitley and 14 percent within the Township of Rideau Lakes
- Hutton Creek catchment drainage area is 62 square kilometres and occupies seven percent of the Middle Rideau subwatershed and one percent of the Rideau Valley watershed
- Parks Canada staff manage water levels for recreational purposes along the Rideau Canal/Waterway that flows by the catchment, ensuring 1.5 metres of draft during the navigation season. In this managed system, water levels on the Rideau Canal are manipulated by operation of numerous dams. In the Middle Rideau subwatershed, Parks Canada staff operate 9 dam and lock complexes with 13 locks for a fall of 36.2 metres over 35.6 kilometres. Water levels are maintained as close as possible to set objectives through the May to October navigation season. The levels are lowered through the rest of October and into November and held at the winter levels until the spring freshet in late March or early April naturally increases inflows to the system. To reduce the impact of the higher flows in the spring, the amount of snow water equivalent, forecast rain, ice cover, flows and levels are assessed and the dams in the Middle Rideau reach are operated accordingly to quickly pass as much water as possible. In late April and early May, the dams are gradually closed and water levels are brought up to be ready, once again, for the navigation season
Vulnerable Areas
- The Assessment Report developed under the Ontario Clean Water Act identifies the upper bedrock aquifer underlying all of the catchment area as a Highly Vulnerable Aquifer, although, where sediments are thicker in a local area, the vulnerability would be less. It also identifies the area of Nepean Sandstone found at the surface in this catchment as a Significant Groundwater Recharge area along with a small part of the Village of Merrickville municipal Wellhead Protection Area
Development
- Land uses in the catchment are Rural with Natural Heritage-Provincially Significant Wetland along with some Agriculture
Conditions at a Glance
Water Quality
- Surface chemistry water quality rating in Hutton Creek is “Fair” over two reporting periods (2003-2008 and 2009-2014). Elevated bacterial counts and nutrient concentrations from inflows of nutrients (from private septic systems, agricultural and residential surface water runoff) are a feature of Hutton Creek. Decreased nutrient and bacterial counts are needed to improve the overall health of the creek
- Instream biological water quality conditions at the Hutton Creek sample location range from “Fair” to “Poor” from 2010 to 2014 (using a grading scheme developed by Ontario Conservation Authorities in Ontario for benthic invertebrates) with an overall benthic invertebrate water quality rating of “Fair” determined for this period
Instream and Riparian
- In the Hutton Creek catchment, the riparian buffer (30 m. wide strip along the shoreline of all lakes and streams) is comprised of wetland (67 percent), woodland (16 percent), crop and pastureland (15 percent), roads (one percent) and settlement areas (one percent)
- Overall instream and riparian condition for the Hutton Creek catchment as assessed by the stream characterization and headwater drainage feature assessment programs show that Hutton Creek and its tributaries are in good condition. The majority of the system has low erosion levels, a healthy riparian corridor with good instream diversity of aquatic habitat
- The Hutton Creek catchment has 14 species of recreational and bait fish and is classified as having a warm/cool water thermal guild that supports the Hutton Creek/Rideau River fishery
Land Cover
- Dominant land cover is crop and pastureland (37 percent), followed by woodland (30 percent), wetland (27 percent), settlement areas (four percent) and roads (two percent). From 2008 to 2014, there was an overall change of 73 hectares (from one land cover class to another). Within the Hutton Creek catchment, change is primarily associated with the conversion of crop and pastureland to settlement (a large solar farm) and transition into woodland along with wetland encroaching into woodland
- Woodland cover in the catchment has decreased by 11 hectares between 2008 and 2014 and interior forest habitat has decreased by 26 hectares
- Wetland cover has decreased by one percent (95 ha) from pre-settlement times to the present and now occupies 27 percent of the catchment area
Other
- There are approximately 230 in-use water wells with provincial records in this catchment. While most water wells are used for domestic water supply, in this catchment, several are also used for commercial, agricultural, and public water supplies; cooling; or monitoring
- There are no active Permits to Take Water or Environmental Compliance Approvals in the catchment
- There are two bedrock aggregate licenses located in this catchment
Catchment Care
- Thirty-two stewardship projects have been completed with assistance from the RVCA’s Rural Clean Water and Tree Planting Programs (see Section 5 of this report for details)
- Hutton Creek surface water quality has been monitored by the RVCA through its Baseline Monitoring Program since 2003. The surface water quality at site HUT-02 is monitored once a month from April to November
- RVCA has been collecting benthic invertebrates in Hutton Creek at the Kitley South Elmsley Line site since 2010
- RVCA conducted a fish survey along Hutton Creek in 2014
- RVCA completed a the stream characterization survey on Hutton Creek in 2014, working upstream to the headwaters from the mouth of the creek where it empties into the Rideau River taking measurements and recording observations on instream habitat, bank stability, other attributes and preparing a temperature profile
- RVCA completed six headwater drainage feature assessments at road crossings in the Hutton Creek catchment in 2014.Tthis protocol measures zero and first order headwater drainage features and is a rapid assessment method characterizing the amount of water, sediment transport, and storage capacity within headwater drainage features
- A watershed model developed by the RVCA in 2009 was used to study the hydrologic function of wetlands in the Rideau Valley Watershed, including those found in the Hutton Creek catchment
- RVCA has built a new “berm-like” water control structure at Motts Mills, replacing the older, non-operational “stop-log” structure dating from 1952. This will now permit the manipulation of water levels in the Hutton Creek Provincially Significant Wetland (located behind the new structure), as outlined in the wetland management plan and water control structure operational plan describing that activity
- The Township of Elizabethtown-Kitley and the Township of Rideau Lakes have land use planning policies and zoning provisions - on water setbacks, frontage and naturalized shorelines and wetland protection - and in some instances use site plan control to implement these policies and provisions. Together with RVCA, these municipalities work with landowners on a case by case basis to enable new development while ensuring the scale is suitable on the lot, impacts on neighbours are minimized and development maximizes the watercourse setback
- Development in and adjacent to the Provincially Significant Wetlands in the catchment (Otter Creek, Otter Lake-Hutton Creek Complex) are subject to Ontario Regulation 174-06 (entitled “Development, Interference with Wetlands and Alterations to Shorelines and Watercourses”) that protects the hydrologic function of the wetland and also protects landowners and their property from natural hazards (flooding, fluctuating water table, unstable soils) associated with them
2. Surface Water Quality Conditions
Surface water quality conditions in the Hutton Creek catchment are monitored by the Rideau Valley Conservation Authority’s (RVCA) Baseline Water Quality Monitoring Program. The Baseline Water Quality Program focuses on streams; data is collected for 22 parameters including nutrients (total phosphorus, total Kjeldahl nitrogen and ammonia), E. coli, metals (like aluminum and copper) and additional chemical/physical parameters (such as alkalinity, chlorides, pH and total suspended solids). Figure 1 shows the location of the monitoring site in the catchment.
Figure 1 Water quality monitoring site on Hutton Creek
Hutton Creek Water Quality
Water Quality Rating
The water quality rating for the Hutton Creek catchment is “Fair” (Table 1) as determined by the Canadian Council of Ministers of the Environment (CCME) Water Quality Index and is largely influenced by high nutrient concentrations, metals and high bacterial counts. A "Fair" rating indicates that water quality is usually protected but is occasionally threatened or impaired; conditions sometimes depart from natural or desirable levels. Each parameter is evaluated against established guidelines to determine water quality conditions. Those parameters that frequently exceed guidelines are presented below. Analysis of the data has been broken into two periods; 2003 to 2008 and 2009 to 2014 for the stream monitoring site located on Hutton Creek (HUT-02) to examine if conditions have changed between these periods. Table 1 shows the overall rating for the monitored surface water quality site within the Hutton Creek catchment and Table 2 outlines the Water Quality Index (WQI) scores and their corresponding ratings.
Table 1 Water Quality Index Ratings for the Hutton Creek catchment
Table 2 WQI Ratings and corresponding index scores (RVCA terminology, original WQI category names in brackets)
Nutrients
Total phosphorus (TP) is used as a primary indicator of excessive nutrient loading and may contribute to abundant aquatic vegetation growth and depleted dissolved oxygen levels. The Provincial Water Quality Objective (PWQO) is used as the TP Guideline and states that in streams concentrations greater than 0.030 mg/l indicate an excessive amount of TP.
Total Kjeldahl nitrogen (TKN) and ammonia (NH3) are used as secondary indicators of nutrient loadings. RVCA uses a guideline of 0.500 mg/l to assess TKN[1] and the PWQO of 0.020 mg/l to assess NH3 concentrations in Hutton Creek.
Tables 3, 4 and 5 summarize average nutrient concentrations at monitored sites within the Creek catchment and show the proportion of results that meet the guidelines.
Table 3 Summary of total phosphorus results for Hutton Creek, 2003-2008 and 2009-2014. Highlighted values indicate average concentrations exceed the guideline
Table 4 Summary of total Kjeldahl Nitrogen results for Hutton Creek, 2003-2008 and 2009-2014. Highlighted values indicate average concentrations exceed the guideline
Table 5 Summary of Ammonia results for Dales Creek, 2003-2008 and 2009-2014
Elevated TP results were a regular occurrence at site HUT-02; 45 percent of samples were below the guideline in the 2003-2008 period (Figure 2); this increased to 65 percent of samples in the 2009-2014 period (Figure 3). The average TP concentration increased slightly from 0.035 mg/l (2003- 2008) to 0.037 mg/l (2009-2014).
Figure 2 Total phosphorous concentrations in Hutton Creek, 2003-2008
Figure 3 Total phosphorous concentrations in Hutton Creek, 2008-2014
The bulk of TKN results have exceeded the guideline (Figure 4 and 5), with 15 percent of samples below the guideline in the 2003-2008 period and only 5 percent of samples below the guideline from 2009-2014. The average concentration increased from 0.846 mg/l in 2003-2008 to 0.901 in 2009-2014 mg/l (Table 4).
Figure 4 Total Kjeldahl nitrogen concentrations in Hutton Creek, 2003-2008
Figure 5 Total Kjeldahl nitrogen concentrations in Hutton Creek, 2009-2014
NH3 results occasionally exceeded the RVCA guideline. The proportion of results that were below the guideline were 67 percent in 2003-2008 (Figure 6); this increased to 83 percent in the 2009-2014 reporting periods (Figure 7). The average NH3 concentration decreased from 0.025 mg/l to 0.008 mg/l (Table 5).
Figure 6 Ammonia concentrations in Hutton Creek, 2003-2008
Figure 7 Ammonia concentrations in Hutton Creek, 2008-2014
Summary
The data shows that nutrient enrichment is a feature of Hutton Creek. Average nutrient concentrations with the exception of Ammonia all slightly increased over the two reporting periods. Elevated nutrients may result in nutrient loading downstream. High nutrient concentrations can help stimulate the growth of algae blooms and other aquatic vegetation in a waterbody and deplete oxygen levels as the vegetation dies off. Best management practices such as an enhanced shoreline buffer, preventing the use of fertilizers and restricting cattle access can help to reduce nutrient enrichment in Hutton Creek.
E. Coli
E. coli is used as an indicator of bacterial pollution from human or animal waste; in elevated concentrations it can pose a risk to human health. The PWQO of 100 colony forming units/100 millilitres (CFU/100 ml) is used. E. coli counts greater than this guideline indicate that bacterial contamination may be a problem within a waterbody.
Table 6 summarizes the geometric mean[2] for the monitored site on Hutton Creek and shows the proportion of samples that meet the E. coli guideline of 100 CFU/100 ml. The results of the geometric mean with respect to the guideline for the two periods, 2003-2008 and 2009- 2014, are shown in Figures 8 and 9 respectively.
Table 6 Summary of E. coli results for Hutton Creek, 2003-2008 and 2009-2014
E. coli counts at site HUT-02 indicate a slight improvement with regard to bacterial contamination. The proportion of samples below the guideline increased from 40 percent (Figure 8) to 42 percent (Figure 9). The count at the geometric mean decreased from 136 CFU/100ml in 2003-2008 to 121 CFU/100ml (Table 6). Although the count at the geometric mean decreased, the results exceeded the guideline for both reporting periods.
Figure 8 Geometric mean of E.coli results in Hutton Creek, 2003-2008
Figure 9 Geometric mean of E.coli results in Hutton Creek, 2009-2014
Summary
This data shows that bacterial contamination is a concern on Hutton Creek. There has been a slight improvement from the 2003-2008 to the 2009-2014 monitoring period, however the count at the geometric mean is above the PWQO for both monitoring periods. Properly maintaining septic systems, enhancing shoreline buffers and restricting cattle access can help to improve E.coli levels in Hutton Creek.
Metals
Of the metals routinely monitored in Hutton Creek, aluminum (Al) and iron (Fe) occasionally reported concentrations above their respective PWQOs. In elevated concentrations, these metals can have toxic effects on sensitive aquatic species.
Tables 7and 8 summarize metal concentrations at site HUT-02 and show the proportion of samples that meet guidelines. Figures 10 to 13 show metal concentrations with respect to the guidelines for the two periods of interest, 2003–2008 and 2009–2014. For Al, the PWQO is 0.075 mg/l and Fe it is 0.300 mg/l.
Table 7 Summary of aluminum results for Hutton Creek from 2003-2008 and 2009-2014
Table 8 Summary of iron concentrations for Hutton Creek from 2003-2008 and 2009-2014
Results from HUT-02 shows that Al concentrations had few exceedances with 84 percent of samples below the guideline in the 2003-2008 period (Figure 10). This improved to 100 percent of samples in the 2009-2014 period (Figure 11). The average concentrations for both reporting periods were below the guideline. Aluminum results from 2003-2008 were 0.076 mg/l and from 2009-2014 the average concentration improved to 0.013 mg/l (Table 7).
Figure 10 Average aluminum concentrations in Hutton Creek, 2003-2008
Figure 11 Average aluminum concentrations in Hutton Creek, 2009-2014
Iron concentrations only exceeded the PWQO guideline occassioanly during the monitoring periods. The proportion of samples below the guideline increased from 80 percent to 96 percent (Figures 12 and 13). Although there were observed exceedances, the average Fe concentration did not exceed the guideline in both monitoring periods; 0.271 mg/l in 2003-2008 and .080 mg/l in 2009-2014.
Figure 12 Average iron concentrations in Hutton Creek, 2003-2008
Figure 13 Average iron concentrations in Hutton Creek, 2009-2014
Summary
Overall, a general decline in metal concentrations was observed between the two periods of interest. Efforts should continue to be made to identify pollution sources and implement best management practices to reduce any inputs such as runoff, metal alloys, fungicides and pesticides to improve overall stream health and lessen downstream impacts.
[1] No Ontario guideline for TKN is presently available; however, waters not influenced by excessive organic inputs typically range from 0.100 to 0.500 mg/l, Environment Canada (1979) Water Quality Sourcebook, A Guide to Water Quality Parameters, Inland Waters Directorate, Water Quality Branch, Ottawa, Canada
[2] A type of mean or average, which indicates the central tendency or typical value of a set of numbers by using the product of their values (as opposed to the arithmetic mean which uses their sum). It is often used to summarize a variable that varies over several orders of magnitude, such as E. coli counts.
3. Hutton Creek Riparian Conditions
Shoreline Buffer Land Cover Evaluation
The riparian or shoreline zone is that special area where the land meets the water. Well-vegetated shorelines are critically important in protecting water quality and creating healthy aquatic habitats, lakes and rivers. Natural shorelines intercept sediments and contaminants that could impact water quality conditions and harm fish habitat in streams. Well established buffers protect the banks against erosion, improve habitat for fish by shading and cooling the water and provide protection for birds and other wildlife that feed and rear young near water. A recommended target (from Environment Canada’s Guideline: How Much Habitat is Enough?) is to maintain a minimum 30 metre wide vegetated buffer along at least 75 percent of the length of both sides of rivers, creeks and streams.
Figure 14 shows the extent of the naturally vegetated riparian zone along a 30 metre wide strip of shoreline of Hutton Creek and its tributaries. This information is derived from a dataset developed by the RVCA’s Land Cover Classification Program through heads-up digitization of 20cm DRAPE ortho-imagery at a 1:4000 scale, which details the catchment landscape using 10 land cover classes.
Figure 14 Natural and other riparian land cover in the Hutton Creek catchment
This analysis shows that the riparian buffer in the Hutton Creek catchment is comprised of wetland (67 percent), woodland (16 percent), crop and pastureland (15 percent), roads (one percent) and settlement areas (one percent). Additional statistics for the Hutton Creek catchment are presented in Table 9 and show that there has been very little change in shoreline cover from 2008 to 2014.
Table 9 Riparian land cover (2008 vs. 2014 in the Hutton Creek catchment
Hutton Creek Overbank Zone
Riparian Buffer Width Evaluation
Figure 15 demonstrates the buffer conditions of the left and right banks separately. Hutton Creek had a buffer of greater than 30 meters along 85 percent of the right bank and 89 percent of the left bank.
Figure 15 Riparian buffer evaluation along Hutton Creek
Adjacent Land Use
The RVCA’s Stream Characterization Program identifies eight different land uses beside Hutton Creek (Figure 16). Surrounding land use is considered from the beginning to end of the survey section (100m) and up to 100m on each side of the creek. Land use outside of this area is not considered for the surveys but is nonetheless part of the subwatershed and will influence the creek. Natural areas made up 88 percent of the stream, characterized by wetlands, forest, scrubland and meadow. The remaining land use consisted of pasture, active agriculture, recreational and infrastructure in the form of road crossings.
Figure 16 Land use along Hutton Creek
Hutton Creek Shoreline Zone
Instream Erosion
Erosion is a normal, important stream process and may not affect actual bank stability; however, excessive erosion and deposition of sediment within a stream can have a detrimental effect on important fish and wildlife habitat. Poor bank stability can greatly contribute to the amount of sediment carried in a waterbody as well as loss of bank vegetation due to bank failure, resulting in trees falling into the stream and the potential to impact instream migration. Figure 17 shows low levels of erosion was observed along Hutton Creek.
Figure 17 Erosion along Hutton Creek
Undercut Stream Banks
Undercut banks are a normal and natural part of stream function and can provide excellent refuge areas for fish. Figure 18 shows that Hutton Creek had low levels of undercut banks.
Figure 18 Undercut stream banks along Hutton Creek
Stream Shading
Grasses, shrubs and trees all contribute towards shading a stream. Shade is important in moderating stream temperature, contributing to food supply and helping with nutrient reduction within a stream. Figure 19 shows variable stream shading conditions ranging from low levels to high levels along Hutton Creek.
Figure 19 Stream shading along Hutton Creek
Instream Woody Debris
Figure 20 shows that the majority of Hutton Creek had low to moderate levels of instream woody debris in the form of branches and trees. Instream woody debris is important for fish and benthic invertebrate habitat, by providing refuge and feeding areas.
Figure 20 Instream woody debris along Hutton Creek
Overhanging Trees and Branches
Figure 21 shows low to high levels of overhanging branches and trees along Hutton Creek. Overhanging branches and trees provide a food source, nutrients and shade which helps to moderate instream water temperatures.
Figure 21 Overhanging trees and branches along Hutton Creek
Anthropogenic Alterations
Figure 22 shows 94 percent of Hutton Creek remains “unaltered” with no anthropogenic alterations. Six percent of Hutton Creek was classified as natural with minor anthropogenic changes in the form of road crossings.
Figure 22 Anthropogenic alterations along Hutton Creek
Hutton Creek Instream Aquatic Habitat
Benthic Invertebrates
Freshwater benthic invertebrates are animals without backbones that live on the stream bottom and include crustaceans such as crayfish, molluscs and immature forms of aquatic insects. Benthos represent an extremely diverse group of aquatic animals and exhibit wide ranges of responses to stressors such as organic pollutants, sediments and toxicants, which allows scientists to use them as bioindicators. As part of the Ontario Benthic Biomonitoring Network (OBBN), the RVCA has been collecting benthic invertebrates at the Kitley South Elmsley Line site on Hutton Creek since 2010. Monitoring data is analyzed for each sample site and the results are presented using the Family Biotic Index, Family Richness and percent Ephemeroptera, Plecoptera and Trichoptera.
Hilsenhoff Family Biotic Index
The Hilsenhoff Family Biotic Index (FBI) is an indicator of organic and nutrient pollution and provides an estimate of water quality conditions for each site using established pollution tolerance values for benthic invertebrates. The Hutton Creek sample location was added to the OBBN network in 2010. As a result FBI results for Hutton Creek are limited to the most recent reporting period of 2010 to 2014. “Poor” to “Good” water quality conditions were observed at the Hutton Creek sample location for the period of 2010 to 2014 (Fig.23) using a grading scheme developed by Conservation Authorities in Ontario for benthic invertebrates.
Figure 23 Hilsenhoff Family Biotic Index on Hutton Creek
Family Richness
Family Richness measures the health of the community through its diversity and increases with increasing habitat diversity suitability and healthy water quality conditions. Family Richness is equivalent to the total number of benthic invertebrate families found within a sample. Hutton Creek is reported to have “Fair” to “Good” levels for family richness (Fig.24).
Figure 24 Family Richness in Hutton Creek
EPT
Ephemeroptera (Mayflies), Plecoptera (Stoneflies), and Trichoptera (Caddisflies) are species considered to be very sensitive to poor water quality conditions. High abundance of these organisms is generally an indication of good water quality conditions at a sample location. The community structure is mixed with species that are sensitive, moderately tolerant and tolerant to poor water quality conditions. As a result, the EPT indicates that Hutton Creek is reported to have “Poor” to “Fair” water quality (Fig.25) from 2010 to 2014.
Figure 25 EPT in Hutton Creek
Conclusion
Overall aquatic habitat conditions from a benthic invertebrate perspective for Hutton Creek range from “Fair” to “Poor” from 2010 to 2014.
Habitat Complexity
Streams are naturally meandering systems and move over time; there are varying degrees of habitat complexity, depending on the creek. Examples of habitat complexity include variable habitat types such as pools and riffles as well as substrate variability and woody debris structure. A high percentage of habitat complexity (heterogeneity) typically increases the biodiversity of aquatic organisms within a system. Seventy one percent of Hutton Creek was considered heterogeneous, as shown in Figure 26.
Figure 26 Habitat complexity along Hutton Creek
Instream Substrate
Diverse substrate is important for fish and benthic invertebrate habitat because some species have specific substrate requirements and for example will only reproduce on certain types of substrate. Figure 27 shows that 25 percent of the substrate observed on Hutton Creek was dominated by cobble. Overall substrate conditions were highly variable along Hutton Creek. Figure 28 shows the dominant substrate type observed for each section surveyed along Hutton Creek.
Figure 27 Instream substrate along Hutton Creek
Figure 28 Dominant Instream substrate along Hutton Creek
Cobble and Boulder Habitat
Boulders create instream cover and back eddies for large fish to hide and/or rest out of the current. Cobble provides important spawning habitat for certain fish species like walleye and various shiner species who are an important food source for larger fish. Cobble can also provide habitat conditions for benthic invertebrates that are a key food source for many fish and wildlife species. Figure 29 shows where cobble and boulder substrate are found in Hutton Creek.
Figure 29 Instream substrate along Hutton Creek
Instream Morphology
Pools and riffles are important habitat features for fish. Riffles are areas of agitated water and they contribute higher dissolved oxygen to the stream and act as spawning substrate for some species of fish, such as walleye. Pools provide shelter for fish and can be refuge pools in the summer if water levels drop and water temperature in the creek increases. Pools also provide important over wintering areas for fish. Runs are usually moderately shallow, with unagitated surfaces of water and areas where the thalweg (deepest part of the channel) is in the center of the channel. Figure 31 shows where the riffle habitats are located along Hutton Creek.
Figure 30 shows that Hutton Creek is variable; 73 percent consists of runs, 22 percent riffles and 5 percent pools.
Figure 30 Instream morphology along Hutton Creek
Figure 31 shows where riffle habitat was observed along Hutton Creek
Vegetation Type
Instream vegetation provides a variety of functions and is a critical component of the aquatic ecosystem. For example emergent plants along the shoreline can provide shoreline protection from wave action and important rearing habitat for species of waterfowl. Submerged plants provide habitat for fish to find shelter from predator fish while they feed. Floating plants such as water lilies shade the water and can keep temperatures cool while reducing algae growth. The dominant vegetation type recorded at forty- eight percent consisted of algae. Figure 32 depicts the plant community structure for Hutton Creek. Hutton Creek had high levels of diversity for instream vegetation. Figure 33 shows the dominant vegetation type observed for each section surveyed along Hutton Creek.
Figure 32 Vegetation types observed along Hutton Creek
Figure 33 Dominant vegetation type identified along Hutton Creek
Instream Vegetation Abundance
Instream vegetation is an important factor for a healthy stream ecosystem. Vegetation helps to remove contaminants from the water, contributes oxygen to the stream, and provides habitat for fish and wildlife. Too much vegetation can also be detrimental. Figure 34 demonstrates that Hutton Creek had sections dominated by low levels of instream vegetation for forty eight percent of its length. This is likely due in large part to high amounts of bedrock substrate along the system which does not allow aquatic vegetation to become established.
Figure 34 Instream vegetation abundance along Hutton Creek
Invasive Species
Invasive species can have major implications on streams and species diversity. Invasive species are one of the largest threats to ecosystems throughout Ontario and can out compete native species, having negative effects on local wildlife, fish and plant populations. Seventy seven percent of the sections surveyed along Hutton Creek had invasive species (Figure 35). The invasive species observed in Hutton Creek were European frogbit, purple loosestrife, glossy and common buckthorn, and Manitoba maple. Figure 36 shows the frequency of the invasive species observed along Hutton Creek.
Figure 35 Invasive species along Hutton Creek
Figure 36 Invasive species frequency by type along Hutton Creek
Hutton Creek Water Chemistry
Water Chemistry Measurement
During the stream characterization survey, a YSI probe is used to collect water chemistry information. Dissolved oxygen, conductivity and pH are measured at the start and end of each section.
Dissolved Oxygen
Dissolved oxygen is a measure of the amount of oxygen dissolved in water. The Canadian Environmental Quality Guidelines of the Canadian Council of Ministers of the Environment (CCME) suggest that for the protection of aquatic life the lowest acceptable dissolved oxygen concentration should be 6 mg/L for warmwater biota and 9.5 mg/L for coldwater biota (CCME, 1999). Figure 37 shows that the dissolved oxygen in Hutton Creek was within the threshold for warmwater biota in most reaches of the system. The average dissolved oxygen levels observed within the main stem of Hutton Creek was 7.34 mg/L which is within the recommended levels for warmwater biota.
Figure 37 Dissolved oxygen ranges in Hutton Creek
Conductivity
Conductivity in streams is primarily influenced by the geology of the surrounding environment, but can vary drastically as a function of surface water runoff. Currently there are no CCME guideline standards for stream conductivity, however readings which are outside the normal range observed within the system are often an indication of unmitigated discharge and/or stormwater input. The average conductivity observed within the main stem of Hutton Creek was 288 µs/cm. Figure 38 shows that the conductivity readings for Hutton Creek.
Figure 38 Conductivity ranges in Hutton Creek
pH
Based on the PWQO for pH, a range of 6.5 to 8.5 should be maintained for the protection of aquatic life. Average pH values for Hutton Creek averaged 7.8 thereby meeting the provincial standard.
Figure 39 pH ranges in Hutton Creek
Thermal Regime
Many factors can influence fluctuations in stream temperature, including springs, tributaries, precipitation runoff, discharge pipes and stream shading from riparian vegetation. Water temperature is used along with the maximum air temperature (using the Stoneman and Jones method) to classify a watercourse as either warm water, cool water or cold water. Analysis of the data collected indicates that Hutton Creek is classified as a warm water system with cool to warm water reaches.
Figure 40 Temperature loggers in Hutton Creek
Figure 41 Temperature logger data for three sites on Hutton Creek
Each point on the graph represents a temperature that meets the following criteria:
- Sampling dates between July 1st and September 7th
- Sampling date is preceded by two consecutive days above 24.5 °C, with no rain
- Water temperatures are collected at 4pm
- Air temperature is recorded as the max temperature for that day
Groundwater
Groundwater discharge areas can influence stream temperature, contribute nutrients, and provide important stream habitat for fish and other biota. During stream surveys, indicators of groundwater discharge are noted when observed. Indicators include: springs/seeps, watercress, iron staining, significant temperature change and rainbow mineral film. Figure 42 shows areas where one or more of the above groundwater indicators were observed during stream surveys and headwater assessments.
Figure 42 Groundwater indicator observations along Hutton Creek
Headwaters Drainage Features Assessment
The RVCA Stream Characterization program assessed Headwater Drainage Features for the Middle Rideau subwatershed in 2014. This protocol measures zero, first and second order headwater drainage features (HDF). It is a rapid assessment method characterizing the amount of water, sediment transport, and storage capacity within headwater drainage features (HDF). RVCA is working with other Conservation Authorities and the Ministry of Natural Resources and Forestry to implement the protocol with the goal of providing standard datasets to support science development and monitoring of headwater drainage features. An HDF is a depression in the land that conveys surface flow. Additionally, this module provides a means of characterizing the connectivity, form and unique features associated with each HDF (OSAP Protocol, 2013). In 2014 the program sampled 6 sites at road crossings in the Hutton Creek catchment area shown in Figure 43.

A headwater site located on Drummond Road in the Hutton Creek catchment photographed in the spring
The same headwater site located on Drummond Road in the Hutton Creek catchment photographed in the summer
Figure 43 Locations of the headwater sampling sites in the Hutton Creek catchment
Headwater Feature Type
The headwater sampling protocol assesses the feature type in order to understand the function of each feature. The evaluation includes the following classifications: defined natural channel, channelized or constrained, multi-thread, no defined feature, tiled, wetland, swale, roadside ditch and pond outlet. By assessing the values associated with the headwater drainage features in the catchment area we can understand the ecosystem services that they provide to the watershed in the form of hydrology, sediment transport, and aquatic and terrestrial functions. The Hutton Creek catchment is dominated by natural channel and wetland headwater drainage features. Figure 44 shows the feature type of the primary feature at the sampling locations.
Figure 44 Headwater feature types in Hutton Creek
Headwater Feature Flow Type
The observed flow condition within headwater drainage features can be highly variable depending on timing relative to the spring freshet, recent rainfall, soil moisture, etc. Flow conditions are assessed in the spring and in the summer to determine if features are perennial and flow year round, if they are intermittent and dry up during the summer months or if they are ephemeral systems that do not flow regularly and generally respond to specific rainstorm events or snowmelt. Flow conditions in headwater systems can change from year to year depending on local precipitation patterns. Figure 45 shows the observed flow conditions at the sampling locations in the Hutton Creek catchment.
Figure 45 Headwater flow conditions in Hutton Creek
Feature Channel Modifications
Channel modifications were assessed at each headwater drainage feature sampling location. Modifications include channelization, dredging, hardening and realignments. The sampling locations for the Hutton Creek catchment area were classified as having no channel modifications. Figure 46 shows the channel modifications observed at the sampling locations for Hutton Creek.
Figure 46 Headwater feature channel modifications in Hutton Creek
Headwater Feature Vegetation
Headwater feature vegetation evaluates the type of vegetation that is found within the drainage feature. The type of vegetated within the channel influences the aquatic and terrestrial ecosystem values that the feature provides. For some types of headwater features the vegetation within the feature plays a very important role in flow and sediment movement and provides wildlife habitat. The following classifications are evaluated no vegetation, lawn, wetland, meadow, scrubland and forest. Figure 47. Depicts the dominant vegetation observed at the sampled headwater sites in the Hutton Creek catchment.
Figure 47 Headwater feature vegetation types in Hutton Creek
Headwater Feature Riparian Vegetation
Headwater riparian vegetation evaluates the type of vegetation that is found along the adjacent lands of a headwater drainage feature. The type of vegetation within the riparian corridor influences the aquatic and terrestrial ecosystem values that the feature provides to the watershed. The majority of the sample locations in Hutton Creek were dominated by natural vegetation in the form of scrubland, forest and wetland vegetation. Figure 48 shows the type of riparian vegetation observed at the sampled headwater sites in the Hutton Creek catchment.
Figure 48 Headwater feature riparian vegetation in Hutton Creek
Headwater Feature Sediment Deposition
Assessing the amount of recent sediment deposited in a channel provides an index of the degree to which the feature could be transporting sediment to downstream reaches (OSAP, 2013). Evidence of excessive sediment deposition might indicate the requirement to follow up with more detailed targeted assessments upstream of the site location to identify potential best management practices to be implemented. Conditions ranged from no deposition observed to a site with substantial deposition recorded. Overall most sites had minimal to moderate levels of sediment deposition. Figure 49 Depicts the degree of sediment deposition observed at the sampled headwater sites in the Hutton Creek catchment.
Figure 49 Headwater feature sediment deposition in Hutton Creek
Headwater Feature Upstream Roughness
Feature roughness will provide a measure of the amount of materials within the bankfull channel that could slow down the velocity of water flowing within the headwater feature (OSAP, 2013). Materials on the channel bottom that provide roughness include vegetation, woody debris and boulders/cobble substrates. Roughness can provide benefits in mitigating downstream erosion on the headwater drainage feature and the receiving watercourse by reducing velocities. Roughness also provides important habitat conditions to aquatic organisms. All of the sample locations in the Hutton Creek catchment area had moderate levels of feature roughness. Figure 50 shows the feature roughness conditions at the sampling locations in the Hutton Creek catchment.
Figure 50 Headwater feature upstream roughness in Hutton Creek
Fish Community
The Hutton Creek catchment is classified as a mixed community of warm and cool water recreational and baitfish fishery with 14 species observed. Table 10 lists those species observed in the catchment (Source: MNR/RVCA). Figure 51 shows the sampling locations along Hutton Creek.
Figure 51 Fish sampling along Hutton Creek
Table 10 Fish species observed in Hutton Creek
A photo of a northern pike (Esox lucius) captured downstream of the Motts Mills Dam
A view of the habitat where the northern pike was captured
Migratory Obstructions
It is important to know locations of migratory obstructions because these can prevent fish from accessing important spawning and rearing habitat. Migratory obstructions can be natural or manmade, and they can be permanent or seasonal. Figure 52 shows that Hutton Creek had two debris jams at the time of the survey in 2014. The Motts Mills dam supports a headwater provincially significant wetland which provides enormous ecological benefits to the catchment area.
Figure 52 Migratory obstructions observed along Hutton Creek
4. Land Cover
Land cover and any change in coverage that has occurred over a six year period is summarized for the Hutton Creek catchment using spatially continuous vector data representing the catchment during the spring of 2008 and 2014. This dataset was developed by the RVCA through heads-up digitization of 20cm DRAPE ortho-imagery at a 1:4000 scale and details the surrounding landscape using 10 land cover classes.
As shown in Table 11, the dominant land cover types in the catchment through 2008 and 2014 were crop and pastureland along with woodland and wetland.
Table 11 Land cover (2008 vs. 2014) in the Hutton Creek catchment
* Does not include treed swamps ** Includes treed swamps
From 2008 to 2014, there was an overall change of 73 hectares (from one land cover class to another). Change within the Hutton Creek catchment is primarily associated with the conversion of crop and pastureland to settlement (i.e., a large solar farm) and transition into woodland along with wetland encroaching into woodland (see Figure 53 for the location of the major changes).
Figure 53 Dominant land cover change in the Hutton Creek catchment (2014)
Table 12 shows the type of land cover change that has taken place between land cover classes/types from 2008 to 2014. Overall, the net area of ‘crop and pastureland’ change (loss) is small at 41 hectares relative to the remaining area of ‘crop and pastureland’ in the catchment (as of 2014). Similarly, the net area of woodland change (loss) is small at 15 hectares relative to the remaining area of woodland in the catchment (as of 2014).
Table 12 Land cover change in the Hutton Creek catchment (2008 to 2014)
Woodland Cover
In the Environment Canada Guideline (Third Edition) entitled “How Much Habitat Is Enough?” (hereafter referred to as the “Guideline”) the opening narrative under the Forest Habitat Guidelines section states that prior to European settlement, forest was the predominant habitat in the Mixedwood Plains ecozone. The remnants of this once vast forest now exist in a fragmented state in many areas (including the Rideau Valley watershed) with woodland patches of various sizes distributed across the settled landscape along with higher levels of forest cover associated with features such as the Frontenac Axis (within the on-Shield areas of the Rideau Lakes and Tay River subwatersheds). The forest legacy, in terms of the many types of wildlife species found, overall species richness, ecological functions provided and ecosystem complexity is still evident in the patches and regional forest matrices (found in the Middle Rideau subwatershed and elsewhere in the Rideau Valley watershed). These ecological features are in addition to other influences which forests have on water quality and stream hydrology including reducing soil erosion, producing oxygen, storing carbon along with many other ecological services that are essential not only for wildlife but for human well-being.
The Guideline also notes that forests provide a great many habitat niches that are in turn occupied by a great diversity of plant and animal species. They provide food, water and shelter for these species - whether they are breeding and resident locally or using forest cover to help them move across the landscape. This diversity of species includes many that are considered to be species at risk. Furthermore, from a wildlife perspective, there is increasing evidence that the total forest cover in a given area is a major predictor of the persistence and size of bird populations, and it is possible or perhaps likely that this pattern extends to other flora and fauna groups. The overall effect of a decrease in forest cover on birds in fragmented landscapes is that certain species disappear and many of the remaining ones become rare, or fail to reproduce, while species adapted to more open and successional habitats, as well as those that are more tolerant to human-induced disturbances in general, are able to persist and in some cases thrive. Species with specialized-habitat requirements are most likely to be adversely affected. The overall pattern of distribution of forest cover, the shape, area and juxtaposition of remaining forest patches and the quality of forest cover also play major roles in determining how valuable forests will be to wildlife and people alike.
The current science generally supports minimum forest habitat requirements between 30 and 50 percent, with some limited evidence that the upper limit may be even higher, depending on the organism/species phenomenon under investigation or land-use/resource management planning regime being considered/used.
As shown in Figure 54, 33 percent of the Hutton Creek catchment contains 1825 hectares of upland forest and 221 hectares of lowland forest (treed swamps) versus the 34 percent of woodland cover in the Middle Rideau subwatershed. This is greater than the 30 percent of forest cover that is identified as the minimum threshold required to sustain forest birds according to the Guideline and which may only support less than one half of potential species richness and marginally healthy aquatic systems. When forest cover drops below 30 percent, forest birds tend to disappear as breeders across the landscape.
Figure 54 Woodland cover and forest interior (2014)
Woodland (Patch) Size
According to the Ministry of Natural Resources’ Natural Heritage Reference Manual (Second Edition), larger woodlands are more likely to contain a greater diversity of plant and animal species and communities than smaller woodlands and have a greater relative importance for mobile animal species such as forest birds.
Bigger forests often provide a different type of habitat. Many forest birds breed far more successfully in larger forests than they do in smaller woodlots and some rely heavily on forest interior conditions. Populations are often healthier in regions with more forest cover and where forest fragments are grouped closely together or connected by corridors of natural habitat. Small forests support small numbers of wildlife. Some species are “area-sensitive” and tend not to inhabit small woodlands, regardless of forest interior conditions. Fragmented habitat also isolates local populations, especially small mammals, amphibians and reptiles with limited mobility. This reduces the healthy mixing of genetic traits that helps populations survive over the long run (Conserving the Forest Interior. Ontario Extension Notes, 2000).
The Environment Canada Guideline also notes that for forest plants that do not disperse broadly or quickly, preservation of some relatively undisturbed large forest patches is needed to sustain them because of their restricted dispersal abilities and specialized habitat requirements and to ensure continued seed or propagation sources for restored or regenerating areas nearby.
The Natural Heritage Reference Manual continues by stating that a larger size also allows woodlands to support more resilient nutrient cycles and food webs and to be big enough to permit different and important successional stages to co-exist. Small, isolated woodlands are more susceptible to the effects of blowdown, drought, disease, insect infestations, and invasions by predators and non-indigenous plants. It is also known that the viability of woodland wildlife depends not only on the characteristics of the woodland in which they reside, but also on the characteristics of the surrounding landscape where the woodland is situated. Additionally, the percentage of forest cover in the surrounding landscape, the presence of ecological barriers such as roads, the ability of various species to cross the matrix surrounding the woodland and the proximity of adjacent habitats interact with woodland size in influencing the species assemblage within a woodland.
In the Hutton Creek catchment (in 2014), 69 (37 percent) of the 184 woodland patches are very small, being less than one hectare in size. Another 94 (51 percent) of the woodland patches ranging from one to less than 20 hectares in size tend to be dominated by edge-tolerant bird species. The remaining 21 (12 percent of) woodland patches range between 21 and 214 hectares in size. Sixteen of these patches contain woodland between 20 and 100 hectares and may support a few area-sensitive species and some edge intolerant species, but will be dominated by edge tolerant species.
Conversely, five (three percent) of the 184 woodland patches in the drainage area exceed the 100 plus hectare size needed to support most forest dependent, area sensitive birds and are large enough to support approximately 60 percent of edge-intolerant species. One patch tops 200 hectares, which according to the Environment Canada Guideline will support 80 percent of edge-intolerant forest bird species (including most area sensitive species) that prefer interior forest habitat conditions.
Table 13 presents a comparison of woodland patch size in 2008 and 2014 along with any changes that have occurred over that time. A decrease (of 11 ha) has been observed in the overall woodland patch area between the two reporting periods with most change occurring in the 100 to 200 and greater than 200 hectare woodland patch size class ranges.
Table 13 Woodland patches in the Hutton Creek catchment (2008 and 2014)
*Includes treed swamps
Forest Interior
The forest interior is habitat deep within woodlands. It is a sheltered, secluded environment away from the influence of forest edges and open habitats. Some people call it the “core” or the “heart” of a woodland. The presence of forest interior is a good sign of woodland health, and is directly related to the woodland’s size and shape. Large woodlands with round or square outlines have the greatest amount of forest interior. Small, narrow woodlands may have no forest interior conditions at all. Forest interior habitat is a remnant natural environment, reminiscent of the extensive, continuous forests of the past. This increasingly rare forest habitat is now a refuge for certain forest-dependent wildlife; they simply must have it to survive and thrive in a fragmented forest landscape (Conserving the Forest Interior. Ontario Extension Notes, 2000).
The Natural Heritage Reference Manual states that woodland interior habitat is usually defined as habitat more than 100 metres from the edge of the woodland and provides for relative seclusion from outside influences along with a moister, more sheltered and productive forest habitat for certain area sensitive species. Woodlands with interior habitat have centres that are more clearly buffered against the edge effects of agricultural activities or more harmful urban activities than those without.
In the Hutton Creek catchment (in 2014), the 184 woodland patches contain 91 forest interior patches (Figure 14) that occupy two percent (151 ha.) of the catchment land area (which is less than the five percent of interior forest in the Middle Rideau Subwatershed). This is below the ten percent figure referred to in the Environment Canada Guideline that is considered to be the minimum threshold for supporting edge intolerant bird species and other forest dwelling species in the landscape.
Most patches (87) have less than 10 hectares of interior forest, 61 of which have small areas of interior forest habitat less than one hectare in size. The remaining 4 patches contain interior forest ranging between 12 and 19 hectares in area.
Between 2008 and 2014, there has been a change in the number of woodland patches containing smaller areas of interior habitat (Table 14). For example, there has been an increase of 48 woodlands containing less than one hectare of interior forest over this and 15 woodlands with one to 10 hectares of interior habitat.
Table 14 Woodland Interior in the Hutton Creek catchment (2008 and 2014)
Wetland Cover
Wetlands are habitats forming the interface between aquatic and terrestrial systems. They are among the most productive and biologically diverse habitats on the planet. By the 1980s, according to the Natural Heritage Reference Manual, 68 percent of the original wetlands south of the Precambrian Shield in Ontario had been lost through encroachment, land clearance, drainage and filling.
Wetlands perform a number of important ecological and hydrological functions and provide an array of social and economic benefits that society values. Maintaining wetland cover in a watershed provides many ecological, economic, hydrological and social benefits that are listed in the Reference Manual and which may include:
- contributing to the stabilization of shorelines and to the reduction of erosion damage through the mitigation of water flow and soil binding by plant roots
- mitigating surface water flow by storing water during periods of peak flow (such as spring snowmelt and heavy rainfall events) and releasing water during periods of low flow (this mitigation of water flow also contributes to a reduction of flood damage)
- contributing to an improved water quality through the trapping of sediments, the removal and/or retention of excess nutrients, the immobilization and/or degradation of contaminants and the removal of bacteria
- providing renewable harvesting of timber, fuel wood, fish, wildlife and wild rice
- contributing to a stable, long-term water supply in areas of groundwater recharge and discharge
- providing a high diversity of habitats that support a wide variety of plants and animals
- acting as “carbon sinks” making a significant contribution to carbon storage
- providing opportunities for recreation, education, research and tourism
Historically, the overall wetland coverage within the Great Lakes basin exceeded 10 percent, but there was significant variability among watersheds and jurisdictions, as stated in the Environment Canada Guideline. In the Rideau Valley Watershed, it has been estimated that pre-settlement wetland cover averaged 35 percent using information provided by Ducks Unlimited Canada (2010) versus the 21 percent of wetland cover existing in 2014 derived from DRAPE imagery analysis.
Using the same dataset, it is estimated that pre-settlement (historic) wetland cover averaged 32 percent in the Middle Rideau subwatershed versus the 27 percent of cover existing in 2014. This decline in wetland cover is also evident in the Hutton Creek catchment (as seen in Figure 55) where there has been a one percent decrease in the area of wetland cover from pre-settlement times to the present (as summarized in Table 15).
Figure 35 Catchment wetland cover
While there has been a reported decrease in wetland cover in the Hutton Creek catchment from pre-settlement times, the remaining wetland cover in 2014 remains above the ecological thresholds cited in the Environment Canada Guideline. Nonetheless, in order to maintain critical hydrological, ecological functions along with related recreational and economic benefits provided by these wetland habitats in the catchment, a “no net loss” of currently existing wetlands should be employed to ensure the continued provision of tangible benefits accruing from them for landowners and surrounding communities.
Table 16 Wetland cover in the Middle Rideau subwatershed and Hutton Creek catchment (Historic to 2014)
5. Stewardship and Protection
The RVCA and its partners are working to protect and enhance environmental conditions in the Middle Rideau Subwatershed. Figure 56 shows the location of all stewardship projects completed in the Hutton Creek catchment along with sites identified for potential shoreline restoration.
Rural Clean Water Projects
From 2009 to 2014, three septic system replacements were completed. Between 2003 and 2008, two well upgrades, two livestock fencing projects, two fuel storage and handling facilities, two education initiatives, one septic system replacement and one clean water diversion were carried out. Prior to 2003, seven livestock fencing projects, one manure storage facility and one milkhouse wastewater treatment facility were completed. Total value of all 22 projects is $178,001 with $103,625 of that amount funded through grant dollars from the RVCA.
Figure 56 Stewardship and potential restoration locations
Tree Planting Projects
The location of RVCA Tree Planting Program projects is shown in Figure 56. From 2009 to 2014, 5,100 trees were planted at two sites. Between 2003 and 2008, 15,826 trees were planted at two sites and prior to 2003, 19,310 trees were planted at six sites, resulting in the reforestation of 20 hectares. Total value of all ten projects is $110,881 with $36,509 of that amount coming from various fundraising sources.
Through the RVCA Butternut Recovery Program, an additional 30 butternut trees were planted in the Hutton Creek catchment between 2003 and 2008, as part of efforts to introduce healthy seedlings from tolerant butternuts into various locations across Eastern Ontario.
Valley, Stream, Wetland and Hazard Land Regulation
The Hutton Creek catchment covers 62 square kilometres with 20.6 square kilometres (or 33 percent) of the drainage area being within the regulation limit of Ontario Regulation 174/06 (Figure 57), giving protection to wetland areas and river or stream valleys that are affected by flooding and erosion hazards.
Wetlands occupy 16.6 sq. km. (or 27 percent) of the catchment. Of these wetlands, 11 sq. km (or 66 percent) are designated as provincially significant and included within the RVCA regulation limit. This leaves the remaining 5.6 sq. km (or 34 percent) of wetlands in the catchment outside the regulated area limit.
Of the 85.4 kilometres of stream in the catchment, regulation limit mapping has been plotted along 47.5 kilometers of streams (representing 56 percent of all streams in the catchment). Some of these regulated watercourses (39.6 km or 46 percent of all streams) flow through regulated wetlands; the remaining 8 km (or 17 percent) of regulated streams are located outside of those wetlands. Plotting of the regulation limit on the remaining 37.9 km (or 44 percent) of streams requires identification of flood and erosion hazards and valley systems.
Within the regulation limit, “development” and “site alteration” require RVCA permission. The “alteration to waterways” provision of Ontario Regulation 174/06 applies to all watercourses.
Figure 57 RVCA regulation limits
Vulnerable Drinking Water Areas
The Hutton Creek drainage catchment is considered to have a Highly Vulnerable Aquifer. This means that the nature of the overburden (thin soils, fractured bedrock) does not provide a high level of protection for the underlying groundwater making the aquifer more vulnerable to contaminants released on the surface. The Mississippi-Rideau Source Protection Plan includes policies that focus on the protection of groundwater region-wide due to the fact that most of the region, which encompasses the Mississippi and Rideau watersheds, is considered Highly Vulnerable Aquifer. For detailed maps and policies that have been developed to protect drinking water sources, please go to the Mississippi-Rideau Source Protection Region website at www.mrsourcewater.ca to view the Mississippi-Rideau Source Protection Plan.
6. Challenges/Issues
Water Quality
- Surface chemistry water quality along Hutton Creek is “Fair” over two reporting periods (2003-2008 and 2009-2014) as determined by surface water chemistry data. Frequent exceedances of nutrients and E. coli as well as occasional exceedances of aluminum and iron contributed to the rating. Nutrient concentrations have increased in the 2009-2014 reporting period
- Instream biological water quality conditions at the Hutton Creek sample location range from “Fair” to “Poor” from 2010 to 2014 (using a grading scheme developed by Ontario Conservation Authorities in Ontario for benthic invertebrates) with an overall benthic invertebrate water quality rating of “Fair” determined for this period
Shorelines
- Emerald ash borer poses a significant threat to the ecology of the subwatershed, given the prominence of ash trees along shorelines and in riparian and wetland areas. Many tree stands are predominantly ash and with their anticipated loss, it is unclear what will replace them and the overall effect of their collective demise on the physical and natural functions/values they provide for erosion, water quality and fish and wildlife habitat protection
Land Cover
- The catchment contains 560 ha of unevaluated wetland (occupying nine percent of its total area) that provides many important social, hydrological, biological and ecological functions/services. Although not under imminent threat from development activity, they do remain vulnerable to drainage and land clearing activities in the absence of any regulatory and planning controls that would otherwise protect them
7. Opportunities/Actions
Water Quality
- Investigate the source of possible pollutants along Hutton Creek and consider implementing measures to reduce nutrient and bacterial loadings
- Implement agricultural and residential best management practices to address the elevated nutrient concentrations, high bacteria counts and occasional metal exceedances on Hutton Creek by restricting livestock access to the creek, limiting the use of fertilizers and pesticide applications and improving or maintaining a shoreline buffer
- Continue to offer the suite of water quality improvement projects provided by the Rideau Valley Rural Clean Water Program to landowners
- Continue to protect Hutton Creek and its tributaries through implementation of municipal and agency land use planning and development policies and practices
Shorelines/Headwaters
- Continue to promote the Rideau Valley Shoreline Naturalization and Tree Planting Programs to landowners
- RVCA and its partners (Townships of Elizabethtown-Kitley and Rideau Lakes) are to continue educating landowners about the value and importance of headwater drainage features, natural shorelines and waterfront property best management practices with respect to shoreline use and development, septic system installation and maintenance and shoreline vegetation retention and enhancement
- Protect the riparian buffer along the shoreline of Hutton Creek and other catchment streams (headwaters) during the development approvals process through adherence to and enforcement of municipal land-use policies and zoning standards
- Target shoreline restoration at sites identified in this report (shown as “Other riparian land cover” in Figure 14) and explore other restoration and enhancement opportunities along Hutton Creek and its tributaries
Development
- Collectively work with approval authorities (Townships of Elizabethtown-Kitley and Rideau Lakes, Conservation Authority) to consistently implement current land use planning and development policies for water quality and shoreline protection adjacent to Hutton Creek and other catchment streams (e.g., a minimum 30 metre development setback from water)
- Explore ways and means to more effectively enforce and implement conditions of land-use planning and development approval to achieve net environmental gains (particularly with respect to rehabilitating or protecting naturally vegetated shorelines and water quality)
- Municipalities and agencies are encouraged to strengthen natural heritage and water resources official plan policies and zoning provisions (water setbacks, frontage and naturalized shorelines and wetland protection) where deemed appropriate
- Utilize RVCA subwatershed and catchment reports to help develop/revise official plan policies to protect surface water resources and the natural environment (including woodlands, wetlands and shoreline cover)
- Consider establishing RVCA regulations limits to protect additional wetlands
Full Catchment Report
Middle Rideau Subwatershed Report 2015
IRISH CREEK CATCHMENT
The RVCA produces individual reports for ten catchments in the Middle Rideau subwatershed. Using data collected and analysed by the RVCA through its watershed monitoring and land cover classification programs, surface water quality conditions are reported for Irish Creek along with a summary of environmental conditions for the surrounding countryside every six years.
This information is used to better understand the effects of human activity on our water resources, allows us to better track environmental change over time and helps focus watershed management actions where they are needed the most to help sustain the ecosystem services (cultural, aesthetic and recreational values; provisioning of food, fuel and clean water; regulation of erosion/natural hazard protection and water purification; supporting nutrient/water cycling and habitat provision) provided by the catchment’s lands and forests and waters (Millennium Ecosystem Assessment 2005).
The following pages of this report are a compilation of that work and contain information on surface water quality, riparian conditions, land cover, stewardship activity and hazard land and water resources protection.
1. Catchment Facts
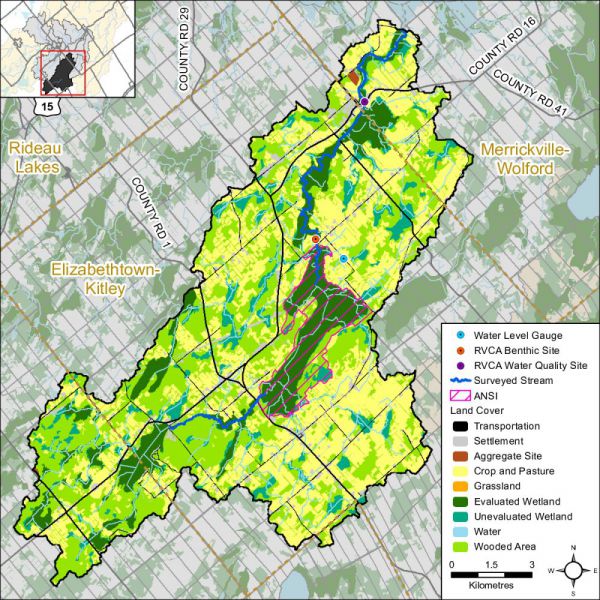
General Geography
- The Rideau River flows through the heart of the Middle Rideau and is a focal point for residents and visitors to the area. It extends from the outlet of Lower Rideau Lake at Poonamalie (where there is one dam and one lock) to Burritts Rapids (where there is also a dam and lock), at which point it enters the Lower Rideau on its way to Rideau Falls. The Rideau River is also an integral part of the Rideau Canal National Historic Site of Canada and is a significant tourist attraction which draws boaters, cottagers, and campers to the area
- Smiths Falls, Merrickville and Burritts Rapids are the main settlements in the Middle Rideau subwatershed. The Irish Creek catchment is predominantly rural in character with agriculture being the main land use. Settlement areas include Jasper, Toledo, Newbliss, Frankville, Bellamys Mill and Lehighs Corners
- Parks Canada staff manage water levels for recreational purposes along the Rideau Canal/Waterway that flows by the catchment, ensuring 1.5 metres of draft during the navigation season. In this managed system, water levels on the Rideau Canal are manipulated by operation of numerous dams. In the Middle Rideau subwatershed, Parks Canada staff operate 9 dam and lock complexes with 13 locks for a fall of 36.2 metres over 35.6 kilometres. Water levels are maintained as close as possible to set objectives through the May to October navigation season. The levels are lowered through the rest of October and into November and held at the winter levels until the spring freshet in late March or early April naturally increases inflows to the system. To reduce the impact of the higher flows in the spring, the amount of snow water equivalent, forecast rain, ice cover, flows and levels are assessed and the dams in the Middle Rideau reach are operated accordingly to quickly pass as much water as possible. In late April and early May, the dams are gradually closed and water levels are brought up to be ready, once again, for the navigation season
Physical Geography
- All of Irish Creek Catchment and the rest of the Middle Rideau Subwatershed primarily resides within the Smith Falls Limestone Plain, which in this area, happens to consist of older Paleozoic quartz sandstone and dolostone of the March Formation. The bedrock across the catchment is mainly overlain by a thin veneer of glacial sediment, referred to as ‘drift’ that is generally less than a metre in thickness; although the south western area is overlain by glacial till and Irish Creek’s corridor is underlain by clay and organic deposits
- Seventy-seven percent of the catchment lies within the Township of Elizabethtown-Kitley, 14 percent within the Township of Rideau Lakes and nine percent within the Village of Merrickville-Wolford
- Irish Creek catchment drainage area is 161 square kilometres and occupies about 19 percent of the Middle Rideau subwatershed and four percent of the Rideau Valley watershed
- Parks Canada staff manage water levels for recreational purposes along the Rideau Canal/Waterway that flows by the catchment, ensuring 1.5 metres of draft during the navigation season. In this managed system, water levels on the Rideau Canal are manipulated by operation of numerous dams. In the Middle Rideau subwatershed, Parks Canada staff operate 9 dam and lock complexes with 13 locks for a fall of 36.2 metres over 35.6 kilometres. Water levels are maintained as close as possible to set objectives through the May to October navigation season. The levels are lowered through the rest of October and into November and held at the winter levels until the spring freshet in late March or early April naturally increases inflows to the system. To reduce the impact of the higher flows in the spring, the amount of snow water equivalent, forecast rain, ice cover, flows and levels are assessed and the dams in the Middle Rideau reach are operated accordingly to quickly pass as much water as possible. In late April and early May, the dams are gradually closed and water levels are brought up to be ready, once again, for the navigation season
Vulnerable Areas
- The Assessment Report developed under the Ontario Clean Water Act identifies the upper bedrock aquifer underlying all of the catchment area as a Highly Vulnerable Aquifer, although, where sediments are thicker in a local area, the vulnerability would be less
Development
- Land uses in the catchment are Rural and Agriculture with Natural Heritage-Provincially Significant Wetland
Conditions at a Glance
Water Quality
- Surface chemistry water quality rating in Irish Creek is “Good” (2009 to 2014) and has improved from a “Fair” rating in the 2003-2008 reporting period. While elevated total Kjeldahl nitrogen is a feature of Irish Creek, nutrients and E. coli counts have decreased between the two monitoring periods
- Instream biological water quality conditions at the Irish Creek sample location range from “Very Poor” to “Poor” from 2003 to 2014 (using a grading scheme developed by Ontario Conservation Authorities in Ontario for benthic invertebrates) with an overall rating of “Poor” from 2003 to 2014 as the samples are dominated by species that are tolerant of high organic pollution levels
Instream and Riparian
- Overall instream and riparian condition for the Irish creek catchment as assessed by the stream characterization and headwater drainage feature assessment programs show that Irish Creek and its tributaries are in generally good condition. The majority of the system has a healthy riparian corridor with minimal erosion levels along the system. Instream diversity of aquatic habitat is somewhat variable with low levels of riffle habitat and high levels of riverine wetland habitat along the system. Several opportunities were identified on headwater tributaries of Irish Creek to enhance riparian habitat conditions along with one invasive species removal close to the Rideau River. Several beaver dams and one perched culvert were identified as potential migratory obstructions for fish passage
- The Irish Creek catchment has 22 species of recreational and bait fish that is classified as having a warm/cool water thermal guild that supports the Irish Creek/Rideau River fishery
- In the Irish Creek catchment, the riparian buffer (30 m. wide strip along the shoreline of all lakes and streams) is comprised of wetland (53 percent), crop and pastureland (25 percent), woodland (18 percent), roads (two percent) and settlement areas (two percent)
Land Cover
- Dominant land cover is crop and pastureland (39 percent) and woodland (35 percent) followed by wetland (20 percent), settlement areas (four percent) and roads (two percent). From 2008 to 2014, there was an overall change of 195 hectares (from one land cover class to another), most of which is associated with crop and pastureland emerging as young woodland along with some smaller areas of woodland conversion to crop and pastureland
- Woodland cover in the catchment has decreased by 80 hectares between 2008 and 2014 and interior forest habitat has increased by 42 hectares
- Wetland cover has decreased by two percent (363 ha) from pre-settlement times to the present and now occupies 20 percent of the catchment area
Other
- There are approximately 720 to 760 in-use water wells with provincial records in this catchment. While most water wells are used for domestic water supply, in this catchment, several are also used for commercial, agricultural, municipal and public water supplies or cooling
- An Environmental Compliance Approval has been issued in this catchment for municipal sewage works and several Permits to Take Water have been issued for wetland conservation
- There are three bedrock aggregate licenses located in this catchment
- Groundwater information from a discontinued historic Provincial Groundwater Monitoring Network well is available from the MOECC
Catchment Care
- Thirty-nine stewardship projects have been completed with assistance from the RVCA’s Rural Clean Water, Tree Planting and Shoreline Naturalization Programs (see Section 5 of this report for details)
- Irish Creek surface water quality has been monitored by the RVCA through its Baseline Monitoring Program since 2003. The surface water quality at site IRI-02 is monitored once a month from April to November
- RVCA has been collecting benthic invertebrates in Irish Creek at the Kinch Street site since 2003
- RVCA conducted a fish survey along Irish Creek in 2014
- RVCA completed a beaver dam survey on Irish Creek between Jasper and Toledo. Thirteen beaver dams were identified/mapped in 2012 and 9 beaver dams were identified/mapped in 2014
- RVCA completed a the stream characterization survey on Hutton Creek in 2014, working upstream to the headwaters from the mouth of the creek where it empties into the Rideau River taking measurements and recording observations on instream habitat, bank stability, other attributes and preparing a temperature profile
- RVCA completed 34 headwater drainage feature assessments at road crossings in the Irish Creek catchment in 2014. This protocol measures zero and first order headwater drainage features and is a rapid assessment method characterizing the amount of water, sediment transport, and storage capacity within headwater drainage features
- A watershed model developed by the RVCA in 2009 was used to study the hydrologic function of wetlands in the Rideau Valley Watershed, including those found in the Irish Creek catchment
- The Townships of Elizabethtown-Kitley and Rideau Lakes and the Village of Merrickville-Wolford have land use planning policies and zoning provisions - on water setbacks, frontage and naturalized shorelines and wetland protection - and in some instances use site plan control to implement these policies and provisions. Together with RVCA, these municipalities work with landowners on a case by case basis to enable new development while ensuring the scale is suitable on the lot, impacts on neighbours are minimized and development maximizes the watercourse setback
- Development in and adjacent to the Provincially Significant Wetlands in the catchment (Bellamys Lake, Irish Lake and Creek, Marshalls Creek, Newbliss Swamp, Otter Lake-Hutton Creek Complex) are subject to Ontario Regulation 174-06 (entitled “Development, Interference with Wetlands and Alterations to Shorelines and Watercourses”) that protects the hydrologic function of the wetland and also protects landowners and their property from natural hazards (flooding, fluctuating water table, unstable soils) associated with them
2. Surface Water Quality Conditions
Surface water quality conditions in the Irish Creek catchment are monitored by the Rideau Valley Conservation Authority’s (RVCA) Baseline Water Quality Monitoring Program. The Baseline Water Quality Program focuses on streams; data is collected for 22 parameters including nutrients (total phosphorus, total Kjeldahl nitrogen and ammonia), E. coli, metals (like aluminum and copper) and additional chemical/physical parameters (such as alkalinity, chlorides, pH and total suspended solids). Figure 1 shows the location of the monitoring site in the catchment.
Figure 1 Water quality monitoring site on Irish Creek
Irish Creek Water Quality
Water Quality Rating
The water quality rating for the Irish Creek catchment is “Good” (Table 1) as determined by the Canadian Council of Ministers of the Environment (CCME) Water Quality Index and is largely influenced by occasionaly high nutrient concentrations and bacterial counts. A "Good" rating indicates water quality is protected with only a minor degree of threat or impairment; conditions rarely depart from natural or desireable levels. Each parameter is evaluated against established guidelines to determine water quality conditions. Those parameters that frequently exceed guidelines are presented below. Analysis of the data has been broken into two periods; 2003 to 2008 and 2009 to 2014 for the stream monitoring site located on Irish Creek (IRI-02) to examine if conditions have changed between these periods. Table 1 shows the overall rating for the monitored surface water quality site within the Irish Creek catchment and Table 2 outlines the Water Quality Index (WQI) scores and their corresponding ratings.
Table 1 Water Quality Index Ratings for the Irish Creek catchment
Table 2 WQI Ratings and corresponding index scores (RVCA terminology, original WQI category names in brackets)
Nutrients
Total phosphorus (TP) is used as a primary indicator of excessive nutrient loading and may contribute to abundant aquatic vegetation growth and depleted dissolved oxygen levels. The Provincial Water Quality Objective (PWQO) is used as the TP Guideline and states that in streams concentrations greater than 0.030 mg/l indicate an excessive amount of TP.
Total Kjeldahl nitrogen (TKN) and ammonia (NH3) are used as secondary indicators of nutrient loadings. RVCA uses a guideline of 0.500 mg/l to assess TKN[1] and the PWQO of 0.020 mg/l to assess NH3 concentrations in Dales Creek.
Tables 3, 4 and 5 summarize average nutrient concentrations at monitored sites within the Creek catchment and show the proportion of results that meet the guidelines.
Table 3 Summary of total phosphorus results for Irish Creek, 2003-2008 and 2009-2014
Table 4 Summary of total Kjeldahl Nitrogen results for Irish Creek, 2003-2008 and 2009-2014. Highlighted values indicate average concentrations exceed the guideline
Table 5 Summary of Ammonia results for Irish Creek, 2003-2008 and 2009-2014. Highlighted values indicate average concentrations exceed the guideline
Elevated TP results rarely exceeded the guideline in the 2003-2008 and 2009-2014 monitoring periods at site IRI-02. The 2009-2014 monitoring period saw an improvement with no exceedances. Site IRI-02 had 95 percent of samples that were below the guideline in the 2003-2008 period (Figure 2); this increased to 100 percent of samples in the 2009-2014 period (Figure 3). The average TP concentration for both reporting periods were below the PWQO which slightly decreased from 0.019 mg/l to 0.014 mg/l (Table 3).
Figure 2 Total Phosphorous concentrations in Irish Creek, 2003-2008
Figure 3 Total Phosphorous concentrations in Irish Creek, 2008-2014
TKN concentrations show that the bulk of results exceeded the guideline (Figures 4 and 5). There were few samples (24 percent) below the guideline in the 2003-2008 period and this slightly decreased to 22 percent in the 2009-2014 period. The average concentration was generally elevated and decreased from 0.669 mg/l to 0.608 mg/l (Table 8).
Figure 4 Total Kjeldahl nitrogen concentrations in Irish Creek, 2003-2008
Figure 5 Total Kjeldahl nitrogen concentrations in Irish Creek, 2008-2014
Occasional elevated nutrients were observed in NH3 data. The proportion of results that were below the guideline were 83 percent for both monitoring periods (Figures 6 and 7). The average NH3 concentration from 2003-2008 was 0.017 mg/l and decreased to 0.008 mg/l from 2009-2014. Both averages were below the guideline. (Table 5).
Figure 6 Ammonia concentrations in Irish Creek, 2003-2008
Figure 7 Ammonia concentrations in Irish Creek, 2009-2014
Summary
The data shows that nutrient enrichment is an occasional feature of Irish Creek. All nutrients decreased between the two reporting periods, with a majority of samples below the guidelines for both TP and NH3. Elevated TKN results were observed during both monitoring periods and have average concentrations that exceed the guidelines. These elevated results may be influenced by organic matter held by wetland areas found upstream in the Middle Rideau Subwatershed, resulting in naturally high concentrations of organic nitrogen. High nutrient concentrations can help stimulate the growth of algae blooms and other aquatic vegetation in a waterbody and deplete oxygen levels as the vegetation dies off. It is important to reduce human impacts wherever possible. Strategies to reduce nutrient inputs may include diversion of runoff to the creek and enhanced shoreline buffers.
E. Coli
E. coli is used as an indicator of bacterial pollution from human or animal waste; in elevated concentrations it can pose a risk to human health. The PWQO of 100 colony forming units/100 millilitres (CFU/100 ml) is used. E. coli counts greater than this guideline indicate that bacterial contamination may be a problem within a waterbody.
Table 6 summarizes the geometric mean[2] for the monitored site on Irish Creek and shows the proportion of samples that meet the E. coli guideline of 100 CFU/100 ml. The results of the geometric mean with respect to the guideline for the two periods, 2003-2008 and 2009- 2014, are shown in Figures 8 and 9 respectively.
Table 6 Summary of E. coli results for Irish Creek, 2003-2008 and 2009-2014
E. coli results at site IRI-02 indicate bacterial counts are rarely above the E. coli guideline. The proportion of samples below the guideline increased from 90 percent (Figure 8) to 95 percent (Figure 9). E.coli counts decreased between the two monitoring periods (2003-2008 and 2009-2014) with a geometric mean of 38 CFU/100ml to 25 CFU/100ml (Table 6).
Figure 8 E.coli counts in Irish Creek, 2003-2008
Figure 9 E.coli counts in Irish Creek, 2009-2014
Summary
This data shows that E.coli results rarely exceed the guidelines at site IRI-02 in Irish Creek. The geometric mean is below the PWQO for both monitoring periods and there has been a decrease in E.coli counts between 2003-2008 and 2009-2014. Properly maintaining septic systems, enhancing shoreline buffers and restricting cattle access can help to improve and maintain E.coli levels in Irish Creek.
[1] No Ontario guideline for TKN is presently available; however, waters not influenced by excessive organic inputs typically range from 0.100 to 0.500 mg/l, Environment Canada (1979) Water Quality Sourcebook, A Guide to Water Quality Parameters, Inland Waters Directorate, Water Quality Branch, Ottawa, Canada
[2] A type of mean or average, which indicates the central tendency or typical value of a set of numbers by using the product of their values (as opposed to the arithmetic mean which uses their sum). It is often used to summarize a variable that varies over several orders of magnitude, such as E. coli counts.
3. Irish Creek Riparian Conditions
Shoreline Buffer Land Cover Evaluation
The riparian or shoreline zone is that special area where the land meets the water. Well-vegetated shorelines are critically important in protecting water quality and creating healthy aquatic habitats, lakes and rivers. Natural shorelines intercept sediments and contaminants that could impact water quality conditions and harm fish habitat in streams. Well established buffers protect the banks against erosion, improve habitat for fish by shading and cooling the water and provide protection for birds and other wildlife that feed and rear young near water. A recommended target (from Environment Canada’s Guideline: How Much Habitat is Enough?) is to maintain a minimum 30 metre wide vegetated buffer along at least 75 percent of the length of both sides of rivers, creeks and streams.
Figure 10 shows the extent of the naturally vegetated riparian zone along a 30 metre deep/wide area of the shoreline of Irish Creek and its tributaries. This information is derived from a dataset developed by the RVCA’s Land Cover Classification Program through heads-up digitization of 20cm DRAPE ortho-imagery at a 1:4000 scale, which details the catchment landscape using 10 land cover classes.
Figure 10 Natural and other riparian land cover in the Irish Creek catchment
This analysis shows that the riparian buffer in the Irish Creek catchment is comprised of wetland (53 percent), crop and pastureland (25 percent), woodland (18 percent), roads (two percent) and settlement areas (two percent). Additional statistics for the Irish Creek catchment are presented in Table 7 and show that there has been very little change in shoreline cover from 2008 to 2014.
Table 7 Riparian land cover (2008 vs. 2014) in the Irish Creek catchment
Irish Creek Overbank Zone
Riparian Buffer Width Evaluation
Figure 11 demonstrates the buffer conditions of the left and right banks separately. Irish Creek had a buffer of greater than 30 meters along 97 percent of the right bank and 98 percent of the left bank.
Figure 11 Riparian buffer evaluation along Irish Creek
Adjacent Land Use
The RVCA’s Stream Characterization Program identifies six different land uses beside Irish Creek (Figure 12). Surrounding land use is considered from the beginning to end of the survey section (100m) and up to 100m on each side of the creek. Land use outside of this area is not considered for the surveys but is nonetheless part of the subwatershed and will influence the creek. Natural areas made up 95 percent of the stream, characterized by wetlands, forest, scrubland and meadow. Wetland habitat was dominant in the adjacent lands along Irish Creek at 80 percent. The remaining land use consisted of residential and infrastructure in the form of road crossings.
Figure 12 Land Use along Irish Creek
Irish Creek Shoreline Zone
Instream Erosion
Erosion is a normal, important stream process and may not affect actual bank stability; however, excessive erosion and deposition of sediment within a stream can have a detrimental effect on important fish and wildlife habitat. Poor bank stability can greatly contribute to the amount of sediment carried in a waterbody as well as loss of bank vegetation due to bank failure, resulting in trees falling into the stream and the potential to impact instream migration. Figure 13 shows low levels of erosion along Irish Creek.
Figure 13 Erosion along Irish Creek
Undercut Stream Banks
Undercut banks are a normal and natural part of stream function and can provide excellent refuge areas for fish. Figure 14 shows that Irish Creek had low levels of undercut banks along the system.
Figure 14 Undercut stream banks along Irish Creek
Stream Shading
Grasses, shrubs and trees all contribute towards shading a stream. Shade is important in moderating stream temperature, contributing to food supply and helping with nutrient reduction within a stream. Figure 15 shows low levels of stream shading dominate conditions in most reaches of Irish Creek.
Figure 15 Stream shading along Irish Creek
Instream Woody Debris
Figure 16 shows that the majority of Irish Creek had low to moderate levels of instream woody debris in the form of branches and trees. Instream woody debris is important for fish and benthic invertebrate habitat, by providing refuge and feeding areas.
Figure 16 Instream woody debris along Irish Creek
Overhanging Trees and Branches
Figure 17 shows the system is dominated by low to moderate levels of overhanging branches and trees along Irish Creek. Overhanging branches and trees provide a food source, nutrients and shade which helps to moderate instream water temperatures.
Figure 17 Overhanging trees and branches along Irish Creek
Anthropogenic Alterations
Figure 18 shows 94 percent of Irish Creek remains “unaltered” with no anthropogenic alterations. Five percent of Irish Creek was classified as natural with minor anthropogenic changes and one percent was considered altered in the form of road crossings.
Figure 18 Anthropogenic alterations along Irish Creek
Irish Creek Instream Aquatic Habitat
Benthic Invertebrates
Freshwater benthic invertebrates are animals without backbones that live on the stream bottom and include crustaceans such as crayfish, molluscs and immature forms of aquatic insects. Benthos represent an extremely diverse group of aquatic animals and exhibit wide ranges of responses to stressors such as organic pollutants, sediments and toxicants, which allows scientists to use them as bioindicators. As part of the Ontario Benthic Biomonitoring Network (OBBN), the RVCA has been collecting benthic invertebrates at the Kinch road site on Irish Creek since 2003. Monitoring data is analyzed for each sample site and the results are presented using the Family Biotic Index, Family Richness and percent Ephemeroptera, Plecoptera and Trichoptera.
Hilsenhoff Family Biotic Index
The Hilsenhoff Family Biotic Index (FBI) is an indicator of organic and nutrient pollution and provides an estimate of water quality conditions for each site using established pollution tolerance values for benthic invertebrates. FBI results for Irish Creek are separated by reporting period 2003 to 2008 and 2009 to 2014. “Poor” to “Very poor” water quality conditions being observed at the Irish Creek sample location for the period from 2003 to 2014 (Fig.19) using a grading scheme developed by Conservation Authorities in Ontario for benthic invertebrates.
Figure 19 Hilsenhoff Family Biotic Index on Irish Creek
Family Richness
Family Richness measures the health of the community through its diversity and increases with increasing habitat diversity suitability and healthy water quality conditions. Family Richness is equivalent to the total number of benthic invertebrate families found within a sample. Irish Creek is reported to have “Poor” to “Good” family richness (Fig.20).
Figure 20 Family Richness in Irish Creek
EPT
Ephemeroptera (Mayflies), Plecoptera (Stoneflies), and Trichoptera (Caddisflies) are species considered to be very sensitive to poor water quality conditions. High abundance of these organisms is generally an indication of good water quality conditions at a sample location. During more recent sampling years the community structure has been shifting to species that are more sensitive to poor water quality conditions. As a result, the EPT indicates that Irish Creek is reported to have “Poor” water quality (Fig.21) from 2003 to 2014.
Figure 21 EPT in Irish Creek
Conclusion
Overall Irish Creek aquatic habitat conditions from a benthic invertebrate perspective is considered “Poor” from 2003 to 2014 as the samples are dominated by species that are tolerant of high organic pollution levels.
Habitat Complexity
Streams are naturally meandering systems and move over time; there are varying degrees of habitat complexity, depending on the creek. Examples of habitat complexity include variable habitat types such as pools and riffles as well as substrate variability and woody debris structure. A high percentage of habitat complexity (heterogeneity) typically increases the biodiversity of aquatic organisms within a system. Forty percent of Irish Creek was considered heterogeneous, as shown in Figure 22. The majority of the Irish Creek system is classified as a riverine wetland.
Figure 22 Habitat complexity along Irish Creek
Instream Substrate
Diverse substrate is important for fish and benthic invertebrate habitat because some species have specific substrate requirements and for example will only reproduce on certain types of substrate. Figure 23 shows that 74 percent of the substrate observed on Irish Creek was dominated by silt and organic substrate consistent with wetland habitat conditions. Overall substrate conditions were fairly uniform along Irish Creek. Figure 24 shows the dominant substrate type observed for each section surveyed along Irish Creek.
Figure 23 Instream substrate along Irish Creek
Figure 24 shows the dominant substrate type along Irish Creek.
Cobble and Boulder Habitat
Boulders create instream cover and back eddies for large fish to hide and/or rest out of the current. Cobble provides important spawning habitat for certain fish species like walleye and various shiner species who are an important food source for larger fish. Cobble can also provide habitat conditions for benthic invertebrates that are a key food source for many fish and wildlife species. Figure 25 shows where cobble and boulder substrate are found in Irish Creek.
Figure 25 Instream substrate cobble and boulder along Irish Creek
Instream Morphology
Pools and riffles are important habitat features for fish. Riffles are areas of agitated water and they contribute higher dissolved oxygen to the stream and act as spawning substrate for some species of fish, such as walleye. Pools provide shelter for fish and can be refuge pools in the summer if water levels drop and water temperature in the creek increases. Pools also provide important over wintering areas for fish. Runs are usually moderately shallow, with unagitated surfaces of water and areas where the thalweg (deepest part of the channel) is in the center of the channel. Figure 26 shows that Irish Creek is fairly uniform; 83 percent consists of runs, 1 percent riffles and 16 percent pools. Figure 27 shows where the limited areas of riffle habitat were observed along Irish Creek.
Figure 26 Instream morphology along Irish Creek
Figure 27 Riffle habitat locations along Irish Creek
Vegetation Type
Instream vegetation provides a variety of functions and is a critical component of the aquatic ecosystem. For example emergent plants along the shoreline can provide shoreline protection from wave action and important rearing habitat for species of waterfowl. Submerged plants provide habitat for fish to find shelter from predator fish while they feed. Floating plants such as water lilies shade the water and can keep temperatures cool while reducing algae growth. The dominant vegetation type recorded at 34 percent consisted of submerged plants. Irish Creek had high levels of diversity for instream vegetation. Figure 28 depicts the plant community structure for Irish Creek. Figure 29 shows the dominant vegetation type observed for each section surveyed along Irish Creek.
Figure 28 Vegetation type along Irish Creek
Figure 29 Dominant vegetation type along Irish Creek
Instream Vegetation Abundance
Instream vegetation is an important factor for a healthy stream ecosystem. Vegetation helps to remove contaminants from the water, contributes oxygen to the stream, and provides habitat for fish and wildlife. Too much vegetation can also be detrimental. Figure 30 demonstrates that Irish Creek had common and normal levels of instream vegetation for 60 percent of its length. Extensive vegetation levels were recorded at 37 percent of stream surveys, which can result in low oxygen levels along the system.
Figure 30 Instream vegetation abundance along Irish Creek
Invasive Species
Invasive species can have major implications on streams and species diversity. Invasive species are one of the largest threats to ecosystems throughout Ontario and can out compete native species, having negative effects on local wildlife, fish and plant populations. One hundred percent of the sections surveyed along Irish Creek had invasive species (Figure 31). The invasive species observed in Irish Creek were European frogbit, purple loosestrife, glossy and common buckthorn, poison/wild parsnip, carp, banded mystery snail, curly leafed pondweed, Himalayan balsam, phragmites, European/Black alder, Eurasian milfoil and Manitoba maple. Figure 32 shows the frequency of the invasive species observed along Irish Creek.
Figure 31 Invasive species along Irish Creek
Figure 32 Frequency of the invasive species observed along Irish Creek
Water Chemistry
During the stream characterization survey, a YSI probe is used to collect water chemistry information. Dissolved oxygen, conductivity and pH are measured at the start and end of each section.
Dissolved Oxygen
Dissolved oxygen is a measure of the amount of oxygen dissolved in water. The Canadian Environmental Quality Guidelines of the Canadian Council of Ministers of the Environment (CCME) suggest that for the protection of aquatic life the lowest acceptable dissolved oxygen concentration should be 6 mg/L for warmwater biota and 9.5 mg/L for coldwater biota (CCME, 1999). Figure 33 shows that the dissolved oxygen in Irish Creek was below the threshold for warmwater biota in most reaches of the system. The average dissolved oxygen levels observed within the main stem of Irish Creek was 4.19 mg/L which is below the recommended levels for warmwater biota.
Figure 33 Dissolved oxygen ranges in Irish Creek
Conductivity
Conductivity in streams is primarily influenced by the geology of the surrounding environment, but can vary drastically as a function of surface water runoff. Currently there are no CCME guideline standards for stream conductivity; however readings which are outside the normal range observed within the system are often an indication of unmitigated discharge and/or stormwater input. The average conductivity observed within the main stem of Irish Creek was 345.8 µs/cm. Figure 34 shows the conductivity readings for Irish Creek.
Figure 34 Specific conductivity ranges in Irish Creek
pH
Based on the PWQO for pH, a range of 6.5 to 8.5 should be maintained for the protection of aquatic life. Average pH values for Irish Creek averaged 7.52 thereby meeting the provincial standard (Figure 35).
Figure 35 pH ranges in Irish Creek
Thermal Regime
Many factors can influence fluctuations in stream temperature, including springs, tributaries, precipitation runoff, discharge pipes and stream shading from riparian vegetation. Water temperature is used along with the maximum air temperature (using the Stoneman and Jones method) to classify a watercourse as either warm water, cool water or cold water. Figure 36 shows where the thermal sampling sites were located along Irish Creek and Marshalls Creek. Analysis of the data collected indicates that Irish Creek is classified as a warm water system with cool water reaches (Figure 37).
Figure 36 Temperature logger locations on Irish Creek and Marshalls Creek
Figure 37 Temperature logger data for three sites on Irish Creek.
Each point on the graph represents a temperature that meets the following criteria:
- Sampling dates between July 1st and September 7th
- Sampling date is preceded by two consecutive days above 24.5 °C, with no rain
- Water temperatures are collected at 4pm
- Air temperature is recorded as the max temperature for that day
Groundwater
Groundwater discharge areas can influence stream temperature, contribute nutrients, and provide important stream habitat for fish and other biota. During stream surveys, indicators of groundwater discharge are noted when observed. Indicators include: springs/seeps, watercress, iron staining, significant temperature change and rainbow mineral film. Figure 38 shows areas where one or more of the above groundwater indicators were observed during stream surveys and headwater assessments.
Figure 38 Groundwater indicators observed in the Irish Creek catchment
Headwaters Drainage Features Assessment
The RVCA Stream Characterization program assessed Headwater Drainage Features for the Middle Irish subwatershed in 2014. This protocol measures zero, first and second order headwater drainage features (HDF). It is a rapid assessment method characterizing the amount of water, sediment transport, and storage capacity within headwater drainage features (HDF). RVCA is working with other Conservation Authorities and the Ministry of Natural Resources and Forestry to implement the protocol with the goal of providing standard datasets to support science development and monitoring of headwater drainage features. An HDF is a depression in the land that conveys surface flow. Additionally, this module provides a means of characterizing the connectivity, form and unique features associated with each HDF (OSAP Protocol, 2013). In 2014 the program sampled 34 sites at road crossings in the Irish Creek catchment area (Figure 39).

Figure 39 Locations of the headwater sampling sites in the Irish Creek catchment
RVCA staff sampling a headwater sample site in the Irish Creek catchment
Feature Type
The headwater sampling protocol assesses the feature type in order to understand the function of each feature. The evaluation includes the following classifications: defined natural channel, channelized or constrained, multi-thread, no defined feature, tiled, wetland, swale, roadside ditch and pond outlet. By assessing the values associated with the headwater drainage features in the catchment area we can understand the ecosystem services that they provide to the watershed in the form of hydrology, sediment transport, and aquatic and terrestrial functions. The Irish Creek catchment is dominated by wetland and natural headwater drainage features. Four features were classified as having been channelized , five features were identified as roadside drainage features and one feature was tile drained. Figure 40 shows the feature type of the primary feature at the sampling locations.
Figure 40 Headwater feature types in the Irish Creek catchment
Headwater Feature Flow
The observed flow condition within headwater drainage features can be highly variable depending on timing relative to the spring freshet, recent rainfall, soil moisture, etc. Flow conditions are assessed in the spring and in the summer to determine if features are perennial and flow year round, if they are intermittent and dry up during the summer months or if they are ephemeral systems that do not flow regularly and generally respond to specific rainstorm events or snowmelt. Flow conditions in headwater systems can change from year to year depending on local precipitation patterns. Figure 41 shows the observed flow conditions at the sampling locations in the Irish Creek catchment in 2014.
Figure 41 Headwater feature flow conditions in the Irish Creek catchment
A spring photo of the headwater sample site in the Irish Creek catchment located on County Road 8
A summer photo of the headwater sample site in the Irish Creek catchment located on County Road 8
Feature Channel Modifications
Channel modifications were assessed at each headwater drainage feature sampling location. Modifications include channelization, dredging, hardening and realignments. The majority of sampling locations for the Irish Creek catchment area were classified as having no channel modifications, one channel was classified as being hardened and one appeared to have been historically dredged. Figure 42 shows the channel modifications observed at the sampling locations for Irish Creek.
Figure 42 Headwater feature channel modifications in the Irish Creek catchment
Headwater Feature Vegetation
Headwater feature vegetation evaluates the type of vegetation that is found within the drainage feature. The type of vegetated within the channel influences the aquatic and terrestrial ecosystem values that the feature provides. For some types of headwater features the vegetation within the feature plays a very important role in flow and sediment movement and provides wildlife habitat. The following classifications are evaluated no vegetation, lawn, wetland, meadow, scrubland and forest. The features assessed in the Irish Creek catchment were classified being dominated by wetland, scrubland, meadow and forest. One feature was classified as having lawn. Figure 43. Depicts the dominant vegetation observed at the sampled headwater sites in the Irish Creek catchment.
Figure 43 Headwater feature vegetation types in the Irish Creek catchment
Headwater Feature Riparian Vegetation
Headwater riparian vegetation evaluates the type of vegetation that is found along the adjacent lands of a headwater drainage feature. The type of vegetation within the riparian corridor influences the aquatic and terrestrial ecosystem values that the feature provides to the watershed. The sample locations in Irish Creek were dominated by natural vegetation in the form of meadow, scrubland, forest and wetland vegetation. Figure 44. Depicts the type of riparian vegetation observed at the sampled headwater sites in the Irish Creek catchment.
Figure 44 Headwater feature riparian vegetation types in the Irish Creek catchment
Headwater Feature Sediment Deposition
Assessing the amount of recent sediment deposited in a channel provides an index of the degree to which the feature could be transporting sediment to downstream reaches (OSAP, 2013). Evidence of excessive sediment deposition might indicate the requirement to follow up with more detailed targeted assessments upstream of the site location to identify potential best management practices to be implemented. Conditions ranged from no deposition observed to moderate deposition recorded. Figure 45. Depicts the degree of sediment deposition observed at the sampled headwater sites in the Irish Creek catchment.
Figure 45 Headwater feature sediment deposition in the Irish Creek catchment
Headwater Feature Upstream Roughness
Feature roughness will provide a measure of the amount of materials within the bankfull channel that could slow down the velocity of water flowing within the headwater feature (OSAP, 2013). Materials on the channel bottom that provide roughness include vegetation, woody debris and boulders/cobble substrates. Roughness can provide benefits in mitigating downstream erosion on the headwater drainage feature and the receiving watercourse by reducing velocities. Roughness also provides important habitat conditions to aquatic organisms. The sample locations in the Irish Creek catchment area ranged from moderate to extreme roughness conditions. Figure 46 shows the feature roughness conditions at the sampling locations in the Irish Creek catchment.
Figure 46 Headwater feature roughness in the Irish Creek catchment
Fish Community
The Irish Creek catchment is classified as a mixed community of warm and cool water recreational and baitfish fishery with 22 species observed. Table 8 lists those species observed in the catchment (Source: MNR/RVCA). Figure 47 shows the sampling locations along Irish Creek.
Figure 47 Irish Creek fish community
Table 8 Fish species observed in Irish Creek
RVCA staff set fyke nets along the system to sample fish in Irish Creek
Young of the year northern pike captured along Irish Creek
Migratory Obstructions
It is important to know locations of migratory obstructions because these can prevent fish from accessing important spawning and rearing habitat. Migratory obstructions can be natural or manmade, and they can be permanent or seasonal. Figure 48 shows that Irish Creek had multiple beaver dams, one perched culvert and one grade barrier at the time of the survey in 2014.
Figure 48 Migratory obstructions along Irish Creek
Riparian Restoration
Figure 49 depicts the location of a riparian restoration opportunity as a result of observations made during the stream survey and headwater drainage feature assessments.
Figure 49 Riparian restoration opportunities along Irish Creek
4. Land Cover
Land cover and any change in coverage that has occurred over a six year period is summarized for the Irish Creek catchment using spatially continuous vector data representing the catchment during the spring of 2008 and 2014. This dataset was developed by the RVCA through heads-up digitization of 20cm DRAPE ortho-imagery at a 1:4000 scale and details the surrounding landscape using 10 land cover classes.
As shown in Table 9, the dominant land cover types in 2008 and 2014 were crop and pastureland along with woodland.
Table 9 Land cover (2008 vs. 2014) in the Irish Creek catchment
* Does not include treed swamps ** Includes treed swamps
From 2008 to 2014, there was an overall change of 195 hectares (from one land cover class to another). Most of the change is associated with crop and pastureland (i.e., previously cultivated areas/fallow fields) emerging as young woodland (i.e., regenerative and/or plantation) along with some smaller areas of woodland conversion to crop and pastureland (see Figure 50 for the location of the major changes).
Figure 50 Dominant land cover change in the Irish Creek catchment (2014)
Table 10 shows the type of land cover change that has taken place between land cover classes/types from 2008 to 2014. Overall, the net area of crop and pastureland change (loss) is small at 96 hectares relative to the remaining area of crop and pastureland in the catchment (as of 2014). Similarly, the net area of woodland change (gain) is also small at 80 hectares relative to the remaining area of woodland in the catchment (as of 2014), as is the change (gain) in the area of settlement (at 19 hectares) when compared to the remaining settlement (in 2014).
Table 10 Land cover change in the Irish Creek catchment (2008 to 2014)
Woodland Cover
In the Environment Canada Guideline (Third Edition) entitled “How Much Habitat Is Enough?” (hereafter referred to as the “Guideline”) the opening narrative under the Forest Habitat Guidelines section states that prior to European settlement, forest was the predominant habitat in the Mixedwood Plains ecozone. The remnants of this once vast forest now exist in a fragmented state in many areas (including the Rideau Valley watershed) with woodland patches of various sizes distributed across the settled landscape along with higher levels of forest cover associated with features such as the Frontenac Axis (within the on-Shield areas of the Rideau Lakes and Tay River subwatersheds). The forest legacy, in terms of the many types of wildlife species found, overall species richness, ecological functions provided and ecosystem complexity is still evident in the patches and regional forest matrices (found in the Middle Rideau subwatershed and elsewhere in the Rideau Valley watershed). These ecological features are in addition to other influences which forests have on water quality and stream hydrology including reducing soil erosion, producing oxygen, storing carbon along with many other ecological services that are essential not only for wildlife but for human well-being.
The Guideline also notes that forests provide a great many habitat niches that are in turn occupied by a great diversity of plant and animal species. They provide food, water and shelter for these species - whether they are breeding and resident locally or using forest cover to help them move across the landscape. This diversity of species includes many that are considered to be species at risk. Furthermore, from a wildlife perspective, there is increasing evidence that the total forest cover in a given area is a major predictor of the persistence and size of bird populations, and it is possible or perhaps likely that this pattern extends to other flora and fauna groups. The overall effect of a decrease in forest cover on birds in fragmented landscapes is that certain species disappear and many of the remaining ones become rare, or fail to reproduce, while species adapted to more open and successional habitats, as well as those that are more tolerant to human-induced disturbances in general, are able to persist and in some cases thrive. Species with specialized-habitat requirements are most likely to be adversely affected. The overall pattern of distribution of forest cover, the shape, area and juxtaposition of remaining forest patches and the quality of forest cover also play major roles in determining how valuable forests will be to wildlife and people alike.
The current science generally supports minimum forest habitat requirements between 30 and 50 percent, with some limited evidence that the upper limit may be even higher, depending on the organism/species phenomenon under investigation or land-use/resource management planning regime being considered/used.
As shown in Figure 51, 38 percent of the Irish Creek catchment contains 5522 hectares of upland forest and 624 hectares of lowland forest (treed swamps) versus the 34 percent of woodland cover in the Middle Rideau subwatershed. This is greater than the 30 percent of forest cover that is identified as the minimum threshold required to sustain forest birds according to the Guideline and which may only support less than one half of potential species richness and marginally healthy aquatic systems. When forest cover drops below 30 percent, forest birds tend to disappear as breeders across the landscape.
Figure 51 Woodland cover and forest interior (2014)
Woodland (Patch) Size
According to the Ministry of Natural Resources’ Natural Heritage Reference Manual (Second Edition), larger woodlands are more likely to contain a greater diversity of plant and animal species and communities than smaller woodlands and have a greater relative importance for mobile animal species such as forest birds.
Bigger forests often provide a different type of habitat. Many forest birds breed far more successfully in larger forests than they do in smaller woodlots and some rely heavily on forest interior conditions. Populations are often healthier in regions with more forest cover and where forest fragments are grouped closely together or connected by corridors of natural habitat. Small forests support small numbers of wildlife. Some species are “area-sensitive” and tend not to inhabit small woodlands, regardless of forest interior conditions. Fragmented habitat also isolates local populations, especially small mammals, amphibians and reptiles with limited mobility. This reduces the healthy mixing of genetic traits that helps populations survive over the long run (Conserving the Forest Interior. Ontario Extension Notes, 2000).
The Environment Canada Guideline also notes that for forest plants that do not disperse broadly or quickly, preservation of some relatively undisturbed large forest patches is needed to sustain them because of their restricted dispersal abilities and specialized habitat requirements and to ensure continued seed or propagation sources for restored or regenerating areas nearby.
The Natural Heritage Reference Manual continues by stating that a larger size also allows woodlands to support more resilient nutrient cycles and food webs and to be big enough to permit different and important successional stages to co-exist. Small, isolated woodlands are more susceptible to the effects of blowdown, drought, disease, insect infestations, and invasions by predators and non-indigenous plants. It is also known that the viability of woodland wildlife depends not only on the characteristics of the woodland in which they reside, but also on the characteristics of the surrounding landscape where the woodland is situated. Additionally, the percentage of forest cover in the surrounding landscape, the presence of ecological barriers such as roads, the ability of various species to cross the matrix surrounding the woodland and the proximity of adjacent habitats interact with woodland size in influencing the species assemblage within a woodland.
In the Irish Creek catchment (in 2014), 140 (35 percent) of the 393 woodland patches are very small, being less than one hectare in size. Another 199 (51 percent) of the woodland patches ranging from one to less than 20 hectares in size tend to be dominated by edge-tolerant bird species. The remaining 54 (14 percent of) woodland patches range between 20 and 550 hectares in size. Forty of these patches contain woodland between 20 and 100 hectares and may support a few area-sensitive species and some edge intolerant species, but will be dominated by edge tolerant species.
Conversely, fourteen (four percent) of the 393 woodland patches in the drainage area exceed the 100 plus hectare size needed to support most forest dependent, area sensitive birds and are large enough to support approximately 60 percent of edge-intolerant species. Seven patches top 200 hectares, which according to the Environment Canada Guideline will support 80 percent of edge-intolerant forest bird species (including most area sensitive species) that prefer interior forest habitat conditions.
Table 11 presents a comparison of woodland patch size in 2008 and 2014 along with any changes that have occurred over that time. An increase (of 80 ha) has been observed in the overall woodland patch area between the two reporting periods with most of the physical change in area occurring in the 50 to 100 and 100 to 200 hectare woodland patch size class ranges.
Table 11 Woodland patches in the Irish Creek catchment (2008 and 2014)
*Includes treed swamps
Forest Interior
The forest interior is habitat deep within woodlands. It is a sheltered, secluded environment away from the influence of forest edges and open habitats. Some people call it the “core” or the “heart” of a woodland. The presence of forest interior is a good sign of woodland health, and is directly related to the woodland’s size and shape. Large woodlands with round or square outlines have the greatest amount of forest interior. Small, narrow woodlands may have no forest interior conditions at all. Forest interior habitat is a remnant natural environment, reminiscent of the extensive, continuous forests of the past. This increasingly rare forest habitat is now a refuge for certain forest-dependent wildlife; they simply must have it to survive and thrive in a fragmented forest landscape (Conserving the Forest Interior. Ontario Extension Notes, 2000).
The Natural Heritage Reference Manual states that woodland interior habitat is usually defined as habitat more than 100 metres from the edge of the woodland and provides for relative seclusion from outside influences along with a moister, more sheltered and productive forest habitat for certain area sensitive species. Woodlands with interior habitat have centres that are more clearly buffered against the edge effects of agricultural activities or more harmful urban activities than those without.
In the Irish Creek catchment (in 2014), the 393 woodland patches contain 190 forest interior patches (Figure 51) that occupy seven percent (1213 ha.) of the catchment land area (which is greater than the five percent of interior forest in the Middle Rideau Subwatershed). This is below the ten percent figure referred to in the Environment Canada Guideline that is considered to be the minimum threshold for supporting edge intolerant bird species and other forest dwelling species in the landscape.
Most patches (163) have less than 10 hectares of interior forest, 111 of which have small areas of interior forest habitat less than one hectare in size. The remaining 27 patches contain interior forest ranging between 11 and 177 hectares in area.
Between 2008 and 2014, there has been a notable change in the number of woodland patches containing smaller areas of interior habitat (Table 12) with an increase of 80 woodlands containing less than one hectare of interior forest over this period and 19 woodlands with one to 10 hectares of interior habitat. This has occurred as a result of the loss of interior forest habitat in the larger woodland patches in the catchment over this period.
Table 12 Woodland Interior in the Irish Creek catchment (2008 and 2014)
Wetland Cover
Wetlands are habitats forming the interface between aquatic and terrestrial systems. They are among the most productive and biologically diverse habitats on the planet. By the 1980s, according to the Natural Heritage Reference Manual, 68 percent of the original wetlands south of the Precambrian Shield in Ontario had been lost through encroachment, land clearance, drainage and filling.
Wetlands perform a number of important ecological and hydrological functions and provide an array of social and economic benefits that society values. Maintaining wetland cover in a watershed provides many ecological, economic, hydrological and social benefits that are listed in the Reference Manual and which may include:
- contributing to the stabilization of shorelines and to the reduction of erosion damage through the mitigation of water flow and soil binding by plant roots
- mitigating surface water flow by storing water during periods of peak flow (such as spring snowmelt and heavy rainfall events) and releasing water during periods of low flow (this mitigation of water flow also contributes to a reduction of flood damage)
- contributing to an improved water quality through the trapping of sediments, the removal and/or retention of excess nutrients, the immobilization and/or degradation of contaminants and the removal of bacteria
- providing renewable harvesting of timber, fuel wood, fish, wildlife and wild rice
- contributing to a stable, long-term water supply in areas of groundwater recharge and discharge
- providing a high diversity of habitats that support a wide variety of plants and animals
- acting as “carbon sinks” making a significant contribution to carbon storage
- providing opportunities for recreation, education, research and tourism
Historically, the overall wetland coverage within the Great Lakes basin exceeded 10 percent, but there was significant variability among watersheds and jurisdictions, as stated in the Environment Canada Guideline. In the Rideau Valley Watershed, it has been estimated that pre-settlement wetland cover averaged 35 percent using information provided by Ducks Unlimited Canada (2010) versus the 21 percent of wetland cover existing in 2014 derived from DRAPE imagery analysis.
Using the same dataset, it is estimated that pre-settlement (historic) wetland cover averaged 32 percent in the Middle Rideau subwatershed versus the 27 percent of cover existing in 2014. This decline in wetland cover is also evident in the Irish Creek catchment (as seen in Figure 52) where there has been a two percent decrease in the area of wetland cover from pre-settlement times to the present (as summarized in Table 13).
Figure 52 Wetland cover in the Middle Rideau subwatershed and Irish Creek catchment (Historic to 2014)
While there has been a reported decrease in wetland cover in the Irish Creek catchment from pre-settlement times, the remaining wetland cover in 2014 remains above the ecological thresholds cited in the Environment Canada Guideline. Nonetheless, in order to maintain critical hydrological, ecological functions along with related recreational and economic benefits provided by these wetland habitats in the catchment, a “no net loss” of currently existing wetlands should be employed to ensure the continued provision of tangible benefits accruing from them for landowners and surrounding communities.
Table 13 Wetland cover in the Middle Rideau subwatershed and Irish Creek catchment (Historic to 2014)
5. Stewardship and Protection
The RVCA and its partners are working to protect and enhance environmental conditions in the Middle Rideau Subwatershed. Figure 53 shows the location of all stewardship projects completed in the Irish Creek catchment along with sites identified for potential shoreline restoration.
Rural Clean Water Projects
From 2009 to 2014, four septic system replacements, two well decommissionings, two well replacements and one education initiative were completed. Between 2003 and 2008, one septic system replacement, one well decommissioning, one clean water diversion and one fuel storage and handling facility were carried out along with one livestock fencing project prior to 2003. Total value of all 14 projects is $100,445 with $33,009 of that amount funded through grant dollars from the RVCA.
Figure 53 Stewardship and potential restoration locations
Tree Planting Projects
The location of RVCA Tree Planting Program projects is shown in Figure 53. From 2009 to 2014, 34,370 trees were planted at five sites. Between 2003 and 2008, 84,700 trees were planted at 16 sites and prior to 2003, 27,400 trees were planted at three sites, resulting in the reforestation of 75 hectares. Total value of all 24 projects is $515,140 with $171,776 of that amount coming from various fundraising sources.
Through the RVCA Butternut Recovery Program, an additional 75 butternut trees were planted in the Irish Creek catchment between 2003 and 2014, as part of efforts to introduce healthy seedlings from tolerant butternuts into various locations across Eastern Ontario.
Shoreline Naturalization Projects
With the assistance of the RVCA’s Shoreline Naturalization Program, 430 trees and shrubs were planted at one project location to create a 120 metre long shoreline buffer at a total project value of $1,068.
Valley, Stream, Wetland and Hazard Land Regulation
The Irish Creek catchment covers 161 square kilometres with 38.3 square kilometres (or 24 percent) of the drainage area being within the regulation limit of Ontario Regulation 174/06 (Figure 54), giving protection to wetland areas and river or stream valleys that are affected by flooding and erosion hazards.
Wetlands occupy 32.7 sq. km. (or 20 percent) of the catchment. Of these wetlands, 20.5 sq. km (or 63 percent) are designated as provincially significant and included within the RVCA regulation limit. This leaves the remaining 12.1 sq. km (or 37 percent) of wetlands in the catchment outside the regulated area limit.
Of the 232.6 kilometres of stream in the catchment, regulation limit mapping has been plotted along 103.4 kilometers of streams (representing 44 percent of all streams in the catchment). Some of these regulated watercourses (81.5 km or 35 percent of all streams) flow through regulated wetlands; the remaining 21.9 km (or 21 percent) of regulated streams are located outside of those wetlands. Plotting of the regulation limit on the remaining 129.2 km (or 56 percent) of streams requires identification of flood and erosion hazards and valley systems.
Within the regulation limit, “development” and “site alteration” require RVCA permission. The “alteration to waterways” provision of Ontario Regulation 174/06 applies to all watercourses.
Figure 54 RVCA regulation limits
Vulnerable Drinking Water Areas
The Irish Creek drainage catchment is considered to have a Highly Vulnerable Aquifer. This means that the nature of the overburden (thin soils, fractured bedrock) does not provide a high level of protection for the underlying groundwater making the aquifer more vulnerable to contaminants released on the surface. The Mississippi-Rideau Source Protection Plan includes policies that focus on the protection of groundwater region-wide due to the fact that most of the region, which encompasses the Mississippi and Rideau watersheds, is considered Highly Vulnerable Aquifer. For detailed maps and policies that have been developed to protect drinking water sources, please go to the Mississippi-Rideau Source Protection Region website at www.mrsourcewater.ca to view the Mississippi-Rideau Source Protection Plan.
6. Challenges/Issues
Water Quality
- Surface chemistry water quality rating in Irish Creek is “Good” (2009 to 2014) and has improved from a “Fair” rating in the 2003-2008 reporting period. While elevated total Kjeldahl nitrogen is a feature of Irish Creek, nutrients and E. coli counts have decreased between the two monitoring periods
- Instream biological water quality conditions at the Irish Creek sample location range from “Very Poor” to “Poor” from 2003 to 2014 (using a grading scheme developed by Ontario Conservation Authorities in Ontario for benthic invertebrates) with an overall rating of “Poor” from 2003 to 2014 as the samples are dominated by species that are tolerant of high organic pollution levels
Shorelines
- The riparian buffer along Irish Creek catchment (30 m. wide strip along the shoreline of all lakes and streams) is comprised of wetland (53 percent), crop and pastureland (25 percent), woodland (18 percent), roads (two percent) and settlement areas (two percent) and (at 71 percent) is below the recommended target to maintain a minimum 30 metre wide, naturally vegetated buffer along at least 75 percent of the length of both sides of rivers, creeks and streams
- Emerald ash borer poses a significant threat to the ecology of the subwatershed, given the prominence of ash trees along shorelines in riparian and wetland areas. Many tree stands are predominantly ash and with their anticipated loss, it is unclear what will replace them and the overall effect of their collective demise on the physical and natural functions/values they provide for erosion, water quality and fish and wildlife habitat protection
Land Cover
- The catchment contains 1213 ha of unevaluated wetland (occupying seven percent of its total area) that provides many important social, hydrological, biological and ecological functions/services. Although not under imminent threat from development activity, they do remain vulnerable to drainage and land clearing activities in the absence of any regulatory and planning controls that would otherwise protect them
Water Levels
- Despite ongoing seepage through the earth berm and fractured bedrock, the Bellamy Lake Dam has had no major structural failure. However, the seepage does mean that the spillway structure toward the north end of the berm does not fully control the water level of the lake. This could mean that, in a drought, lake levels would decline, potentially damaging the fish population and certainly limiting the enjoyment of the lake by its residents and others who use the recreational facilities at the Bellamy Park campground
7. Opportunities/Actions
Water Quality
- Implement agricultural and residential best management practices to improve and maintain nutrient concentrations, E. coli counts and metal concentrations on Irish Creek by restricting livestock access to the creek, limiting the use of fertilizers and pesticide applications and improving or maintaining a shoreline buffer
- Continue to offer the suite of water quality improvement projects provided by the Rideau Valley Rural Clean Water Program to landowners
- Continue to protect Irish Creek and its tributaries through implementation of municipal and agency land use planning and development policies and practices
Shorelines/Headwaters
- Continue to promote the Rideau Valley Shoreline Naturalization and Tree Planting Programs to landowners
- RVCA and its partners (Townships of Elizabethtown-Kitley and Rideau Lakes, Village of Merrickville-Wolford) are to continue educating landowners about the value and importance of headwater drainage features, natural shorelines and waterfront property best management practices with respect to shoreline use and development, septic system installation and maintenance and shoreline vegetation retention and enhancement
- Protect the riparian buffer along the shoreline of Irish Creek and other catchment streams (headwaters) during the development approvals process through adherence to and enforcement of municipal land-use policies and zoning standards
- Target shoreline restoration at sites identified in this report (shown as “Other riparian land cover” in Figure 10 and “Potential Riparian/Shoreline Restoration” in Figure 49) and explore other restoration and enhancement opportunities along Irish Creek and its tributaries
Development
- Collectively work with approval authorities (Townships of Elizabethtown-Kitley and Rideau Lakes, Village of Merrickville-Wolford, Conservation Authority) to consistently implement current land use planning and development policies for water quality and shoreline protection adjacent to Irish Creek and other catchment streams (e.g., a minimum 30 metre development setback from water)
- Explore ways and means to more effectively enforce and implement conditions of land-use planning and development approval to achieve net environmental gains (particularly with respect to rehabilitating or protecting naturally vegetated shorelines and water quality)
- Municipalities and agencies are encouraged to strengthen natural heritage and water resources official plan policies and zoning provisions (water setbacks, frontage and naturalized shorelines and wetland protection) where deemed appropriate
- Utilize RVCA subwatershed and catchment reports to help develop/revise official plan policies to protect surface water resources and the natural environment (including woodlands, wetlands and shoreline cover)
- Consider establishing RVCA regulations limits to protect additional wetlands
Water Levels
- Repair the ongoing Bellamy Lake Dam water seepage problem that could threaten its structural integrity and the maintenance of water levels on Bellamy Lake needed to sustain existing recreational uses and its fish and wildlife habitat during periods of drought
Full Catchment Report
Middle Rideau Subwatershed Report 2015
OTTER LAKE AND CREEK CATCHMENT
The Rideau Valley Conservation Authority produces individual reports for ten catchments in the Middle Rideau subwatershed. Using data collected and analysed by the RVCA through its watershed monitoring and land cover classification programs, surface water quality conditions are reported for Otter Lake and Otter Creek along with a summary of environmental conditions for the surrounding countryside every six years.
This information is used to better understand the effects of human activity on our water resources, allows us to better track environmental change over time and helps focus watershed management actions where they are needed the most to help sustain the ecosystem services (cultural, aesthetic and recreational values; provisioning of food, fuel and clean water; regulation of erosion/natural hazard protection and water purification; supporting nutrient/water cycling and habitat provision) provided by the catchment’s lands and forests and waters (Millennium Ecosystem Assessment 2005).
The following pages of this report are a compilation of that work and contain information on surface water quality, riparian conditions, land cover, stewardship activity and hazard land and water resources protection.
1. Catchment Facts
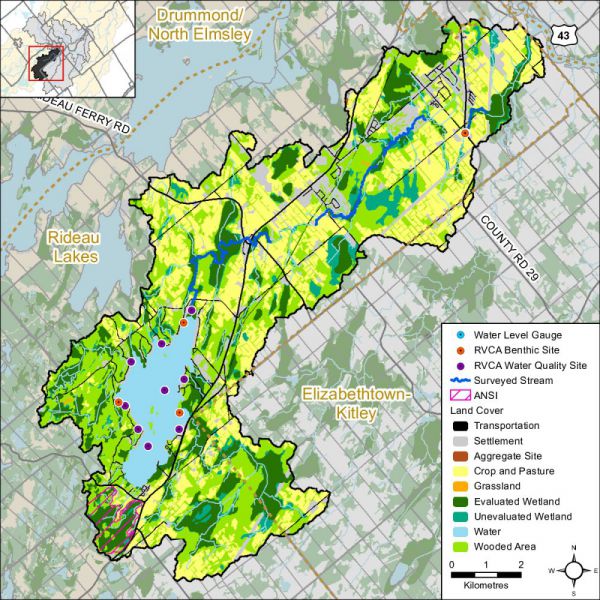
General Geography
- The Rideau River flows through the heart of the Middle Rideau and is a focal point for residents and visitors to the area. It extends from the outlet of Lower Rideau Lake at Poonamalie (where there is one dam and one lock) to Burritts Rapids (where there is also a dam and lock), at which point it enters the Lower Rideau on its way to Rideau Falls. The Rideau River is also an integral part of the Rideau Canal National Historic Site of Canada and is a significant tourist attraction which draws boaters, cottagers, and campers to the area
- Smiths Falls, Merrickville and Burritts Rapids are the main urban settlements in the Middle Rideau subwatershed. Otter Lake is a major rural area of settlement in the catchment and Lombardy is the main urban area. Other areas of the catchment are predominantly rural in character with agriculture being a major land use
- Parks Canada staff manage water levels for recreational purposes along the Rideau Canal/Waterway that runs through the catchment, ensuring 1.5 metres of draft during the navigation season. In this managed system, water levels on the Rideau Canal are manipulated by operation of numerous dams. In the Middle Rideau subwatershed, Parks Canada staff operate 9 dam and lock complexes with 13 locks for a fall of 36.2 metres over 35.6 kilometres. Water levels are maintained as close as possible to set objectives through the May to October navigation season. The levels are lowered through the rest of October and into November and held at the winter levels until the spring freshet in late March or early April naturally increases inflows to the system. To reduce the impact of the higher flows in the spring, the amount of snow water equivalent, forecast rain, ice cover, flows and levels are assessed and the dams in the Middle Rideau reach are operated accordingly to quickly pass as much water as possible. In late April and early May, the dams are gradually closed and water levels are brought up to be ready, once again, for the navigation season
Physical Geography
- The lower three-quarters of the Otter Creek Catchment and the rest of the Middle Rideau Subwatershed primarily resides within the Smith Falls Limestone Plain, which in this area, happens to consist of older Paleozoic quartz sandstone and dolostone of the March Formation. Small sections of the bedrock in the middle and lower catchment areas are overlain by sandy glacial till. Drumlins are found in these areas. The rest of the bedrock in the catchment is overlain by a thin veneer of glacial sediment, referred to as ‘drift’ that is generally less than a metre in thickness. Geologic faults are likely located in the lower one-quarter of the catchment
- The upper one-quarter of the catchment resides within the Algonquin Highlands, which is an ancient (Precambrian) hilly area made up of thin and variable glacial deposits overlying igneous and metamorphic rock ridges and knolls. In this area, rocks consist mainly of marble and rocks associated with ancient geologic faulting
- Ninety-three percent of the catchment lies within the Township of Rideau Lakes and seven percent within the Township of Elizabethtown-Kitley
- Otter Lake and Creek catchment drainage area is 89 square kilometres and occupies about 11 percent of the Middle Rideau subwatershed and two percent of the Rideau Valley watershed
Vulnerable Areas
- The Assessment Report developed under the Ontario Clean Water Act identifies the upper bedrock aquifer underlying all of the catchment area as a Highly Vulnerable Aquifer with parts of the Nepean Sandstone found at the surface near Otter Lake also considered a Significant Groundwater Recharge Area
- Certain lands around Otter Lake are subject to flooding hazard during the regional storm flood (the 100 year flood) conditions in the area. Surveys and studies undertaken in accordance with provincial standards have determined that the 100 year flood elevation for the lake is 125.5 metres above mean sea level
Development/Trends
- There are about 330 residential properties (cottages /homes) and four commercial properties on Otter Lake with no back lot development to-date. Otter Lake has an average shoreline density of 15 properties per kilometer. Much of the waterfront property around Otter Lake was developed from the 1930’s through to the 1960’s. As the supply of subdivided lots has dwindled, the rate of new construction on new lots has slowed and been subsequently overtaken by the conversion (redevelopment) of existing cottages to large permanent residences on small lots, which continues to the present. Any new lot development is typically confined to marginal lands (with steep slopes, shallow soils, narrow waterfronts, low lying poorly-drained soils) as the remaining lands have been fully developed. This can put additional stress on the lake environment because large development envelopes on smaller lots leave less space for natural processes (e.g., runoff, infiltration and retention, nutrient uptake, erosion control and shading) and natural features (e.g., trees, shrubs and plants) that support a healthy lake environment. Minor variances are frequently triggered because the lots do not have sufficient area to provide for a minimum 30 metre development setback from the lake
- Land use in the catchment is predominately Rural (RU) and Agricultural (A) with some areas of Rural Estate Lot Subdivision (RG) located to the south of Smiths Falls. The majority of properties along the shoreline of Otter Lake are zoned Waterfront Residential (RW). Access to Otter Lake is provided via a combination of public and privately maintained roads with the majority of waterfront properties serviced by private roads. The main settlement in the catchment is the village of Lombardy, which includes both residential and commercial uses
Conditions at a Glance
Water Quality
- Surface chemistry water quality rating in Otter Lake and Otter Creek is “Fair” over two reporting periods (2003-2008; 2009-2014)
- Previous surface chemistry water quality reporting for Otter Lake presented in the 2003 Otter Lake State of the Lake Environment report noted that Otter Lake had a moderate concentration of nutrients, generally suitable fish habitat conditions and good water clarity. The data presented in the Surface Water Quality Conditions section of this 2015 report indicates that Otter Lake continues to have these conditions
- Elevated bacterial counts and nutrient concentrations from inflows of nutrients (from private septic systems, agricultural, commercial, residential surface and stormwater runoff) are a feature of Otter Creek and although surface water quality conditions have improved between the two monitoring periods, decreased nutrient and bacterial counts are needed to improve the overall health of the creek
- Instream biological water quality conditions at the Otter Creek sample location range from “Very Poor” to “Fair” from 2003 to 2014 (using a grading scheme developed by Ontario Conservation Authorities in Ontario for benthic invertebrates) with an overall benthic invertebrate water quality rating of “Poor” determined for this period
Instream and Riparian
- Overall instream and riparian condition for the Otter creek catchment as assessed by the stream characterization and headwater drainage feature assessment programs show that Otter Creek and its tributaries are in good condition. The majority of the system has low erosion levels and a healthy riparian corridor with good instream diversity of aquatic habitat. There are opportunities to improve riparian habitat along several identified headwater drainage features
- The Otter Creek catchment has 25 species of recreational and bait fish and is classified as having a warm/cool water thermal guild that supports the Otter Creek fishery
- In the Otter Lake and Creek catchment (in 2014), the riparian buffer (30 m. wide strip along the shoreline of all lakes and streams) is comprised of wetland (56 percent), woodland (24 percent), crop and pastureland (10 percent), settlement areas (seven percent) and transportation routes (three percent)
- Along Otter Creek and tributaries (in 2014), the riparian buffer is comprised of woodland (60 percent), roads (17 percent), wetland (15 percent), crop and pastureland (six percent) and settlement areas (two percent)
- Around Otter Lake (in 2014), the shoreline is dominated by cottages, houses and recreational camps (50 percent) with the remainder composed of woodland (23 percent), wetland (22 percent) and roads (five percent)
- 1994 summer survey of 100 properties on Otter Lake completed by the Township of South Elmsley determined that approximately 42 percent of its shoreline was “natural” and approximately 45 percent was “manicured lawn”. It was further estimated that the lake had 34 percent of all lots in an “untouched” state (Otter Lake Sustainable Lake Report 2015)
Land Cover
- Dominant land cover is woodland (30 percent) and crop and pastureland (29 percent) followed by wetland (22 percent), water (six percent), settlement areas (nine percent) and roads (four percent). From 2008 to 2014, there was an overall change of 138 hectares (from one land cover class to another), most of which can be attributed to the conversion of crop and pastureland and woodland to settlement along with woodland to wetland encroachment
- Woodland cover in the catchment has decreased by 64 hectares between 2008 and 2014 and interior forest habitat has decreased by 27 hectares
- Wetland cover has decreased by three percent (261 ha) from pre-settlement times to the present and now occupies 22 percent of the catchment area
Other
- Approximately 860 in-use water wells with provincial records exist in this catchment. While most water wells are used for domestic water supply, several are also used for commercial, agricultural, and public water supplies
- There are no active Permits to Take Water or Environmental Compliance Approvals in the catchment; nor are there any open or closed aggregate operations in the catchment
Catchment Care
- RVCA has monitored surface water quality in the Otter Lake and Creek catchment through its Watershed Watch Program since 2002. In 2006, the program was altered to gain consistent, year to year data for the set of lakes being monitored. RVCA monitors surface water quality in Otter Lake four times of the year at two deep point sites (eight samples annually), twice a year at three shoreline sites (six samples annually) and twice a year at an additional four sites every fifth year (eight samples in total)
- RVCA has been collecting benthic invertebrates in Otter Creek at the County Road 29 site since 2003
- RVCA conducted a fish survey along Otter Creek in 2014
- RVCA completed a stream characterization survey on Otter Creek in 2014, working upstream to the headwaters from the mouth of the creek where it empties into the Rideau River taking measurements and recording observations on instream habitat, bank stability, other attributes and preparing a temperature profile
- RVCA completed 17 headwater drainage feature assessments at road crossings in the Otter Creek catchment in 2014. This protocol measures zero and first order headwater drainage features and is a rapid assessment method characterizing the amount of water, sediment transport, and storage capacity within headwater drainage features
- RVCA provides septic system re-inspection at the request of the Township of Rideau Lakes. From 2007 to 2015, the Mississippi Rideau Septic System Office performed 66 voluntary septic system re-inspections on Otter Lake properties. Remedial/maintenance work was recommended for 62 percent of those properties that were inspected, septic system replacements at another two properties with more information provided to two other landowners with identified septic system concerns. No specific concerns were noted for the other 21 septic systems that were inspected
- Thirty-six stewardship projects have been completed with assistance from the RVCA’s Rural Clean Water and Tree Planting Programs (see Section 5 of this report for details)
- The Otter Lake Landowners’ Association is an association of property owners from all around Otter Lake that was formed in 1992. OLLA's objectives are simple and straightforward - to maintain the health of Otter Lake by working with local and regional governments, existing road associations, and individual landowners with properties on Otter Lake. The vision for the lake, as documented in the Otter Lake Sustainable Lake Plan is “A place where water quality, fish and wildlife habitat, natural beauty, recreational opportunities and peace and tranquility is maintained and improved for present and future generations to enjoy.” Values identified by property owners (in a 2015 survey) as very important include water quality (94%), swimming (70%), peace and quiet (60%), wildlife and bird watching (40%), natural shorelines (39%), sailing and paddling (39%), fishing (16%) and boating (13%). Some of the Association’s water resources management and aquatic/terrestrial habitat protection efforts include:
- Ongoing water quality monitoring of E. coli, Nitrogen and Phosphorous in conjunction with the RVCA and reporting of water quality results back to the community
- Continuing promotion of the voluntary septic system re-inspection program that the Township of Rideau Lakes introduced in 2007
- Promoting existing stewardship programs (like the RVCA’s Shoreline Naturalization Program) to the lake community to protect and enhance shorelines and protect water quality
- Continuing the water level monitoring program on Otter Lake Continue and reporting findings of the monitoring program to the community on a regular basis
- Visit Otter Lake Landowners’ Association to learn more about its activities and to view the Otter Lake Sustainable Lake Plan
- A watershed model developed by the RVCA in 2009 was used to study the hydrologic function of wetlands in the Rideau Valley Watershed, including those found in the Otter Lake and Creek catchment
- Several MOE Permits to Take Water have been issued in the vicinity of Otter Creek for golf course irrigation and water supply; for groundwater supply wells in Otterdale Estates and for a wetland conservation project requiring surface water impoundment
- Several other MOE Environmental Compliance Approvals have been issued for the disposal of effluent from large septic treatment systems at a campground, a children’s camp and a mobile home park
- The Township of Rideau Lakes has land use planning policies and zoning provisions - on lake capacity, water setbacks, frontage and naturalized shorelines and wetland protection - and use site plan control to implement these policies and provisions. Together with RVCA, the Township works with landowners on a case by case basis to achieve net environmental gains (particularly with respect to shoreline vegetation protection and rehabilitation) through the application of shoreline best management practices. Through the land-use planning process, the Township, RVCA and agencies request conditions of approval to ensure that development and redevelopment is appropriate for the property, impacts on neighbours are minimized (particularly on very small lots) and development setbacks for the shoreline are maximized
- Development in and adjacent to Provincially Significant Wetlands and some locally significant wetlands is subject to Ontario Regulation 174-06 (entitled “Development, Interference with Wetlands and Alterations to Shorelines and Watercourses”) that protects the hydrologic function of the wetland and also protects landowners and their property from natural hazards (flooding, fluctuating water table, unstable soils) associated with them
- The shoreline of Otter Lake is held in private ownership, so that the best opportunity for shoreline restoration/enhancement rests with private landowners. RVCA offers its Shoreline Naturalization Program to Otter Lake landowners to assist with shoreline re-vegetation
2. Surface Water Quality Conditions
Surface water quality conditions in the Otter Lake and Creek catchment are monitored by the Rideau Valley Conservation Authority’s (RVCA) Watershed Watch Program and Baseline Water Quality Monitoring Program. Watershed Watch monitors watershed lakes to assess nutrient concentrations, water clarity, dissolved oxygen availability and pH. The baseline water quality program focuses on streams; data is collected for 22 parameters including nutrients (total phosphorus, total Kjeldahl nitrogen and ammonia), E. coli, metals (like aluminum and copper) and additional chemical/physical parameters (such as alkalinity, chlorides, pH and total suspended solids). Figure 1 shows the locations of monitoring sites in the catchment.
Figure 1 Water quality monitoring sites on Otter Lake and Creek
Otter Lake and Creek Water Quality
Water Quality Rating
The water quality rating for Otter Lake and Otter Creek (OTT-01) is “Fair” (Table 1) as determined by the Canadian Council of Ministers of the Environment (CCME) Water Quality Index. A "Fair" rating indicates that water quality is usually protected but is occasionally threatened or impaired; conditions sometimes depart from natural or desirable levels. Each parameter is evaluated against established guidelines to determine water quality conditions. Those parameters that frequently exceed guidelines are presented below. Analysis of the data has been broken into two periods; 2003 to 2008 and 2009 to 2014 to examine if conditions have changed between these periods. Table 1 shows the overall rating for the monitored surface water quality sites within the Otter Creek catchment and Table 2 outlines the Water Quality Index (WQI) scores and their corresponding ratings. It should be noted that Otter Lake WQI stayed within the Fair rating range, however the score dropped from 77 to 65, which is the lowest rating in that category before moving to a poor rating.
Table 1 Water Quality Index ratings for the Otter Creek Catchment
Table 2 Water Quality Index ratings and corresponding index scores (RVCA terminology, original WQI category names in brackets)
2) a. Otter Lake Water Quality
Surface water quality conditions in Otter Lake (RVL-26) have been monitored by RVCA’s Watershed Watch Program since 2003. Data from two deep point sites have been used to calculate the WQI rating for Otter Lake, which was determined to be “Fair” (Table 1). Moderate nutrient concentrations, good oxygen availability, clear water and occasionally elevated pH levels contributed to the rating. The following discussion explains how each of the monitored water quality parameters contributes to the lake’s water quality.
This report also considers data from seven additional shoreline sites that are monitored around the lake. These sites have not been included in the calculation of the CCME WQI rating, as they are not monitored with the same frequency as deep point sites. However, they do provide important information on water quality conditions in the near shore areas. For locations of shoreline sites please see Figure 1.
The 2003 Otter Lake State of the Lake Environment Report (Rideau Valley Conservation Authority, 2005) noted that Otter Lake had a moderate concentration of nutrients, generally suitable fish habitat conditions and good water clarity. The data presented in this report indicates that this continues to be the case and that a proactive cautionary program of best management practices is important to ensure the protection of the lake environment.
Nutrients
Total phosphorus (TP) is used as a primary indicator of excessive nutrient loading and contributes to abundant aquatic vegetation growth and depleted dissolved oxygen levels. The Provincial Water Quality Objective (PWQO) is used as the TP Guideline and states that in lakes, concentrations greater than 0.020 mg/l indicate an excessive amount of TP within the water column.
Total Kjeldahl nitrogen (TKN) is used as a secondary indicator of nutrient loading. RVCA uses a guideline of 0.500 mg/l to assess TKN[1] within surface waters.
At the Deep Points
TP and TKN sampling results are presented in Figures 2 to 5. In the 2003 to 2008 period, 100 percent of samples analyzed for TP were less than the TP guideline and stayed fairly consistent at 97 percent in the 2009 to 2014 period. The average TP concentration slightly increased from 0.009 mg/l to 0.010 mg/l. TKN concentrations were fairly normal with 97 percent of reported results below the TKN guideline in the first period (2003-2008); this decreased to 89 percent of samples in the 2009 to 2014 period. The average TKN concentration declined from 0.411 mg/l to 0.404 mg/l (Table 3).
Figure 2 Total phosphorous sampling results at deep point sites on Otter Lake, 2003-2008
Figure 3 Total phosphorous sampling results at deep point sites on Otter Lake, 2009-2014
Figure 4 Total Kjeldahl nitrogen sampling results at deep point sites on Otter Lake, 2003-2008
Figure 5 Total Kjeldahl nitrogen sampling results at deep point sites on Otter Lake, 2009-2014
Table 3 Summary of nutrient results for Otter Lake over two monitoring periods (2003-2008 and 2009-2014)
Average year to year concentrations have varied for both TP and TKN (Figures 6-9) from 2003-2008 and 2009-2014. An increase in average concentrations from 2008 to 2013 is visible, however all average TP and TKN results are below the guidelines in both monitoring periods (2003-2008 and 2009-2014). Overall, the data presented indicates that nutrient concentrations may be considered moderate in the mid-lake, deep water sites on Otter Lake.
Figure 6 Average total phosphorous results at deep point sites on Otter Lake, 2003-2008
Figure 7 Average total phosphorous results at deep point sites on Otter Lake, 2009-2014
Figure 8 Average total Kjeldahl nitrogen results at deep point sites on Otter Lake, 2003-2008
Figure 9 Average total kjeldahl nitrogen results at deep point sites on Otter Lake, 2009-2014
Around the Lake
The average nutrient concentrations at monitored shoreline sites around the lake vary from year to year (Figures 10-13). Please note that in the 2003-2008 monitoring period, sites were not sampled in 2004 and 2005. Sites B, C and F were sampled in 2003, 2006, 2007 and 2008 while sites A, D, E and G were only sampled in 2003 and 2008. In the second monitoring period (2009-2014) sites B, C and F were sampled every year, while sites A, D, E and G were sampled every fifth year.
Average total phosphorous concentrations are below the TP guideline at all sites in both monitoring periods (Figures 10 and 11), indicating nutrient enrichment does not to appear to be a problem in the monitored near shore areas.
TKN concentrations were also below the guideline at monitored sites; with the exception in 2013 at sites C and F which showed TKN concentrations above the guideline. Nutrient enrichment does not appear to be a problem in the monitored shoreline sites on Otter Lake (Figures 12 and 13).
Figure 10 Average total phosphorous concentrations at shoreline monitoring sites in Otter Lake, 2003-2008
Figure 11 Average total phosphorous concentrations at shoreline monitoring sites in Otter Lake, 2009-2014
Figure 12 Average total Kjeldahl nitrogen concentrations at shoreline monitoring sites in Otter Lake, 2003-2008
Figure 13 Average total Kjeldahl nitrogen concentrations at shoreline monitoring sites in Otter Lake, 2009-2014
Summary
Otter Lake nutrient concentrations are generally below the guidelines, with few exceedances. Average TP and TKN results (Table 3) are comparable to the 2003 Otter Lake State of the Lake Environment Report (Rideau Valley Conservation Authority, 2005) with TP concentrations of about .010 mg/l and TKN concentrations of about .445 mg/l.
Efforts such as the diversion of runoff and enhanced shoreline buffers are important to continue to protect and enhance water quality and reduce future nutrient exceedances. Nutrient exceedances may be partially attributed to the natural aging of a lake and basin characteristics. All residents can help reduce their impact on the lake by reducing nutrient inputs through practices such as proper maintenance of septic systems, keeping shorelines natural and using phosphate free soaps and detergents.
Water Clarity
Water clarity is measured using a Secchi disk during each deep point sample. Table 4 summarizes the recorded depths and shows that all readings have exceeded the minimum PWQO of 2 metres indicating that algae in the water column is not at excessive levels (good water clarity). Less than 2 m will indicate overproduction in a lake. The average Secchi depth increased from 5.8 metres (2003- 2008) to 6.4 metres (2009-2014). Figures 14 and 15 show that no individual reading has been below the guideline and measured depths range from 3.5 metres (Figure 15) to 12.5 metres (Figure 15). It should be noted that Secchi depths in many waterbodies have been influenced by the colonization of zebra mussels resulting in clearer waters than may have been seen prior to the introduction of this species; zebra mussels have been reported in Otter Lake since 2001.
Table 4 Summary of Secchi depths recorded at the deep point sites on Otter Lake, 2003-2008 and 2009-2014
Figure 14 Recorded Secchi depths at the deep point sites on Otter Lake, 2003-2008
Figure 15 Recorded Secchi depths at the deep point sites on Otter Lake, 2009-2014
Summary
Waters on Otter Lake are very clear and sufficient sunlight is able to penetrate the water column to support aquatic life and provide sufficient visibility for safe recreational use (boating, swimming). The 2003 Otter Lake State of the Lake Environment Report (Rideau Valley Conservation Authority, 2005) reported Secchi depths between 2.7 and 5.6 metres. The increase in water clarity can likely be attributed to the establishment of zebra mussels found in Otter Lake.
Fish Habitat
Two other factors, dissolved oxygen/temperature and pH were also assessed to provide an overall sense of the health of Otter Lake from a fish habitat perspective.
Dissolved Oxygen and Temperature
The red bars in Figures 16-19 show the depths where suitable conditions exist for cool water fish species (temperature less than 25°C and dissolved oxygen greater than 4 mg/l) at the monitored deep point sites (RVL-26DP1 and RVL-26DP3). The vertical axis represents the total lake depth at each site where the profile is taken. Suitable habitat conditions increased over the two time periods from an average of 21.5 metres at RVL-26DP1 (Figure 16) in 2003-2008 period to 24.1 metres (Figure 18) in the 2009-2014 period. Deep point site RVL-26DP3 increased from and 21.9 metres (Figure 17) in 2003-2008 period to 24.9 metres (Figure 19) in the 2009-2014 monitoring period.
Figure 16 Depths suitable for warm water fish species at site RVL-26DP1, 2003-2008
Figure 17 Depths suitable for warm water fish species at site RVL-26DP3, 2003-2008
Figure 18 Depths suitable for cool water fish species at site RVL-26DP1, 2009-2014
Figure 19 Depths suitable for cool water fish species at site RVL-26 DP3 2009-2014
pH
pH is a basic water quality parameter used to assess the acidity of water, an important factor for aquatic life. Figures 20 and 21 show pH concentrations in Otter Lake while Figures 22 and 23 summarize average concentrations by year.
Figure 20 pH concentrations at the deep point sites on Otter Lake, 2003-2008
Figure 21 pH concentrations at the deep point sites on Otter Lake, 2009-2014
Figure 22 Average pH concentrations at the deep point sites on Otter Lake, 2003-2008
Figure 23 Average pH concentrations at the deep point sites on Otter Lake, 2009-2014
The majority of samples for both time periods were within guidelines established by the PWQO which state that pH should be between 6.5 and 8.5 to protect aquatic life and prevent irritation for anyone using the waters for recreational purposes (Table 5). Average results border on the upper limit of the guideline and there was very little change between both monitoring periods indicating that elevated pH is a feature of this lake. Surface water’s that are found to be more alkaline (higher pH) can generally be attributed to the geology rather than anthropogenic activities. Biological activities such as photosynthesis may also affect pH.
Table 5 Summary of pH results at the deep point sites on Otter Lake, 2003-2008 and 2009-2014
Summary
Overall the water chemistry data at the deep point describes suitable habitat conditions for warm water fish species such as yellow perch, walleye and pike. There is some evidence that the warming of the water column in the late summer/fall may limit the amount of habitat for some sensitive species. pH conditions are typically on the upper end of the range recommended for the protection of aquatic life. Overall, the data indicates a healthy environment for aquatic species.
E. Coli
E. coli is sampled at monitored shoreline sites twice each sampling season. E. coli data was not used in the calculations of the WQI rating for the lake due to differences in sampling frequency and site locations. In both monitoring periods (2003-2008 and 2009-2014) all samples were below the E. coli guideline of 100 colony forming units (CFU) per 100 ml set by the PWQO. Across the lake for both monitoring periods the count at the geometric mean[2] was only 2 CFU/100ml (Table 6).
Table 6 Summary of E. coli results for Otter Lake, 2003-2008 and 2009-2014
Figure 24 Geometric mean of shoreline sites monitored on Otter Lake, 2003-2008
Figure 25 Geometric mean of shoreline sites monitored on Otter Lake, 2009-2014
Figures 24 and 25 show the distribution of counts across all shoreline sites. All sites fall well below the guideline of 100 CFU/100ml. This is consistent with E. coli results from the 2003 Otter Lake State of the Lake Environment Report (Rideau Valley Conservation Authority, 2005) that indicated an average of 2.5 CFU/100ml.
Summary
The results presented above provide evidence that bacterial contamination is not a significant concern in Otter Lake and the water should be safe for recreational use such as swimming and boating.
2) b. Otter Creek Water Quality
There is one stream site on Otter Creek monitored in the Otter Lake and Creek catchment (OTT-01, Figure 1). Analysis of the data has been broken into two periods, 2003-2008 and 2009-2014, to examine if conditions have changed within this timeframe. Water quality at this site is reported as “Fair” (Table 1). The score at this site is largely influenced by elevated nutrient concentrations, metals and high bacterial counts. For more information on the CCME WQI, please see the Middle Rideau Subwatershed Report 2015.
Nutrients
Total phosphorus (TP) is used as a primary indicator of excessive nutrient loading and may contribute to abundant aquatic vegetation growth and depleted dissolved oxygen levels. The Provincial Water Quality Objective (PWQO) is used as the TP Guideline and states that in streams concentrations greater than 0.030 mg/l indicate an excessive amount of TP.
Total Kjeldahl nitrogen (TKN) and ammonia (NH3) are used as secondary indicators of nutrient loadings. RVCA uses a guideline of 0.500 mg/l to assess TKN[1] and the PWQO of 0.020 mg/l to assess ammonia concentrations at the monitored site.
Tables 7, 8 and 9 summarize average nutrient concentrations at monitored sites within the Otter Lake and Creek catchment and show the proportion of results that meet the guidelines.
Table 7 Summary of total phosphorous results for Otter Creek, 2003-2008 and 2009-2014. Highlighted values indicate average concentrations that exceed the guideline
Table 8 Summary of total Kjeldahl nitrogen results for Otter Creek, 2003-2008 and 2009-2014. Highlighted values indicate average concentrations that exceed the guideline
Table 9 Summary of Ammonia results for Otter Creek, 2003-2008 and 2009-2014. Highlighted values indicate average concentrations that exceed the guideline
Elevated TP results were a regular occurrence in the 2003-2008 monitoring period at site OTT-01. The 2009-2014 monitoring period saw an improvement with less exceedances. Site OTT-01 had 29 percent of samples that were below the guideline in the 2003-2008 period (Figure 26); this increased to 59 percent of samples in the 2009-2014 period (Figure 27). The average TP concentration also decreased from 0.041 mg/l to 0.030 mg/l (Table 7).
Figure 26 Total phosphorous concentrations in Otter Creek, 2003-2008
Figure 27 Total phosphorous concentrations in Otter Creek, 2009-2014
TKN results show that the bulk of results exceeded the guideline (Figures 28 and 29); there were few samples (17 percent) below the guideline in the 2003-2008 period and this declined to only 16 percent in the 2009-2014 period. The average concentration was generally elevated and decreased from 0.712 mg/l to 0.672 mg/l (Table 8).
Figure 28 Total Kjeldahl nitrogen concentrations in Otter Creek, 2003-2008
Figure 29 Total Kjeldahl nitrogen concentrations in Otter Creek, 2009-2014
The trend of elevated nutrients is also observed in NH3 data, as results at this site were generally above the guideline of 0.020 mg/l (Figures 30 and 31); the proportion of samples below the guideline remained the same with 58 percent. However, as observed with TP and TKN, this was accompanied by a decrease in the average concentration from 0.058 mg/l (2003-2008) to 0.016 mg/l (2009-2014).
Figure 30 Ammonia concentrations in Otter Creek, 2003-2008
Figure 31 Ammonia concentrations in Otter Creek, 2009-2014
Summary
The data shows that nutrient enrichment is a feature of Otter Creek. High nutrient concentrations can help stimulate the growth of algae blooms and other aquatic vegetation in a waterbody and deplete oxygen levels as the vegetation dies off. It is important to reduce human impacts wherever possible. Strategies to reduce nutrient inputs may include diversion of runoff to the creek and enhanced shoreline buffers.
E. Coli
E. coli is used as an indicator of bacterial pollution from human or animal waste; in elevated concentrations it can pose a risk to human health. The PWQO of 100 colony forming units/100 milliliters (CFU/100 ml) is used to assess E. coli. Counts greater than this guideline indicate that bacterial contamination may be a problem within a waterbody.
Table 10 summarizes the geometric mean[2] for the monitored site on Otter Creek and shows the proportion of samples that meet the E. coli guideline of 100 CFU/100 ml. The geometric mean with respect to the guideline for the two periods (2003-2008 and 2009-2014) is shown in Figures 32 and 33 respectively.
Table 10 Summary of E. coli results for Otter Creek, 2003-2008 and 2009-2014. Highlighted values indicated average concentrations have exceeded the guideline
E. coli results at site OTT-01 indicate bacterial counts are frequently above the E. coli guideline. The proportion of samples below the guideline improved from 21 percent (Figure 32) to 46 percent (Figure 33). Reduced counts are also observed at the geometric mean which declined from 313 CFU/100ml to 115 CFU/100ml (Table 10).
Figure 32 Geometric mean of E. coli results on Otter Creek, 2003-2008
Figure 33 Geometric mean of E. coli results on Otter Creek, 2009-2014
Summary
Results indicate that bacterial contamination is a concern in Otter Creek. There has been an improvement from the 2003-2008 monitoring period to the 2009-2014 monitoring period, however a majority of samples still exceed the PWQO. The count at the geometric mean is above the PWQO for both monitoring periods. Properly maintaining septic systems, enhancing shoreline buffers and restricting cattle access can help to improve E.coli levels in Otter Creek.
Metals
Of the metals routinely monitored in Otter Creek, aluminum (Al) and iron (Fe) occasionally reported concentrations above their respective PWQOs. In elevated concentrations, these metals can have toxic effects on sensitive aquatic species. Tables 11 and 12 summarize metal concentrations at the monitored site and show the proportion of samples that meet guidelines. Figures 34 to 36 show metal concentrations with respect to the guidelines for the two periods of interest, 2003–2008 and 2009–2014. For Al, the PWQO is 0.075 mg/l and for Fe it is 0.300 mg/l.
Results from OTT-01 shows that Al concentrations had some exceedances with 67 percent of samples below the guideline in the 2003-2008 period (Figure 34). This improved to 92 percent of samples in the 2009-2014 period (Figure 35). The average concentration of Al was 0.132 mg/l from 2003-2008 which exceeds the guideline. From 2009-2014 the average concentration improved to 0.025 mg/l which is below the guideline.
Table 11 Summary of Aluminum results for Otter Creek, 2003-2008 and 2009-2014
Table 12 Summary of Iron results for Otter Creek, 2003-2008 and 2009-2014
Figure 34 Average aluminum concentrations in Otter Creek, 2003-2008
Figure 35 Average aluminum concentrations in Otter Creek, 2009-2014
Iron concentrations also exceeded the guideline. The proportion of samples below the guideline increased from 74 percent to 92 percent (Figures 36 and 37). Although there were observed exceedances, the average concentration did not exceed the guideline in both monitoring periods; 0.241 mg/l in 2003-2008 and .068 mg/l in 2009-2014.
Figure 36 Average iron concentrations in Otter Creek, 2003-2008
Figure 37 Average iron concentrations in Otter Creek, 2009-2014
Summary
Overall, a general decline in metal concentrations was observed between the two periods of interest. Efforts should continue to be made to identify pollution sources and implement best management practices to reduce any inputs such as runoff, metal alloys, fungicides and pesticides to improve overall stream health and lessen downstream impacts.
[1] No Ontario guideline for TKN is presently available; however, waters not influenced by excessive organic inputs typically range from 0.100 to 0.500 mg/l, Environment Canada (1979) Water Quality Sourcebook, A Guide to Water Quality Parameters, Inland Waters Directorate, Water Quality Branch, Ottawa, Canada
[2] A type of mean or average, which indicates the central tendency or typical value of a set of numbers by using the product of their values (as opposed to the arithmetic mean which uses their sum). It is often used to summarize a variable that varies over several orders of magnitude, such as E. coli counts.
3. Otter Creek and Lake Riparian Conditions
Shoreline Buffer Land Cover Evaluation
The riparian or shoreline zone is that special area where land meets water. Well-vegetated shorelines are critically important in protecting water quality and creating healthy aquatic habitats, lakes and rivers. Natural shorelines intercept sediments and contaminants that could impact water quality conditions and harm fish habitat in streams. Well established buffers protect the banks against erosion, improve habitat for fish by shading and cooling the water and provide protection for birds and other wildlife that feed and rear young near water. A recommended target (from Environment Canada’s Guideline: How Much Habitat is Enough?) is to maintain a minimum 30 metre wide vegetated buffer along at least 75 percent of the length of both sides of rivers, creeks and streams.
Figure 38 shows the extent of the naturally vegetated riparian zone along a 30 metre wide strip of the shoreline of Otter Lake, Otter Creek and its tributaries. This information is derived from a dataset developed by the RVCA’s Land Cover Classification Program through heads-up digitization of 20cm DRAPE ortho-imagery at a 1:4000 scale, which details the catchment landscape using 10 land cover classes.
Figure 38 Natural and other riparian land cover in the Otter Lake and Creek catchment
This analysis shows that the Otter Lake and Creek catchment riparian buffer is comprised of wetland (56 percent), woodland (24 percent), crop and pastureland (10 percent), settlement areas (seven percent) and transportation routes (three percent). Along Otter Creek and its tributaries, the riparian buffer is comprised of woodland (60 percent), roads (17 percent), wetland (15 percent), crop and pastureland (six percent) and settlement areas (two percent). Around Otter Lake itself, the shoreline buffer is dominated by cottages, houses and recreational camps (50 percent) with the remainder composed of woodland (23 percent), wetland (22 percent) and roads (five percent).
Additional statistics for the Otter Lake and Creek catchment and Otter Lake itself are presented in Tables 13 and 14. Of particular interest is the observed increase in the area of “Settlement” along the shoreline of Otter Lake over a six year period.
Table 13 Riparian land cover (2008 vs. 2014) in the Otter Lake and Creek catchment
Table 14 Riparian land cover (2008 vs. 2014) around Otter Lake
Otter Creek Overbank Zone
Riparian Buffer Width Evaluation
Figure 39 demonstrates the buffer conditions of the left and right banks separately. Otter Creek had a buffer of greater than 30 meters along 86 percent of the right bank and 91 percent of the left bank.
Figure 39 Riparian buffer evaluation along Otter Creek
Adjacent Land Use
The RVCA’s Stream Characterization Program identifies seven different land uses beside Otter Creek (Figure 40). Surrounding land use is considered from the beginning to end of the survey section (100 m) and up to 100m on each side of the creek. Land use outside of this area is not considered for the surveys but is nonetheless part of the subwatershed and will influence the creek. Natural areas made up 91 percent of the stream, characterized by wetlands, forest, scrubland and meadow. The remaining land use consisted of infrastructure in the form of residential, recreational and road crossings.
Figure 40 Land Use along Otter Creek
Otter Creek Shoreline Zone
Instream Erosion
Erosion is a normal, important stream process and may not affect actual bank stability; however, excessive erosion and deposition of sediment within a stream can have a detrimental effect on important fish and wildlife habitat. Poor bank stability can greatly contribute to the amount of sediment carried in a waterbody as well as loss of bank vegetation due to bank failure, resulting in trees falling into the stream and the potential to impact instream migration. Figure 41 shows low levels of erosion along Otter Creek.
Figure 41 Erosion along Otter Creek
Undercut Stream Banks
Undercut banks are a normal and natural part of stream function and can provide excellent refuge areas for fish. Figure 42 shows that Otter Creek had low levels of undercut banks.
Figure 42 Undercut stream banks along Otter Creek
Stream Shading
Grasses, shrubs and trees all contribute towards shading a stream. Shade is important in moderating stream temperature, contributing to food supply and helping with nutrient reduction within a stream. Figure 43 shows highly variable stream shading conditions ranging from low levels to high levels along Otter Creek.
Figure 43 Stream shading along Otter Creek
Instream Woody Debris
Figure 44 shows that the majority of Otter Creek had low to moderate levels of instream woody debris in the form of branches and trees. Instream woody debris is important for fish and benthic invertebrate habitat, by providing refuge and feeding areas.
Figure 44 Instream woody debris along Otter Creek
Overhanging Trees and Branches
Figure 45 shows low levels of overhanging branches and trees along Otter Creek. Overhanging branches and trees provide a food source, nutrients and shade which helps to moderate instream water temperatures.
Figure 45 Overhanging trees and branches along Otter Creek
Anthropogenic Alterations
Figure 46 shows 76 percent of Otter Creek remains “unaltered” with no anthropogenic alterations. Nineteen percent of Otter Creek was classified as natural with minor anthropogenic changes, two percent was classified as altered and three percent of its length was considered highly altered in the form of road crossings.
Figure 46 Anthropogenic alterations along Otter Creek
Otter Creek Instream Aquatic Habitat
Benthic Invertebrates
Freshwater benthic invertebrates are animals without backbones that live on the stream bottom and include crustaceans such as crayfish, molluscs and immature forms of aquatic insects. Benthos represent an extremely diverse group of aquatic animals and exhibit wide ranges of responses to stressors such as organic pollutants, sediments and toxicants, which allows scientists to use them as bioindicators. As part of the Ontario Benthic Biomonitoring Network (OBBN), the RVCA has been collecting benthic invertebrates at the County Road 29 site on Otter Creek since 2003. Monitoring data is analyzed for each sample site and the results are presented using the Family Biotic Index, Family Richness and percent Ephemeroptera, Plecoptera and Trichoptera.
Hilsenhoff Family Biotic Index
The Hilsenhoff Family Biotic Index (FBI) is an indicator of organic and nutrient pollution and provides an estimate of water quality conditions for each site using established pollution tolerance values for benthic invertebrates. FBI results for Otter Creek are separated by reporting period 2003 to 2008 and 2009 to 2014. “Very Poor” to “Fair” water quality conditions being observed at the Otter Creek sample location for the period from 2003 to 2014 (Fig.47) using a grading scheme developed by Conservation Authorities in Ontario for benthic invertebrates.
Figure 47 Hilsenhoff Family Biotic Index on Otter Creek
Family Richness
Family Richness measures the health of the community through its diversity and increases with increasing habitat diversity suitability and healthy water quality conditions. Family Richness is equivalent to the total number of benthic invertebrate families found within a sample. Although the family richness appears to be fair for the Otter Creek sample location the samples are dominated by species that are moderately tolerant and tolerant to poor water quality conditions. Otter Creek is reported to have “Fair” family richness (Fig.48).
Figure 48 Family Richness in Otter Creek
EPT
Ephemeroptera (Mayflies), Plecoptera (Stoneflies), and Trichoptera (Caddisflies) are species considered to be very sensitive to poor water quality conditions. High abundance of these organisms is generally an indication of good water quality conditions at a sample location. The community structure is dominated by species that are not sensitive to poor water quality conditions. As a result, the EPT indicates that Otter Creek is reported to have “Poor” water quality (Fig.49) from 2003 to 2014.
Figure 49 EPT in Otter Creek
Overall Otter Creek has a water quality rating from a benthic invertebrate perspective of “Poor” from 2003 to 2014.
Habitat Complexity
Streams are naturally meandering systems and move over time; there are varying degrees of habitat complexity, depending on the creek. Examples of habitat complexity include variable habitat types such as pools and riffles as well as substrate variability and woody debris structure. A high percentage of habitat complexity (heterogeneity) typically increases the biodiversity of aquatic organisms within a system. Fifty five percent of Otter Creek was considered heterogeneous, as shown in Figure 50.
Figure 50 Habitat complexity along Otter Creek
Instream Substrate
Diverse substrate is important for fish and benthic invertebrate habitat because some species have specific substrate requirements and for example will only reproduce on certain types of substrate. Figure 51 shows that 36 percent of the substrate observed on Otter Creek was dominated by silt. Overall substrate conditions were highly variable along Otter Creek. Figure 52 shows the dominant substrate along Otter Creek.
Figure 51 Instream substrate along Otter Creek
Figure 52 Dominant instream substrate along Otter Creek
Cobble and Boulder Habitat
Boulders create instream cover and back eddies for large fish to hide and/or rest out of the current. Cobble provides important spawning habitat for certain fish species like walleye and various shiner species who are an important food source for larger fish. Cobble can also provide habitat conditions for benthic invertebrates that are a key food source for many fish and wildlife species. Figure 53 shows where cobble and boulder substrate are found in Otter Creek.
Figure 53 Instream cobble and boulder along Otter Creek
Instream Morphology
Pools and riffles are important habitat features for fish. Riffles are areas of agitated water and they contribute higher dissolved oxygen to the stream and act as spawning substrate for some species of fish, such as walleye. Pools provide shelter for fish and can be refuge pools in the summer if water levels drop and water temperature in the creek increases. Pools also provide important over wintering areas for fish. Runs are usually moderately shallow, with unagitated surfaces of water and areas where the thalweg (deepest part of the channel) is in the center of the channel.
Figure 54 shows that Otter Creek is variable; 82 percent consists of runs, 11 percent pools and 8 percent riffles. Figure 55 shows where riffle habitat is located along Otter Creek.
Figure 54 Instream morphology along Otter Creek
Figure 55 shows where riffle habitat was observed along Otter Creek
Vegetation Type
Instream vegetation provides a variety of functions and is a critical component of the aquatic ecosystem. For example emergent plants along the shoreline can provide shoreline protection from wave action and important rearing habitat for species of waterfowl. Submerged plants provide habitat for fish to find shelter from predator fish while they feed. Floating plants such as water lilies shade the water and can keep temperatures cool while reducing algae growth. Otter Creek had high levels of diversity of instream vegetation. The dominant vegetation type recorded at twenty-five percent consisted of submerged plants. Figure 56 depicts the plant community structure for Otter Creek. Figure 57 shows the dominant vegetation community for each section surveyed along Otter Creek.
Figure 56 Vegetation type along Otter Creek
Figure 57 Dominant vegetation type along Otter Creek
Instream Vegetation Abundance
Instream vegetation is an important factor for a healthy stream ecosystem. Vegetation helps to remove contaminants from the water, contributes oxygen to the stream, and provides habitat for fish and wildlife. Too much vegetation can also be detrimental. Figure 58 demonstrates that Otter Creek had common to normal levels of instream vegetation for most of its length.
Figure 58 Instream vegetation abundance along Otter Creek
Invasive Species
Invasive species can have major implications on streams and species diversity. Invasive species are one of the largest threats to ecosystems throughout Ontario and can out compete native species, having negative effects on local wildlife, fish and plant populations. Ninety four percent of the sections surveyed along Otter Creek had invasive species (Fig.59). The invasive species observed in Otter Creek were European frogbit, purple loosestrife, glossy and common buckthorn, Eurasian milfoil, flowering rush, carp, curly leafed pondweed, phragmites, zebra mussels, European/black alder and Manitoba maple. Figure 60 shows the frequency of the invasive species observed along Otter Creek.
Figure 59 Invasive species observed along Otter Creek
Figure 60 Invasive species frequency by type along Otter Creek
Water Chemistry
During the stream characterization survey, a YSI probe is used to collect water chemistry information. Dissolved oxygen, conductivity and pH are measured at the start and end of each section.
Dissolved Oxygen
Dissolved oxygen is a measure of the amount of oxygen dissolved in water. The Canadian Environmental Quality Guidelines of the Canadian Council of Ministers of the Environment (CCME) suggest that for the protection of aquatic life the lowest acceptable dissolved oxygen concentration should be 6 mg/L for warmwater biota and 9.5 mg/L for coldwater biota (CCME, 1999). Figure 61 shows that the dissolved oxygen in the Otter Creek was well below the threshold for warmwater biota in several reaches of the system. The average dissolved oxygen levels observed within the main stem of Otter Creek was 5.90mg/L which is below the 6mg/L minimum that is recommended for warmwater biota.
Figure 61 Dissolved oxygen ranges in Otter Creek
Conductivity
Conductivity in streams is primarily influenced by the geology of the surrounding environment, but can vary drastically as a function of surface water runoff. Currently there are no CCME guideline standards for stream conductivity, however readings which are outside the normal range observed within the system are often an indication of unmitigated discharge and/or stormwater input. The average conductivity observed within the main stem of Otter Creek was 294 µs/cm. Figure 62 shows that the conductivity readings for Otter Creek.
Figure 62 Conductivity ranges in Otter Creek
pH
Based on the PWQO for pH, a range of 6.5 to 8.5 should be maintained for the protection of aquatic life. Average pH values for Otter Creek averaged 7.6 thereby meeting the provincial standard (Fig.63).
Figure 63 pH ranges in Otter Creek
Thermal Regime
Many factors can influence fluctuations in stream temperature, including springs, tributaries, precipitation runoff, discharge pipes and stream shading from riparian vegetation. Water temperature is used along with the maximum air temperature (using the Stoneman and Jones method) to classify a watercourse as either warm water, cool water or cold water. Figure 64 shows the location of temperatures loggers at two sampling locations along Otter Creek.
Figure 64 Temperature loggers in Otter Creek
Analysis of the data collected indicates that Otter Creek is classified as a warm water system with cool to warm water reaches (Fig.65). Each point on the graph represents a temperature that meets the following criteria:
- Sampling dates between July 1st and September 7th
- Sampling date is preceded by two consecutive days above 24.5 °C, with no rain
- Water temperatures are collected at 4pm
- Air temperature is recorded as the max temperature for that day
Figure 65 Temperature logger data for two sites on Otter Creek
Groundwater
Groundwater discharge areas can influence stream temperature, contribute nutrients, and provide important stream habitat for fish and other biota. During stream surveys, indicators of groundwater discharge are noted when observed. Indicators include: springs/seeps, watercress, iron staining, significant temperature change and rainbow mineral film. Figure 66 shows areas where one or more of the above groundwater indicators were observed during stream surveys and headwater assessments.
Figure 66 Groundwater indicator observations in the Otter Creek catchment
Headwaters Drainage Features Assessment
The RVCA Stream Characterization program assessed Headwater Drainage Features for the Middle Rideau subwatershed in 2014. This protocol measures zero, first and second order headwater drainage features (HDF). It is a rapid assessment method characterizing the amount of water, sediment transport, and storage capacity within headwater drainage features (HDF). RVCA is working with other Conservation Authorities and the Ministry of Natural Resources and Forestry to implement the protocol with the goal of providing standard datasets to support science development and monitoring of headwater drainage features. An HDF is a depression in the land that conveys surface flow. Additionally, this module provides a means of characterizing the connectivity, form and unique features associated with each HDF (OSAP Protocol, 2013). In 2014, the program sampled 17 sites in the Otter Creek catchment area. Figure 67 shows the headwater drainage feature sampling location in the catchment.

Figure 67 Locations of the headwater sampling sites in the Otter Creek catchment
Spring photo of a headwater drainage feature along Bass Road in the Otter Creek catchment
Summer photo of a headwater drainage feature along Bass Road in the Otter Creek catchment
Headwater Feature Type
The headwater sampling protocol assesses the feature type in order to understand the function of each feature. The evaluation includes the following classifications: defined natural channel, channelized or constrained, multi-thread, no defined feature, tiled, wetland, swale, roadside ditch and pond outlet. By assessing the values associated with the headwater drainage features in the catchment area we can understand the ecosystem services that they provide to the watershed in the form of hydrology, sediment transport, and aquatic and terrestrial functions. The Otter Creek catchment is dominated by natural channel and wetland headwater drainage features. Figure 68 shows the feature type of the primary feature at the sampling locations.
Figure 68 Headwater feature type in Otter Creek
Headwater Feature Flow
The observed flow condition within headwater drainage features can be highly variable depending on timing relative to the spring freshet, recent rainfall, soil moisture, etc. Flow conditions are assessed in the spring and in the summer to determine if features are perennial and flow year round, if they are intermittent and dry up during the summer months or if they are ephemeral systems that do not flow regularly and generally respond to specific rainstorm events or snowmelt. Flow conditions in headwater systems can change from year to year depending on location precipitation patterns. Figure 69 shows the observed flow conditions at the sampling locations in the Otter Creek catchment.
Figure 69 headwater flow type in Otter Creek
Headwater Feature Channel Modifications
Channel modifications were assessed at each headwater drainage feature sampling location. Modifications include channelization, dredging, hardening and realignments. The sampling locations for the Otter Creek catchment area were classified as having no channel modifications. Figure 70 shows the channel modifications observed at the sampling locations for Otter Creek.
Figure 70 headwater feature channel modifications in Otter Creek
Headwater Feature Vegetation
Headwater feature vegetation evaluates the type of vegetation that is found within the drainage feature. The type of vegetated within the channel influences the aquatic and terrestrial ecosystem values that the feature provides. For some types of headwater features the vegetation within the feature plays a very important role in flow and sediment movement and provides wildlife habitat. The following classifications are evaluated no vegetation, lawn, wetland, meadow, scrubland and forest. Figure 71 depicts the dominant vegetation observed at the sampled headwater sites in the Otter Creek catchment.
Figure 71 headwater feature vegetation types in Otter Creek
Headwater Feature Riparian Vegetation
Headwater riparian vegetation evaluates the type of vegetation that is found along the headwater drainage feature. The type of vegetation within the riparian corridor influences the aquatic and terrestrial ecosystem values that the feature provides to the watershed. The majority of the sample locations in Otter Creek were dominated by natural vegetation in the form of scrubland, forest and wetland vegetation. Figure 72 depicts the type of riparian vegetation observed at the sampled headwater sites in the Otter Creek catchment.
Figure 72 headwater feature riparian vegetation in Otter Creek
Headwater Feature Sediment Deposition
Assessing the amount of recent sediment deposited in a channel provides an index of the degree to which the feature could be transporting sediment to downstream reaches (OSAP, 2013). Evidence of excessive sediment deposition might indicate the requirement to follow up with more detailed targeted assessments upstream of the site location to identify potential best management practices to be implemented. Conditions ranged from no deposition observed to a site with substantial deposition recorded. Overall most sites had minimal to moderate levels of sediment deposition. Figure 73 depicts the degree of sediment deposition observed at the sampled headwater sites in the Otter Creek catchment.
Figure 73 Headwater feature sediment deposition in Otter Creek
Headwater Feature Upstream Roughness
Feature roughness will provide a measure of the amount of materials within the bankfull channel that could slow down the velocity of water flowing within the headwater feature (OSAP, 2013). Materials on the channel bottom that provide roughness include vegetation, woody debris and boulders/cobble substrates. Roughness can provide benefits in mitigating downstream erosion on the headwater drainage feature and the receiving watercourse by reducing velocities. Roughness also provides important habitat conditions to aquatic organisms. The majority of the sample locations in the Otter Creek catchment area had extreme to high levels of feature roughness. Figure 74 shows the feature roughness conditions at the sampling locations in the Otter Creek catchment.
Figure 74 Headwater feature upstream roughness in Otter Creek
Fish Community
The Otter Creek catchment is classified as a mixed community of warm and cool water recreational and baitfish fishery with 25 species observed. Table 15 lists the species observed in the catchment (Source: MNR/RVCA). Figure 75 shows the sampling locations along Rideau Creek.
Figure 75 Fish species observed in the Otter Creek catchment
Table 15 Fish species observed in Otter Creek and Otter Lake
Northern Pike captured and released along Otter Creek
Fyke net set along Otter Creek
Migratory Obstructions
It is important to know locations of migratory obstructions because these can prevent fish from accessing important spawning and rearing habitat. Migratory obstructions can be natural or manmade, and they can be permanent or seasonal. Figure 76 shows that on Otter Creek, the migratory obstructions included seven beaver dams, one debris jam and two perched culverts at the time of the survey in 2014.
Figure 76 Migratory obstructions observed in the Otter Creek catchment
Riparian Restoration
Figure 77 depicts the locations where various riparian restoration activities can be implemented as a result of observations made during the stream survey and headwater drainage feature assessments. Several riparian planting opportunities were identified on surveyed headwater drainage features.
Figure 77 Riparian restoration opportunities identified for the Otter Creek catchment
4. Land Cover
Land cover and any change in coverage that has occurred over a six year period is summarized for the Otter Lake and Creek catchment using spatially continuous vector data representing the catchment during the spring of 2008 and 2014. This dataset was developed by the RVCA through heads-up digitization of 20cm DRAPE ortho-imagery at a 1:4000 scale and details the surrounding landscape using 10 land cover classes.
As shown in Table 16, the dominant land cover types in 2008 and 2014 were woodland and crop and pastureland, followed by wetland.
Table 16 Land cover (2008 vs. 2014) in the Otter Lake and Creek catchment
* Does not include treed swamps ** Includes treed swamps
From 2008 to 2014, there was an overall change of 138 hectares (from one land cover class to another), the majority of which can be attributed to the conversion of “crop and pasture” and “woodland” to “settlement” (likely associated with new solar farms) along with “woodland” to “wetland” encroachment in southern areas of the catchment (see Figure 78 for the location of the major changes).
Figure 78 Dominant land cover change in the catchment (2008 to 2014)
Table 17 shows the type of land cover change that has taken place between land cover classes/types from 2008 to 2016. Overall, the net area of woodland change (loss) is relatively small at 73 hectares relative to the remaining area of woodland in the catchment (as of 2014). Similarlyl the net area of crop and pastureland change (loss) is small at 53 hectares relative to the remaining area of crop and pastureland in the catchment (as of 2014).
Table 17 Land cover change in the Otter Lake and Creek catchment (2008-2014)
Woodland Cover
In the Environment Canada Guideline (Third Edition) entitled “How Much Habitat Is Enough?” (here after referred to as the “Guideline”) the opening narrative under the Forest Habitat Guidelines section states that prior to European settlement, forest was the predominant habitat in the Mixedwood Plains ecozone. The remnants of this once vast forest now exist in a fragmented state in many areas (including the Rideau Valley watershed) with woodland patches of various sizes distributed across the settled landscape along with higher levels of forest cover associated with features such as the Frontenac Axis (within the on-Shield areas of the Rideau Lakes and Tay River subwatersheds). The forest legacy, in terms of the many types of wildlife species found, overall species richness, ecological functions provided and ecosystem complexity is still evident in the patches and regional forest matrices (found in the Middle Rideau subwatershed and elsewhere in the Rideau Valley watershed). These ecological features are in addition to other influences which forests have on water quality and stream hydrology including reducing soil erosion, producing oxygen, storing carbon along with many other ecological services that are essential not only for wildlife but for human well-being.
The Guideline also notes that forests provide a great many habitat niches that are in turn occupied by a great diversity of plant and animal species. They provide food, water and shelter for these species - whether they are breeding and resident locally or using forest cover to help them move across the landscape. This diversity of species includes many that are considered to be species at risk. Furthermore, from a wildlife perspective, there is increasing evidence that the total forest cover in a given area is a major predictor of the persistence and size of bird populations, and it is possible or perhaps likely that this pattern extends to other flora and fauna groups. The overall effect of a decrease in forest cover on birds in fragmented landscapes is that certain species disappear and many of the remaining ones become rare, or fail to reproduce, while species adapted to more open and successional habitats, as well as those that are more tolerant to human-induced disturbances in general, are able to persist and in some cases thrive. Species with specialized-habitat requirements are most likely to be adversely affected. The overall pattern of distribution of forest cover, the shape, area and juxtaposition of remaining forest patches and the quality of forest cover also play major roles in determining how valuable forests will be to wildlife and people alike.
The current science generally supports minimum forest habitat requirements between 30 and 50 percent with some limited evidence that the upper limit may be even higher, depending on the organism/species phenomenon under investigation or land-use/resource management planning regime being considered/used.
As shown in Figure 79, 35 percent of the Otter Lake and Creek catchment contains 2682 hectares of upland forest and 443 hectares of lowland forest (treed swamps) versus the 34 percent of woodland cover in the Middle Rideau subwatershed. This is greater than the 30 percent of forest cover that is identified as the minimum threshold required to sustain forest birds according to the Guideline and which may only support less than one half of potential species richness and marginally healthy aquatic systems. When forest cover drops below 30 percent, forest birds tend to disappear as breeders across the landscape.
Figure 79 Woodland cover and interior interior (2014)
Woodland (Patch) Size
According to the Ministry of Natural Resources’ Natural Heritage Reference Manual (Second Edition), larger woodlands are more likely to contain a greater diversity of plant and animal species and communities than smaller woodlands and have a greater relative importance for mobile animal species such as forest birds.
Bigger forests often provide a different type of habitat. Many forest birds breed far more successfully in larger forests than they do in smaller woodlots and some rely heavily on forest interior conditions. Populations are often healthier in regions with more forest cover and where forest fragments are grouped closely together or connected by corridors of natural habitat. Small forests support small numbers of wildlife. Some species are “area-sensitive” and tend not to inhabit small woodlands, regardless of forest interior conditions. Fragmented habitat also isolates local populations, especially small mammals, amphibians and reptiles with limited mobility. This reduces the healthy mixing of genetic traits that helps populations survive over the long run (Conserving the Forest Interior. Ontario Extension Notes, 2000).
The Environment Canada Guideline also notes that for forest plants that do not disperse broadly or quickly, preservation of some relatively undisturbed large forest patches is needed to sustain them because of their restricted dispersal abilities and specialized habitat requirements and to ensure continued seed or propagation sources for restored or regenerating areas nearby.
The Natural Heritage Reference Manual continues by stating that a larger size also allows woodlands to support more resilient nutrient cycles and food webs and to be big enough to permit different and important successional stages to co-exist. Small, isolated woodlands are more susceptible to the effects of blowdown, drought, disease, insect infestations, and invasions by predators and non-indigenous plants. It is also known that the viability of woodland wildlife depends not only on the characteristics of the woodland in which they reside, but also on the characteristics of the surrounding landscape where the woodland is situated. Additionally, the percentage of forest cover in the surrounding landscape, the presence of ecological barriers such as roads, the ability of various species to cross the matrix surrounding the woodland and the proximity of adjacent habitats interact with woodland size in influencing the species assemblage within a woodland.
In the Otter Lake and Creek catchment (in 2014), one hundred and twenty seven (37 percent) of the 346 woodland patches are very small, being less than one hectare in size. Another 199 (57 percent) of the woodland patches ranging from one to less than 20 hectares in size tend to be dominated by edge-tolerant bird species. The remaining 20 (six percent of) woodland patches range between 22 and 492 hectares in size. Fourteen of these patches contain woodland between 20 and 100 hectares and may support a few area-sensitive species and some edge intolerant species, but will be dominated by edge tolerant species.
Conversely, six (two percent) of the 346 woodland patches in the drainage area exceed the 100 plus hectare size needed to support most forest dependent, area sensitive birds and are large enough to support approximately 60 percent of edge-intolerant species. Three of these patches top 200 hectares (at 242, 362 and 492 ha), which according to the Environment Canada Guideline will support 80 percent of edge-intolerant forest bird species (including most area sensitive species) that prefer interior forest habitat conditions.
Table 18 presents a comparison of woodland patch size in 2008 and 2014 along with any changes that have occurred over that time. A decrease (of 64 ha) has been observed in the overall woodland patch area between the two reporting periods with most change occurring in the 20 to 50 hectare woodland patch size class range.
Table 18 Woodland Patches in the Otter Lake and Creek Catchment (2008 and 2014)
*Includes treed swamps
Woodland (Forest) Interior Habitat
The forest interior is habitat deep within woodlands. It is a sheltered, secluded environment away from the influence of forest edges and open habitats. Some people call it the “core” or the “heart” of a woodland. The presence of forest interior is a good sign of woodland health, and is directly related to the woodland’s size and shape. Large woodlands with round or square outlines have the greatest amount of forest interior. Small, narrow woodlands may have no forest interior conditions at all. Forest interior habitat is a remnant natural environment, reminiscent of the extensive, continuous forests of the past. This increasingly rare forest habitat is now a refuge for certain forest-dependent wildlife; they simply must have it to survive and thrive in a fragmented forest landscape (Conserving the Forest Interior. Ontario Extension Notes, 2000).
The Natural Heritage Reference Manual states that woodland interior habitat is usually defined as habitat more than 100 metres from the edge of the woodland and provides for relative seclusion from outside influences along with a moister, more sheltered and productive forest habitat for certain area sensitive species. Woodlands with interior habitat have centres that are more clearly buffered against the edge effects of agricultural activities or more harmful urban activities than those without.
In the Otter Lake and Creek catchment (in 2014), the 346 woodland patches contain 95 forest interior patches (Figure 79) that occupy three percent (295 ha.) of the catchment land area (versus the five percent of interior forest in the Middle Rideau Subwatershed). This is below the ten percent figure referred to in the Environment Canada Guideline that is considered to be the minimum threshold for supporting edge intolerant bird species and other forest dwelling species in the landscape.
Most patches (91) have less than 10 hectares of interior forest, 59 of which have small areas of interior forest habitat less than one hectare in size. The remaining four patches contain interior forest ranging between 10 and 66 hectares in area.
Between 2008 and 2014, there has been a change in the number of woodland patches containing smaller areas of interior habitat (Table xx). For example, there has been an increase of 41 woodlands containing less than one hectare of interior forest over this period and 18 woodlands with one to 10 hectares of interior habitat.
Table 19 Woodland Interior in the Otter Lake and Creek catchment (2008 and 2014)
Wetland Cover
Wetlands are habitats forming the interface between aquatic and terrestrial systems. They are among the most productive and biologically diverse habitats on the planet. By the 1980s, according to the Natural Heritage Reference Manual, 68 percent of the original wetlands south of the Precambrian Shield in Ontario had been lost through encroachment, land clearance, drainage and filling.
Wetlands perform a number of important ecological and hydrological functions and provide an array of social and economic benefits that society values. Maintaining wetland cover in a watershed provides many ecological, economic, hydrological and social benefits that are listed in the Reference Manual and which may include:
- contributing to the stabilization of shorelines and to the reduction of erosion damage through the mitigation of water flow and soil binding by plant roots
- mitigating surface water flow by storing water during periods of peak flow (such as spring snowmelt and heavy rainfall events) and releasing water during periods of low flow (this mitigation of water flow also contributes to a reduction of flood damage)
- contributing to an improved water quality through the trapping of sediments, the removal and/or retention of excess nutrients, the immobilization and/or degradation of contaminants and the removal of bacteria
- providing renewable harvesting of timber, fuel wood, fish, wildlife and wild rice
- contributing to a stable, long-term water supply in areas of groundwater recharge and discharge
- providing a high diversity of habitats that support a wide variety of plants and animals
- acting as “carbon sinks” making a significant contribution to carbon storage
- providing opportunities for recreation, education, research and tourism
Historically, the overall wetland coverage within the Great Lakes basin exceeded 10 percent, but there was significant variability among watersheds and jurisdictions, as stated in the Environment Canada Guideline. In the Rideau Valley Watershed, it has been estimated that pre-settlement wetland cover averaged 35 percent using information provided by Ducks Unlimited Canada (2010) versus the 21 percent of wetland cover existing in 2014 derived from DRAPE imagery analysis.
While there has been a reported three percent decrease in wetland cover in the Otter Lake and Creek catchment from pre-settlement times, the remaining wetland cover in 2014 remains above the ecological thresholds cited in the Environment Canada Guideline. Nonetheless, in order to maintain critical hydrological, ecological functions along with related recreational and economic benefits provided by these wetland habitats in the catchment, a “no net loss” of currently existing wetlands should be employed to ensure the continued provision of tangible benefits accruing from them for landowners and surrounding communities.
Using the same dataset, it is estimated that pre-settlement (historic) wetland cover averaged 32 percent in the Middle Rideau subwatershed versus the 27 percent of cover existing in 2014. This decline in wetland cover is also evident in the Otter Lake and Creek catchment (as seen in Figure 80) where there has been a three percent decrease in the area of wetland cover from pre-settlement times to the present (as summarized in Table 20).
Figure 80 Wetland cover (pre-settlement to 2014)
While there has been a reported decrease in wetland cover in the Otter Lake and Creek catchment from pre-settlement times, the remaining wetland cover in 2014 remains above the ecological thresholds cited in the Environment Canada Guideline. Nonetheless, in order to maintain critical hydrological, ecological functions along with related recreational and economic benefits provided by these wetland habitats in the catchment, a “no net loss” of currently existing wetlands should be employed to ensure the continued provision of tangible benefits accruing from them for landowners and surrounding communities.
Table 20 Wetland cover in the Middle Rideau subwatershed and Otter Lake and Creek catchment (Historic to 2014)
5. Stewardship and Protection
The RVCA and its partners are working to protect and enhance environmental conditions in the Middle Rideau Subwatershed. Figure 81 shows the location of all stewardship projects completed in the Otter Lake and Creek catchment along with sites identified for potential shoreline restoration.
Rural Clean Water Projects
From 2009 to 2014, six septic system replacements and one erosion control project were completed. Between 2003 and 2008, 10 well upgrades, four septic system replacements, one well decommissioning, one erosion control project and one education initiative were carried out along with construction of one fuel storage and handling facility. Prior to 2003, two livestock fencing projects and one septic system replacement were completed. Total value of all 28 projects is $215,494 with $96,685 of that amount funded through grant dollars from the RVCA.
Figure 81 Stewardship and restoration locations
Tree Planting Projects
The location of RVCA Tree Planting Program projects is shown in Figure 81. From 2009 to 2014, 7,082 trees were planted at four sites. Between 2003 and 2008, 1,000 trees were planted at one site and prior to 2003, 12,750 trees were planted at three sites, resulting in the reforestation of 13 hectares. Total value of all eight projects is $62,019 with $22,285 of that amount coming from various fundraising sources.
Through the RVCA Butternut Recovery Program, an additional 110 butternut trees were planted in the Otter Lake and Creek catchment, as part of efforts to introduce healthy seedlings from tolerant butternuts into various locations across Eastern Ontario.
Septic System Re-Inspections
From 2007 to 2015, the Mississippi Rideau Septic System Office performed 66 septic system re-inspections (52 cottages and 14 houses) on Otter Lake in Rideau Lakes Township. Remedial/maintenance work (i.e. pump outs, baffle replacement, work that generally does not require a permit) was recommended for 41 (or 62 percent) of those properties that were inspected, septic system replacements at two properties with more information provided to two other landowners with identified septic system concerns. No specific concerns were noted for the other 21 septic systems that were inspected.
Valley, Stream, Wetland and Hazard Land Regulation
The Otter Lake and Creek catchment covers 89 square kilometres with 37 square kilometres (or 42 percent) of the drainage area being within the regulation limit of Ontario Regulation 174/06 (Fig. 82), giving protection to wetland areas and river or stream valleys that are affected by flooding and erosion hazards.
Wetlands occupy 19.2 sq. km. (or 21 percent) of the catchment. Of these wetlands, 14.5 sq. km (or 76 percent) are designated as provincially significant and included within the RVCA regulation limit. This leaves the remaining 4.7 sq. km (or 24 percent) of wetlands in the catchment outside the regulated area limit.
Of the 137.4 kilometres of stream in the catchment, regulation limit mapping has been plotted along 95.8 kilometers of streams (representing 70 percent of all streams in the catchment). Some of these regulated watercourses (73.1 km or 53 percent of all streams) flow through regulated wetlands; the remaining 22.6 km (or 24 percent) of regulated streams are located outside of those wetlands. Plotting of the regulation limit on the remaining 41.6 km (or 30 percent) of streams requires identification of flood and erosion hazards and valley systems.
Within the regulation limit, “development” and “site alteration” require RVCA permission. The “alteration to waterways” provision of Ontario Regulation 174/06 applies to all watercourses.
Figure 82 RVCA regulation limits
Vulnerable Drinking Water Areas
The Otter Lake and Creek catchment area is considered to have a Highly Vulnerable Aquifer. This means that the nature of the overburden (thin soils, fractured bedrock) does not provide a high level of protection for the underlying groundwater making the aquifer more vulnerable to contaminants released on the surface. The Mississippi-Rideau Source Protection Plan includes policies that focus on the protection of groundwater region-wide due to the fact that most of the region, which encompasses the Mississippi and Rideau watersheds is considered Highly Vulnerable Aquifer.
The catchment area to the south and east of Otter Lake is also considered a Significant Groundwater Recharge Area. This means that there is a volume of water moving from the surface into the ground and groundwater serves either as a municipal drinking water source or supplies a lake or stream ecosystem. The Plan was not required to include policies to specifically address Significant Groundwater Recharge Areas.
For detailed maps and policies that have been developed to protect drinking water sources, please go to the Mississippi-Rideau Source Protection Region website at www.mrsourcewater.ca to view the Mississippi-Rideau Source Protection Plan.
6. Challenges/Issues
Water Quality
Otter Lake
- Otter Lake has a “Fair”’ surface chemistry water quality rating for the 2003 to 2008 and 2009 to 2014 periods and is generally characterized by moderate nutrient concentrations
- Forty-three (of 66) Rideau Lakes Township septic system voluntary re-inspections conducted from 2007 to 2015 revealed the need for additional maintenance/remedial/replacement works to be performed on septic systems around Otter Lake. Those properties with concerns are identified in the yearly report submitted by the Mississippi Rideau Septic System Office to the Township
- RVCA’s 2013 Algae and Aquatic Plant Survey for Eastern Ontario Lakes and Rivers notes that three of five respondents from Otter Lake have noticed an increase in algae blooms on their lake
Otter Creek
- Otter Creek has a "Fair" surface chemistry water quality rating for the 2003 to 2008 and 2009 to 2014 periods. Frequent exceedances of total phosphorous, total Kjeldhal nitrogen and E.coli and occasional exceedances of ammonia, aluminum and iron have contributed to the Creek’s overall rating
- Otter Creek has a “Poor” benthic invertebrate (biological) water quality rating from 2003 to 2014
Development
- Most development in the catchment is occurring on waterfront properties through the transformation of traditional cottage development into larger year-round dwellings. This transition is taking place either through re-development of an existing cottage lot or incremental alterations (additions, sleeping cabins, gazebos, decks, sheds, boat houses, garages, lawns, docks)
- Many waterfront properties contain existing non-complying dwellings with respect to minimum water frontage and lot area and are often located within 30 metres of the water that require minor variances for expansion and/or reconstruction of dwellings where standard development setbacks from water are difficult to achieve. In these cases, of which there are many, staff at Rideau Lakes Township and the Conservation Authority often meet with resistance and push back when attempts are made to implement standards for development setbacks, vegetated shorelines and septic systems
- Monitoring implementation of conditions of planning and regulatory approvals is challenging due to a lack of resources
Shorelines
- Around Otter Lake in 2014, the 30 metre wide shoreline buffer contains (55 percent) non-natural land cover (comprised of waterfront cottages, houses, camps and roads) and 45 percent natural land cover (made up of wetland and woodland), which is below the recommended 75 percent naturally vegetated riparian, shoreline buffer target. Otter Lake has experienced a six percent increase in the area of settlement along its shoreline over a six year period
- Emerald ash borer poses a significant threat to the ecology of the subwatershed, given the prominence of ash trees along shorelines and in riparian and wetland areas. Many tree stands are predominantly ash and with their anticipated loss, it is unclear what will replace them and the overall effect of their collective demise on the physical and natural functions/values they provide for erosion, water quality and fish and wildlife habitat protection
Land Cover
- The catchment contains 469 ha of unevaluated wetland (occupying five percent of its total area) that provides many important social, hydrological, biological and ecological functions/services. Although not under imminent threat from development activity, they do remain vulnerable to drainage and land clearing activities in the absence of any regulatory and planning controls that would otherwise protect them
Water Levels
- Management of water levels on Otter Lake continues to be a source of concern for waterfront property owners; particularly, flooding in the spring and late fall and the lack of adequate drainage at its outlet to Otter Creek
Aquatic Habitat/Fisheries
- Littoral zone mapping identifying substrate type, vegetation and habitat features along with opportunities for shoreline enhancements is unavailable for Otter Lake
Prepared by the Otter Lake Landowners’ Association and its partners, the Otter Lake Sustainable Lake Plan (2015) outlines eight goals, 19 objectives and 79 action items identified by the lake community to maintain and improve the health of the Otter Lake watershed.
The following section includes some of those identified action items taken from that document (as identified by an asterisk), which have implications for the sustainable use and management of the water resources of Otter Lake and RVCA’s monitoring, reporting, planning/regulations and stewardship programs. Refer to the Otter Lake Sustainable Lake Plan for a complete list of all actions listed in that document.
7. Opportunities/Actions
Water Quality
- Continue to monitor E. coli, Nitrogen and Phosphorous levels in Otter Lake in conjunction with the RVCA and seek no net increase in their levels over time. Aim for the OLLA target of: less than 5 CFU/100ml for E.coli; less than 10 micrograms for Phosphorous and between 200 to 500 µg/L for Nitrogen and report surface water quality results back to the Otter Lake community*
- Consider expansion of surface water quality testing to include periodic sampling of the in/outflow creeks of Otter Lake*
- Review RVCA Watershed Watch monitoring of surface water quality on Otter Lake
- Continue to promote the voluntary septic system re-inspection program that the Township of Rideau Lakes introduced in 2007*
- Work with the Township of Rideau Lakes to establish a mandatory sewage system inspection program on Otter Lake with an associated educational program and seek funding to provide financial assistance to landowners for repair or upgrades to their systems*
- Continue to offer septic repair/replacement project funding provided by the Rideau Valley Rural Clean Water Program to landowners
- Educate the Otter Lake community about septic system care by providing information about sewage system maintenance (i.e., when to pump out septic systems and holding talks)
- Continue efforts to reduce pollutant loadings to Otter Lake through education about the application of shoreline, stormwater and agricultural best management practices; also consider using low impact development (LID) methods to improve the quality and reduce the amount of stormwater runoff reaching the lake ecosystem. This may be particularly beneficial in areas with extensive impervious surfaces (i.e., asphalt, concrete, buildings, and severely compacted soils) or on sensitive waterfront properties (with steep slopes/banks, shallow/impermeable soils)
- Continue efforts to identify pollution sources along Otter Creek that may be contributing to the poor benthic invertebrate rating and reduce the frequently high nutrient concentrations and bacterial counts and occasional metal exceedances through ongoing monitoring and implementation of best management practices such as diverting runoff, enhancing shoreline buffers, limiting the use of fertilizers and pesticide applications and restricting livestock access
- Continue to promote the protection of the water resources of Otter Lake and Creek and its tributaries through implementation of municipal and agency land use planning and development policies and practices
Development
- Collectively work with approval authorities (Township of Rideau Lakes, Conservation Authority, the Health Unit and Mississippi-Rideau Septic System Office) and the Otter Lake Landowners’ Association to consistently implement current land use planning and development policies for water quality and shoreline protection adjacent to Otter Lake and Creek and other catchment streams (e.g., a minimum 30 metre development setback from water)
- Explore ways and means to more effectively enforce and implement conditions of land-use planning and development approval to achieve net environmental gains (particularly with respect to rehabilitating or protecting naturally vegetated shorelines and water quality)
- Encourage Committees of Adjustment to take advantage of technical and environmental information and recommendations forthcoming from planning and environmental professionals
- Municipalities and agencies are encouraged to strengthen natural heritage and water resources official plan policies and zoning provisions (water setbacks, frontage and naturalized shorelines and wetland protection) where deemed appropriate
- Municipal and agency planners together with development proponents are to use the 2014 Site Evaluation Guidelines to inform decision-making about the application of development setbacks on lots with shallow soils/bedrock, steep slopes and sparse vegetation cover along with the use of the appropriate, development related, best management practices
- Utilize RVCA subwatershed and catchment reports to help develop/revise official plan policies to protect surface water resources and the natural environment (including woodlands, wetlands and shoreline cover)
- Consider establishing RVCA regulations limits to protect additional wetlands
Shorelines
- Provide property owners with an assessment of the condition of their shoreline and recommendations for improvement using the results of the 2015 Otter Lake Shoreline Assessment*
- Partner with the RVCA to promote its Shoreline Naturalization Program to re-naturalize altered shoreline*
- RVCA and its partners (Rideau Lakes Township and the Otter Lake Landowners’ Association) are to continue educating landowners about the value and importance of headwater drainage features, natural shorelines and waterfront property best management practices with respect to shoreline use and development, septic system installation and maintenance and shoreline vegetation retention and enhancement
- Protect the riparian buffer along the shoreline of Otter Lake and Otter Creek and other catchment streams (headwaters) during the development approvals process through adherence to and enforcement of municipal land-use policies and zoning standards
- Target shoreline restoration at sites identified in this report (shown as “Other riparian land cover” in Figure 38 and “Potential Riparian/Shoreline Restoration” in Figure 77) and explore other restoration and enhancement opportunities along Otter Creek and its tribuatries
Water Levels
- Establish a standard water level monitoring location on Otter Lake along with a “benchmark” water level and the authority responsible for measurements and continue with water level monitoring and reporting to the community*
- Continue to leave to the forces of nature the natural flow of water into and out of Otter Lake, except in the case of expected high spring water levels, in which case the help of the RVCA and the Otter Creek Beaver Management Group may be needed to lower the beaver dams to increase the outflow of water through Otter Creek*
- Communicate to the lake community any water level actions taken by the Beaver Management Group*
- Continue to monitor if there is a need for greater water out flow capacity from Otter Lake than is currently provided by the existing culvert under the Otter Lake Road*
Aquatic Plants
- Establish a volunteer-based aquatic invasive species (AIS) monitoring program and participate in the AIS Monitoring System to assist with early detection and management
- Provide information about aquatic invasive species and the pathways for introduction along with AIS signage at the boat launch area off Highway 15*
Aquatic Habitat/Fisheries/wildlife
- Request the Ministry of Natural Resources and Forestry to conduct a fish population assessment for Otter Lake*
- Evaluate the littoral zone of Otter Lake identifying opportunities for shoreline enhancements to help protect and enhance the resident fish population and its aquatic habitat
- Educate Otter Lake shoreline owners and visitors about fish habitat requirements, spawning schedules and near-shore and in-water activities that can disturb or destroy fish habitat and spawning sites, as well as the importance of re/naturalized shorelines*
- Educate Otter Lake shoreline residents about best management practices to deal with species such as Canada Geese (e.g. replace grassy areas with native ground cover and shrubs)*
Lake Planning
- Implement on a priority basis the identified actions listed in the Otter Lake Sustainable Lake Plan
Full Catchment Report
Middle Rideau Subwatershed Report 2015
RIDEAU CREEK CATCHMENT
The RVCA produces individual reports for ten catchments in the Middle Rideau subwatershed. Using data collected and analysed by the RVCA through its watershed monitoring and land cover classification programs, surface water quality conditions are reported for Rideau Creek along with a summary of environmental conditions for the surrounding countryside every six years.
This information is used to better understand the effects of human activity on our water resources, allows us to better track environmental change over time and helps focus watershed management actions where they are needed the most to help sustain the ecosystem services (cultural, aesthetic and recreational values; provisioning of food, fuel and clean water; regulation of erosion/natural hazard protection and water purification; supporting nutrient/water cycling and habitat provision) provided by the catchment’s lands and forests and waters (Millennium Ecosystem Assessment 2005).
The following pages of this report are a compilation of that work and contain information on surface water quality, riparian conditions, land cover, stewardship activity and hazard land and water resources protection.
1. Catchment Facts
General Geography
- The Rideau River flows through the heart of the Middle Rideau and is a focal point for residents and visitors to the area. It extends from the outlet of Lower Rideau Lake at Poonamalie (where there is one dam and one lock) to Burritts Rapids (where there is also a dam and lock), at which point it enters the Lower Rideau on its way to Rideau Falls. The Rideau River is also an integral part of the Rideau Canal National Historic Site of Canada and is a significant tourist attraction which draws boaters, cottagers, and campers to the area
- Smiths Falls, Merrickville and Burritts Rapids are the main urban settlements in the Middle Rideau subwatershed. The Rosedale Creek catchment is predominantly rural in character with agriculture being the main land use
- Parks Canada staff manage water levels for recreational purposes along the Rideau Canal/Waterway that flows by the catchment, ensuring 1.5 metres of draft during the navigation season. In this managed system, water levels on the Rideau Canal are manipulated by operation of numerous dams. In the Middle Rideau subwatershed, Parks Canada staff operate 9 dam and lock complexes with 13 locks for a fall of 36.2 metres over 35.6 kilometres. Water levels are maintained as close as possible to set objectives through the May to October navigation season. The levels are lowered through the rest of October and into November and held at the winter levels until the spring freshet in late March or early April naturally increases inflows to the system. To reduce the impact of the higher flows in the spring, the amount of snow water equivalent, forecast rain, ice cover, flows and levels are assessed and the dams in the Middle Rideau reach are operated accordingly to quickly pass as much water as possible. In late April and early May, the dams are gradually closed and water levels are brought up to be ready, once again, for the navigation season
Physical Geography
- All of Rideau Creek Catchment and the rest of the Middle Rideau Subwatershed primarily resides within the Smith Falls Limestone Plain. The northern half of this catchment is underlain by older Paleozoic quartz sandstone and dolostone of the March Formation; while the southern half is underlain by Oxford Formation dolostone. The bedrock in the catchment is overlain by a thin veneer of glacial sediment, referred to as ‘drift’ that is generally less than a metre in thickness; although there are organic deposits underlying the large headwater wetland and clay lining the corridor of the main creek
- One hundred percent of the catchment lies within the Township of Montague
- Rideau Creek catchment drainage area is 68 square kilometres and occupies about eight percent of the Middle Rideau subwatershed and two percent of the Rideau Valley watershed
Vulnerable Areas
- Lower reach of Rideau Creek is subject to a flooding hazard during the regional storm flood (the 100 year flood). Surveys and studies undertaken in accordance with provincial standards have determined that the 100 year flood elevation in this area ranges from 91.4 metres above mean sea level at the upper, mapped extent of the regulation limit above Heritage Drive to 89.3 metres above mean sea level at its outlet to the Rideau River
- The Assessment Report developed under the Ontario Clean Water Act identifies the upper bedrock aquifer underlying all of the catchment area as a Highly Vulnerable Aquifer, although, where sediments are thicker in a local area, the vulnerability would be less. The southern half of the catchment lies within part of the Wellhead Protection Area for the Merrickville municipal wells; related provincial policies may apply
Development/Trends
- The Township of Montague consists of scattered residential and agricultural development, mostly along traditional transportation routes and in areas of good agricultural capability. Commercial and industrial development is very limited outside the settled areas and there are no major employers within the Township
- Recent years have seen an increase in residential lot creation throughout the catchment, after a lengthy period of stagnant population. Montague's relative proximity to Ottawa and ease of access, as well as relatively affordable land are thought to have contributed to this. Interestingly, most recent severances have been in the more rural forested settings, as opposed to along major transportation corridors or established built communities. As such, site specific environmental impact studies and development conditions have often accompanied approvals. Lot sizes have often also been larger than the 'standard minimum' of an acre. Montague's population had one of the highest rates of increase among Lanark County municipalities between 2006 and 2011
Conditions at a Glance
Water Quality
- Surface chemistry water quality rating in Rideau Creek is “Fair” over two reporting periods (2003-2008 and 2009-2014). Elevated bacterial counts and nutrient concentrations from inflows of nutrients (from private septic systems, agricultural and residential surface water runoff) are an occasional feature of Rideau Creek and decreased nutrient and bacterial counts are needed to improve the overall health of the creek
- Instream biological water quality conditions at the Rideau Creek sample location range from “Poor” to “Good” from 2003 to 2014 (using a grading scheme developed by Ontario Conservation Authorities in Ontario for benthic invertebrates) with an overall benthic invertebrate water quality rating of “Poor” to “Good” determined for this period
Instream and Riparian
- Overall instream and riparian condition for the Rideau creek catchment as assessed by the stream characterization and headwater drainage feature assessment programs show that Rideau Creek and its tributaries are in generally good condition. The majority of the system has a healthy riparian corridor with some sections having elevated erosion levels. Instream diversity of aquatic habitat is somewhat variable with low levels of riffle habitat and high levels of pool habitat. An opportunity was identified along Rideau Creek to enhance riparian habitat conditions. Three perched culverts were identified as migratory obstructions for fish passage
- The Rideau Creek catchment has 21 species of recreational and bait fish and is classified as having a cold/cool/warm water thermal guild that supports the Rideau Creek/Rideau River fishery
- In the Rideau Creek catchment, the riparian buffer (30 m. wide strip along the shoreline of all lakes and streams) is comprised of wetland (74 percent), woodland (15 percent), crop and pastureland (eight percent), roads (two percent) and settlement areas (one percent)
Land Cover
- Dominant land cover is woodland (37 percent) and wetland (33 percent) followed by crop and pastureland (25 percent), settlement areas (three percent) and roads (two percent). From 2008 to 2014, there was an overall change of 42 hectares (from one land cover class to another) and is largely associated with crop and pastureland emerging as young woodland along with wetland encroaching into woodland. Another source of notable change is associated with the conversion of crop and pastureland to settlement
- Woodland cover in the catchment has decreased by six hectares between 2008 and 2014 and interior forest habitat has decreased by 17 hectares
- Wetland cover has decreased by one percent (76 ha) from pre-settlement times to the present and now occupies 33 percent of the catchment area
Other
- There are approximately 170 to 180 in-use water wells with provincial records in this catchment. While most water wells are used for domestic water supply, in this catchment, several are used for commercial, industrial, agricultural or public water supplies
- An Environmental Compliance Approval (ECA) has been issued for a renewable energy system in the vicinity of Gilroy Road and Donnelly Drive along the far eastern boundary of the catchment
- Several PTTW have been issued in this catchment for an institutional water supply and dewatering at an aggregate operation
- Part of a bedrock quarry license is located in this catchment and there are also three sand and gravel pit license in the catchment
- An old landfill is located along the main river at the outlet of this catchment
- Groundwater information from a discontinued historic Provincial Groundwater Monitoring Network PGMN well is available from the MOECC
Catchment Care
- Twenty-one stewardship projects have been completed with assistance from the RVCA’s Rural Clean Water, Tree Planting and Shoreline Naturalization Programs (see Section 5 of this report for details)
- Rideau Creek surface water quality has been monitored by the RVCA through its Baseline Monitoring Program since 2003. The surface water quality at site RCK-01 is monitored once a month from April to November
- RVCA has been collecting benthic invertebrates in Rideau Creek at the Richardson Road site since 2003
- RVCA conducted a fish survey along Rideau Creek in 2014
- RVCA completed a the stream characterization survey on Rideau Creek in 2014, working upstream to the headwaters from the mouth of the creek where it empties into the Rideau River taking measurements and recording observations on instream habitat, bank stability, other attributes and preparing a temperature profile
- RVCA completed 16 headwater drainage feature assessments at road crossings in the Rideau Creek catchment in 2014. This protocol measures zero and first order headwater drainage features and is a rapid assessment method characterizing the amount of water, sediment transport, and storage capacity within headwater drainage features
- A watershed model developed by the RVCA in 2009 was used to study the hydrologic function of wetlands in the Rideau Valley Watershed, including those found in the Rideau Creek catchment
- The Township of Montague has land use planning policies and zoning provisions - on water setbacks, frontage and naturalized shorelines and wetland protection - and in some instances use site plan control to implement these policies and provisions. Together with RVCA, the Township works with landowners on a case by case basis to enable new development while ensuring the scale is suitable on the lot, impacts on neighbours are minimized and development maximizes the watercourse setback
- Development in and adjacent to the Provincially Significant Wetlands in the catchment (Pinery Road, Porter Swamp, South Montague Swamp) are subject to Ontario Regulation 174-06 (entitled “Development, Interference with Wetlands and Alterations to Shorelines and Watercourses”) that protects the hydrologic function of the wetland and also protects landowners and their property from natural hazards (flooding, fluctuating water table, unstable soils) associated with them
2. Surface Water Quality Conditions
Surface water quality conditions in the Rideau Creek catchment are monitored by the Rideau Valley Conservation Authority’s (RVCA) Baseline Water Quality Monitoring Program. The Baseline Water Quality Program focuses on streams; data is collected for 22 parameters including nutrients (total phosphorus, total Kjeldahl nitrogen and ammonia), E. coli, metals (like aluminum and copper) and additional chemical/physical parameters (such as alkalinity, chlorides, pH and total suspended solids). Figure 1 shows the location of the monitoring site in the catchment.
Figure 1 Water quality monitoring site on Rideau Creek
Rideau Creek Water Quality
Water Quality Rating
The water quality rating for Rideau Creek (RCK-01) is “Fair” (Table 1) as determined by the Canadian Council of Ministers of the Environment (CCME) Water Quality Index and is largely influenced by high nutrient concentrations, metals and high bacterial counts. A "Fair" rating indicates that water quality is usually protected but is occasionally threatened or impaired; conditions sometimes depart from natural or desirable levels. Each parameter is evaluated against established guidelines to determine water quality conditions. Those parameters that frequently exceed guidelines are presented below. Analysis of the data has been broken into two periods; 2003 to 2008 and 2009 to 2014 to examine if conditions have changed between these periods. Table 1 shows the overall rating for the monitored surface water quality sites within the Black Creek catchment and Table 2 outlines the Water Quality Index (WQI) scores and their corresponding ratings.
Table 1 Water Quality Index ratings for the Otter Creek Catchment
Table 2 Water Quality Index ratings and corresponding index scores (RVCA terminology, original WQI category names in brackets
Nutrients
Total phosphorus (TP) is used as a primary indicator of excessive nutrient loading and may contribute to abundant aquatic vegetation growth and depleted dissolved oxygen levels. The Provincial Water Quality Objective (PWQO) is used as the TP Guideline and states that in streams concentrations greater than 0.030 mg/l indicate an excessive amount of TP.
Total Kjeldahl nitrogen (TKN) and ammonia (NH3) are used as secondary indicators of nutrient loadings. RVCA uses a guideline of 0.500 mg/l to assess TKN[1] and the PWQO of 0.020 mg/l to assess NH3 concentrations in Barbers Creek.
Tables 3, 4 and 5 summarize average nutrient concentrations at monitored sites within the Black Creek catchment and show the proportion of results that meet the guidelines.
Table 3 Summary of total phosphorus results for Rideau Creek, 2003-2008 and 2009-2014
Table 4 Summary of total Kjeldahl nitrogen results for Rideau Creek from 2003-2008 and 2009-2014. Highlighted values indicate average concentrations exceed the guideline
Table 5 Summary of ammonia results for Rideau Creek from 2003-2008 and 2009-2014
The majority of samples at site RCK-01 were below the TP guideline for both time periods (Figures 2 and 3), 88 percent of samples were below the guideline in the 2003–2008 period, and this increased to 92 percent of samples in the 2009–2014 period. Average TP concentration decreased from 0.024 mg/l (2003–2008) to 0.021 mg/l (2009–2014) (Table 3).
Figure 2 Total phosphorous concentrations in Rideau Creek, 2003-2008

Figure 3 Total phosphorous concentrations in Rideau Creek, 2009-2014
The bulk of TKN results exceeded the guideline (Figures 4 and 5); there were few samples (29 percent) below the guideline in the 2003-2008 period and this declined to having 16 percent of samples below the guideline in the 2009-2014 period. Both monitoring periods average concentrations were above the guideline and increased from 0.622 mg/l to 0.604 mg/l (Table 4).
Figure 4 Total Kjeldahl nitrogen concentrations in Rideau Creek, 2003-2008
Figure 5 Total Kjeldahl nitrogen concentrations in Rideau Creek, 2009-2014
A majority of NH3 results were below the guideline in both monitoring periods. The percentage of results below the guideline in 2003-2008 was 73 percent, this increased to 83 percent in the 2009-2014 period (Figure 4 and 5). The average concentration marginally increased from 0.008 mg/l to 0.011 mg/l (Table 5).
Figure 6 Ammonia concentrations in Rideau Creek, 2003-2008
Figure 7 Ammonia concentrations in Rideau Creek, 2009-2014
Summary
Nutrient enrichment is an occasional occurrence on Rideau Creek. Both TP and NH3 have few exceedances over both reporting periods. The TKN results however did exceed the guideline a majority of the time. The frequent elevated TKN concentrations may be influenced by organic matter held by wetland areas found upstream in the Middle Rideau Subwatershed, resulting in naturally high concentrations of organic nitrogen. High nutrient concentrations can help stimulate the growth of algae blooms and other aquatic vegetation in a waterbody and deplete oxygen levels as the vegetation dies off.
E. Coli
E. coli is used as an indicator of bacterial pollution from human or animal waste; in elevated concentrations it can pose a risk to human health. The PWQO of 100 colony forming units/100 millilitres (CFU/100 ml) is used. E. coli counts greater than this guideline indicate that bacterial contamination may be a problem within a waterbody.
Table 6 summarizes the geometric mean[2] for the monitored site on Rideau Creek and shows the proportion of samples that meet the E. coli guideline of 100 CFU/100 ml. The results of the geometric mean with respect to the guideline for the two periods, 2003-2008 and 2009- 2014, are shown in Figures 8 and 9 respectively.
Table 6 Summary of E. coli results for Rideau Creek, 2003-2008 and 2009-2014
E.coli results at site RCK-01 indicate that bacterial counts are occasionally above the E.coli Guideline. The proportion of samples below the guideline slightly increased from 63 (Figure 8) percent to 65 percent (Figure 9). E.coli counts were below the guideline for both monitoring periods, however the geometric mean slightly increased from 52 CFU/100ml to 54 CFU/100ml (Table 6).
Figure 8 E.coli concentrations in Rideau Creek, 2003-2008
Figure 9 E.coli concentrations in Rideau Creek, 2009-2014
Summary
This data shows that E.coli results occasionally exceed the guidelines at site RCK-01 in Rideau Creek. The geometric mean is below the PWQO for both monitoring periods. There has been a slight increase in E.coli counts between 2003-2008 and 2009-2014. Properly maintaining septic systems, enhancing shoreline buffers and restricting cattle access can help to improve and maintain E.coli counts in Rideau Creek.
Metals
Of the metals routinely monitored in Rideau Creek, aluminum (Al) and iron (Fe) occasionally reported concentrations above their respective PWQOs. In elevated concentrations, these metals can have toxic effects on sensitive aquatic species. Tables 7 and 8 summarize metal concentrations at the monitored site and show the proportion of samples that meet guidelines. Figures 10 to 13 show metal concentrations with respect to the guidelines for the two periods of interest, 2003–2008 and 2009–2014. For Al the PWQO is 0.075 mg/l and for Fe it is 0.300 mg/l.
Table 7 Summary of Aluminum concentrations in Rideau Creek, 2003-2008 and 2009-2014. Highlighted values indicate average concentrations that exceed the guideline
Table 8 Summary of Iron Concentrations in Black Creek, 2003-2008 and 2009-2014
Aluminum concentrations at site RCK-01 has occasionally exceedance the PWQO with 37 percent of samples below the guideline in the 2003-2008 period (Figure 10) to 72 percent of samples below the guideline in the 2009-2014 period (Figure 11). The average concentration of Al was above the guideline in the first reporting period with an average of 0.097 mg/l, this decreased to below the guideline with a concentration of 0.049 mg/l in the second reporting period (Table 7).
Figure 10 Average aluminum concentrations in Rideau Creek, 2003-2008
Figure 11 Average aluminum concentrations in Rideau Creek, 2009-2014
Results from RCK-02 shows that Fe concentrations had some exceedances with 70 percent of samples below the guideline in the 2003-2008 period (Figure 12). This improved to 96 percent of samples in the 2009-2014 period (Figure 13). The average concentration of Fe was 0.240 mg/l from 2003-2008 and 0.092 mg/l from 2009-2014 (Table 8). Both average concentrations were below the guideline.
Figure 12 Average iron concentration in Rideau Creek, 2003-2008
Figure 13 Average iron concentrations in Rideau Creek, 2009-2014
Summary
A decline in metal concentrations was observed between the two periods of interest. Average concentrations are all below the PWQO. Efforts should continue to be made to identify pollution sources and implement best management practices to reduce any inputs such as runoff, metal alloys, fungicides and pesticides to improve overall stream health and lessen downstream impacts.
[1] No Ontario guideline for TKN is presently available; however, waters not influenced by excessive organic inputs typically range from 0.100 to 0.500 mg/l, Environment Canada (1979) Water Quality Sourcebook, A Guide to Water Quality Parameters, Inland Waters Directorate, Water Quality Branch, Ottawa, Canada
[2] A type of mean or average, which indicates the central tendency or typical value of a set of numbers by using the product of their values (as opposed to the arithmetic mean which uses their sum). It is often used to summarize a variable that varies over several orders of magnitude, such as E. coli counts.
3. Rideau Creek Riparian Conditions
Shoreline Buffer Land Cover Evaluation
The riparian or shoreline zone is that special area where the land meets the water. Well-vegetated shorelines are critically important in protecting water quality and creating healthy aquatic habitats, lakes and rivers. Natural shorelines intercept sediments and contaminants that could impact water quality conditions and harm fish habitat in streams. Well established buffers protect the banks against erosion, improve habitat for fish by shading and cooling the water and provide protection for birds and other wildlife that feed and rear young near water. A recommended target (from Environment Canada’s Guideline: How Much Habitat is Enough?) is to maintain a minimum 30 metre wide vegetated buffer along at least 75 percent of the length of both sides of rivers, creeks and streams.
Figure 14 shows the extent of the naturally vegetated riparian zone along a 30 metre wide strip of the shoreline of Rideau Creek and its tributaries. This information is derived from a dataset developed by the RVCA’s Land Cover Classification Program through heads-up digitization of 20cm DRAPE ortho-imagery at a 1:4000 scale, which details the catchment landscape using 10 land cover classes.
Figure 14 Natural and other riparian land cover in the Rideau Creek catchment
This analysis shows that the riparian buffer in the Rideau Creek catchment is comprised of wetland (74 percent), woodland (15 percent), crop and pastureland (eight percent), roads (two percent) and settlement areas (one percent). Additional statistics for the Rideau Creek catchment are presented in Table 9 and show that there has been very little change in shoreline cover from 2008 to 2014.
Table 9 Riparian land cover (2008 vs. 2014) in the Rideau Creek catchment
Rideau Creek Overbank Zone
Riparian Buffer Width Evaluation
Figure 15 demonstrates the buffer conditions of the left and right banks separately. Rideau Creek had a buffer of greater than 30 meters along 97 percent of the right bank and 93 percent of the left bank.
Figure 15 Riparian Buffer Evaluation along Rideau Creek
Adjacent Land Use
The RVCA’s Stream Characterization Program identifies seven different land uses beside Rideau Creek (Figure 16). Surrounding land use is considered from the beginning to end of the survey section (100m) and up to 100m on each side of the creek. Land use outside of this area is not considered for the surveys but is nonetheless part of the subwatershed and will influence the creek. Natural areas made up 92 percent of the stream, characterized by wetlands, forest, scrubland and meadow. The remaining land use consisted of active agriculture, recreational and infrastructure in the form of road crossings.
Figure 16 Land Use along Rideau Creek
Rideau Creek Shoreline Zone
Instream Erosion
Erosion is a normal, important stream process and may not affect actual bank stability; however, excessive erosion and deposition of sediment within a stream can have a detrimental effect on important fish and wildlife habitat. Poor bank stability can greatly contribute to the amount of sediment carried in a waterbody as well as loss of bank vegetation due to bank failure, resulting in trees falling into the stream and the potential to impact instream migration. Figure 17 shows highly variable erosion levels along Rideau Creek with conditions ranging from no erosion to high levels of erosion.
Figure 17 Erosion along Rideau Creek
Undercut Stream Banks
Undercut banks are a normal and natural part of stream function and can provide excellent refuge areas for fish. Figure 18 shows that Rideau Creek had varying levels of undercut banks along the system.
Figure 18 Undercut stream banks along Rideau Creek
Stream Shading
Grasses, shrubs and trees all contribute towards shading a stream. Shade is important in moderating stream temperature, contributing to food supply and helping with nutrient reduction within a stream. Figure 19 shows low to very high levels of stream shading conditions in the upper reaches of Rideau Creek.
Figure 19 Stream shading along Rideau Creek
Instream Woody Debris
Figure 20 shows that the majority of Rideau Creek had low to moderate levels of instream woody debris in the form of branches and trees. Instream woody debris is important for fish and benthic invertebrate habitat, by providing refuge and feeding areas.
Figure 20 Instream woody debris along Rideau Creek
Overhanging Trees and Branches
Figure 21 shows the system is dominated by low to moderate levels of overhanging branches and trees along Rideau Creek. Overhanging branches and trees provide a food source, nutrients and shade which helps to moderate instream water temperatures.
Figure 21 Overhanging trees and branches along Rideau Creek
Anthropogenic Alterations
Figure 22 shows 80 percent of Rideau Creek remains “unaltered” with no anthropogenic alterations. Seventeen percent of Rideau Creek was classified as natural with minor anthropogenic changes and three percent was considered altered in the form of road crossings.
Figure 22 Anthropogenic alterations along Rideau Creek
Rideau Creek Instream Aquatic Habitat
Benthic Invertebrates
Freshwater benthic invertebrates are animals without backbones that live on the stream bottom and include crustaceans such as crayfish, molluscs and immature forms of aquatic insects. Benthos represent an extremely diverse group of aquatic animals and exhibit wide ranges of responses to stressors such as organic pollutants, sediments and toxicants, which allows scientists to use them as bioindicators. As part of the Ontario Benthic Biomonitoring Network (OBBN), the RVCA has been collecting benthic invertebrates at the Richardson road site on Rideau Creek since 2003. Monitoring data is analyzed for each sample site and the results are presented using the Family Biotic Index, Family Richness and percent Ephemeroptera, Plecoptera and Trichoptera.
Hilsenhoff Family Biotic Index
The Hilsenhoff Family Biotic Index (FBI) is an indicator of organic and nutrient pollution and provides an estimate of water quality conditions for each site using established pollution tolerance values for benthic invertebrates. FBI results for Rideau Creek are separated by reporting period 2003 to 2008 and 2009 to 2014. “Poor” to “Good” water quality conditions being observed at the Rideau Creek sample location for the period from 2003 to 2014 (Figure 23) using a grading scheme developed by Conservation Authorities in Ontario for benthic invertebrates.
Figure 23 Hilsenhoff Family Biotic Index on Rideau Creek
Family Richness
Family Richness measures the health of the community through its diversity and increases with increasing habitat diversity suitability and healthy water quality conditions. Family Richness is equivalent to the total number of benthic invertebrate families found within a sample. Rideau Creek is reported to have “Fair” to “Good” family richness (Fig.24).
Figure 24 Family Richness in Rideau Creek
EPT
Ephemeroptera (Mayflies), Plecoptera (Stoneflies), and Trichoptera (Caddisflies) are species considered to be very sensitive to poor water quality conditions. High abundance of these organisms is generally an indication of good water quality conditions at a sample location. During more recent sampling years the community structure has been shifting to species that are more sensitive to poor water quality conditions. As a result, the EPT indicates that Rideau Creek is reported to have “Poor” to “Good” water quality (Fig.25) from 2003 to 2014.
Figure 25 EPT in Rideau Creek
Conclusion
Overall Rideau Creek aquatic habitat conditions from a benthic invertebrate perspective range from “Poor” to “Good” from 2003 to 2014.
Habitat Complexity
Streams are naturally meandering systems and move over time; there are varying degrees of habitat complexity, depending on the creek. Examples of habitat complexity include variable habitat types such as pools and riffles as well as substrate variability and woody debris structure. A high percentage of habitat complexity (heterogeneity) typically increases the biodiversity of aquatic organisms within a system. Thirty nine percent of Rideau Creek was considered heterogeneous, as shown in Figure 26.
Figure 26 Habitat complexity along Rideau Creek
Instream Substrate
Diverse substrate is important for fish and benthic invertebrate habitat because some species have specific substrate requirements and for example will only reproduce on certain types of substrate. Figure 27 shows that 54 percent of the substrate observed on Rideau Creek was dominated by clay. Overall substrate conditions were somewhat variable along Rideau Creek. Figure 28 shows the dominant substrate type observed for each section surveyed along Rideau Creek.
Figure 27 Instream substrate along Rideau Creek
Figure 28 shows the dominant substrate type along Rideau Creek
Cobble and Boulder Habitat
Boulders create instream cover and back eddies for large fish to hide and/or rest out of the current. Cobble provides important spawning habitat for certain fish species like walleye and various shiner species who are an important food source for larger fish. Cobble can also provide habitat conditions for benthic invertebrates that are a key food source for many fish and wildlife species. Figure 29 shows where cobble and boulder substrate are found in Rideau Creek.
Figure 29 Instream substrate cobble and boulder along Rideau Creek
Instream Morphology
Pools and riffles are important habitat features for fish. Riffles are areas of agitated water and they contribute higher dissolved oxygen to the stream and act as spawning substrate for some species of fish, such as walleye. Pools provide shelter for fish and can be refuge pools in the summer if water levels drop and water temperature in the creek increases. Pools also provide important over wintering areas for fish. Runs are usually moderately shallow, with unagitated surfaces of water and areas where the thalweg (deepest part of the channel) is in the center of the channel. Figure 30 shows that Rideau Creek is somewhat uniform; 75 percent consists of runs, 2 percent riffles and 23 percent pools. Figure 31 shows where riffle habitat was observed along Rideau Creek.
Figure 30 Instream morphology along Rideau Creek
Figure 31 Riffle habitat locations along Rideau Creek
Vegetation Type
Instream vegetation provides a variety of functions and is a critical component of the aquatic ecosystem. For example emergent plants along the shoreline can provide shoreline protection from wave action and important rearing habitat for species of waterfowl. Submerged plants provide habitat for fish to find shelter from predator fish while they feed. Floating plants such as water lilies shade the water and can keep temperatures cool while reducing algae growth. The dominant vegetation type recorded at nineteen percent consisted of submerged plants. Rideau Creek had high levels of diversity for instream vegetation. Figure 32 depicts the plant community structure for Rideau Creek. Figure 33 shows the dominant vegetation type observed for each section surveyed along Rideau Creek.
Figure 32 Vegetation type along Rideau Creek
Figure 33 Dominant vegetation type along Rideau Creek
Instream Vegetation Abundance
Instream vegetation is an important factor for a healthy stream ecosystem. Vegetation helps to remove contaminants from the water, contributes oxygen to the stream, and provides habitat for fish and wildlife. Too much vegetation can also be detrimental. Figure 34 demonstrates that Rideau Creek had common and normal levels of instream vegetation for 19 percent of its length. Low and rare vegetation was measured at 52 percent, while extensive levels were recorded at 21 percent of stream surveys.
Figure 34 Instream vegetation abundance along Rideau Creek
Invasive Species
Invasive species can have major implications on streams and species diversity. Invasive species are one of the largest threats to ecosystems throughout Ontario and can out compete native species, having negative effects on local wildlife, fish and plant populations. Ninety eight percent of the sections surveyed along Rideau Creek had invasive species (Figure 35). The invasive species observed in Rideau Creek were European frogbit, purple loosestrife, glossy and common buckthorn, poison/wild parsnip, yellow iris, flowering rush, honey suckle, Eurasian milfoil and Manitoba maple. Figure 36 shows the frequency of the invasive species observed along Rideau Creek.
Figure 35 Invasive species along Rideau Creek
Figure 36 Frequency of the invasive species observed along Rideau Creek
Water Chemistry
During the stream characterization survey, a YSI probe is used to collect water chemistry information. Dissolved oxygen, conductivity and pH are measured at the start and end of each section.
Dissolved Oxygen
Dissolved oxygen is a measure of the amount of oxygen dissolved in water. The Canadian Environmental Quality Guidelines of the Canadian Council of Ministers of the Environment (CCME) suggest that for the protection of aquatic life the lowest acceptable dissolved oxygen concentration should be 6 mg/L for warmwater biota and 9.5 mg/L for coldwater biota (CCME, 1999). Figure 37 shows that the dissolved oxygen in Rideau Creek was within the threshold for warmwater biota in most reaches of the system, however areas near the Rideau River and the middle reaches were below the warmwater threshold. The average dissolved oxygen levels observed within the main stem of Rideau Creek was 6. 48 mg/L which is within the recommended levels for warmwater biota.
Figure 37 Dissolved oxygen ranges in Rideau Creek
Conductivity
Conductivity in streams is primarily influenced by the geology of the surrounding environment, but can vary drastically as a function of surface water runoff. Currently there are no CCME guideline standards for stream conductivity; however readings which are outside the normal range observed within the system are often an indication of unmitigated discharge and/or stormwater input. The average conductivity observed within the main stem of Rideau Creek was 385 µs/cm. Figure 40 shows the conductivity readings for Rideau Creek (Figure 38).
Figure 38 Specific conductivity ranges in Rideau Creek
pH
Based on the PWQO for pH, a range of 6.5 to 8.5 should be maintained for the protection of aquatic life. Average pH values for Rideau Creek averaged 7.77 thereby meeting the provincial standard (Figure 39).
Figure 39 pH ranges in Rideau Creek
Thermal Regime
Many factors can influence fluctuations in stream temperature, including springs, tributaries, precipitation runoff, discharge pipes and stream shading from riparian vegetation. Water temperature is used along with the maximum air temperature (using the Stoneman and Jones method) to classify a watercourse as either warm water, cool water or cold water. Figure 40 shows where the thermal sampling sites were located along Rideau Creek. Analysis of the data collected indicates that Rideau Creek is classified as a cool water system with warm water reaches (Figure 41).
Figure 40 Temperature logger locations on Rideau Creek
Figure 41 Temperature logger data for three sites on Rideau Creek
Each point on the graph represents a temperature that meets the following criteria:
- Sampling dates between July 1st and September 7th
- Sampling date is preceded by two consecutive days above 24.5 °C, with no rain
- Water temperatures are collected at 4pm
- Air temperature is recorded as the max temperature for that day
Groundwater
Groundwater discharge areas can influence stream temperature, contribute nutrients, and provide important stream habitat for fish and other biota. During stream surveys, indicators of groundwater discharge are noted when observed. Indicators include: springs/seeps, watercress, iron staining, significant temperature change and rainbow mineral film. Figure 42 shows areas where one or more of the above groundwater indicators were observed during stream surveys and headwater assessments.
Figure 42 Groundwater indicators observed in the Rideau Creek catchment
Headwaters Drainage Features Assessment
The RVCA Stream Characterization program assessed Headwater Drainage Features for the Middle Rideau subwatershed in 2014. This protocol measures zero, first and second order headwater drainage features (HDF). It is a rapid assessment method characterizing the amount of water, sediment transport, and storage capacity within headwater drainage features (HDF). RVCA is working with other Conservation Authorities and the Ministry of Natural Resources and Forestry to implement the protocol with the goal of providing standard datasets to support science development and monitoring of headwater drainage features. An HDF is a depression in the land that conveys surface flow. Additionally, this module provides a means of characterizing the connectivity, form and unique features associated with each HDF (OSAP Protocol, 2013). In 2014 the program sampled 16 sites at road crossings in the Rideau Creek catchment area (Figure 43).

Figure 43 Locations of the headwater sampling sites in the Rideau Creek catchment
Spring photo of a headwater sample site in the Rideau Creek catchment located on Heritage Drive
Feature Type
The headwater sampling protocol assesses the feature type in order to understand the function of each feature. The evaluation includes the following classifications: defined natural channel, channelized or constrained, multi-thread, no defined feature, tiled, wetland, swale, roadside ditch and pond outlet. By assessing the values associated with the headwater drainage features in the catchment area we can understand the ecosystem services that they provide to the watershed in the form of hydrology, sediment transport, and aquatic and terrestrial functions. The Rideau Creek catchment is dominated by wetland and natural headwater drainage features. One feature was classified as having been channelized and three features were identified as roadside drainage features. Figure 44 shows the feature type of the primary feature at the sampling locations.
Figure 44 Headwater feature types in the Rideau Creek catchment
Headwater Feature Flow
The observed flow condition within headwater drainage features can be highly variable depending on timing relative to the spring freshet, recent rainfall, soil moisture, etc. Flow conditions are assessed in the spring and in the summer to determine if features are perennial and flow year round, if they are intermittent and dry up during the summer months or if they are ephemeral systems that do not flow regularly and generally respond to specific rainstorm events or snowmelt. Flow conditions in headwater systems can change from year to year depending on local precipitation patterns. Figure 45 shows the observed flow conditions at the sampling locations in the Rideau Creek catchment in 2014.
Figure 45 Headwater feature flow conditions in the Rideau Creek catchment
Feature Channel Modifications
Channel modifications were assessed at each headwater drainage feature sampling location. Modifications include channelization, dredging, hardening and realignments. The majority of sampling locations for the Rideau Creek catchment area were classified as having no channel modifications, three appeared to have been historically dredged and one was classified as having an online pond. Figure 46 shows the channel modifications observed at the sampling locations for Rideau Creek.
Figure 46 Headwater feature channel modifications in the Rideau Creek catchment
Headwater Feature Vegetation
Headwater feature vegetation evaluates the type of vegetation that is found within the drainage feature. The type of vegetated within the channel influences the aquatic and terrestrial ecosystem values that the feature provides. For some types of headwater features the vegetation within the feature plays a very important role in flow and sediment movement and provides wildlife habitat. The following classifications are evaluated no vegetation, lawn, wetland, meadow, scrubland and forest. The features assessed in the Rideau Creek catchment were classified being dominated by wetland. Two features were classified as meadow, one as forested and one feature was classified as having lawn. Figure 47. Depicts the dominant vegetation observed at the sampled headwater sites in the Rideau Creek catchment.
Figure 47 Headwater feature vegetation types in the Rideau Creek catchment
Headwater Feature Riparian Vegetation
Headwater riparian vegetation evaluates the type of vegetation that is found along the adjacent lands of a headwater drainage feature. The type of vegetation within the riparian corridor influences the aquatic and terrestrial ecosystem values that the feature provides to the watershed. The sample locations in Rideau Creek were dominated by natural vegetation in the form of meadow, scrubland, forest and wetland vegetation. Figure 48. Depicts the type of riparian vegetation observed at the sampled headwater sites in the Rideau Creek catchment.
Figure 48 Headwater feature riparian vegetation types in the Rideau Creek catchment
Headwater Feature Sediment Deposition
Assessing the amount of recent sediment deposited in a channel provides an index of the degree to which the feature could be transporting sediment to downstream reaches (OSAP, 2013). Evidence of excessive sediment deposition might indicate the requirement to follow up with more detailed targeted assessments upstream of the site location to identify potential best management practices to be implemented. Conditions ranged from no deposition observed to extensive deposition recorded. Figure 49. Depicts the degree of sediment deposition observed at the sampled headwater sites in the Rideau Creek catchment.
Figure 49 Headwater feature sediment deposition in the Rideau Creek catchment
Headwater Feature Upstream Roughness
Feature roughness will provide a measure of the amount of materials within the bankfull channel that could slow down the velocity of water flowing within the headwater feature (OSAP, 2013). Materials on the channel bottom that provide roughness include vegetation, woody debris and boulders/cobble substrates. Roughness can provide benefits in mitigating downstream erosion on the headwater drainage feature and the receiving watercourse by reducing velocities. Roughness also provides important habitat conditions to aquatic organisms. The sample locations in the Rideau Creek catchment area were dominated by moderate roughness conditions. Figure 50 shows the feature roughness conditions at the sampling locations in the Rideau Creek catchment.
Figure 50 Headwater feature roughness in the Rideau Creek catchment
Fish Community
The Rideau Creek catchment is classified as a mixed community of warm and cool water recreational and baitfish fishery with 21 species observed. Table 10 lists the species observed in the catchment (Source: MNR/RVCA). Figure 51 shows the sampling locations along Rideau Creek.
Figure 51 Rideau Creek fish community
Table 10 Fish species observed in Rideau Creek
RVCA staff set fyke nets along the system to sample fish in Rideau Creek
Migratory Obstructions
It is important to know locations of migratory obstructions because these can prevent fish from accessing important spawning and rearing habitat. Migratory obstructions can be natural or manmade, and they can be permanent or seasonal. Figure 52 shows that Rideau Creek had multiple beaver dams and one debris dam at the time of the survey in 2014. In addition three perched culverts and one natural grade barrier were identified in the Rideau Creek catchment.
Figure 52 Migratory obstructions along Rideau Creek
Riparian Restoration
Figure 53 depicts the location of a riparian restoration opportunity as a result of observations made during the stream survey and headwater drainage feature assessments. One site was identified along Rideau Creek for riparian restoration.
Figure 53 Riparian restoration opportunities along Rideau Creek
4. Land Cover
Land cover and any change in coverage that has occurred over a six year period is summarized for the Rideau Creek catchment using spatially continuous vector data representing the catchment during the spring of 2008 and 2014. This dataset was developed by the RVCA through heads-up digitization of 20cm DRAPE ortho-imagery at a 1:4000 scale and details the surrounding landscape using 10 land cover classes.
As shown in Table 11, the dominant land cover types in 2008 and 2014 were woodland and wetland along with crop and pastureland.
Table 11 Land cover (2008 vs. 2014) in the Rideau Creek catchment
* Does not include treed swamps ** Includes treed swamps
From 2008 to 2014, there was an overall change of 42 hectares (from one land cover class to another). Land cover change in the Rideau Creek catchment is largely associated with crop and pastureland (i.e., previously cultivated areas/fallow fields) emerging as young woodland (i.e., regenerative and/or plantation) along with wetland encroaching into woodland. Another source of notable change is associated with the conversion of crop and pastureland to settlement (see Figure 54 for the location of the major changes).
Figure 54 Dominant land cover change in the Rideau Creek catchment (2014)
Table 12 shows the type of land cover change that has taken place between land cover classes/types from 2008 to 2014.
Overall, the net area of crop and pastureland change (loss) is relatively small at 19 hectares relative to the remaining area of crop and pastureland in the catchment (as of 2014), as is the net area of woodland change (loss) at seven hectares relative to the remaining area of woodland in the catchment (as of 2014) and the net area of wetland change (at 13 hectares) in comparison to the remaining area of wetland in the catchment (as of 2014). However, the net area of settlement change (gain) is greater (at 11 hectares) relative to the remaining area of settlement in the catchment (as of 2014).
Table 12 Land cover change in the Rideau Creek catchment (2008 to 2014)
Woodland Cover
In the Environment Canada Guideline (Third Edition) entitled “How Much Habitat Is Enough?” (hereafter referred to as the “Guideline”) the opening narrative under the Forest Habitat Guidelines section states that prior to European settlement, forest was the predominant habitat in the Mixedwood Plains ecozone. The remnants of this once vast forest now exist in a fragmented state in many areas (including the Rideau Valley watershed) with woodland patches of various sizes distributed across the settled landscape along with higher levels of forest cover associated with features such as the Frontenac Axis (within the on-Shield areas of the Rideau Lakes and Tay River subwatersheds). The forest legacy, in terms of the many types of wildlife species found, overall species richness, ecological functions provided and ecosystem complexity is still evident in the patches and regional forest matrices (found in the Middle Rideau subwatershed and elsewhere in the Rideau Valley watershed). These ecological features are in addition to other influences which forests have on water quality and stream hydrology including reducing soil erosion, producing oxygen, storing carbon along with many other ecological services that are essential not only for wildlife but for human well-being.
The Guideline also notes that forests provide a great many habitat niches that are in turn occupied by a great diversity of plant and animal species. They provide food, water and shelter for these species - whether they are breeding and resident locally or using forest cover to help them move across the landscape. This diversity of species includes many that are considered to be species at risk. Furthermore, from a wildlife perspective, there is increasing evidence that the total forest cover in a given area is a major predictor of the persistence and size of bird populations, and it is possible or perhaps likely that this pattern extends to other flora and fauna groups. The overall effect of a decrease in forest cover on birds in fragmented landscapes is that certain species disappear and many of the remaining ones become rare, or fail to reproduce, while species adapted to more open and successional habitats, as well as those that are more tolerant to human-induced disturbances in general, are able to persist and in some cases thrive. Species with specialized-habitat requirements are most likely to be adversely affected. The overall pattern of distribution of forest cover, the shape, area and juxtaposition of remaining forest patches and the quality of forest cover also play major roles in determining how valuable forests will be to wildlife and people alike.
The current science generally supports minimum forest habitat requirements between 30 and 50 percent, with some limited evidence that the upper limit may be even higher, depending on the organism/species phenomenon under investigation or land-use/resource management planning regime being considered/used.
As shown in Figure 55, 41 percent of the Rideau Creek catchment contains 2557 hectares of upland forest and 238 hectares of lowland forest (treed swamps) versus the 34 percent of woodland cover in the Middle Rideau subwatershed. This is greater than the 30 percent of forest cover that is identified as the minimum threshold required to sustain forest birds according to the Guideline and which may only support less than one half of potential species richness and marginally healthy aquatic systems. When forest cover drops below 30 percent, forest birds tend to disappear as breeders across the landscape.
Figure 55 Woodland cover and forest interior (2014)
Woodland (Patch) Size
According to the Ministry of Natural Resources’ Natural Heritage Reference Manual (Second Edition), larger woodlands are more likely to contain a greater diversity of plant and animal species and communities than smaller woodlands and have a greater relative importance for mobile animal species such as forest birds.
Bigger forests often provide a different type of habitat. Many forest birds breed far more successfully in larger forests than they do in smaller woodlots and some rely heavily on forest interior conditions. Populations are often healthier in regions with more forest cover and where forest fragments are grouped closely together or connected by corridors of natural habitat. Small forests support small numbers of wildlife. Some species are “area-sensitive” and tend not to inhabit small woodlands, regardless of forest interior conditions. Fragmented habitat also isolates local populations, especially small mammals, amphibians and reptiles with limited mobility. This reduces the healthy mixing of genetic traits that helps populations survive over the long run (Conserving the Forest Interior. Ontario Extension Notes, 2000).
The Environment Canada Guideline also notes that for forest plants that do not disperse broadly or quickly, preservation of some relatively undisturbed large forest patches is needed to sustain them because of their restricted dispersal abilities and specialized habitat requirements and to ensure continued seed or propagation sources for restored or regenerating areas nearby.
The Natural Heritage Reference Manual continues by stating that a larger size also allows woodlands to support more resilient nutrient cycles and food webs and to be big enough to permit different and important successional stages to co-exist. Small, isolated woodlands are more susceptible to the effects of blowdown, drought, disease, insect infestations, and invasions by predators and non-indigenous plants. It is also known that the viability of woodland wildlife depends not only on the characteristics of the woodland in which they reside, but also on the characteristics of the surrounding landscape where the woodland is situated. Additionally, the percentage of forest cover in the surrounding landscape, the presence of ecological barriers such as roads, the ability of various species to cross the matrix surrounding the woodland and the proximity of adjacent habitats interact with woodland size in influencing the species assemblage within a woodland.
In the Rideau Creek catchment (in 2014), 61 (34 percent) of the 180 woodland patches are very small, being less than one hectare in size. Another 102 (57 percent) of the woodland patches ranging from one to less than 20 hectares in size tend to be dominated by edge-tolerant bird species. The remaining 17 (nine percent of) woodland patches range between 21 and 347 hectares in size. Eight of these patches contain woodland between 20 and 100 hectares and may support a few area-sensitive species and some edge intolerant species, but will be dominated by edge tolerant species.
Conversely, nine (five percent) of the 180 woodland patches in the drainage area exceed the 100 plus hectare size needed to support most forest dependent, area sensitive birds and are large enough to support approximately 60 percent of edge-intolerant species. Five patches top 200 hectares, which according to the Environment Canada Guideline will support 80 percent of edge-intolerant forest bird species (including most area sensitive species) that prefer interior forest habitat conditions.
Table 13 presents a comparison of woodland patch size in 2008 and 2014 along with any changes that have occurred over that time. A decrease (of six ha) has been observed in the overall woodland patch area between the two reporting periods with most change occurring in the 1 to 20 and 20 to 50 hectare woodland patch size class ranges.
Table 13 Woodland patches in the Rideau Creek catchment (2008 and 2014)
*Includes treed swamps
Forest Interior
The forest interior is habitat deep within woodlands. It is a sheltered, secluded environment away from the influence of forest edges and open habitats. Some people call it the “core” or the “heart” of a woodland. The presence of forest interior is a good sign of woodland health, and is directly related to the woodland’s size and shape. Large woodlands with round or square outlines have the greatest amount of forest interior. Small, narrow woodlands may have no forest interior conditions at all. Forest interior habitat is a remnant natural environment, reminiscent of the extensive, continuous forests of the past. This increasingly rare forest habitat is now a refuge for certain forest-dependent wildlife; they simply must have it to survive and thrive in a fragmented forest landscape (Conserving the Forest Interior. Ontario Extension Notes, 2000).
The Natural Heritage Reference Manual states that woodland interior habitat is usually defined as habitat more than 100 metres from the edge of the woodland and provides for relative seclusion from outside influences along with a moister, more sheltered and productive forest habitat for certain area sensitive species. Woodlands with interior habitat have centres that are more clearly buffered against the edge effects of agricultural activities or more harmful urban activities than those without.
In the Rideau Creek catchment (in 2014), the 180 woodland patches contain 56 forest interior patches (Figure 55) that occupy 11 percent (423 ha.) of the catchment land area (which is greater than the five percent of interior forest in the Middle Rideau Subwatershed). This is above the ten percent figure referred to in the Environment Canada Guideline that is considered to be the minimum threshold for supporting edge intolerant bird species and other forest dwelling species in the landscape.
Most patches (66) have less than 10 hectares of interior forest, 44 of which have small areas of interior forest habitat less than one hectare in size. The remaining 15 patches contain interior forest ranging between 11 and 113 hectares in area.
Between 2008 and 2014, there has been a notable change in the number of woodland patches containing smaller areas of interior habitat (Table 14) with an increase of 31 woodlands containing less than one hectare of interior forest over this period and 18 woodlands with one to 10 hectares of interior habitat. This has occurred as a result of the loss of interior forest habitat in the 50 to 100 size range.
Table 14 Woodland interior in the Rideau Creek catchment (2008 and 2014)
Wetland Cover
Wetlands are habitats forming the interface between aquatic and terrestrial systems. They are among the most productive and biologically diverse habitats on the planet. By the 1980s, according to the Natural Heritage Reference Manual, 68 percent of the original wetlands south of the Precambrian Shield in Ontario had been lost through encroachment, land clearance, drainage and filling.
Wetlands perform a number of important ecological and hydrological functions and provide an array of social and economic benefits that society values. Maintaining wetland cover in a watershed provides many ecological, economic, hydrological and social benefits that are listed in the Reference Manual and which may include:
- contributing to the stabilization of shorelines and to the reduction of erosion damage through the mitigation of water flow and soil binding by plant roots
- mitigating surface water flow by storing water during periods of peak flow (such as spring snowmelt and heavy rainfall events) and releasing water during periods of low flow (this mitigation of water flow also contributes to a reduction of flood damage)
- contributing to an improved water quality through the trapping of sediments, the removal and/or retention of excess nutrients, the immobilization and/or degradation of contaminants and the removal of bacteria
- providing renewable harvesting of timber, fuel wood, fish, wildlife and wild rice
- contributing to a stable, long-term water supply in areas of groundwater recharge and discharge
- providing a high diversity of habitats that support a wide variety of plants and animals
- acting as “carbon sinks” making a significant contribution to carbon storage
- providing opportunities for recreation, education, research and tourism
Historically, the overall wetland coverage within the Great Lakes basin exceeded 10 percent, but there was significant variability among watersheds and jurisdictions, as stated in the Environment Canada Guideline. In the Rideau Valley Watershed, it has been estimated that pre-settlement wetland cover averaged 35 percent using information provided by Ducks Unlimited Canada (2010) versus the 21 percent of wetland cover existing in 2014 derived from DRAPE imagery analysis.
Using the same dataset, it is estimated that pre-settlement (historic) wetland cover averaged 32 percent in the Middle Rideau subwatershed versus the 27 percent of cover existing in 2014. This decline in wetland cover is also evident in the Rideau Creek catchment (as seen in Figure 56) where there has been a one percent decrease in the area of wetland cover from pre-settlement times to the present (as summarized in Table 15).
Figure 56 Catchment wetland cover
While there has been a reported decrease in wetland cover in the Rideau Creek catchment from pre-settlement times, the remaining wetland cover in 2014 remains above the ecological thresholds cited in the Environment Canada Guideline. Nonetheless, in order to maintain critical hydrological, ecological functions along with related recreational and economic benefits provided by these wetland habitats in the catchment, a “no net loss” of currently existing wetlands should be employed to ensure the continued provision of tangible benefits accruing from them for landowners and surrounding communities.
Table 15 Wetland cover in the Middle Rideau subwatershed and Rideau Creek catchment (Historic to 2014)
5. Stewardship and Protection
The RVCA and its partners are working to protect and enhance environmental conditions in the Middle Rideau Subwatershed. Figure 57 shows the location of all stewardship projects completed in the Rideau Creek catchment along with sites identified for potential shoreline restoration.
Rural Clean Water Projects
From 2009 to 2014, one livestock fencing project was completed along with one well upgrade between 2003 and 2008. Total project value is $9,326 with $8,534 of that amount funded through grant dollars from the RVCA. No projects were carried out before 2003 in the catchment.
Figure 57 Stewardship and potential restoration locations
Tree Planting Projects
The location of RVCA Tree Planting Program projects is shown in Figure 57. Prior to 2003, 131,620 trees were planted at 19 sites resulting in the reforestation of 66 hectares. Total project value is $332,620 with $94,930 of that amount coming from various fundraising sources. No projects were carried out in the catchment between 2003 and 2014.
Through the RVCA Butternut Recovery Program, an additional 20 butternut trees were planted in the Rideau Creek catchment between 2009 and 2014, as part of efforts to introduce healthy seedlings from tolerant butternuts into various locations across Eastern Ontario.
Valley, Stream, Wetland and Hazard Land Regulation
The Rideau Creek catchment covers 68 square kilometres with 19 square kilometres (or 28 percent) of the drainage area being within the regulation limit of Ontario Regulation 174/06 (Figure 58), giving protection to wetland areas and river or stream valleys that are affected by flooding and erosion hazards.
Wetlands occupy 22.7 sq. km. (or 33 percent) of the catchment. Of these wetlands, 12.2 sq. km (or 54 percent) are designated as provincially significant and included within the RVCA regulation limit. This leaves the remaining 10.4 sq. km. (or 46 percent) of wetlands in the catchment outside the regulated area limit.
Of the 95.8 kilometres of stream in the catchment, regulation limit mapping has been plotted along 40.6 kilometers of streams (representing 42 percent of all streams in the catchment). Some of these regulated watercourses (31.8 km or 33 percent of all streams) flow through regulated wetlands; the remaining 8.8 km (or 22 percent) of regulated streams are located outside of those wetlands. Plotting of the regulation limit on the remaining 55.3 km (or 58 percent) of streams requires identification of flood and erosion hazards and valley systems.
Within the regulation limit, “development” and “site alteration” require RVCA permission. The “alteration to waterways” provision of Ontario Regulation 174/06 applies to all watercourses.
Figure 58 RVCA regulation limits
Vulnerable Drinking Water Areas
The Rideau Creek drainage catchment is considered to have a Highly Vulnerable Aquifer. This means that the nature of the overburden (thin soils, fractured bedrock) does not provide a high level of protection for the underlying groundwater making the aquifer more vulnerable to contaminants released on the surface. The Mississippi-Rideau Source Protection Plan includes policies that focus on the protection of groundwater region-wide due to the fact that most of the region, which encompasses the Mississippi and Rideau watersheds, is considered Highly Vulnerable Aquifer. For detailed maps and policies that have been developed to protect drinking water sources, please go to the Mississippi-Rideau Source Protection Region website at www.mrsourcewater.ca to view the Mississippi-Rideau Source Protection Plan.
6. Issues
Water Quality
- Surface chemistry water quality rating in Rideau Creek is “Fair” over two reporting periods (2003-2008 and 2009-2014) as determined by surface water chemistry data. Occasional exceedances of nutrients, E.coli and metals contributed to the rating
- Instream biological water quality conditions at the Rideau Creek sample location range from “Poor” to “Good” from 2003 to 2014 (using a grading scheme developed by Ontario Conservation Authorities in Ontario for benthic invertebrates) with an overall benthic invertebrate water quality rating of “Poor” to “Good” determined for this period
Shorelines/Headwaters
-
Emerald ash borer poses a significant threat to the ecology of the subwatershed, given the prominence of ash trees along shorelines and in riparian and wetland areas. Many tree stands are predominantly ash and with their anticipated loss, it is unclear what will replace them and the overall effect of their collective demise on the physical and natural functions/values they provide for erosion, water quality and fish and wildlife habitat protection
Land Cover
- The catchment contains 1045 ha of unevaluated wetland (occupying 15 percent of its total area) that provides many important social, hydrological, biological and ecological functions/services. Although not under imminent threat from development activity, they do remain vulnerable to drainage and land clearing activities in the absence of any regulatory and planning controls that would otherwise protect thems
7. Opportunities/Actions
Water Quality
- Investigate the source of possible pollutants along Rideau Creek and its tributaries and consider implementing measures to reduce nutrient and bacterial loadings
- Implement agricultural and residential best management practices to address the occasional exceedances of nutrient concentrations, high bacteria counts and metal concentrations on Rideau Creek by restricting livestock access to the creek, limiting the use of fertilizers and pesticide applications and improving or maintaining a shoreline buffer
- Continue to offer the suite of water quality improvement projects provided by the Rideau Valley Rural Clean Water Program to landowners
- Continue to protect Rideau Creek and its tributaries through implementation of municipal and agency land use planning and development policies and practices
Shorelines/Headwaters
- Continue to promote the Rideau Valley Shoreline Naturalization and Tree Planting Programs to landowners
- RVCA and the Township of Montague are to continue educating landowners about the value and importance of headwater drainage features, natural shorelines and waterfront property best management practices with respect to shoreline use and development, septic system installation and maintenance and shoreline vegetation retention and enhancement
- Protect the riparian buffer along the shoreline of Rideau Creek and other catchment streams (headwaters) during the development approvals process through adherence to and enforcement of municipal land-use policies and zoning standards
- Target shoreline restoration at sites identified in this report (shown as “Other riparian land cover” in Figure 14 and “Potential Riparian/Shoreline Restoration” in Figure 53) and explore other restoration and enhancement opportunities along Rideau Creek and its tributaries
Development
- Collectively work with approval authorities (Township of Montague, Conservation Authority) to consistently implement current land use planning and development policies for water quality and shoreline protection adjacent to Rideau Creek and other catchment streams (e.g., a minimum 30 metre development setback from water)
- Explore ways and means to more effectively enforce and implement conditions of land-use planning and development approval to achieve net environmental gains (particularly with respect to rehabilitating or protecting naturally vegetated shorelines and water quality)
- Municipalities and agencies are encouraged to strengthen natural heritage and water resources official plan policies and zoning provisions (water setbacks, frontage and naturalized shorelines and wetland protection) where deemed appropriate
- Utilize RVCA subwatershed and catchment reports to help develop/revise official plan policies to protect surface water resources and the natural environment (including woodlands, wetlands and shoreline cover)
- Consider establishing RVCA regulations limits to protect additional wetlands
Full Catchment Report
Middle Rideau Subwatershed Report 2015
ROSEDALE CREEK
The RVCA produces individual reports for ten catchments in the Middle Rideau subwatershed. Using data collected and analysed by the RVCA through its watershed monitoring and land cover classification programs, surface water quality conditions are reported for Rosedale Creek along with a summary of environmental conditions for the surrounding countryside every six years.
This information is used to better understand the effects of human activity on our water resources, allows us to better track environmental change over time and helps focus watershed management actions where they are needed the most to help sustain the ecosystem services (cultural, aesthetic and recreational values; provisioning of food, fuel and clean water; regulation of erosion/natural hazard protection and water purification; supporting nutrient/water cycling and habitat provision) provided by the catchment’s lands and forests and waters (Millennium Ecosystem Assessment 2005).
The following pages of this report are a compilation of that work and contain information on surface water quality, riparian conditions, land cover, stewardship activity and hazard land and water resources protection.
1. Catchment Facts
General Geography
- The Rideau River flows through the heart of the Middle Rideau and is a focal point for residents and visitors to the area. It extends from the outlet of Lower Rideau Lake at Poonamalie (where there is one dam and one lock) to Burritts Rapids (where there is also a dam and lock), at which point it enters the Lower Rideau on its way to Rideau Falls. The Rideau River is also an integral part of the Rideau Canal National Historic Site of Canada and is a significant tourist attraction which draws boaters, cottagers, and campers to the area
- Smiths Falls, Merrickville and Burritts Rapids are the main urban settlements in the Middle Rideau subwatershed. The Rosedale Creek catchment is predominantly rural in character with agriculture being the main land use. Settlement areas include Nolan’s Corners and Rosedale
- Parks Canada staff manage water levels for recreational purposes along the Rideau Canal/Waterway that flows by the catchment, ensuring 1.5 metres of draft during the navigation season. In this managed system, water levels on the Rideau Canal are manipulated by operation of numerous dams. In the Middle Rideau subwatershed, Parks Canada staff operate 9 dam and lock complexes with 13 locks for a fall of 36.2 metres over 35.6 kilometres. Water levels are maintained as close as possible to set objectives through the May to October navigation season. The levels are lowered through the rest of October and into November and held at the winter levels until the spring freshet in late March or early April naturally increases inflows to the system. To reduce the impact of the higher flows in the spring, the amount of snow water equivalent, forecast rain, ice cover, flows and levels are assessed and the dams in the Middle Rideau reach are operated accordingly to quickly pass as much water as possible. In late April and early May, the dams are gradually closed and water levels are brought up to be ready, once again, for the navigation season
Physical Geography
- All of Rosedale Creek Catchment and the rest of the Middle Rideau Subwatershed primarily resides within the Smith Falls Limestone Plain, which in this area, happens to consist of older Paleozoic quartz sandstone and dolostone of the March Formation. A small section of the Oxford Formation dolostone however, is also found within the southern part of the catchment. The bedrock in the catchment is overlain by a thin veneer of glacial sediment, referred to as ‘drift’ that is generally less than a metre in thickness; although there are organic deposits underlying the two main wetlands in the catchment and clay lining the creek’s corridor. A geologic fault likely transects the southern part of the catchment
- One Hundred percent of the catchment lies within the Township of Montague
- Rosedale Creek catchment drainage area is 64 square kilometres and occupies about eight percent of the Middle Rideau subwatershed and one percent of the Rideau Valley watershed
Vulnerable Areas
- Lower reach of Rosedale Creek is subject to a flooding hazard during the regional storm flood (the 100 year flood). Surveys and studies undertaken in accordance with provincial standards have determined that the 100 year flood elevation in this area ranges from 107.9 metres above mean sea level at the upper, mapped extent of the regulation limit above Rosedale Road South to 104.3 metres above mean sea level at its outlet to the Rideau River
- The Assessment Report developed under the Ontario Clean Water Act identifies the upper bedrock aquifer underlying all of the catchment area as a Highly Vulnerable Aquifer, although, where sediments are thicker in a local area, the vulnerability would be less. The southern half of the catchment lies within part of the Wellhead Protection Area for the Merrickville municipal wells; related provincial policies apply
Development/Trends
- The Township of Montague consists of scattered residential and agricultural development, mostly along traditional transportation routes and in areas of good agricultural capability. The hamlet of Rosedale, with some more recent subdivision development is the area of densest rural residential development in the catchment. Commercial and industrial development is very limited outside the settled areas and there are no major employers within the Township
- Recent years have seen an increase in residential lot creation throughout the catchment, after a lengthy period of stagnant population. Montague's relative proximity to Ottawa and ease of access, as well as relatively affordable land are thought to have contributed to this. Interestingly, most recent severances have been in the more rural forested settings, as opposed to along major transportation corridors or established built communities. As such, site specific environmental impact studies and development conditions have often accompanied approvals. Lot sizes have often also been larger than the 'standard minimum' of an acre. Montague's population had one of the highest rates of increase among Lanark County municipalities between 2006 and 2011
Conditions at a Glance
Water Quality
- Surface chemistry water quality rating in Rosedale Creek is “Fair” at both monitoring sites (2009 to 2014). Site ROS-01 (County Rd. 43) has improved from a “Poor” to a “Fair rating from 2003-2008 to 2009-2014, while site ROS-02 (Rosedale Rd. South) remains unchanged. Elevated bacterial counts and nutrient concentrations from inflows of nutrients (from private septic systems, agricultural, commercial, residential surface runoff) are a feature of Rosedale Creek and decreased nutrient and bacterial counts are needed to improve the overall health of the creek
- Instream biological water quality conditions at the Rosedale Creek sample location range from “Very Poor” to “Fair” from 2003 to 2014 (using a grading scheme developed by Ontario Conservation Authorities in Ontario for benthic invertebrates) with an overall benthic invertebrate water quality rating of “Very Poor” to “Fair” determined for this period
Instream and Riparian
- Overall instream and riparian condition for the Rosedale creek catchment as assessed by the stream characterization and headwater drainage feature assessment programs show that Rosedale Creek and its tributaries are in generally good condition. The majority of the system has a healthy riparian corridor with low levels erosion along the system. Instream diversity of aquatic habitat is somewhat variable with moderate levels of riffle habitat and low levels of pool habitat. Several opportunities were identified on tributaries of Rosedale Creek to enhance riparian habitat conditions. One weir and multiple beaver dams were identified as potential migratory obstructions for fish passage along the creek at the time of the survey
- The Rosedale Creek catchment has 25 species of recreational and bait fish and is classified as having a cool/warm water thermal guild that supports the Rosedale Creek/Rideau River fishery
- In the Rosedale Creek catchment, the riparian buffer (30 m. wide strip along the shoreline of all lakes and streams) is comprised of wetland (63 percent), crop and pastureland (20 percent), woodland (12 percent), settlement areas (three percent) and roads (two percent)
Land Cover
- Dominant land cover is woodland (36 percent) followed by crop and pastureland (31 percent), wetland (27 percent), settlement areas (four percent) and roads (two percent). From 2008 to 2014, there was an overall change of 143 hectares (from one land cover class to another). Within the catchment, major change is a result of the conversion of woodland to crop and pastureland. A slightly smaller proportion of change is also associated with crop and pastureland emerging as young woodland. Another factor of change is the conversion of crop and pastureland and woodland to settlement
- Woodland cover in the catchment has decreased by 29 hectares between 2008 and 2014 and interior forest habitat has decreased by 27 hectares
- Wetland cover has decreased by one percent (56 ha) from pre-settlement times to the present and now occupies 36 percent of the catchment area
Other
- Approximately 720 to 760 in-use water wells with provincial records in this catchment. While most water wells are used for domestic water supply, in this catchment, several are also used for public and agricultural water supplies, monitoring or cooling
- Two bedrock aggregate licenses occur in or partially within the catchment and there is one sand and gravel pit license in the catchment
- There is one Environmental Compliance Approval for an institutional sewage works and one for municipal air emissions and a Permit to Take Water has been issued in this catchment for commercial dewatering
Catchment Care
- Thirty stewardship projects have been completed with assistance from the RVCA’s Rural Clean Water and Tree Planting Programs (see Section 5 of this report for details)
- Rosedale Creek surface water quality has been monitored by the RVCA through its Baseline Monitoring Program since 2003. The surface water quality at sites ROS-01 and ROS-02 is monitored once a month from April to November
- RVCA has been collecting benthic invertebrates in Rosedale Creek at the Matheson Drive site since 2003
- RVCA conducted a fish survey along Rosedale Creek in 2014
- RVCA completed the stream characterization survey on Rosedale Creek in 2014, working upstream to the headwaters from the mouth of the creek where it empties into the Rideau River taking measurements and recording observations on instream habitat, bank stability, other attributes and preparing a temperature profile
- RVCA completed 18 headwater drainage feature assessments at road crossings in the Rosedale Creek catchment in 2014. This protocol measures zero and first order headwater drainage features and is a rapid assessment method characterizing the amount of water, sediment transport, and storage capacity within headwater drainage features
- A watershed model developed by the RVCA in 2009 was used to study the hydrologic function of wetlands in the Rideau Valley Watershed, including those found in the Rosedale Creek catchment
- The Township of Montague has land use planning policies and zoning provisions - on lake capacity, water setbacks, frontage and naturalized shorelines and wetland protection - and use site plan control to implement these policies and provisions. Together with RVCA, the Township works with landowners on a case by case basis to achieve net environmental gains (particularly with respect to shoreline vegetation protection and rehabilitation) through the application of shoreline best management practices. Through the land-use planning process, the Township, RVCA and agencies request conditions of approval to ensure that development and redevelopment is appropriate for the property, impacts on neighbours are minimized (particularly on very small lots) and development setbacks for the shoreline are maximized
- Development in and adjacent to the Provincially Significant Wetlands in the catchment (North Montague Swamp, Pinery Road, Rideau River Part 1, South Mud Lake) are subject to Ontario Regulation 174-06 (entitled “Development, Interference with Wetlands and Alterations to Shorelines and Watercourses”) that protects the hydrologic function of the wetland and also protects landowners and their property from natural hazards (flooding, fluctuating water table, unstable soils) associated with them
2. Surface Water Quality Conditions
Surface water quality conditions in the Rosedale Creek catchment are monitored by the Rideau Valley Conservation Authority’s (RVCA) Baseline Water Quality Monitoring Program. The Baseline Water Quality Program focuses on streams; data is collected for 22 parameters including nutrients (total phosphorus, total Kjeldahl nitrogen and ammonia), E. coli, metals (like aluminum and copper) and additional chemical/physical parameters (such as alkalinity, chlorides, pH and total suspended solids). Figure 1 shows the location of the monitoring sites in the catchment.
Figure 1 Water quality monitoring sites on Rosedale Creek
Rosedale Creek Water Quality
Water Quality Rating
The water quality rating for Rosedale Creek sites (ROS-01 and ROS-02) are both “Fair” (Table 1) as determined by the Canadian Council of Ministers of the Environment (CCME) Water Quality Index and are largely influenced by frequent high nutrient concentrations, occasional metal exceedances and high bacterial counts. A "Fair" rating indicates that water quality is usually protected but is occasionally threatened or impaired; conditions sometimes depart from natural or desirable levels. Each parameter is evaluated against established guidelines to determine water quality conditions. Those parameters that frequently exceed guidelines are presented below. Analysis of the data has been broken into two periods; 2003 to 2008 and 2009 to 2014 to examine if conditions have changed between these periods. The water quality score at both sites has improved and ROS-01 has seen its rating change from “Poor” to “Fair”. Table 1 shows the overall rating for the monitored surface water quality sites within the Rosedale Creek catchment and Table 2 outlines the Water Quality Index (WQI) scores and their corresponding ratings.
Table 1 Water Quality Index ratings for the Otter Creek Catchment
Table 2 Water Quality Index ratings and corresponding index scores (RVCA terminology, original WQI category names in brackets
Nutrients
Total phosphorus (TP) is used as a primary indicator of excessive nutrient loading and may contribute to abundant aquatic vegetation growth and depleted dissolved oxygen levels. The Provincial Water Quality Objective (PWQO) is used as the TP Guideline and states that in streams concentrations greater than 0.030 mg/l indicate an excessive amount of TP.
Total Kjeldahl nitrogen (TKN) and ammonia (NH3) are used as secondary indicators of nutrient loadings. RVCA uses a guideline of 0.500 mg/l to assess TKN[1] and the PWQO of 0.020 mg/l to assess NH3 concentrations in Rosedale Creek.
Tables 3, 4 and 5 summarize average nutrient concentrations at monitored sites within the Rosedale Creek catchment and show the proportion of results that meet the guidelines.
Table 3 Summary of total phosphorus results for Rosedale Creek, 2003-2008 and 2009-2014. Highlighted values indicate average concentrations exceed the guideline
Table 4 Summary of total Kjeldahl nitrogen results for Rosedale Creek from 2003-2008 and 2009-2014. Highlighted values indicate average concentrations exceed the guideline
Table 5 Summary of ammonia results for Rosedale Creek from 2003-2008 and 2009-2014. Highlighted values indicate average concentrations exceed the guideline
ROS-01
The majority of samples at site ROS-01 were above the TP guideline from 2003-2008; however the amount of exceedances decreased in the 2009-2014 monitoring period (Figures 2 and 3). The number of samples below the guideline increased from 36 percent in 2003-2008 to 62 percent from 2009-2014. The average TP concentrations decreased from 0.076 mg/l (2003–2008) to 0.030 mg/l (2009–2014).
TKN concentrations show that the bulk of results exceeded the guideline (Figures 4 and 5); there were few samples (19 percent) below the guideline in the 2003-2008 period and this slightly increased to 27 percent in the 2009-2014 period. The average concentration was generally elevated but decreased from 0.662 mg/l to 0.578 mg/l (Table 4).
In the 2003-2008 reporting period half of NH3 results were below the guideline with an average concentration of 0.021 mg/l (Figure 6). The percentage of results remained the same for both monitoring periods, with 50 percent of samples below the guideline. The average concentration in 2009-2014 decreased to 0.017 mg/l (Figure 7).
ROS-02
Elevated TP results were an occasional occurrence at site ROS-02; 71 percent of samples were below the guideline in the 2003-2008 period (Figure 2); this increased to 76 percent of samples in the 2009-2014 period (Figure 3). The average TP concentration also decreased slightly from 0.030 mg/l (2003- 2008) to 0.025 mg/l (2009-2014).
The bulk of TKN results have exceeded the guideline (Figure 4 and 5), with 29 percent of samples below the guideline in the 2003-2008 period, decreasing to 22 percent of samples below the guideline from 2009-2014. The average concentration was elevated and increased from 0.572 mg/l to 0.620 mg/l (Table 4).
The results for NH3 indicate that exceedances were an occasional occurrence. The proportion of results that were below the guideline were 75 percent in 2003-2008 (Figure 6); this increased to 83 percent in the 2009-2014 reporting periods (Figure 7). The average NH3 concentration increased slightly from 0.010 mg/l to 0.012 mg/l (Table 5).
Figure 2 Total phosphorous concentrations in Rosedale Creek, 2003-2008
Figure 3 Total phosphorous concentrations in Rosedale Creek, 2009-2014
Figure 4 Total Kjeldahl nitrogen concentrations in Rosedale Creek, 2003-2008
Figure 5 Total Kjeldahl nitrogen concentrations in Rosedale Creek, 2009-2014
Figure 6 Ammonia concentrations is Rosedale Creek, 2003-2008
Figure 7 Ammonia Concentrations in Rosedale Creek, 2009-2014
Summary
Nutrient enrichment is a feature of Rosedale Creek. Overall average nutrient concentrations have decreased over the two reporting periods. Total Kjeldahl nitrogen remains above the PWQO for sites ROS-01 and ROS-02, whereas total phosphorous and ammonia have average concentrations below their guidelines in the second reporting period. Elevated nutrients may result in nutrient loading downstream. High nutrient concentrations can help stimulate the growth of algae blooms and other aquatic vegetation in a waterbody and deplete oxygen levels as the vegetation dies off. Best management practices such as an enhanced shoreline buffer, preventing the use of fertilizers and restricting cattle access can help to reduce nutrient enrichment in Rosedale Creek.
E. Coli
E. coli is used as an indicator of bacterial pollution from human or animal waste; in elevated concentrations it can pose a risk to human health. The PWQO of 100 colony forming units/100 millilitres (CFU/100 ml) is used. E. coli counts greater than this guideline indicate that bacterial contamination may be a problem within a waterbody.
Table 6 summarizes the geometric mean[2] for the monitored sites on Rosedale Creek and shows the proportion of samples that meet the E. coli guideline of 100 CFU/100 ml. The results of the geometric mean with respect to the guideline for the two periods, 2003-2008 and 2009- 2014, are shown in Figures 8 and 9 respectively.
Table 6 Summary of E. coli results for Rosedale Creek, 2003-2008 and 2009-2014. Highlighted values indicate the Geometric mean exceeds the guideline
ROS-01
E. coli counts at site ROS-01 indicate a slight improvement with regard to bacterial contamination. The proportion of samples below the guideline increased from 26 percent (Figure 8) to 30 percent (Figure 9). The count at the geometric mean decreased from 180 CFU/100ml in 2003-2008 to 156 CFU/100ml from 2009-2014 (Table 6). Although the count at the geometric mean decreased, the results exceeded the guideline for both reporting periods.
ROS-02
Elevated E.coli counts at site ROS-02 were a common occurrence. The proportion of samples below the guideline did increase from 36 percent (Figure 8) from 2003-2008 to 43 percent (Figure 9) from 2009-2014. The geometric mean also did decrease between the two monitoring periods from 186 CFU/100ml to 146 CFU/100ml (Table 6). Although E.coli counts did decrease, the geometric mean was above the guideline for both reporting periods.
Figure 8 Geometric mean of E.coli results in Rosedale Creek, 2003-2008
Figure 9 Geometric mean of E.coli results in Rosedale Creek, 2009-2014
Summary
Bacterial contamination is a concern on Rosedale Creek. Both sites ROS-01 and ROS-02 have exceeded the guideline for both monitoring periods. The count at the geometric mean has decreased from the 2003-2008 to the 2009-2014 reporting period. Properly maintaining septic systems, enhancing shoreline buffers and restricting cattle access can help to improve E.coli levels in Hutton Creek.
Metals
Of the metals routinely monitored in Rosedale Creek, aluminum (Al), copper (Cu) and iron (Fe) occasionally reported concentrations above their respective PWQOs. In elevated concentrations, these metals can have toxic effects on sensitive aquatic species.
Tables 7, 8 and 9 summarize metal concentrations at sites ROS-01 and ROS-02 as well as show the proportion of samples that meet guidelines. Figures 10 to 15 show metal concentrations with respect to the guidelines for the two periods of interest, 2003–2008 and 2009–2014. For Al, the PWQO is 0.075 mg/l, Cu it is 0.005 mg/l and Fe it is 0.300 mg/l.
Table 7 Summary of Aluminum results for Dales Creek from 2003-2008 and 2009-2014. Highlighted values indicate average concentrations exceed the guideline
Table 8 Summary of Copper results for Dales Creek from 2003-2008 and 2009-2014
Table 9 Summary of Iron results for Dales Creek from 2003-2008 and 2009-2014. Highlighted values indicate average concentrations exceed the guideline
ROS-01
The Al concentrations in site ROS-01 exceeded the guideline. There were no results below the guideline (Figure 10) from 2003-2008, however this did improve to 56 percent (Figure 11) of results reporting below the guideline from 2009-2014. The average concentration decreased from 1.212 mg/l to 0.204 mg/l (Table 7). Although Al has declined, the average concertation is still above the guideline.
Copper concentrations occasionally exceeded the PWQO, with 78 percent of samples below the guideline in 2003-2008 (Figure 12). The Cu concentrations increased to 84 percent of samples being below the guideline in 2009-2014 (Figure 13). The average concentration of copper marginally decreased during the two reporting periods from 0.003 mg/l to 0.002 mg/l (Table 8).
Results from ROS-01 indicated that Fe concentrations exceeded the guideline. The proportion of samples below the guideline increased from 4 percent to 80 percent (Figures 14 and 15). During the 2003-2008 reporting period Fe concentrations were well above the guideline with an average concentration of 1.480 mg/l. The average Fe concertation fell below the guideline in the 2009-2014 reporting period, with an average concertation of 0.245 mg/l (Table 9).
ROS-02
Results from ROS-02 show that Al concentrations had multiple exceedances with 6 percent of samples below the guideline in the 2003-2008 period (Figure 10). This improved to 56 percent of samples in the 2009-2014 period (Figure 11). The average concentration of Al was 0.231 mg/l from 2003-2008 and 0.099 mg/l from 2009-2014 (Table 7). Both monitoring periods had average concentrations which exceeded the guideline.
Copper concentrations have occasionally exceeded the guidelines. In the 2003-2008 period 94 percent of samples were below the guideline (Figure 14) and decreased to 84 percent of samples in the 2009–2014 period (Figure 15). The average concentrations (Table 8) decreased from 0.003 mg/l (2003–2008) to 0.001 mg/l (2009–2014).
Iron concentrations also exceeded the guideline. The proportion of samples below the guideline increased from 29 percent to 84 percent (Figures 12 and 13). The average concentration of 0.366 mg/l during the 2003-2008 reporting period exceeded the guideline. The average concentration decreased to below the guideline in the 2009-2014 reporting period with an average of 0.140 mg/l (Table 9).
Figure 10 Average aluminum concentrations in Rosedale Creek, 2003-2008
Figure 11 Average aluminum concentrations in Rosedale Creek, 2009-2014
Figure 12 Average copper concentrations in Rosedale Creek, 2003-2008
Figure 13 Average copper concentrations in Rosedale Creek, 2009-2014
Figure 14 Average iron concentrations in Rosedale Creek, 2003-2008
Figure 15 Average iron concentrations in Rosedale Creek, 2009-2014
Summary
Aluminum, copper and iron concentrations all declined from the 2003-2008 monitoring period to the 2009-2014 period. Although these metals have declined, both ROS-01 and ROS-02 have average Al concentrations that are above the guideline. Efforts should continue to be made to identify pollution sources and implement best management practices to reduce any inputs such as runoff, metal alloys, fungicides and pesticides to improve overall stream health and lessen downstream impacts.
[1] No Ontario guideline for TKN is presently available; however, waters not influenced by excessive organic inputs typically range from 0.100 to 0.500 mg/l, Environment Canada (1979) Water Quality Sourcebook, A Guide to Water Quality Parameters, Inland Waters Directorate, Water Quality Branch, Ottawa, Canada
[2] A type of mean or average, which indicates the central tendency or typical value of a set of numbers by using the product of their values (as opposed to the arithmetic mean which uses their sum). It is often used to summarize a variable that varies over several orders of magnitude, such as E. coli counts.
3. Riparian Conditions
Shoreline Buffer Land Cover Evaluation
The riparian or shoreline zone is that special area where the land meets the water. Well-vegetated shorelines are critically important in protecting water quality and creating healthy aquatic habitats, lakes and rivers. Natural shorelines intercept sediments and contaminants that could impact water quality conditions and harm fish habitat in streams. Well established buffers protect the banks against erosion, improve habitat for fish by shading and cooling the water and provide protection for birds and other wildlife that feed and rear young near water. A recommended target (from Environment Canada’s Guideline: How Much Habitat is Enough?) is to maintain a minimum 30 metre wide vegetated buffer along at least 75 percent of the length of both sides of rivers, creeks and streams.
Figure 16 shows the extent of the naturally vegetated riparian zone along a 30 metre wide strip of shoreline of Rosedale Creek and its tributaries. This information is derived from a dataset developed by the RVCA’s Land Cover Classification Program through heads-up digitization of 20cm DRAPE ortho-imagery at a 1:4000 scale, which details the catchment landscape using 10 land cover classes.
Figure 16 Natural and other riparian land cover in the Rosedale Creek catchment
This analysis shows that the riparian buffer in the Rosedale Creek catchment is comprised of wetland (63 percent), crop and pastureland (20 percent), woodland (12 percent), settlement areas (three percent) and roads (two percent). Additional statistics for the Rosedale Creek catchment are presented in Table 10 and show that there has been very little change in shoreline cover from 2008 to 2014.
Table 10 Riparian land cover (2008 vs. 2014) in the Rosedale Creek catchment
Rosedale Creek Overbank Zone
Riparian Buffer Width Evaluation
Figure 17 demonstrates the buffer conditions of the left and right banks separately. Rosedale Creek had a buffer of greater than 30 meters along 84 percent of the right bank and 84 percent of the left bank.
Figure 17 Riparian Buffer Evaluation along Rosedale Creek
Adjacent Land Use
The RVCA’s Stream Characterization Program identifies nine different land uses beside Rosedale Creek (Figure 18). Surrounding land use is considered from the beginning to end of the survey section (100m) and up to 100m on each side of the creek. Land use outside of this area is not considered for the surveys but is nonetheless part of the subwatershed and will influence the creek. Natural areas made up 82 percent of the stream, characterized by wetlands, forest, scrubland and meadow. The remaining land use consisted of active agriculture, pasture, residential, commercial/industrial and infrastructure in the form of road crossings.
Figure 18 Land Use along Rosedale Creek
Rosedale Creek Shoreline Zone
Instream Erosion
Erosion is a normal, important stream process and may not affect actual bank stability; however, excessive erosion and deposition of sediment within a stream can have a detrimental effect on important fish and wildlife habitat. Poor bank stability can greatly contribute to the amount of sediment carried in a waterbody as well as loss of bank vegetation due to bank failure, resulting in trees falling into the stream and the potential to impact instream migration. Figure 19 shows variable erosion levels along Rosedale Creek with conditions ranging from no erosion to moderate levels of erosion.
Figure 19 Erosion along Rosedale Creek
Undercut Stream Banks
Undercut banks are a normal and natural part of stream function and can provide excellent refuge areas for fish. Figure 20 shows that Rosedale Creek had varying levels of undercut banks along the system.
Figure 20 Undercut stream banks along Rosedale Creek
Stream Shading
Grasses, shrubs and trees all contribute towards shading a stream. Shade is important in moderating stream temperature, contributing to food supply and helping with nutrient reduction within a stream. Figure 21 shows low to moderate levels of stream shading conditions along Rosedale Creek.
Figure 21 Stream shading along Rosedale Creek
Instream Woody Debris
Figure 22 shows that the majority of Rosedale Creek had low to moderate levels of instream woody debris in the form of branches and trees. Instream woody debris is important for fish and benthic invertebrate habitat, by providing refuge and feeding areas.
Figure 22 Instream woody debris along Rosedale Creek
Overhanging Trees and Branches
Figure 23 shows the system is dominated by low to moderate levels of overhanging branches and trees along Rosedale Creek. Overhanging branches and trees provide a food source, nutrients and shade which helps to moderate instream water temperatures.
Figure 23 Overhanging trees and branches along Rosedale Creek
Anthropogenic Alterations
Figure 24 shows 70 percent of Rosedale Creek remains “unaltered” with no anthropogenic alterations. Twenty eight percent of Rosedale Creek was classified as natural with minor anthropogenic changes and two percent was considered altered in the form of road crossings and areas with a reduced natural buffer.
Figure 24 Anthropogenic alterations along Rosedale Creek
Rosedale Creek Instream Aquatic Habitat
Benthic Invertebrates
Freshwater benthic invertebrates are animals without backbones that live on the stream bottom and include crustaceans such as crayfish, molluscs and immature forms of aquatic insects. Benthos represent an extremely diverse group of aquatic animals and exhibit wide ranges of responses to stressors such as organic pollutants, sediments and toxicants, which allows scientists to use them as bioindicators. As part of the Ontario Benthic Biomonitoring Network (OBBN), the RVCA has been collecting benthic invertebrates at the Matheson Drive site on Rosedale Creek since 2003. Monitoring data is analyzed for each sample site and the results are presented using the Family Biotic Index, Family Richness and percent Ephemeroptera, Plecoptera and Trichoptera.
Hilsenhoff Family Biotic Index
The Hilsenhoff Family Biotic Index (FBI) is an indicator of organic and nutrient pollution and provides an estimate of water quality conditions for each site using established pollution tolerance values for benthic invertebrates. FBI results for Rosedale Creek are separated by reporting period 2003 to 2008 and 2009 to 2014. “Very Poor” to “Fair” water quality conditions being observed at the Rosedale Creek sample location for the period from 2003 to 2014 (Fig.25) using a grading scheme developed by Conservation Authorities in Ontario for benthic invertebrates.
Figure 25 Hilsenhoff Family Biotic Index on Rosedale Creek
Family Richness
Family Richness measures the health of the community through its diversity and increases with increasing habitat diversity suitability and healthy water quality conditions. Family Richness is equivalent to the total number of benthic invertebrate families found within a sample. Rosedale Creek is reported to have “Poor” to “Good” family richness (Fig.26).
Figure 26 Family Richness in Rosedale Creek
EPT
Ephemeroptera (Mayflies), Plecoptera (Stoneflies), and Trichoptera (Caddisflies) are species considered to be very sensitive to poor water quality conditions. High abundance of these organisms is generally an indication of good water quality conditions at a sample location. During more recent sampling years the community structure has been shifting to species that are more sensitive to poor water quality conditions. As a result, the EPT indicates that Rosedale Creek is reported to have “Poor” to “Good” water quality (Fig.27) from 2003 to 2014.
Figure 27 EPT in Rosedale Creek
Conclusion
Overall Rosedale Creek aquatic habitat conditions from a benthic invertebrate perspective range from “Poor” to “Fair” from 2003 to 2014.
Habitat Complexity
Streams are naturally meandering systems and move over time; there are varying degrees of habitat complexity, depending on the creek. Examples of habitat complexity include variable habitat types such as pools and riffles as well as substrate variability and woody debris structure. A high percentage of habitat complexity (heterogeneity) typically increases the biodiversity of aquatic organisms within a system. Thirty seven percent of Rosedale Creek was considered heterogeneous, as shown in Figure 28.
Figure 28 Habitat complexity along Rosedale Creek
Instream Substrate
Diverse substrate is important for fish and benthic invertebrate habitat because some species have specific substrate requirements and for example will only reproduce on certain types of substrate. Figure 29 shows that 27 percent of the substrate observed on Rosedale Creek was dominated by clay. Overall substrate conditions were highly variable along Rosedale Creek. Figure 30 shows the dominant substrate type observed for each section surveyed along Rosedale Creek.
Figure 29 Instream substrate along Rosedale Creek
Figure 30 shows the dominant substrate type along Rosedale Creek.
Cobble and Boulder Habitat
Boulders create instream cover and back eddies for large fish to hide and/or rest out of the current. Cobble provides important spawning habitat for certain fish species like walleye and various shiner species who are an important food source for larger fish. Cobble can also provide habitat conditions for benthic invertebrates that are a key food source for many fish and wildlife species. Figure 31 shows where cobble and boulder substrate are found in Rosedale Creek.
Figure 31 Instream substrate cobble and boulder along Rosedale Creek
Instream Morphology
Pools and riffles are important habitat features for fish. Riffles are areas of agitated water and they contribute higher dissolved oxygen to the stream and act as spawning substrate for some species of fish, such as walleye. Pools provide shelter for fish and can be refuge pools in the summer if water levels drop and water temperature in the creek increases. Pools also provide important over wintering areas for fish. Runs are usually moderately shallow, with unagitated surfaces of water and areas where the thalweg (deepest part of the channel) is in the center of the channel. Figure 32 shows that Rosedale Creek is fairly uniform; 91 percent consists of runs, 9 percent riffles and 1 percent pools. Figure 33 shows where riffle habitat was observed along Rosedale Creek.
Figure 32 Instream morphology along Rosedale Creek
Figure 33 Riffle habitat locations along Rosedale Creek
Vegetation Type
Instream vegetation provides a variety of functions and is a critical component of the aquatic ecosystem. For example emergent plants along the shoreline can provide shoreline protection from wave action and important rearing habitat for species of waterfowl. Submerged plants provide habitat for fish to find shelter from predator fish while they feed. Floating plants such as water lilies shade the water and can keep temperatures cool while reducing algae growth. The dominant vegetation type recorded at thirty two percent consisted of narrow leafed emergent in the form of grasses and sedges. Rosedale Creek had high levels of diversity for instream vegetation. Figure 34 depicts the plant community structure for Rosedale Creek. Figure 35 shows the dominant vegetation type observed for each section surveyed along Rosedale Creek.
Figure 34 Vegetation type along Rosedale Creek
Figure 35 Dominant vegetation type along Rosedale Creek
Instream Vegetation Abundance
Instream vegetation is an important factor for a healthy stream ecosystem. Vegetation helps to remove contaminants from the water, contributes oxygen to the stream, and provides habitat for fish and wildlife. Too much vegetation can also be detrimental. Figure 36 demonstrates that Rosedale Creek had common and normal levels of instream vegetation for 55 percent of its length. Low, rare and no vegetation were measured at 44 percent, while extensive levels were recorded at only two percent of stream surveys.
Figure 36 Instream vegetation abundance along Rosedale Creek
Invasive Species
Invasive species can have major implications on streams and species diversity. Invasive species are one of the largest threats to ecosystems throughout Ontario and can out compete native species, having negative effects on local wildlife, fish and plant populations. One hundred percent of the sections surveyed along Rosedale Creek had invasive species (Figure 37). The invasive species observed in Rosedale Creek were European frogbit, purple loosestrife, glossy and common buckthorn, poison/wild parsnip, rusty crayfish, banded mystery snail, honey suckle, Eurasian milfoil and Manitoba maple. Figure 38 shows the frequency of the invasive species observed along Rosedale Creek.
Figure 37 Invasive species along Rosedale Creek
Figure 38 Frequency of the invasive species observed along Rosedale Creek
Water Chemistry
During the stream characterization survey, a YSI probe is used to collect water chemistry information. Dissolved oxygen, conductivity and pH are measured at the start and end of each section.
Dissolved Oxygen
Dissolved oxygen is a measure of the amount of oxygen dissolved in water. The Canadian Environmental Quality Guidelines of the Canadian Council of Ministers of the Environment (CCME) suggest that for the protection of aquatic life the lowest acceptable dissolved oxygen concentration should be 6 mg/L for warmwater biota and 9.5 mg/L for coldwater biota (CCME, 1999). Figure 39 shows that the dissolved oxygen in Rosedale Creek was within the threshold for warmwater biota in most reaches of the system, however areas near the Rideau River and the upper headwaters were below the warmwater threshold. The average dissolved oxygen levels observed within the main stem of Rosedale Creek was 8. 08 mg/L which is within the recommended levels for warmwater biota.
Figure 39 Dissolved oxygen ranges in Rosedale Creek
Conductivity
Conductivity in streams is primarily influenced by the geology of the surrounding environment, but can vary drastically as a function of surface water runoff. Currently there are no CCME guideline standards for stream conductivity; however readings which are outside the normal range observed within the system are often an indication of unmitigated discharge and/or stormwater input. The average conductivity observed within the main stem of Rosedale Creek was 321.1 µs/cm. Figure 40 shows the conductivity readings for Rosedale Creek.
Figure 40 Specific conductivity ranges in Rosedale Creek
pH
Based on the PWQO for pH, a range of 6.5 to 8.5 should be maintained for the protection of aquatic life. Average pH values for Rosedale Creek averaged 7.94 thereby meeting the provincial standard (Figure 41).
Figure 41 pH ranges in Rosedale Creek
Thermal Regime
Many factors can influence fluctuations in stream temperature, including springs, tributaries, precipitation runoff, discharge pipes and stream shading from riparian vegetation. Water temperature is used along with the maximum air temperature (using the Stoneman and Jones method) to classify a watercourse as either warm water, cool water or cold water. Figure 42 shows where the thermal sampling sites were located along Rosedale Creek. Analysis of the data collected indicates that Rosedale Creek is classified as a cool water system with warm water reaches (Figure 43).
Figure 42 Temperature logger locations on Rosedale Creek
Figure 43 Temperature logger data for three sites on Rosedale Creek
Each point on the graph represents a temperature that meets the following criteria:
- Sampling dates between July 1st and September 7th
- Sampling date is preceded by two consecutive days above 24.5 °C, with no rain
- Water temperatures are collected at 4pm
- Air temperature is recorded as the max temperature for that day
Groundwater
Groundwater discharge areas can influence stream temperature, contribute nutrients, and provide important stream habitat for fish and other biota. During stream surveys, indicators of groundwater discharge are noted when observed. Indicators include: springs/seeps, watercress, iron staining, significant temperature change and rainbow mineral film. Figure 44 shows areas where one or more of the above groundwater indicators were observed during stream surveys and headwater assessments.
Figure 44 Groundwater indicators observed in the Rosedale Creek catchment
Headwaters Drainage Features Assessment
The RVCA Stream Characterization program assessed Headwater Drainage Features for the Middle Rosedale subwatershed in 2014. This protocol measures zero, first and second order headwater drainage features (HDF). It is a rapid assessment method characterizing the amount of water, sediment transport, and storage capacity within headwater drainage features (HDF). RVCA is working with other Conservation Authorities and the Ministry of Natural Resources and Forestry to implement the protocol with the goal of providing standard datasets to support science development and monitoring of headwater drainage features. An HDF is a depression in the land that conveys surface flow. Additionally, this module provides a means of characterizing the connectivity, form and unique features associated with each HDF (OSAP Protocol, 2013). In 2014 the program sampled 18 sites at road crossings in the Rosedale Creek catchment area (Figure 45).

Figure 45 Locations of the headwater sampling sites in the Rosedale Creek catchment
Spring photo of a headwater sample site in the Rosedale Creek catchment located on Matheson Drive
Feature Type
The headwater sampling protocol assesses the feature type in order to understand the function of each feature. The evaluation includes the following classifications: defined natural channel, channelized or constrained, multi-thread, no defined feature, tiled, wetland, swale, roadside ditch and pond outlet. By assessing the values associated with the headwater drainage features in the catchment area we can understand the ecosystem services that they provide to the watershed in the form of hydrology, sediment transport, and aquatic and terrestrial functions. The Rosedale Creek catchment is dominated by wetland and natural headwater drainage features. Two features were classified as having been channelized and one feature was identified as roadside drainage features. Figure 46 shows the feature type of the primary feature at the sampling locations.
Figure 46 Headwater feature types in the Rosedale Creek catchment
Feature Channel Modifications
Channel modifications were assessed at each headwater drainage feature sampling location. Modifications include channelization, dredging, hardening and realignments. The majority of sampling locations for the Rosedale Creek catchment area were classified as having no channel modifications, five appeared to have been historically dredged and one was classified as having an online pond. Figure 47 shows the channel modifications observed at the sampling locations for Rosedale Creek.
Figure 47 Headwater feature channel modifications in the Rosedale Creek catchment
Headwater Feature Vegetation
Headwater feature vegetation evaluates the type of vegetation that is found within the drainage feature. The type of vegetated within the channel influences the aquatic and terrestrial ecosystem values that the feature provides. For some types of headwater features the vegetation within the feature plays a very important role in flow and sediment movement and provides wildlife habitat. The following classifications are evaluated no vegetation, lawn, wetland, meadow, scrubland and forest. The features assessed in the Rosedale Creek catchment were classified being dominated by wetland. Two features were classified as meadow, one as lawn and six were classified as having no vegetation within the feature. Figure 48 depicts the dominant vegetation observed at the sampled headwater sites in the Rosedale Creek catchment.
Figure 48 Headwater feature vegetation types in the Rosedale Creek catchment
Headwater Feature Riparian Vegetation
Headwater riparian vegetation evaluates the type of vegetation that is found along the adjacent lands of a headwater drainage feature. The type of vegetation within the riparian corridor influences the aquatic and terrestrial ecosystem values that the feature provides to the watershed. The sample locations in Rosedale Creek were dominated by natural vegetation in the form of meadow, scrubland, forest and wetland vegetation. Figure 49. Depicts the type of riparian vegetation observed at the sampled headwater sites in the Rosedale Creek catchment.
Figure 49 Headwater feature riparian vegetation types in the Rosedale Creek catchment
Headwater Feature Sediment Deposition
Assessing the amount of recent sediment deposited in a channel provides an index of the degree to which the feature could be transporting sediment to downstream reaches (OSAP, 2013). Evidence of excessive sediment deposition might indicate the requirement to follow up with more detailed targeted assessments upstream of the site location to identify potential best management practices to be implemented. Conditions ranged from no deposition observed to extensive deposition recorded. Figure 50 depicts the degree of sediment deposition observed at the sampled headwater sites in the Rosedale Creek catchment.
Figure 50 Headwater feature sediment deposition in the Rosedale Creek catchment
Headwater Feature Upstream Roughness
Feature roughness will provide a measure of the amount of materials within the bankfull channel that could slow down the velocity of water flowing within the headwater feature (OSAP, 2013). Materials on the channel bottom that provide roughness include vegetation, woody debris and boulders/cobble substrates. Roughness can provide benefits in mitigating downstream erosion on the headwater drainage feature and the receiving watercourse by reducing velocities. Roughness also provides important habitat conditions to aquatic organisms. The sample locations in the Rosedale Creek catchment area ranged from minimal to high roughness conditions. Figure 51 shows the feature roughness conditions at the sampling locations in the Rosedale Creek catchment.
Figure 51 Headwater feature roughness in the Rosedale Creek catchment
Fish Community
The Rosedale Creek catchment is classified as a mixed community of warm and cool water recreational and baitfish fishery with 25 species observed. Table 11 lists those species observed in the catchment (Source: MNR/RVCA). Figure 52 shows the sampling locations along Rosedale Creek.
Figure 52 Rosedale Creek fish community
Table 11 Fish species observed in Rosedale Creek
Weighing and identifying fish on Rosedale Creek
Migratory Obstructions
It is important to know locations of migratory obstructions because these can prevent fish from accessing important spawning and rearing habitat. Migratory obstructions can be natural or manmade, and they can be permanent or seasonal. Figure 53 shows that Rosedale Creek had multiple beaver dams and one debris dam at the time of the survey in 2014. In addition one weir and one natural grade barrier was identified in the Rosedale Creek catchment.
Figure 53 Migratory obstructions along Rosedale Creek
Riparian Restoration
Figure 54 depicts the location of riparian restoration opportunities as a result of observations made during the stream survey and headwater drainage feature assessments.
Figure 54 Riparian restoration opportunities along Rosedale Creek
4. Land Cover
Land cover and any change in coverage that has occurred over a six year period is summarized for the Rosedale Creek catchment using spatially continuous vector data representing the catchment during the spring of 2008 and 2014. This dataset was developed by the RVCA through heads-up digitization of 20cm DRAPE ortho-imagery at a 1:4000 scale and details the surrounding landscape using 10 land cover classes.
As shown in Table 12, the dominant land cover type in the catchment through 2008 and 2014 was wetland along with crop and pastureland and woodland.
Table 12 Land cover (2008 vs. 2014) in the Rosedale Creek catchment
* Does not include treed swamps ** Includes treed swamps
From 2008 to 2014, there was an overall change of 143 hectares from one land cover class to another. The major land cover change in the Rosedale Creek catchment is a result of the conversion of woodland to crop and pastureland. A slightly smaller proportion of change is also associated with crop and pastureland (i.e., previously cultivated areas/fallow fields) emerging as young woodland (i.e., regenerative and/or plantation) (see Figure 55 for the location of the major changes). Another driving force identified as a factor of change is the conversion of crop and pastureland and woodland to settlement.
Figure 55 Dominant land cover change in the Rosedale Creek catchment (2014)
Table 13 shows the type of land cover change that has taken place between land cover classes/types from 2008 to 2014. Overall, the net area of woodland change (loss) is relatively small at 34 hectares relative to the remaining area of woodland in the catchment (as of 2014). Similarly, the net area of crop and pastureland change (loss) is very small at two hectares relative to the remaining area of crop and pastureland in the catchment (as of 2014). However, the net area of settlement change (gain) is greater (at 29 hectares) relative to the remaining area of settlement in the catchment (as of 2014).
Table 13 Land cover change in the Rosedale Creek catchment (2008 to 2014)
Woodland Cover
In the Environment Canada Guideline (Third Edition) entitled “How Much Habitat Is Enough?” (hereafter referred to as the “Guideline”) the opening narrative under the Forest Habitat Guidelines section states that prior to European settlement, forest was the predominant habitat in the Mixedwood Plains ecozone. The remnants of this once vast forest now exist in a fragmented state in many areas (including the Rideau Valley watershed) with woodland patches of various sizes distributed across the settled landscape along with higher levels of forest cover associated with features such as the Frontenac Axis (within the on-Shield areas of the Rideau Lakes and Tay River subwatersheds). The forest legacy, in terms of the many types of wildlife species found, overall species richness, ecological functions provided and ecosystem complexity is still evident in the patches and regional forest matrices (found in the Middle Rideau subwatershed and elsewhere in the Rideau Valley watershed). These ecological features are in addition to other influences which forests have on water quality and stream hydrology including reducing soil erosion, producing oxygen, storing carbon along with many other ecological services that are essential not only for wildlife but for human well-being.
The Guideline also notes that forests provide a great many habitat niches that are in turn occupied by a great diversity of plant and animal species. They provide food, water and shelter for these species - whether they are breeding and resident locally or using forest cover to help them move across the landscape. This diversity of species includes many that are considered to be species at risk. Furthermore, from a wildlife perspective, there is increasing evidence that the total forest cover in a given area is a major predictor of the persistence and size of bird populations, and it is possible or perhaps likely that this pattern extends to other flora and fauna groups. The overall effect of a decrease in forest cover on birds in fragmented landscapes is that certain species disappear and many of the remaining ones become rare, or fail to reproduce, while species adapted to more open and successional habitats, as well as those that are more tolerant to human-induced disturbances in general, are able to persist and in some cases thrive. Species with specialized-habitat requirements are most likely to be adversely affected. The overall pattern of distribution of forest cover, the shape, area and juxtaposition of remaining forest patches and the quality of forest cover also play major roles in determining how valuable forests will be to wildlife and people alike.
The current science generally supports minimum forest habitat requirements between 30 and 50 percent, with some limited evidence that the upper limit may be even higher, depending on the organism/species phenomenon under investigation or land-use/resource management planning regime being considered/used.
As shown in Figure 56, 30 percent of the Rosedale Creek catchment contains 1696 hectares of upland forest and 259 hectares of lowland forest (treed swamps) versus the 34 percent of woodland cover in the Middle Rideau subwatershed. This is the same as the 30 percent of forest cover that is identified as the minimum threshold required to sustain forest birds according to the Guideline and which may only support less than one half of potential species richness and marginally healthy aquatic systems. When forest cover drops below 30 percent, forest birds tend to disappear as breeders across the landscape.
Figure 56 Woodland cover and forest interior (2014)
Woodland (Patch) Size
According to the Ministry of Natural Resources’ Natural Heritage Reference Manual (Second Edition), larger woodlands are more likely to contain a greater diversity of plant and animal species and communities than smaller woodlands and have a greater relative importance for mobile animal species such as forest birds.
Bigger forests often provide a different type of habitat. Many forest birds breed far more successfully in larger forests than they do in smaller woodlots and some rely heavily on forest interior conditions. Populations are often healthier in regions with more forest cover and where forest fragments are grouped closely together or connected by corridors of natural habitat. Small forests support small numbers of wildlife. Some species are “area-sensitive” and tend not to inhabit small woodlands, regardless of forest interior conditions. Fragmented habitat also isolates local populations, especially small mammals, amphibians and reptiles with limited mobility. This reduces the healthy mixing of genetic traits that helps populations survive over the long run (Conserving the Forest Interior. Ontario Extension Notes, 2000).
The Environment Canada Guideline also notes that for forest plants that do not disperse broadly or quickly, preservation of some relatively undisturbed large forest patches is needed to sustain them because of their restricted dispersal abilities and specialized habitat requirements and to ensure continued seed or propagation sources for restored or regenerating areas nearby.
The Natural Heritage Reference Manual continues by stating that a larger size also allows woodlands to support more resilient nutrient cycles and food webs and to be big enough to permit different and important successional stages to co-exist. Small, isolated woodlands are more susceptible to the effects of blowdown, drought, disease, insect infestations, and invasions by predators and non-indigenous plants. It is also known that the viability of woodland wildlife depends not only on the characteristics of the woodland in which they reside, but also on the characteristics of the surrounding landscape where the woodland is situated. Additionally, the percentage of forest cover in the surrounding landscape, the presence of ecological barriers such as roads, the ability of various species to cross the matrix surrounding the woodland and the proximity of adjacent habitats interact with woodland size in influencing the species assemblage within a woodland.
In the Rosedale Creek catchment (in 2014), 89 (38 percent) of the 231 woodland patches are very small, being less than one hectare in size. Another 109 (47 percent) of the woodland patches ranging from one to less than 20 hectares in size tend to be dominated by edge-tolerant bird species. The remaining 33 (15 percent of) woodland patches range between 21 and 104 hectares in size. Thirty-two of these patches contain woodland between 20 and 100 hectares and may support a few area-sensitive species and some edge intolerant species, but will be dominated by edge tolerant species.
Conversely, one (one percent) of the 231 woodland patches in the drainage area exceed the 100 plus hectare size needed to support most forest dependent, area sensitive birds and is large enough to support approximately 60 percent of edge-intolerant species. No patch tops 200 hectares, which according to the Environment Canada Guideline will support 80 percent of edge-intolerant forest bird species (including most area sensitive species) that prefer interior forest habitat conditions.
Table 14 presents a comparison of woodland patch size in 2008 and 2014 along with any changes that have occurred over that time. A decrease (of 29 ha) has been observed in the overall woodland patch area between the two reporting periods with most change occurring in the larger woodland patches in the catchment.
Table 14 Woodland patches in the Rosedale Creek catchment (2008 and 2014)
*Includes treed swamps
Forest Interior
The forest interior is habitat deep within woodlands. It is a sheltered, secluded environment away from the influence of forest edges and open habitats. Some people call it the “core” or the “heart” of a woodland. The presence of forest interior is a good sign of woodland health, and is directly related to the woodland’s size and shape. Large woodlands with round or square outlines have the greatest amount of forest interior. Small, narrow woodlands may have no forest interior conditions at all. Forest interior habitat is a remnant natural environment, reminiscent of the extensive, continuous forests of the past. This increasingly rare forest habitat is now a refuge for certain forest-dependent wildlife; they simply must have it to survive and thrive in a fragmented forest landscape (Conserving the Forest Interior. Ontario Extension Notes, 2000).
The Natural Heritage Reference Manual states that woodland interior habitat is usually defined as habitat more than 100 metres from the edge of the woodland and provides for relative seclusion from outside influences along with a moister, more sheltered and productive forest habitat for certain area sensitive species. Woodlands with interior habitat have centres that are more clearly buffered against the edge effects of agricultural activities or more harmful urban activities than those without.
In the Rosedale Creek catchment (in 2014), the 231 woodland patches contain 67 forest interior patches (Figure 56) that occupy three percent (183 ha.) of the catchment land area (which is less than the five percent of interior forest in the Middle Rideau Subwatershed). This is below the ten percent figure referred to in the Environment Canada Guideline that is considered to be the minimum threshold for supporting edge intolerant bird species and other forest dwelling species in the landscape.
Most patches (58) have less than 10 hectares of interior forest, 44 of which have small areas of interior forest habitat less than one hectare in size. The remaining nine patches contain interior forest ranging between 10 and 24 hectares in area.
Between 2008 and 2014, there has been a change in the number of woodland patches containing smaller areas of interior habitat (Table 15). For example, there has been an increase of 25 woodlands containing less than one hectare of interior forest over this period and five woodlands with one to 10 hectares of interior habitat. At the same time, there has been a reported loss of 27 hectares of interior forest habitat in the catchment, which appears to have occurred as a result of the loss of interior forest habitat in the largest woodland patches.
Table 15 Woodland interior in the Rosedale Creek catchment (2008 and 2014)
Wetland Cover
Wetlands are habitats forming the interface between aquatic and terrestrial systems. They are among the most productive and biologically diverse habitats on the planet. By the 1980s, according to the Natural Heritage Reference Manual, 68 percent of the original wetlands south of the Precambrian Shield in Ontario had been lost through encroachment, land clearance, drainage and filling.
Wetlands perform a number of important ecological and hydrological functions and provide an array of social and economic benefits that society values. Maintaining wetland cover in a watershed provides many ecological, economic, hydrological and social benefits that are listed in the Reference Manual and which may include:
- contributing to the stabilization of shorelines and to the reduction of erosion damage through the mitigation of water flow and soil binding by plant roots
- mitigating surface water flow by storing water during periods of peak flow (such as spring snowmelt and heavy rainfall events) and releasing water during periods of low flow (this mitigation of water flow also contributes to a reduction of flood damage)
- contributing to an improved water quality through the trapping of sediments, the removal and/or retention of excess nutrients, the immobilization and/or degradation of contaminants and the removal of bacteria
- providing renewable harvesting of timber, fuel wood, fish, wildlife and wild rice
- contributing to a stable, long-term water supply in areas of groundwater recharge and discharge
- providing a high diversity of habitats that support a wide variety of plants and animals
- acting as “carbon sinks” making a significant contribution to carbon storage
- providing opportunities for recreation, education, research and tourism
Historically, the overall wetland coverage within the Great Lakes basin exceeded 10 percent, but there was significant variability among watersheds and jurisdictions, as stated in the Environment Canada Guideline. In the Rideau Valley Watershed, it has been estimated that pre-settlement wetland cover averaged 35 percent using information provided by Ducks Unlimited Canada (2010) versus the 21 percent of wetland cover existing in 2014 derived from DRAPE imagery analysis.
Using the same dataset, it is estimated that pre-settlement (historic) wetland cover averaged 32 percent in the Middle Rideau subwatershed versus the 27 percent of cover existing in 2014. This decline in wetland cover is also evident in the Rosedale Creek catchment (as seen in Figure 57) where there has been a one percent decrease in the area of wetland cover from pre-settlement times to the present (as summarized in Table 16).
Figure 57 Wetland cover in the Middle Rideau subwatershed and Rosedale Creek catchment (Historic to 2014)
While there has been a reported decrease in wetland cover in the Rosedale Creek catchment from pre-settlement times, the remaining wetland cover in 2014 remains above the ecological thresholds cited in the Environment Canada Guideline. Nonetheless, in order to maintain critical hydrological, ecological functions along with related recreational and economic benefits provided by these wetland habitats in the catchment, a “no net loss” of currently existing wetlands should be employed to ensure the continued provision of tangible benefits accruing from them for landowners and surrounding communities.
Table 16 Wetland cover in the Middle Rideau subwatershed and Rosedale Creek catchment (Historic to 2014)
5. Stewardship and Protection
The RVCA and its partners are working to protect and enhance environmental conditions in the Middle Rideau Subwatershed. Figure 58 shows the location of all stewardship projects completed in the Rosedale Creek catchment along with sites identified for potential shoreline restoration.
Rural Clean Water Projects
From 2009 to 2014, two septic system replacements, one well decommissioning, one well replacement, one well upgrade and one livestock fencing project were completed. Between 2003 and 2008, two septic system replacements, one well upgrade, one livestock fencing project and one fuel storage and handling facility were constructed along with one septic system replacement and one manure storage facility prior to 2003. Total value of all 13 projects is $99,224 with $45,415 of that amount funded through grant dollars from the RVCA.
Figure 58 Stewardship and potential restoration locations
Tree Planting Projects
The location of RVCA Tree Planting Program projects is shown in Figure 58. From 2009 to 2014, 13,100 trees were planted at five sites. Between 2003 and 2008, 500 trees were planted at one site and prior to 2003, 62,210 trees were planted at 11 sites, resulting in the reforestation of 40 hectares. Total value of all 17 projects is $222,963 with $65,627 of that amount coming from various fundraising sources.
Valley, Stream, Wetland and Hazard Land Regulation
The Rosedale Creek catchment covers 64 square kilometres with 16.6 square kilometres (or 26 percent) of the drainage area being within the regulation limit of Ontario Regulation 174/06 (Figure 59), giving protection to wetland areas and river or stream valleys that are affected by flooding and erosion hazards.
Wetlands occupy 23.1 sq. km. (or 36 percent) of the catchment. Of these wetlands, 10.5 sq. km (or 45 percent) are designated as provincially significant and included within the RVCA regulation limit. This leaves the remaining 12.6 sq. km (or 55 percent) of wetlands in the catchment outside the regulated area limit.
Of the 90.6 kilometres of stream in the catchment, regulation limit mapping has been plotted along 22.3 kilometers of streams (representing 25 percent of all streams in the catchment). Some of these regulated watercourses (14.8 km or 16 percent of all streams) flow through regulated wetlands; the remaining 7.4 km (or 33 percent) of regulated streams are located outside of those wetlands. Plotting of the regulation limit on the remaining 68.3 km (or 75 percent) of streams requires identification of flood and erosion hazards and valley systems.
Within the regulation limit, “development” and “site alteration” require RVCA permission. The “alteration to waterways” provision of Ontario Regulation 174/06 applies to all watercourses.
Figure 59 RVCA regulation limits
Vulnerable Drinking Water Areas
The Rosedale Creek drainage catchment is considered to have a Highly Vulnerable Aquifer. This means that the nature of the overburden (thin soils, fractured bedrock) does not provide a high level of protection for the underlying groundwater making the aquifer more vulnerable to contaminants released on the surface. The Mississippi-Rideau Source Protection Plan includes policies that focus on the protection of groundwater region-wide due to the fact that most of the region, which encompasses the Mississippi and Rideau watersheds, is considered Highly Vulnerable Aquifer. For detailed maps and policies that have been developed to protect drinking water sources, please go to the Mississippi-Rideau Source Protection Region website at www.mrsourcewater.ca to view the Mississippi-Rideau Source Protection Plan.
6. Challenges/Issues
Water Quality
- Surface water quality along Rosedale Creek is “Fair” as determined by surface water chemistry data. Occasional exceedances of nutrients, E.coli and metals contributed to the rating
- Instream (biological) water quality conditions at the Rosedale Creek sample location range from “Very Poor” to “Fair” from 2003 to 2014 (using a grading scheme developed by Ontario Conservation Authorities in Ontario for benthic invertebrates) with an overall benthic invertebrate water quality rating of “Very Poor” to “Fair” determined for this period
Shorelines
- Emerald ash borer poses a significant threat to the ecology of the subwatershed, given the prominence of ash trees along shorelines and in riparian and wetland areas. Many tree stands are predominantly ash and with their anticipated loss, it is unclear what will replace them and the overall effect of their collective demise on the physical and natural functions/values they provide for erosion, water quality and fish and wildlife habitat protection
Land Cover
- The catchment contains 1241 ha of unevaluated wetland (occupying 19 percent of its total area) that provides many important social, hydrological, biological and ecological functions/services. Although not under imminent threat from development activity, they do remain vulnerable to drainage and land clearing activities in the absence of any regulatory and planning controls that would otherwise protect them
7. Opportunities/Actions
Water Quality
- Investigate the source of possible pollutants along Rosedale Creek and consider implementing measures to reduce nutrient and bacterial loadings
- Implement agricultural and residential best management practices to address the occasional exceedances of nutrient concentrations, high bacteria counts and metal concentrations on Rosedale Creek by restricting livestock access to the creek, limiting the use of fertilizers and pesticide applications and improving or maintaining a shoreline buffer
- Continue to offer the suite of water quality improvement projects provided by the Rideau Valley Rural Clean Water Program to landowners
- Continue to protect Rosedale Creek and its tributaries through implementation of municipal and agency land use planning and development policies and practices
Shorelines/Headwaters
- Continue to promote the Rideau Valley Shoreline Naturalization and Tree Planting Programs to landowners
- RVCA and the Township of Montague are to continue educating landowners about the value and importance of headwater drainage features, natural shorelines and waterfront property best management practices with respect to shoreline use and development, septic system installation and maintenance and shoreline vegetation retention and enhancement
- Protect the riparian buffer along the shoreline of Rosedale Creek and other catchment streams (headwaters) during the development approvals process through adherence to and enforcement of municipal land-use policies and zoning standards
- Target shoreline restoration at sites identified in this report (shown as “Other riparian land cover” in Figure 16 and “Potential Riparian/Shoreline Restoration” in Figure 54) and explore other restoration and enhancement opportunities along Rosedale Creek and its tributaries
Development
- Collectively work with approval authorities (Township of Montague, Conservation Authority) to consistently implement current land use planning and development policies for water quality and shoreline protection adjacent to Rosedale Creek and other catchment streams (e.g., a minimum 30 metre development setback from water)
- Explore ways and means to more effectively enforce and implement conditions of land-use planning and development approval to achieve net environmental gains (particularly with respect to rehabilitating or protecting naturally vegetated shorelines and water quality)
- Municipalities and agencies are encouraged to strengthen natural heritage and water resources official plan policies and zoning provisions (water setbacks, frontage and naturalized shorelines and wetland protection) where deemed appropriate
- Utilize RVCA subwatershed and catchment reports to help develop/revise official plan policies to protect surface water resources and the natural environment (including woodlands, wetlands and shoreline cover)
- Consider establishing RVCA regulations limits to protect additional wetlands
Full Catchment Report
Middle Rideau Subwatershed Report 2015
RIDEAU - MERRICKVILLE CATCHMENT
The RVCA produces individual reports for ten catchments in the Middle Rideau subwatershed. Using data collected and analysed by the RVCA through its watershed monitoring and land cover classification programs, surface water quality conditions are reported for the Rideau River along with a summary of environmental conditions for the surrounding countryside every six years.
This information is used to better understand the effects of human activity on our water resources, allows us to better track environmental change over time and helps focus watershed management actions where they are needed the most to help sustain the ecosystem services (cultural, aesthetic and recreational values; provisioning of food, fuel and clean water; regulation of erosion/natural hazard protection and water purification; supporting nutrient/water cycling and habitat provision) provided by the catchment’s lands and forests and waters (Millennium Ecosystem Assessment 2005).
The following pages of this report are a compilation of that work and contain information on surface water quality, riparian conditions, land cover, stewardship activity and hazard land and water resources protection.
1. Catchment Facts
General Geography
- The Rideau River flows through the heart of the Middle Rideau and is a focal point for residents and visitors to the area. It extends from the outlet of Lower Rideau Lake at Poonamalie (where there is one dam and one lock) to Burritts Rapids (where there is also a dam and lock), at which point it enters the Lower Rideau on its way to Rideau Falls. The Rideau River is a designated Canadian Heritage River and an integral part of the Rideau Canal National Historic Site of Canada that is a UNESCO World Heritage Site and a major tourist attraction. Smiths Falls, Merrickville and Burritts Rapids are the main settlements in the subwatershed
- The Village of Merrickville-Wolford is called the Jewel of the Rideau. It occupies the area of the catchment to the south of the Rideau River and is characterized by a diverse landscape. The largest centre of the community is Merrickville which is known for its boutiques and local craft people and artists. It is considered to be one of the best preserved 19th century villages in Ontario with more than 100 historic buildings designated. There are active farmlands, large wetlands, extensive woodlands, and cleared areas where full time farming has been abandoned because of marginal soil capability. The Rideau Canal National Historic Site of Canada has had a significant impact on the historic development of the Village, and continues to be an important influence on its role as an arts community which draws visitors from a large surrounding area as well as tourists visiting the National Capital Region. Within the Village, there are four lock stations, Edmunds, Kilmarnock, Merrickville, and Upper and Lower Nicholsons which provide places for public access to the Canal, passive recreation and presentation of the Canal story. The Easton-Kilmarnock marshes are among the most significant wetlands along the Canal, and the section of Canal from Merrickville to Burritts Rapids is a particularly scenic and historic area
- Parks Canada staff manage water levels for recreational purposes along the Rideau Canal/Waterway that flows by the catchment, ensuring 1.5 metres of draft during the navigation season. In this managed system, water levels on the Rideau Canal are manipulated by operation of numerous dams. In the Middle Rideau subwatershed, Parks Canada staff operate 9 dam and lock complexes with 13 locks for a fall of 36.2 metres over 35.6 kilometres. Water levels are maintained as close as possible to set objectives through the May to October navigation season. The levels are lowered through the rest of October and into November and held at the winter levels until the spring freshet in late March or early April naturally increases inflows to the system. To reduce the impact of the higher flows in the spring, the amount of snow water equivalent, forecast rain, ice cover, flows and levels are assessed and the dams in the Middle Rideau reach are operated accordingly to quickly pass as much water as possible. In late April and early May, the dams are gradually closed and water levels are brought up to be ready, once again, for the navigation season
Physical Geography
- All of the Rideau-Merrickville catchment and the rest of the Middle Rideau subwatershed primarily resides within the Smith Falls Limestone Plain. This catchment is primarily underlain by Oxford Formation dolostone. The bedrock in the upper part of the catchment is mainly overlain by an array of glacial till, clay, and river deposits whereas most of the remainder of the catchment is overlain by a thin veneer of glacial sediment, referred to as ‘drift’ that is generally less than a metre in thickness. A geologic fault likely cuts through the northern western part of the catchment and the topography is generally flat
- Fifty-three percent of the catchment lies within the Village of Merrickville-Wolford, 34 percent in the Township of Montague, seven percent in the Township of Elizabethtown-Kitley, three percent in the City of Ottawa, one percent in the Municipality of North Grenville, one percent in the Township of Rideau Lakes and one percent in the Town of Smiths Falls
- Rideau-Merrickville catchment drainage area is 116 square kilometres and occupies about 14 percent of the Middle Rideau subwatershed and three percent of the Rideau Valley watershed
Vulnerable Areas
- Lands along the Rideau River in the catchment are subject to flooding during the regional (100 year) storm. Flood elevations for this section of the Rideau River range from 104.4 metres above mean sea level (masl) downstream of the Edmonds Lock, to 103.7 masl below the Kilmarnock Lock, to 103.1 masl upriver of Mill Street in Merrickville, to 89.6 masl at the Andrewsville Bridge, to 89.2 masl upstream of the Burritts Rapids dam
- The Assessment Report developed under the Ontario Clean Water Act identifies the upper bedrock aquifer underlying the majority of the catchment area as a Highly Vulnerable Aquifer, although, where sediments are thicker in a local area, the vulnerability would be less. The northern half of the catchment contains Wellhead Protection Areas A through D for the Merrickville municipal water supply; related provincial policies apply
Development/Trends
- Montague Township’s rural riverfront within the catchment along the north shore of the Rideau River includes a significant portion of wetland (locally and provincially significant) that takes up close to half of the overall shoreline frontage and as such much of the shoreline has retained its natural setting. The remainder of the frontage is primarily residential; however, with some exceptions mostly near Smiths Falls, the very dense small lot cottage development seen elsewhere in the subwatershed does not predominate here. Montague does not have a significant historical cottage pattern of development. Without the recreational waterfront component to the extent seen along the lakes, there is a less developed tourism infrastructure, although the river is part of the Rideau Canal corridor which attracts significant through boat traffic. While natural and environmental constraints would probably preclude a large scale obtrusive waterfront development project, there is likely opportunity for additional recreational development near the water in the Township. The wetland areas provide opportunities for low impact recreational activities such as fishing, hunting and bird watching. There is very limited amount, if any, public water access in Montague Township
- Towards Merrickville, agricultural lands are more prevalent at the south end of Montague Township along the Rideau basin (with the best land from Smiths Falls to Kilmarnock along the Highway 43 corridor) and there is some residential estate development along the river with a mixture of historic stone houses and newer development during the last few decades. These tend to be on larger lots with increased waterbody setbacks. There have been a number of severances in these areas in recent years and shoreline protection has typically been a condition of development
- Merrickville and Eastons Corners are the main settlements within the Village of Merrickville-Wolford portion of the catchment. Here, land use is predominately Rural and Agriculture with some areas of Wetland. A few private laneways with densely developed, undersized lots are found elsewhere along the Rideau River. Within the remainder of the catchment, land use is predominately Rural with some Natural Heritage-Provincially Significant Wetland designations
Conditions at a Glance
Water Quality
- Surface chemistry water quality ratings in the Rideau River (Merrickville catchment) are “Fair” over two reporting periods (2003-2008 and 2009-2014)
- Elevated nutrient and metal concentrations from inflows of nutrients (from private septic systems, agricultural and residential surface water runoff) are an occasional feature of the Rideau River. Surface chemistry water quality conditions have declined for both sites between the two monitoring periods. Decreased nutrient and metal concentrations are needed to improve the overall health of the creek
Instream and Riparian
- In the Rideau-Merrickville catchment, the riparian buffer (30 m. wide strip along the shoreline of the Rideau River and its tributaries) is comprised of wetland (43 percent), crop and pastureland (26 percent), woodland (22 percent), settlement areas (six percent) and roads (three percent)
Land Cover
- Dominant land cover is crop and pastureland (37 percent), followed by woodland (28 percent), wetland (19 percent), water (seven percent), settlement areas (six percent) and roads (three percent)
- From 2008 to 2014, there was an overall change of 109 hectares (from one land cover class to another). Within the Rideau-Merrickville catchment, change is primarily associated with the transitioning of crop and pastureland to woodland and conversion to settlement along with the conversion of woodland to settlement and crop and pastureland
- Woodland cover in the catchment has decreased by 20 hectares between 2008 and 2014 and interior forest habitat has increased by five hectares
- Wetland cover has decreased by eight percent (900 ha) from pre-settlement times to the present and now occupies 19 percent of the catchment area
Other
- Approximately 720 to 760 in-use water wells with provincial records exist in this catchment. While most water wells are used for domestic water supply, several are also used for commercial, industrial, agricultural, municipal and public water supplies or monitoring
- There are several Environmental Compliance Approvals in this catchment for discharge to the environment related to municipal and private sewage works; industrial and commercial air emissions and for waste management activities.
- There are two sand and gravel pit licenses and an abandoned pit in the catchment
- There are three Permits to Take Water TTW in this catchment for the municipal well water supply in Merrickville
Catchment Care
- Seventy-four stewardship projects have been completed with assistance from the RVCA’s Rural Clean Water, Tree Planting and Shoreline Naturalization Programs (see Section 5 of this report for details)
- Rideau River surface chemistry water quality is assessed by the Ministry of the Environment and Climate Change through its Provincial Water Quality Monitoring Program. The surface water quality sites at Andrewsville and Kilmarnock are monitored by the RVCA once a month from April to November
- Well casings of the three drinking water production wells in Merrickville have been extended into the deep aquifer, resulting in a safer municipal drinking water supply
- A watershed model developed by the RVCA in 2009 was used to study the hydrologic function of wetlands in the Rideau Valley Watershed, including those found in the Rideau-Merrickville catchment
- The Township of Montague, Village of Merrickville-Wolford and the Township of Elizabethtown-Kitley have land use planning policies and zoning provisions - on water setbacks, frontage and naturalized shorelines and wetland protection - and in some instances use site plan control to implement these policies and provisions. Together with RVCA, these municipalities work with landowners on a case by case basis to enable new development while ensuring the scale is suitable on the lot, impacts on neighbours are minimized and development maximizes the watercourse setback
- Development in and adjacent to the Provincially Significant Wetlands in the catchment (Barber’s Creek Marsh, Brassils Creek, Kilmarnock Marsh, Merrickville Marsh, Merrickville Wetland, Rideau River Part 1, Rideau River Part 4, Wolford Bog Complex) are subject to Ontario Regulation 174-06 (entitled “Development, Interference with Wetlands and Alterations to Shorelines and Watercourses”) that protects the hydrologic function of the wetland and also protects landowners and their property from natural hazards (flooding, fluctuating water table, unstable soils) associated with them
- The report entitled “A Multidisciplinary, Community-Based Study of the Environmental Health of the Rideau River” was prepared by the Canadian Museum of Nature in 2001. The study’s goals were to assess the biodiversity of the Rideau River, from Smiths Falls to Ottawa, and to reconcile local needs with long-term sustainable management of its biological diversity
- Rideau Canal National Historic Site of Canada Management Plan (2005) update establishes the long term strategic direction for the management of the Rideau Canal and the Rideau Canal World Heritage Site Management Plan (2005) specifies how its world heritage values will be protected for present and future generations
- The Landscape Character Assessment Report identifying key features and visual values along the Rideau Canal was released by the Rideau Corridor Landscape Strategy Steering Committee in April 2013 and includes recommendations for future planning and management actions to protect the visual setting of the Rideau Canal from Ottawa to Kingston, including those found in the Rideau-Smiths Falls catchment
2. Surface Water Quality Conditions
Surface water quality conditions in the Rideau-Merrickville catchment are monitored by the Ministry of the Environment and Climate Change’s Provincial Water Quality Monitoring Program. The Provincial Water Quality Monitoring Program focuses on streams; data is collected for 19 parameters including nutrients (total phosphorus and total Kjeldahl nitrogen) and metals (like aluminum and lead) and additional chemical/physical parameters (such as alkalinity, pH and total suspended solids). Figure 1 shows the location of monitoring sites along the Rideau River in the catchment.
Figure 1 Water quality monitoring sites on the Rideau River in the Rideau-Merrickville Catchment
Rideau River Water Quality
Water Quality Rating
The water quality ratings for the Rideau-Merrickville catchment are “Fair” (Table 1) as determined by the CCME Water Quality Index and are largely influenced by high nutrients and elevated metal concentrations. Each parameter is evaluated against established guidelines to determine water quality conditions. Those parameters that frequently exceed guidelines are presented below. Analysis of the data has been broken into two periods (2003 to 2008 and 2009 to 2014) for the two monitoring sites located along the Rideau River (Kilmarnock and Andrewsville) to examine if conditions have changed between these periods. Table 1 shows the overall rating for the monitored surface water quality sites within the Rideau-Merrickville catchment and Table 2 outlines the Water Quality Index (WQI) scores and their corresponding ratings.
Table 1 Water Quality Index ratings for the Rideau-Merrickville Catchment
Table 2 Water Quality Index ratings and corresponding index scores (RVCA terminology, original WQI category names in brackets)
Nutrients
Total phosphorus (TP) is used as a primary indicator of excessive nutrient loading and may contribute to abundant aquatic vegetation growth and depleted dissolved oxygen levels. The Provincial Water Quality Objective (PWQO) is used as the TP Guideline and states that in rivers concentrations greater than 0.030 mg/l indicate an excessive amount of TP.
Total Kjeldahl nitrogen (TKN) is used as secondary indicator of nutrient loadings. RVCA uses a guideline of 0.500 mg/l to assess TKN[1] concentrations at the monitored site.
Tables 3 and 4 summarize average nutrient concentrations at monitored sites within the Rideau River-Merrickville catchment and show the proportion of results that meet the guidelines.
Table 3 Summary of total phosphorous results for the Rideau River, 2003-2008 and 2009-2014
Table 4 Summary of total Kjeldahl nitrogen results for the Rideau River, 2003-2008 and 2009-2014. Highlighted values indicate average concentrations that exceed the guideline
Kilmarnock Site
Total phosphorous results were occasionally elevated at site Kilmarnock; 91 percent of samples were below the guideline in the 2003-2008 period (Figure 2); this declined to 88 percent of samples in the 2009-2014 period (Figure 3). The average TP concentration decreased from 0.027 mg/l (2002- 2007) to 0.019 mg/l (2009-2014).
TKN results show that evaluated results were a regular occurrence (Figures 4 and 5); there were few samples (12 percent) below the guideline in the 2003-2008 period and this increased to 30 percent in the 2009-2014 period. The average concentration was generally elevated but did decrease from 0.647 mg/l to 0.546 mg/l (Table 4).
Andrewsville Site
Elevated TP results were an occasional occurrence at Andrewsville; 82 percent of samples were below the guideline in the 2003-2008 period (Figure 2); this increased to 93 percent of samples in the 2009-2014 period (Figure 3). The average TP concentration also decreased slightly from 0.022 mg/l (2003- 2008) to 0.019 mg/l (2009-2014).
The bulk of TKN results have exceeded the guideline (Figure 4 and 5), with 12 percent of samples below the guideline in the 2003-2008 period, increasing to 27 percent of samples below the guideline from 2009-2014. The average concentration was elevated for both monitoring periods and decreased from 0.575 mg/l to 0.542 mg/l (Table 4).
Figure 2 Total phosphorous concentrations in the Rideau River, 2003-2008
Figure 3 Total phosphorous concentrations in the Rideau River, 2009-2014
Figure 4 Total Kjeldahl nitrogen concentrations in the Rideau River, 2003-2008
Figure 5 Total Kjeldahl nitrogen concentrations in the Rideau River, 2009-2014
Summary
The data shows that nutrient enrichment is a feature of the Rideau River. Elevated nutrients may result in nutrient loading downstream. High nutrient concentrations can help stimulate the growth of algae blooms and other aquatic vegetation in a waterbody and deplete oxygen levels as the vegetation dies off. It is important to reduce human impacts wherever possible. Enhancing shoreline buffers and diverting runoff away from the river by absorbing rainfall onsite will reduce nutrient loading into the river.
Metals
Metals were only monitored for the 2003-2008 period at the Kilmarnock site and are not available for the 2009-2014 monitoring period. Metals were monitored for both monitoring periods at the Andrewsville site. Of the metals that were routinely monitored at the Kilmarnock and Andrewsville sites on the Rideau River, Aluminum (Al),) Cadmium (Cd) and Lead (Pb) were the only metals that frequently reported concentrations above the PWQO. In elevated concentrations metals can have toxic effects on sensitive aquatic species.
Tables 5, 6, 7 and 8 summarize metal concentrations at Kilmarnock and Andrewsville sites as well as show the proportion of samples that meet guidelines. Figures 6 to 11 show metal concentrations with respect to the guidelines for the two periods of interest, 2003–2008 and 2009–2014.
For Al, the PWQO is 0.075 mg/l and 0.0005 mg/l for Cd. The PWQO for Pb depends on the hardness of the water. The Rideau River at both Kilmarnock and Andrewsville site was either 60 to 120 mg/l which would make the Pb objective 0.002 or 120-180 mg/l which would make the Pb guideline 0.004.
Some Cd and Pb results have also been removed from the analysis as they have been reported as a negative concentration. These results are estimates of concentrations and when results are close to zero about half of the results will be above the average and half will be below. When they are mapped onto a concentration axis, negative results can occur.
Table 5 Aluminum concentrations in the Rideau River, 2003-2008 and 2009-2014
Table 6 Cadmium concentrations in the Rideau River, 2003-2008 and 2009-2014
Table 7 Lead concentrations for the 0.002 objective in the Rideau River, 2003-2008 and 2009-2014
Table 8 Lead concentrations for the 0.004 objective in the Rideau River, 2003-2008 and 2009-2014
Kilmarnock Site
Of the metals routinely monitored in the Rideau River at the Kilmarnock site during the 2003-2008 period, Al and Pb reported concentrations above the PWQO.
Table 6 summarizes the Al concentrations at the monitored site and show the proportion of samples (86%) are below the guideline, with an average concentration of 0.058 mg/l.
Lead concentrations were broken up in the two guidelines depending on the water hardness of the sample (0.002, Table 7 and 0.004, Table 8). There were 45 percent of samples below the 0.002 guideline. The average concentration was 0.003 mg/l which slightly exceeded the 0.002 objective. Only one sample at Kilmarnock had a 0.004 objective. This one sample was above the guideline, with a reading of 0.010 mg/l.
Andrewsville Site
The Andrewsville site on the Rideau River had Al, Cd and Pb results that exceeded the guidelines for both monitoring periods.
From 2003-2008 and 2009-2014 a majority of Al concentrations were below the guidelines (Figures 6 and 7). The percentage of samples below the guideline increased from 90 to 95 percent between the two reporting periods. Both average concentrationss were below the guideline, with 0.034 mg/l from 2003-2008, decreasing to 0.031 mg/l from 2009-2014 (Table 5).
Cadmium results exceeded the guideline for both reporting periods (Figures 8 and 9). Ther percentage of results below the guidleine was 59 percent from 2003-2008, with an average concentration of 0.0005 mg/l. Results below the guidelines increased from 2009-2014, to 21 percent, with an average conetration of 0.0008 mg/l which also slightly increased from the previous reporting period (Table 6).
Results for Pb concentrations were separated into two guidelines depending on the hardness of the water (0.002, Table 7 and 0.004 Table 8). For the 0.002 guideline there were 47 percent of results that were below the guideline with an average concentration of 0.018 mg/l (Figure 10). Results improved slightly during the second reporting period with an average concentration of 0.014 mg/l and 21 percent of samples below the guideline (Figure 11). The 0.004 guidline had fewer results; the average concentration of results was 0.005 mg/l with 50 percent of samples below the guideline (Figure 10). The average concentration increased to 0.034 mg/l with 57 percent of samples below the guideline in the second reporting period (Figure 11).
Figure 6 Summary of aluminum concentrations in the Rideau River, 2003-2008
Figure 7 Summary of aluminum concentrations in the Rideau River, 2009-2014
Figure 8 Summary of cadmium concentrations in the Rideau River, 2003-2008
Figure 9 Summary of cadmium concentrations in the Rideau River, 2009-2014
Figure 10 Summary of lead concentrations in the Rideau River, 2003-2008
Figure 11 Summary of lead concentrations in the Rideau River, 2009-2014
Summary
For the 2003-2008 and 2009-2014 monitoring periods metal concentrations were occasionally elevated. The Kilmarnock site was not sampled for metals in the 2009-2014 reporting period and no long term trend can be observed. The Andrewsville site had a decline in Al, but not in Cd or Pb. Efforts should be made to identify pollution sources and reduce any inputs (such as runoff, metal alloys, fungicides and pesticides) to improve the overall water quality and lessen downstream impacts of the river.
[1] No Ontario guideline for TKN is presently available; however, waters not influenced by excessive organic inputs typically range from 0.100 to 0.500 mg/l, Environment Canada (1979) Water Quality Sourcebook, A Guide to Water Quality Parameters, Inland Waters Directorate, Water Quality Branch, Ottawa, Canada
3. Rideau River Tributary Riparian Conditions
Shoreline Buffer Land Cover Evaluation
The riparian or shoreline zone is that special area where the land meets the water. Well-vegetated shorelines are critically important in protecting water quality and creating healthy aquatic habitats, lakes and rivers. Natural shorelines intercept sediments and contaminants that could impact water quality conditions and harm fish habitat in streams. Well established buffers protect the banks against erosion, improve habitat for fish by shading and cooling the water and provide protection for birds and other wildlife that feed and rear young near water. A recommended target (from Environment Canada’s Guideline: How Much Habitat is Enough?) is to maintain a minimum 30 metre wide vegetated buffer along at least 75 percent of the length of both sides of rivers, creeks and streams.
Figure 12 shows the extent of the naturally vegetated riparian zone along a 30 metre wide strip of shoreline of the Rideau River and its tributaries. This information is derived from a dataset developed by the RVCA’s Land Cover Classification Program through heads-up digitization of 20cm DRAPE ortho-imagery at a 1:4000 scale, which details the catchment landscape using 10 land cover classes.
Figure 12 Natural and other riparian land cover in the Rideau-Merrickville catchment
This analysis shows that the riparian buffer in the Rideau-Merrickville catchment is comprised of wetland (43 percent), crop and pastureland (26 percent), woodland (22 percent), settlement areas (six percent) and roads (three percent). Additional statistics for the Rideau-Merrickville catchment are presented in Table 9 and show that there has been very little change in shoreline cover from 2008 to 2014.
Table 9 Riparian land cover (2008 vs. 2014) in the Rideau-Merrickville catchment
Rideau River Tributary Instream Aquatic Habitat
Groundwater
Groundwater discharge areas can influence stream temperature, contribute nutrients, and provide important stream habitat for fish and other biota. During stream surveys, indicators of groundwater discharge are noted when observed. Indicators include: springs/seeps, watercress, iron staining, significant temperature change and rainbow mineral film. Figure 13 shows areas where one or more of the above groundwater indicators were observed during the headwater drainage feature assessments.
Figure 13 Groundwater indicators observed in the Rideau-Merrickville catchment
Headwaters Drainage Features Assessment
The RVCA Stream Characterization program assessed Headwater Drainage Features for the Middle Rosedale subwatershed in 2014. This protocol measures zero, first and second order headwater drainage features (HDF). It is a rapid assessment method characterizing the amount of water, sediment transport, and storage capacity within headwater drainage features (HDF). RVCA is working with other Conservation Authorities and the Ministry of Natural Resources and Forestry to implement the protocol with the goal of providing standard datasets to support science development and monitoring of headwater drainage features. An HDF is a depression in the land that conveys surface flow. Additionally, this module provides a means of characterizing the connectivity, form and unique features associated with each HDF (OSAP Protocol, 2013). In 2014 the program sampled 23 sites at road crossings in the Rideau – Merrickville catchment area (Figure 14).

Figure 14 Locations of the headwater sampling sites in the Rideau-Merrickville catchment
Spring photo of a headwater sample site in the Rideau-Merrickville catchment located on Putnam Road
Spring photo of a headwater sample site in the Rideau-Merrickville catchment located on Roses Bridge Road
Feature Type
The headwater sampling protocol assesses the feature type in order to understand the function of each feature. The evaluation includes the following classifications: defined natural channel, channelized or constrained, multi-thread, no defined feature, tiled, wetland, swale, roadside ditch and pond outlet. By assessing the values associated with the headwater drainage features in the catchment area we can understand the ecosystem services that they provide to the watershed in the form of hydrology, sediment transport, and aquatic and terrestrial functions. The Rideau-Merrickville catchment headwater drainage features had a wide variety of feature types including wetland, natural channel, channelized, roadside and swale. Figure 15 shows the feature type of the primary feature at the sampling locations.
Figure 15 Headwater feature types in the Rideau-Merrickville catchment
Headwater Feature Flow
The observed flow condition within headwater drainage features can be highly variable depending on timing relative to the spring freshet, recent rainfall, soil moisture, etc. Flow conditions are assessed in the spring and in the summer to determine if features are perennial and flow year round, if they are intermittent and dry up during the summer months or if they are ephemeral systems that do not flow regularly and generally respond to specific rainstorm events or snowmelt. Flow conditions in headwater systems can change from year to year depending on local precipitation patterns. Many of the features were not assessed in the summer due to timing constraints which resulted in the feature flow types being classified as unknown. Figure 16 shows the observed flow conditions at the sampling locations in the Rideau-Merrickville catchment.
Figure 16 Headwater feature flow conditions in the Rideau-Merrickville catchment
Feature Channel Modifications
Channel modifications were assessed at each headwater drainage feature sampling location. Modifications include channelization, dredging, hardening and realignments. The majority of sampling locations for the Rideau-Merrickville catchment area were classified as having no channel modifications and four appeared to have been historically dredged. Figure 17 shows the channel modifications observed at the sampling locations in the Rideau-Merrickville catchment.
Figure 17 Headwater feature channel modifications in the Rideau-Merrickville catchment
Headwater Feature Vegetation
Headwater feature vegetation evaluates the type of vegetation that is found within the drainage feature. The type of vegetated within the channel influences the aquatic and terrestrial ecosystem values that the feature provides. For some types of headwater features the vegetation within the feature plays a very important role in flow and sediment movement and provides wildlife habitat. The following classifications are evaluated no vegetation, lawn, wetland, meadow, scrubland and forest. The features assessed in the Rideau-Merrickville catchment were dominated by wetland and meadow vegetation within the features. One feature was classified as scrubland and one was classified as having lawn within the feature. Figure 18 depicts the dominant vegetation observed at the sampled headwater sites in the Rideau-Merrickville catchment.
Figure 18 Headwater feature vegetation types in the Rideau-Merrickville catchment
Headwater Feature Riparian Vegetation
Headwater riparian vegetation evaluates the type of vegetation that is found along the adjacent lands of a headwater drainage feature. The type of vegetation within the riparian corridor influences the aquatic and terrestrial ecosystem values that the feature provides to the watershed. The sample locations in Rideau - Merrickville were dominated by natural vegetation in the form of meadow, scrubland, forest and wetland vegetation. Figure 19 depicts the type of riparian vegetation observed at the sampled headwater sites in the Rideau-Merrickville catchment.
Figure 19 Headwater feature riparian vegetation types in the Rideau-Merrickville catchment
Headwater Feature Sediment Deposition
Assessing the amount of recent sediment deposited in a channel provides an index of the degree to which the feature could be transporting sediment to downstream reaches (OSAP, 2013). Evidence of excessive sediment deposition might indicate the requirement to follow up with more detailed targeted assessments upstream of the site location to identify potential best management practices to be implemented. Conditions ranged from no deposition observed to substantial deposition recorded. Figure 20 depicts the degree of sediment deposition observed at the sampled headwater sites in the Rideau-Merrickville catchment.
Figure 20 Headwater feature sediment deposition in the Rideau-Merrickville catchment
Headwater Feature Upstream Roughness
Feature roughness will provide a measure of the amount of materials within the bankfull channel that could slow down the velocity of water flowing within the headwater feature (OSAP, 2013). Materials on the channel bottom that provide roughness include vegetation, woody debris and boulders/cobble substrates. Roughness can provide benefits in mitigating downstream erosion on the headwater drainage feature and the receiving watercourse by reducing velocities. Roughness also provides important habitat conditions to aquatic organisms. The sample locations in the Rideau-Merrickville catchment area ranged from minimal to extreme roughness conditions. Figure 21 shows the feature roughness conditions at the sampling locations in the Rideau-Merrickville catchment.
Figure 21 Headwater feature roughness in the Rideau-Merrickville catchment
Fish Community
The Rideau-Merrickville catchment is classified as a mixed community of warm and cool water recreational and baitfish fishery with 27 species observed. Table 10 lists those species observed in the catchment (Source: MNR/RVCA). Figure 22 shows the sampling locations along the Rideau River and its tributaries.
Figure 22 Rideau-Merrickville fish sampling locations
Table 10 Fish species observed in the Rideau-Merrickville catchment
Riparian Restoration
Figure 23 depicts the location of several riparian restoration opportunities as a result of observations made during the headwater drainage feature assessments.
Figure 23 Riparian restoration opportunities along tributaries of the Rideau River
4. Land Cover
Land cover and any change in coverage that has occurred over a six year period is summarized for the Rideau-Merrickville catchment using spatially continuous vector data representing the catchment during the spring of 2008 and 2014. This dataset was developed by the RVCA through heads-up digitization of 20cm DRAPE ortho-imagery at a 1:4000 scale and details the surrounding landscape using 10 land cover classes.
As shown in Table 11, the dominant land cover types in 2008 and 2014 were crop and pastureland and wetland, followed by settlement areas and woodland.
Table 11 Land cover (2008 vs. 2014) in the Rideau-Merrickville catchment
* Does not include treed swamps ** Includes treed swamps
From 2008 to 2014, there was an overall change of 109 hectares (from one land cover class to another). Change within the Rideau-Merrickville catchment is primarily associated with the transitioning of crop and pastureland to woodland and conversion to settlement along with the conversion of woodland to settlement and crop and pastureland (see Figure 24 for the location of the major changes).
Figure 24 Dominant land cover change in the Rideau-Merrickville catchment (2014)
Table 12 shows the type of land cover change that has taken place between land cover classes/types from 2008 to 2014. Overall, the net area of crop and pastureland change (loss) is small at 31 hectares relative to the remaining area of crop and pastureland in the catchment (as of 2014), as is the change (loss) in the area of woodland (at 19 hectares) when compared to the remaining woodland (in 2014). However, the net area of settlement change (gain) is greater (at 47 hectares) relative to the remaining area of settlement in the catchment (as of 2014).
Table 12 Land cover change in the Rideau-Merrickville catchment (2008 to 2014)
Woodland Cover
In the Environment Canada Guideline (Third Edition) entitled “How Much Habitat Is Enough?” (hereafter referred to as the “Guideline”) the opening narrative under the Forest Habitat Guidelines section states that prior to European settlement, forest was the predominant habitat in the Mixedwood Plains ecozone. The remnants of this once vast forest now exist in a fragmented state in many areas (including the Rideau Valley watershed) with woodland patches of various sizes distributed across the settled landscape along with higher levels of forest cover associated with features such as the Frontenac Axis (within the on-Shield areas of the Rideau Lakes and Tay River subwatersheds). The forest legacy, in terms of the many types of wildlife species found, overall species richness, ecological functions provided and ecosystem complexity is still evident in the patches and regional forest matrices (found in the Middle Rideau subwatershed and elsewhere in the Rideau Valley watershed). These ecological features are in addition to other influences which forests have on water quality and stream hydrology including reducing soil erosion, producing oxygen, storing carbon along with many other ecological services that are essential not only for wildlife but for human well-being.
The Guideline also notes that forests provide a great many habitat niches that are in turn occupied by a great diversity of plant and animal species. They provide food, water and shelter for these species - whether they are breeding and resident locally or using forest cover to help them move across the landscape. This diversity of species includes many that are considered to be species at risk. Furthermore, from a wildlife perspective, there is increasing evidence that the total forest cover in a given area is a major predictor of the persistence and size of bird populations, and it is possible or perhaps likely that this pattern extends to other flora and fauna groups. The overall effect of a decrease in forest cover on birds in fragmented landscapes is that certain species disappear and many of the remaining ones become rare, or fail to reproduce, while species adapted to more open and successional habitats, as well as those that are more tolerant to human-induced disturbances in general, are able to persist and in some cases thrive. Species with specialized-habitat requirements are most likely to be adversely affected. The overall pattern of distribution of forest cover, the shape, area and juxtaposition of remaining forest patches and the quality of forest cover also play major roles in determining how valuable forests will be to wildlife and people alike.
The current science generally supports minimum forest habitat requirements between 30 and 50 percent, with some limited evidence that the upper limit may be even higher, depending on the organism/species phenomenon under investigation or land-use/resource management planning regime being considered/used.
As shown in Figure 25, 31 percent of the Rideau-Merrickville catchment contains 3302 hectares of upland forest and 296 hectares of lowland forest (treed swamps) versus the 34 percent of woodland cover in the Middle Rideau subwatershed. This is greater than the 30 percent of forest cover that is identified as the minimum threshold required to sustain forest birds according to the Guideline and which may only support less than one half of potential species richness and marginally healthy aquatic systems. When forest cover drops below 30 percent, forest birds tend to disappear as breeders across the landscape.
Figure 25 Woodland cover and forest interior (2014)
Woodland (Patch) Size
According to the Ministry of Natural Resources’ Natural Heritage Reference Manual (Second Edition), larger woodlands are more likely to contain a greater diversity of plant and animal species and communities than smaller woodlands and have a greater relative importance for mobile animal species such as forest birds.
Bigger forests often provide a different type of habitat. Many forest birds breed far more successfully in larger forests than they do in smaller woodlots and some rely heavily on forest interior conditions. Populations are often healthier in regions with more forest cover and where forest fragments are grouped closely together or connected by corridors of natural habitat. Small forests support small numbers of wildlife. Some species are “area-sensitive” and tend not to inhabit small woodlands, regardless of forest interior conditions. Fragmented habitat also isolates local populations, especially small mammals, amphibians and reptiles with limited mobility. This reduces the healthy mixing of genetic traits that helps populations survive over the long run (Conserving the Forest Interior. Ontario Extension Notes, 2000).
The Environment Canada Guideline also notes that for forest plants that do not disperse broadly or quickly, preservation of some relatively undisturbed large forest patches is needed to sustain them because of their restricted dispersal abilities and specialized habitat requirements and to ensure continued seed or propagation sources for restored or regenerating areas nearby.
The Natural Heritage Reference Manual continues by stating that a larger size also allows woodlands to support more resilient nutrient cycles and food webs and to be big enough to permit different and important successional stages to co-exist. Small, isolated woodlands are more susceptible to the effects of blowdown, drought, disease, insect infestations, and invasions by predators and non-indigenous plants. It is also known that the viability of woodland wildlife depends not only on the characteristics of the woodland in which they reside, but also on the characteristics of the surrounding landscape where the woodland is situated. Additionally, the percentage of forest cover in the surrounding landscape, the presence of ecological barriers such as roads, the ability of various species to cross the matrix surrounding the woodland and the proximity of adjacent habitats interact with woodland size in influencing the species assemblage within a woodland.
In the Rideau-Merrickville catchment (in 2014), 117 (36 percent) of the 321 woodland patches are very small, being less than one hectare in size. Another 165 (51 percent) of the woodland patches ranging from one to less than 20 hectares in size tend to be dominated by edge-tolerant bird species. The remaining 39 (13 percent of) woodland patches range between 21 and 290 hectares in size. Thirty-two of these patches contain woodland between 20 and 100 hectares and may support a few area-sensitive species and some edge intolerant species, but will be dominated by edge tolerant species.
Conversely, seven (three percent) of the 321 woodland patches in the drainage area exceed the 100 plus hectare size needed to support most forest dependent, area sensitive birds and are large enough to support approximately 60 percent of edge-intolerant species. One patch tops 200 hectares, which according to the Environment Canada Guideline will support 80 percent of edge-intolerant forest bird species (including most area sensitive species) that prefer interior forest habitat conditions.
Table 13 presents a comparison of woodland patch size in 2008 and 2014 along with any changes that have occurred over that time. A decrease (of 20 ha) has been observed in the overall woodland patch area between the two reporting periods with most of the physical change in area occurring in the 20 to 50 and 100 to 200 hectare woodland patch size class ranges.
Table 13 Woodland patches in the Rideau-Merrickville catchment (2008 and 2014)
*Includes treed swamps
Forest Interior
The forest interior is habitat deep within woodlands. It is a sheltered, secluded environment away from the influence of forest edges and open habitats. Some people call it the “core” or the “heart” of a woodland. The presence of forest interior is a good sign of woodland health, and is directly related to the woodland’s size and shape. Large woodlands with round or square outlines have the greatest amount of forest interior. Small, narrow woodlands may have no forest interior conditions at all. Forest interior habitat is a remnant natural environment, reminiscent of the extensive, continuous forests of the past. This increasingly rare forest habitat is now a refuge for certain forest-dependent wildlife; they simply must have it to survive and thrive in a fragmented forest landscape (Conserving the Forest Interior. Ontario Extension Notes, 2000).
The Natural Heritage Reference Manual states that woodland interior habitat is usually defined as habitat more than 100 metres from the edge of the woodland and provides for relative seclusion from outside influences along with a moister, more sheltered and productive forest habitat for certain area sensitive species. Woodlands with interior habitat have centres that are more clearly buffered against the edge effects of agricultural activities or more harmful urban activities than those without.
In the Rideau-Merrickville catchment (in 2014), the 321 woodland patches contain 119 forest interior patches (Figure 25) that occupy five percent (643 ha.) of the catchment land area (which is equal to the five percent of interior forest in the Middle Rideau Subwatershed). This is below the ten percent figure referred to in the Environment Canada Guideline that is considered to be the minimum threshold for supporting edge intolerant bird species and other forest dwelling species in the landscape.
Most patches (102) have less than 10 hectares of interior forest, 62 of which have small areas of interior forest habitat less than one hectare in size. The remaining 17 patches contain interior forest ranging between 11 and 70 hectares in area.
Between 2008 and 2014, there has been a notable change in the number of woodland patches containing smaller areas of interior habitat (Table 14) with an increase of 43 woodlands containing less than one hectare of interior forest over this period and 16 woodlands with one to 10 hectares of interior habitat. This has occurred as a result of the loss of interior forest habitat in the larger woodland patches in the catchment over this period.
Table 14 Woodland Interior in the Rideau-Merrickville catchment (2008 and 2014)
Wetland Cover
Wetlands are habitats forming the interface between aquatic and terrestrial systems. They are among the most productive and biologically diverse habitats on the planet. By the 1980s, according to the Natural Heritage Reference Manual, 68 percent of the original wetlands south of the Precambrian Shield in Ontario had been lost through encroachment, land clearance, drainage and filling.
Wetlands perform a number of important ecological and hydrological functions and provide an array of social and economic benefits that society values. Maintaining wetland cover in a watershed provides many ecological, economic, hydrological and social benefits that are listed in the Reference Manual and which may include:
- contributing to the stabilization of shorelines and to the reduction of erosion damage through the mitigation of water flow and soil binding by plant roots
- mitigating surface water flow by storing water during periods of peak flow (such as spring snowmelt and heavy rainfall events) and releasing water during periods of low flow (this mitigation of water flow also contributes to a reduction of flood damage)
- contributing to an improved water quality through the trapping of sediments, the removal and/or retention of excess nutrients, the immobilization and/or degradation of contaminants and the removal of bacteria
- providing renewable harvesting of timber, fuel wood, fish, wildlife and wild rice
- contributing to a stable, long-term water supply in areas of groundwater recharge and discharge
- providing a high diversity of habitats that support a wide variety of plants and animals
- acting as “carbon sinks” making a significant contribution to carbon storage
- providing opportunities for recreation, education, research and tourism
Historically, the overall wetland coverage within the Great Lakes basin exceeded 10 percent, but there was significant variability among watersheds and jurisdictions, as stated in the Environment Canada Guideline. In the Rideau Valley Watershed, it has been estimated that pre-settlement wetland cover averaged 35 percent using information provided by Ducks Unlimited Canada (2010) versus the 21 percent of wetland cover existing in 2014 derived from DRAPE imagery analysis.
Using the same dataset, it is estimated that pre-settlement (historic) wetland cover averaged 32 percent in the Middle Rideau subwatershed versus the 27 percent of cover existing in 2014. This decline in wetland cover is also evident in the Rideau-Merrickville catchment (as seen in Figure 26) where there has been an eight percent decrease in the area of wetland cover from pre-settlement times to the present (as summarized in Table 15).
Figure 26 Catchment wetland cover
While there has been a reported decrease in wetland cover in the Rideau-Merrickville catchment from pre-settlement times, the remaining wetland cover in 2014 remains above the ecological thresholds cited in the Environment Canada Guideline. Nonetheless, in order to maintain critical hydrological, ecological functions along with related recreational and economic benefits provided by these wetland habitats in the catchment, a “no net loss” of currently existing wetlands should be employed to ensure the continued provision of tangible benefits accruing from them for landowners and surrounding communities.
Table 15 Wetland cover in the Middle Rideau subwatershed and Rideau-Merrickville catchment (Historic to 2014)
5. Stewardship and Protection
The RVCA and its partners are working to protect and enhance environmental conditions in the Middle Rideau Subwatershed. Figure 27 shows the location of all stewardship projects completed in the Rideau-Merrickville catchment along with sites identified for potential shoreline restoration.
Rural Clean Water Projects
From 2009 to 2014, seven septic system replacements, four erosion control projects, three well decommissionings, three well upgrades, one well replacement, one livestock fencing project, one milkhouse washwater treatment facility and one windbreak buffer were completed. Between 2003 and 2008, seven septic system replacements, five well decommissionings, three livestock fencing projects, two well upgrades, one windbreak buffer, one erosion control project, one fuel storage and handling facility, one nutrient management plan and one wastewater runoff project were carried out. Prior to 2003, three livestock fencing projects, two septic system replacements, one milkhouse washwater treatment facility and one manure storage facility were completed. Total value of all 50 projects is $380,843 with $207,425 of that amount funded through grant dollars from the RVCA.
Figure 27 Stewardship and potential restoration locations
Tree Planting Projects
The location of RVCA Tree Planting Program projects is shown in Figure 27. From 2009 to 2014, 18,000 trees were planted at two sites. Between 2003 and 2008, 20,476 trees were planted at six sites and prior to 2003, 28,355 trees were planted at 10 sites, resulting in the reforestation of 35 hectares. Total value of all 18 projects is $186,978 with $58,904 of that amount coming from various fundraising sources.
Through the RVCA Butternut Recovery Program, an additional 60 butternut trees were planted in the Rideau-Merrickville catchment between 2003 and 2014, as part of efforts to introduce healthy seedlings from tolerant butternuts into various locations across Eastern Ontario.
Shoreline Naturalization Projects
With the assistance of the RVCA’s Shoreline Naturalization Program, 963 trees and shrubs were planted at six project locations to create a 722 metre long shoreline buffer at a total project value of $4,183.
Valley, Stream, Wetland and Hazard Land Regulation
The Rideau-Merrickville catchment covers 116 square kilometres with 31.3 square kilometres (or 27 percent) of the drainage area being within the regulation limit of Ontario Regulation 174/06 (Figure 28), giving protection to wetland areas and river or stream valleys that are affected by flooding and erosion hazards.
Wetlands occupy 22.2 sq. km. (or 19 percent) of the catchment. Of these wetlands, 12.4 sq. km (or 56 percent) are designated as provincially significant and included within the RVCA regulation limit. This leaves the remaining 9.9 sq. km (or 44 percent) of wetlands in the catchment outside the regulated area limit.
Of the 176.1 kilometres of stream in the catchment, regulation limit mapping has been plotted along 86.3 kilometers of streams (representing 49 percent of all streams in the catchment). Some of these regulated watercourses (31.1 km or 18 percent of all streams) flow through regulated wetlands; the remaining 55.2 km (or 64 percent) of regulated streams are located outside of those wetlands. Plotting of the regulation limit on the remaining 89.7 km (or 51 percent) of streams requires identification of flood and erosion hazards and valley systems.
Within the regulation limit, “development” and “site alteration” require RVCA permission. The “alteration to waterways” provision of Ontario Regulation 174/06 applies to all watercourses.
Figure 28 RVCA regulation limits and Merrickville Wellhead Protection Area
Vulnerable Drinking Water Areas
The Wellhead Protection Area around the Village of Merrickville municipal drinking water source is located within the Rideau-Merrickville drainage catchment (Figure 28). This area is subject to mandatory policies in the Mississippi-Rideau Source Protection Plan developed under the Clean Water Act. These policies specifically regulate land uses and activities that are considered drinking water threats, thereby reducing the risk of contamination of the municipal drinking water source.
With the exception of the area around Kilmarnock, the Rideau-Merrickville drainage catchment is also considered to have a Highly Vulnerable Aquifer. This means that the nature of the overburden (thin soils, fractured bedrock) does not provide a high level of protection for the underlying groundwater making the aquifer more vulnerable to contaminants released on the surface. The Mississippi-Rideau Source Protection Plan includes policies that focus on the protection of groundwater region-wide due to the fact that most of the region, which encompasses the Mississippi and Rideau watersheds, is considered Highly Vulnerable Aquifer.
The lands adjacent to the Rideau River are also considered a Significant Groundwater Recharge Area. This means that there is a volume of water moving from the surface into the ground and groundwater serves either as a municipal drinking water source or supplies a lake or stream ecosystem. The Plan was not required to include policies to specifically address Significant Groundwater Recharge Areas.
For detailed maps and policies that have been developed to protect drinking water sources, please go to the Mississippi-Rideau Source Protection Region website at www.mrsourcewater.ca to view the Mississippi-Rideau Source Protection Plan.
6. Challenges/Issues
Water Quality
- Surface water quality in the Rideau River is “Fair” as determined by surface water chemistry data. Occasional exceedances of nutrients and metals contributed to the rating
Shorelines
- The riparian buffer in the Rideau-Merrickville catchment (30 m. wide strip along the shoreline of the Rideau River and its tributaries) is comprised of wetland (43 percent), crop and pastureland (26 percent), woodland (22 percent), settlement areas (six percent) and roads (three percent) and (at 65 percent) is below the recommended target to maintain a minimum 30 metre wide, naturally vegetated buffer along at least 75 percent of the length of both sides of rivers, creeks and streams.
- Emerald ash borer poses a significant threat to the ecology of the subwatershed, given the prominence of ash trees along shorelines and in riparian and wetland areas. Many tree stands are predominantly ash and with their anticipated loss, it is unclear what will replace them and the overall effect of their collective demise on the physical and natural functions/values they provide for erosion, water quality and fish and wildlife habitat protection
Land Cover
- The catchment contains 981 ha of unevaluated wetland (occupying 8 percent of its total area) that provides many important social, hydrological, biological and ecological functions/services. Although not under imminent threat from development activity, they do remain vulnerable to drainage and land clearing activities in the absence of any regulatory and planning controls that would otherwise protect them
Development
- Some waterfront properties contain existing non-complying dwellings with respect to minimum water frontage and lot area and are often located within 30 metres of the water that require minor variances for expansion and/or reconstruction of dwellings where standard development setbacks from water are difficult to achieve. In these cases, Township staff and the Conservation Authority can meet with resistance and push back when attempts are made to implement standards for development setbacks, vegetated shorelines and septic systems
Natural Hazards
- Floodplain mapping for the Middle Rideau is over 35 years out of date for that reach of the Rideau River extending from Smiths Falls to Burritts Rapids
7. Opportunities/Actions
Water Quality
- Investigate the source of possible pollutants along the Rideau River and its tributaries and consider implementing measures to reduce nutrient and bacterial loadings
- Implement agricultural and residential best management practices to address the occasional exceedances of nutrient and metal concentrations in the Rideau River by restricting livestock access to the river, limiting the use of fertilizers and pesticide applications and improving or maintaining a shoreline buffer
- Continue to offer the suite of water quality improvement projects provided by the Rideau Valley Rural Clean Water Program to landowners
- Continue to protect the water resources of the Rideau River and Canal and its tributaries within the catchment through implementation of municipal (Village of Merrickville-Wolford, Township of Elizabethtown-Kitley, Township of Montague) and agency (Parks Canada) land use planning and development policies, practices and standards
Shorelines/Headwaters
- Continue to promote the Rideau Valley Shoreline Naturalization and Tree Planting Programs to landowners
- RVCA and its partners (Village of Merrickville-Wolford, Township of Elizabethtown-Kitley, Township of Montague) are to continue educating landowners about the value and importance of headwater drainage features, natural shorelines and waterfront property best management practices with respect to shoreline use and development, septic system installation and maintenance and shoreline vegetation retention and enhancement
- Protect the riparian buffer along the shoreline of the Rideau River and catchment streams (headwaters) during the development approvals process through adherence to and enforcement of municipal land-use policies and zoning standards
- Target shoreline restoration at sites identified in this report (shown as “Other riparian land cover” in Figure 12 and “Potential Riparian/Shoreline Restoration” in Figure 23) and explore other restoration and enhancement opportunities along the Rideau River and its tributaries
Development
- Collectively work with approval authorities (Township of Elizabethtown-Kitley, Village of Merrickville-Wolford, Conservation Authority, the Health Unit and Mississippi-Rideau Septic System Office) to consistently implement current land use planning and development policies for water quality and shoreline protection adjacent to the Rideau River and Canal and other catchment streams (i.e., to attain a minimum 30 metre development setback from water)
- Explore ways and means to more effectively enforce and implement conditions of land-use planning and development approval to achieve net environmental gains (particularly with respect to rehabilitating or protecting naturally vegetated shorelines and water quality)
- Encourage Committees of Adjustment to take advantage of technical and environmental information and recommendations forthcoming from planning and environmental professionals
- Municipalities and agencies are encouraged to strengthen natural heritage and water resources official plan policies and zoning provisions (water setbacks, frontage and naturalized shorelines and wetland protection) where deemed appropriate
- Utilize RVCA subwatershed and catchment reports to help develop/revise official plan policies to protect surface water resources and the natural environment (including woodlands, wetlands and shoreline cover)
- Consider establishing RVCA regulations limits to protect additional wetlands
Natural Hazards
- RVCA provides ongoing “hazardous lands management” support to the Township of Montague and Village of Merrickville-Wolford through its Hazardous Lands (flood plain, unstable slope) Management Program. In this catchment, this will require that updated floodplain mapping be prepared for the reach of the Rideau River extending from Smiths Falls to Burritts Rapids
Full Catchment Report
Middle Rideau Subwatershed Report 2015
RIDEAU-SMITHS FALLS CATCHMENT
The RVCA produces individual reports for ten catchments about environmental conditions in the Middle Rideau subwatershed using data collected and analysed by the RVCA through its watershed monitoring and land cover classification programs every six years.
This information is used to better understand the effects of human activity on our water resources, allows us to better track environmental change over time and helps focus watershed management actions where they are needed the most to help sustain the ecosystem services (cultural, aesthetic and recreational values; provisioning of food, fuel and clean water; regulation of erosion/natural hazard protection and water purification; supporting nutrient/water cycling and habitat provision) provided by the catchment’s lands and forests and waters (Millennium Ecosystem Assessment 2005).
The following pages of this report are a compilation of that work and contain information on surface water quality, riparian conditions, land cover, stewardship activity and hazard land and water resources protection.
1. Catchment Facts
General Geography
- The Rideau River flows through the heart of the Middle Rideau and is a focal point for residents and visitors to the area. It extends from the outlet of Lower Rideau Lake at Poonamalie (where there is one dam and one lock) to Burritts Rapids (where there is also a dam and lock), at which point it enters the Lower Rideau on its way to Rideau Falls. The Rideau River is a designated Canadian Heritage River and an integral part of the Rideau Canal National Historic Site of Canada that is a UNESCO World Heritage Site and a major tourist attraction. Smiths Falls, Merrickville and Burritts Rapids are the main settlements in the subwatershed
- The Town of Smiths Falls is the main settlement with other areas of the catchment being predominantly rural in character and agriculture a major land use
- In the Town of Smiths Falls, the vast majority of the shoreline lands of the Rideau River and Canal within the Town boundary are publically owned, either by the Town or Federal Crown agencies and are used for recreational purposes linked to the use of the Rideau Canal. The Upper Basin of the Canal is a primarily structured shoreline with original canal limestone walls. A small portion of the north shore of the Upper Basin is a beached swimming area for tourists and docking areas are provided for users of the Canal between the Detached and Combined lock stations. The Lower Basin of the Canal is a mixture of structured and unstructured shoreline. The north shore of the Lower Basin remains in the ownership of the Crown up to the high water line after which the lands are privately owned. The southern shore of the Lower Basin is former landfill which has been capped and repurposed as municipal parkland
- Parks Canada staff manage water levels for recreational purposes along the Rideau Canal/Waterway that runs through the catchment, ensuring 1.5 metres of draft during the navigation season. In this managed system, water levels on the Rideau Canal are manipulated by operation of numerous dams. In the Middle Rideau subwatershed, Parks Canada staff operate 9 dam and lock complexes with 13 locks for a fall of 36.2 metres over 35.6 kilometres. Water levels are maintained as close as possible to set objectives through the May to October navigation season. The levels are lowered through the rest of October and into November and held at the winter levels until the spring freshet in late March or early April naturally increases inflows to the system. To reduce the impact of the higher flows in the spring, the amount of snow water equivalent, forecast rain, ice cover, flows and levels are assessed and the dams in the Middle Rideau reach are operated accordingly to quickly pass as much water as possible. In late April and early May, the dams are gradually closed and water levels are brought up to be ready, once again, for the navigation season
Physical Geography
- All of Rideau-Smith Falls catchment and the rest of the Middle Rideau subwatershed primarily resides within the Smith Falls Limestone Plain, which in this area is primarily made up of March Formation sandstone and dolostone. The bedrock across the catchment is mainly overlain by a thin veneer of glacial sediment, referred to as ‘drift’ that is generally less than a metre in thickness; although there are significant areas of glacial till and organic deposits
- Forty-six percent of the catchment lies within the Township of Montague, 20 percent in the Town of Smiths Falls, 18 percent in the Township of Drummond/North Elmsley, 15 percent in the Township of Rideau Lakes and one percent in the Village of Merrickville-Wolford
- Rideau-Smiths Falls catchment drainage area is 48 square kilometres and occupies about six percent of the Middle Rideau subwatershed and one percent of the Rideau Valley watershed
Vulnerable Areas
- The Assessment Report developed under the Ontario Clean Water Act identified the catchment area as a Highly Vulnerable Aquifer and the Town of Smiths Falls municipal drinking water source as an Intake Protection Zone, which is subject to mandatory policies in the Mississippi-Rideau Source Protection Plan that specifically regulate land uses and activities that are considered drinking water threats, thereby reducing the risk of contamination of the municipal drinking water source
- Lands along the Rideau River in the catchment are subject to flooding during the regional (100 year) storm. Flood elevations for this section of the Rideau River range from 123.16 metres above mean sea level (masl) downstream of the Poonamalie Dam, to 121.52 masl below Abbot Street, to 112.4 masl downstream of Beckwith Street, to 106.8 masl upstream of the Edmonds Lock
Development/Trends
Town of Smiths Falls
- Is a predominantly serviced urban municipality that has established mandatory service connections for properties subject to intensification and redevelopment on the fringe development areas where there are approximately 40 properties remaining without full services
- Is classified into five primary development categories in the 2014 Official Plan: Residential, Commercial, Major Institutional, Mixed-Use, Industrial, and Open Space
- Generally speaking has had historic new development occurring on fringe greenfield sites. Three developments in particular have been recently approved for the construction of mixed density residential communities in the south-western quadrant of the municipality (Ferrara Meadows, Bellamy Farms, and Wood Avenue). These sites are within the influence area of Lousy Creek, a tributary to the Rideau Canal, and adjacent to areas of Provincially Significant Wetland. All three developments have been subject to extensive Environmental Impact Studies and Water Budget Assessments, reviewed and approved by the Rideau Valley Conservation Authority
- Has adopted a mandate of intensification and adaptive reuse in the new 2014 Official Plan to guide development to better utilize existing lands rather than consuming greenfield lands. Sites such as the Rideau Regional Centre, the former South Unit Hospital, and various vacant land parcels in established neighbourhoods will be prioritized for development
- Has the majority of land along the shoreline of the Rideau River and Canal presently developed, however there are several sites at the Combined Lock Station that have been identified for re-development. These sites include: The former Water Treatment Plant; the EconoLodge; the former Canadian Tire shopping centre; and the Parks Canada Gate Shop. These properties are believed to be potential Brownfield sites, as the lands were historically used by the Frost & Wood Implement Manufacturing Company
- Has The Swale as an area of Provincially Significant Wetland on the western boundary of the Town (SF) and the Townships of Rideau Lakes (RL) and Drummond/North Elmsley (DNE). Existing development around the Swale include: a golf course (DNE), Year-round Trailer Park (DNE) Highway Commercial Development (RL/SF), Big Box Commercial (SF), light residential (SF), existing in-water boat houses (SF) and Institutional/Office uses (SF). One particular property adjacent to the Swale is operated by the Rideau Environmental Action League. REAL has expressed a keen interest to develop shoreline lookouts and interpretive centres as part of a site restoration plan for the former industrial lands. Discussions with both Parks Canada and RVCA have been ongoing
- Has prepared Conceptual Plans for the redevelopment and revitalization of its Waterfront as has been well documented in the Town of Smiths Falls Downtown Revitalization and Waterfront Integration Master Plan. The Plan calls for the provision of public access to the waterfront, and naturalization of the shoreline where feasible
Drummond/North Elmsley
- Residential development is generally very scattered with single family residences and no major subdivisions. Along County Road 43 to the west of Smiths Falls, there are some commercial and industrial uses and a greater concentration of single family residences. Elsewhere, other non-residential and non-agricultural uses are small and typically oriented locally to the farming sector
Montague
- Development is concentrated mostly on the periphery of Smiths Falls with older subdivisions on municipal services (Atironto and Carswell) taking on a more urban pattern of development. These subdivisions (especially along the Roger Stevens Road corridor) contain most of the established commercial and industrial development in the Township. North of Smiths Falls, along Highway 15, is a significant amount of industrially zoned land, however to date it is largely undeveloped. The rural remainder of the Township consists of scattered residential and agricultural development, mostly along traditional transportation routes and in areas of good agricultural capability
Rideau Lakes
- Land use is predominately Rural (RU) and Agricultural (A) with some areas of Rural Estate Lot Subdivision (RG) located to the south of Smiths Falls, off the Poonamalie Road
Conditions at a Glance
Instream and Riparian
- In the Rideau-Smiths Falls catchment, the riparian buffer (30 m. wide strip along the shoreline of the Rideau River and its tributaries) is comprised of wetland (56 percent), crop and pastureland (15 percent), woodland (11 percent), settlement areas (11 percent) and transportation routes (seven percent)
- In the Town of Smiths Falls, the 30 metre riparian buffer is comprised of wetland (33 percent), commercial, industrial, institutional and residential areas (33 percent), woodland (14 percent), roads/railways (11 percent) and crop and pastureland (nine percent)
- Along the Rideau River and Canal through the Town of Smiths Falls, the 30 metre wide riparian buffer contains commercial, institutional and residential areas (59 percent), wetland (19 percent), roads, railways and lock stations (12 percent) and woodland (10 percent)
Land Cover
- Rideau-Smiths Falls catchment land cover is dominated by crop and pastureland (28 percent) and wetland (27 percent) followed by settlement areas (18 percent), woodland (17 percent), transportation routes (seven percent), water (two percent) and aggregate sites (one percent). From 2008 to 2014, there was an overall land cover change of 42 hectares (from one land cover class to another) in the catchment, most of which can be attributed to the conversion of “crop and pasture” to newly developed ‘settlements’ and emerging ‘wooded areas’ (plantations or early successional woodlands)
- Town of Smiths Falls land cover is dominated by commercial, industrial and residential areas (44 percent) followed by roads and railways (18 percent), woodland (16 percent), crop and pastureland (11 percent), wetland (eight percent) and water (three percent). From 2008 to 2014, the overall land cover change was 12 hectares, mostly attributable to the conversion of “crop and pasture” to emerging ‘wooded areas’ (plantations or early successional woodlands) and new development
- Woodland cover in the catchment has increased by 11 hectares between 2008 and 2014 and interior forest habitat has increased by one hectare. In the Town of Smiths Falls, the overall area of woodland has increased by six hectares between the two reporting periods and interior forest habitat has increased by one hectare
- Wetland cover has decreased by 10 percent (468 ha) from pre-settlement times to the present and now occupies 27 percent of the catchment area
Other
- Approximately 930 to 990 in-use water wells with provincial records in this catchment. While most water wells are used for domestic water supply, in this catchment, many are also used for commercial, industrial, agricultural, municipal and public water supplies; monitoring wells; cooling systems; or dewatering
- Numerous Environmental Compliance Approvals have been issued in this catchment for discharge to the environment related to municipal, private and industrial sewage works and industrial and commercial air emissions
- Several Permits to Take Water have been issued in this catchment for the Smith Falls (surface) water supply wells and for local industrial cooling operations
- There is one large bedrock aggregate license in this catchment along with one sand and gravel pit license
Catchment Care
- Twenty stewardship projects have been completed with assistance from the RVCA’s Rural Clean Water and Tree Planting Programs and Ontario Drinking Water Stewardship Program (please see Section 4 of this report for details)
- The Town of Smiths Falls has installed both its primary intake and backup intake in the Rideau River at Abbott Street and is acutely aware of potential drinking water threats from adjacent land uses. This has led to the area around the Rideau Canal Detached Lock Station (at Abbott Street) being identified as an “Intake Protection Zone 10” in both the Mississippi-Rideau Sourcewater Protection Plan and the Town of Smiths Falls Official Plan. The Town is the first municipality in the MRSPP jurisdiction to adopt stringent Official Plan policies for the protection of its drinking water supply and will be adopting similar provisions in the Zoning Bylaw
- The Smiths Falls 2034 Official Plan (p.9) serves as the Town’s latest expression of its ongoing commitment to a leadership role in the advancement of an innovation-based economy, the development and implementation of environmental policies, and the utilization of land use planning best practices to shape Smiths Falls’ future. The Plan includes land use policies to shape the transformation of strategically identified and historically underutilized areas into higher-density, mixed-use areas, which can accommodate employment and housing growth and reduce the environmental impacts of that growth by promoting cycling and walkability. Some specific objectives of the Town’s “Environmental Vision” for a “healthy and sustainable environment” are listed below, which help to define and unify the vision for a thriving community and are intended to be implemented by the following policies set out in the Official Plan (p.10, 11):
- Conservation of resources including energy, water, wetlands, wildlife, habitat, biodiversity, and other natural resources
- Protection of natural features and areas for the long term
- Responsible stewardship for open lands and natural areas
- A connected system of open lands
- Healthy urban watershed and ongoing best-practices to floodplain management
- Source water protection for a safe and lasting water supply and drinking water quality
- Local and regional cooperation, coordination, and leadership on environmental matters
- The Town of Smiths Falls is committed to the preservation, protection and restoration of the ecological integrity and scenic characteristics of The Swale Provincially Significant Wetland which is an identified life science area of natural and scientific interest, as well as an important feature of the UNESCO Rideau Canal
- Smiths Falls is committed to responsible stormwater management to support healthy habitats, a healthy human population and a healthy economy
- A watershed model developed by the RVCA in 2009 was used to study the hydrologic function of wetlands in the Rideau Valley Watershed, including those found in the Rideau-Smiths Falls catchment
- The Townships of Drummond-North Elmsley, Montague, Rideau Lakes and the Town of Smiths Falls work with individual property owners on a case by case basis to enable new development and redevelopment while ensuring the scale is suitable for the property, impacts on neighbours are minimized and natural features/hazards, when identified, are protected. Naturalized shorelines are generally negotiated through site plan control and subdivision consent applications, during which time municipal staff work with Parks Canada and the RVCA to harmonize the approvals process
- Development in and adjacent to the Provincially Significant Wetlands in the catchment (The Swale and some locally significant wetlands) are subject to Ontario Regulation 174-06 (entitled “Development, Interference with Wetlands and Alterations to Shorelines and Watercourses”) that protects the hydrologic function of the wetland and also protects landowners and their property from natural hazards (flooding, fluctuating water table, unstable soils) associated with them
- The report entitled “A Multidisciplinary, Community-Based Study of the Environmental Health of the Rideau River” was prepared by the Canadian Museum of Nature in 2001. The study’s goals were to assess the biodiversity of the Rideau River, from Smiths Falls to Ottawa, and to reconcile local needs with long-term sustainable management of its biological diversity
- Rideau Canal National Historic Site of Canada Management Plan (2005) update establishes the long term strategic direction for the management of the Rideau Canal and the Rideau Canal World Heritage Site Management Plan (2005) specifies how its world heritage values will be protected for present and future generations
- The Landscape Character Assessment Report identifying key features and visual values along the Rideau Canal was released by the Rideau Corridor Landscape Strategy Steering Committee in April 2013 and includes recommendations for future planning and management actions to protect the visual setting of the Rideau Canal from Ottawa to Kingston, including those found in the Rideau-Smiths Falls catchment
2. Rideau River Tributary Riparian Conditions
Shoreline Buffer Land Cover Evaluation
The riparian or shoreline zone is that special area where the land meets the water. Well-vegetated shorelines are critically important in protecting water quality and creating healthy aquatic habitats, lakes and rivers. Natural shorelines intercept sediments and contaminants that could impact water quality conditions and harm fish habitat in streams. Well established buffers protect the banks against erosion, improve habitat for fish by shading and cooling the water and provide protection for birds and other wildlife that feed and rear young near water. A recommended target (from Environment Canada’s Guideline: How Much Habitat is Enough?) is to maintain a minimum 30 metre wide vegetated buffer along at least 75 percent of the length of both sides of rivers, creeks and streams.
Figure 1 shows the extent of the naturally vegetated riparian zone along a 30 metre wide strip of shoreline of the Rideau River and its tributaries. This information is derived from a dataset developed by the RVCA’s Land Cover Classification Program through heads-up digitization of 20cm DRAPE ortho-imagery at a 1:4000 scale, which details the catchment landscape using 10 land cover classes.
Figure 1 Natural and other riparian land cover in the Rideau-Smiths Falls catchment
This analysis shows that the Rideau-Smiths Falls catchment riparian buffer is comprised of wetland (56 percent), crop and pastureland (15 percent), woodland (11 percent), settlement areas (11 percent) and roads/railways (seven percent). In the Town of Smiths Falls, the riparian buffer is comprised of wetland (33 percent), commercial, industrial, institutional and residential areas (33 percent), woodland (14 percent), roads/railways (11 percent) and crop and pastureland (nine percent) and along the Rideau River and Canal itself (in the Town), the shoreline buffer is made up of commercial, institutional and residential areas (59 percent), wetland (19 percent), transportation routes (12 percent) and woodland (10 percent). Additional riparian statistics for the Rideau-Smiths Falls catchment are presented in Table 1 to Table 3 and show that there has been very little to no change in shoreline cover from 2008 to 2014.
Table 1 Riparian land cover (2008 vs. 2014) in the Rideau-Smiths Falls catchment
Table 2 Riparian land cover (2008 vs. 2014) in the Town of Smiths Falls
Table 3 Riparian land cover (2008 vs. 2014) in Smiths Falls along the Rideau River and Canal
Rideau River Tributary Instream Aquatic Habitat
Groundwater
Groundwater discharge areas can influence stream temperature, contribute nutrients, and provide important stream habitat for fish and other biota. During stream surveys, indicators of groundwater discharge are noted when observed. Indicators include: springs/seeps, watercress, iron staining, significant temperature change and rainbow mineral film. Figure 2 shows areas where one or more of the above groundwater indicators were observed during stream surveys and headwater assessments.
Figure 2 Groundwater indicators observed in the Rideau-Smiths Falls catchment
Headwaters Drainage Features Assessment
The RVCA Stream Characterization program assessed Headwater Drainage Features for the Middle Rosedale subwatershed in 2014. This protocol measures zero, first and second order headwater drainage features (HDF). It is a rapid assessment method characterizing the amount of water, sediment transport, and storage capacity within headwater drainage features (HDF). RVCA is working with other Conservation Authorities and the Ministry of Natural Resources and Forestry to implement the protocol with the goal of providing standard datasets to support science development and monitoring of headwater drainage features. An HDF is a depression in the land that conveys surface flow. Additionally, this module provides a means of characterizing the connectivity, form and unique features associated with each HDF (OSAP Protocol, 2013). In 2014 the program sampled 16 sites at road crossings in the Rideau - Smiths Falls catchment area (Figure 3).

Figure 3 Locations of the headwater sampling sites in the Rideau-Smiths Falls catchment
Spring photo of a headwater sample site in the Rideau-Smiths Falls catchment located on Harper Condie Road
Summer photo of a headwater sample site in the Rideau - Smiths Falls catchment located on Harper Condie Road
Feature Type
The headwater sampling protocol assesses the feature type in order to understand the function of each feature. The evaluation includes the following classifications: defined natural channel, channelized or constrained, multi-thread, no defined feature, tiled, wetland, swale, roadside ditch and pond outlet. By assessing the values associated with the headwater drainage features in the catchment area we can understand the ecosystem services that they provide to the watershed in the form of hydrology, sediment transport, and aquatic and terrestrial functions. The Rideau-Smiths Falls catchment is dominated by wetland headwater drainage features. Two features were classified as having been channelized, one was identified as a swale and four features were identified as roadside drainage features. Figure 4 shows the feature type of the primary feature at the sampling locations.
Figure 4 Headwater feature types in the Rideau-Smiths Falls catchment
Headwater Feature Flow
The observed flow condition within headwater drainage features can be highly variable depending on timing relative to the spring freshet, recent rainfall, soil moisture, etc. Flow conditions are assessed in the spring and in the summer to determine if features are perennial and flow year round, if they are intermittent and dry up during the summer months or if they are ephemeral systems that do not flow regularly and generally respond to specific rainstorm events or snowmelt. Flow conditions in headwater systems can change from year to year depending on local precipitation patterns. Figure 5 shows the observed flow conditions at the sampling locations in the Rideau-Smiths Falls catchment.
Figure 5 Headwater feature flow conditions in the Rideau-Smiths Falls catchment
Feature Channel Modifications
Channel modifications were assessed at each headwater drainage feature sampling location. Modifications include channelization, dredging, hardening and realignments. The majority of sampling locations for the Rideau-Smiths Falls catchment area were classified as having no channel modifications and two appeared to have been historically dredged. Figure 6 shows the channel modifications observed at the sampling locations for Rideau-Smiths Falls.
Figure 6 Headwater feature channel modifications in the Rideau-Smiths Falls catchment
Headwater Feature Vegetation
Headwater feature vegetation evaluates the type of vegetation that is found within the drainage feature. The type of vegetated within the channel influences the aquatic and terrestrial ecosystem values that the feature provides. For some types of headwater features the vegetation within the feature plays a very important role in flow and sediment movement and provides wildlife habitat. The following classifications are evaluated no vegetation, lawn, wetland, meadow, scrubland and forest. The features assessed in the Rideau-Smiths Falls catchment were dominated by wetland and meadow vegetation within the features. One feature was classified as forest and one was classified as having lawn within the feature. Figure 7 depicts the dominant vegetation observed at the sampled headwater sites in the Rideau-Smiths Falls catchment.
Figure 7 Headwater feature vegetation types in the Rideau-Smiths Falls catchment
Headwater Feature Riparian Vegetation
Headwater riparian vegetation evaluates the type of vegetation that is found along the adjacent lands of a headwater drainage feature. The type of vegetation within the riparian corridor influences the aquatic and terrestrial ecosystem values that the feature provides to the watershed. The sample locations in Rideau-Smiths Falls were dominated by natural vegetation in the form of meadow, scrubland, forest and wetland vegetation. Figure 8 depicts the type of riparian vegetation observed at the sampled headwater sites in the Rideau-Smiths Falls catchment.
Figure 8 Headwater feature riparian vegetation types in the Rideau-Smiths Falls catchment
Headwater Feature Sediment Deposition
Assessing the amount of recent sediment deposited in a channel provides an index of the degree to which the feature could be transporting sediment to downstream reaches (OSAP, 2013). Evidence of excessive sediment deposition might indicate the requirement to follow up with more detailed targeted assessments upstream of the site location to identify potential best management practices to be implemented. Conditions ranged from no deposition observed to extensive deposition recorded. Figure 9 depicts the degree of sediment deposition observed at the sampled headwater sites in the Rideau-Smiths Falls catchment.
Figure 9 Headwater feature sediment deposition in the Rideau-Smiths Falls catchment
Headwater Feature Upstream Roughness
Feature roughness will provide a measure of the amount of materials within the bankfull channel that could slow down the velocity of water flowing within the headwater feature (OSAP, 2013). Materials on the channel bottom that provide roughness include vegetation, woody debris and boulders/cobble substrates. Roughness can provide benefits in mitigating downstream erosion on the headwater drainage feature and the receiving watercourse by reducing velocities. Roughness also provides important habitat conditions to aquatic organisms. The sample locations in the Rideau-Smiths Falls catchment area ranged from minimal to extreme roughness conditions. Figure 10 shows the feature roughness conditions at the sampling locations in the Rideau-Smiths Falls catchment.
Figure 10 Headwater feature roughness in the Rideau-Smiths Falls catchment
Fish Community
The Rideau-Smiths Falls catchment is classified as a mixed community of warm and cool water recreational and baitfish fishery with 21 species observed. Table 4 lists those species observed in the catchment (Source: MNR/RVCA).
Table 4 Fish species observed in the Rideau-Smiths Falls catchment
Instream Restoration
Figure 11 depicts the location of an instream restoration opportunity as a result of observations made during the headwater drainage feature assessments.
Figure 11 Instream restoration opportunities in the Rideau-Smiths Falls ctahcment
3. Land Cover
Land cover and any change in coverage that has occurred over a six year period is summarized for the Rideau- Smiths Falls catchment and Town of Smiths Falls using spatially continuous vector data representing the catchment during the spring of 2008 and 2014. This dataset was developed by the RVCA through heads-up digitization of 20cm DRAPE ortho-imagery at a 1:4000 scale and details the surrounding landscape using 10 land cover classes.
Rideau - Smiths Falls Catchment
As shown in Table 5, the dominant land cover types in 2008 and 2014 were crop and pastureland and wetland, followed by settlement areas and woodland.
Table 5 Land cover (2008 vs. 2014) in the Rideau-Smiths Falls catchment
* Does not include treed swamps ** Includes treed swamps
From 2008 to 2014, there was an overall change of 42 hectares (from one land cover class to another) in the catchment, the majority of which can be attributed to the conversion of crop and pasture to newly developed settlements and emerging woodlands (i.e., plantations or early successional woodlands) (see Figure 12 for the location of the major changes).
Figure 12 Dominant land cover change in the catchment (2008 vs. 2014)
Table 6 shows the type of land cover change that has taken place between land cover classes/types from 2008 to 2014. Overall, the net area of crop and pastureland change (loss) is relatively small at 30 hectares relative to the remaining area of crop and pastureland in the catchment (as of 2014). Similarly, the net area of woodland change (gain) is also small at two hectares relative to the remaining area of woodland in the catchment (as of 2014).
Table 6 Land cover class change in the Rideau-Smiths Falls catchment (2008 to 2014)
* Does not include treed swamps ** Includes treed swamps
Town of Smiths Falls
As shown in Table 7, the dominant land cover type in 2008 and 2014 was urban settlement (a mix of commercial, industrial and residential uses) and associated transportation infrastructure (roads and railways).
Table 7 Land cover (2008 vs. 2014) in the Town of Smiths Falls
* Does not include treed swamps ** Includes treed swamps
From 2008 to 2014, there was an overall change of 12 hectares (from one land cover class to another), the majority of which can be attributed to the conversion of crop and pasture to emerging woodlands (i.e., plantations or early successional forests) and new development in the Town of Smiths Falls (see Table 8 for a summary of these changes). Overall, the net area of crop and pastureland change (loss) is relatively small at 10 hectares relative to the remaining area of crop and pastureland in the catchment (as of 2014).
Table 8 Land cover change in the Town of Smiths Falls (2008 to 2014)
Woodland Cover
In the Environment Canada Guideline (Third Edition) entitled “How Much Habitat Is Enough?” (hereafter referred to as the “Guideline”) the opening narrative under the Forest Habitat Guidelines section states that prior to European settlement, forest was the predominant habitat in the Mixedwood Plains ecozone. The remnants of this once vast forest now exist in a fragmented state in many areas (including the Rideau Valley watershed) with woodland patches of various sizes distributed across the settled landscape along with higher levels of forest cover associated with features such as the Frontenac Axis (within the on-Shield areas of the Rideau Lakes and Tay River subwatersheds). The forest legacy, in terms of the many types of wildlife species found, overall species richness, ecological functions provided and ecosystem complexity is still evident in the patches and regional forest matrices (found in the Middle Rideau subwatershed and elsewhere in the Rideau Valley watershed). These ecological features are in addition to other influences which forests have on water quality and stream hydrology including reducing soil erosion, producing oxygen, storing carbon along with many other ecological services that are essential not only for wildlife but for human well-being.
The Guideline also notes that forests provide a great many habitat niches that are in turn occupied by a great diversity of plant and animal species. They provide food, water and shelter for these species - whether they are breeding and resident locally or using forest cover to help them move across the landscape. This diversity of species includes many that are considered to be species at risk. Furthermore, from a wildlife perspective, there is increasing evidence that the total forest cover in a given area is a major predictor of the persistence and size of bird populations, and it is possible or perhaps likely that this pattern extends to other flora and fauna groups. The overall effect of a decrease in forest cover on birds in fragmented landscapes is that certain species disappear and many of the remaining ones become rare, or fail to reproduce, while species adapted to more open and successional habitats, as well as those that are more tolerant to human-induced disturbances in general, are able to persist and in some cases thrive. Species with specialized-habitat requirements are most likely to be adversely affected. The overall pattern of distribution of forest cover, the shape, area and juxtaposition of remaining forest patches and the quality of forest cover also play major roles in determining how valuable forests will be to wildlife and people alike.
The current science generally supports minimum forest habitat requirements between 30 and 50 percent, with some limited evidence that the upper limit may be even higher, depending on the organism/species phenomenon under investigation or land-use/resource management planning regime being considered/used.
As shown in Figure 13, 20 percent of the Rideau-Smiths Falls catchment contains 974 hectares of upland forest and 148 hectares of lowland forest (treed swamps) versus the 34 percent of woodland cover existing in the Middle Rideau subwatershed. In the Town of Smiths Falls, 17 percent of the drainage area contains 161 hectares of upland forest and 16 hectares of lowland forest (treed swamps). This is less than the 30 percent of forest cover that is identified as the minimum threshold required to sustain forest birds according to the Guideline and which may only support less than one half of potential species richness and marginally healthy aquatic systems. When forest cover drops below 30 percent, forest birds tend to disappear as breeders across the landscape.
Figure 13 Woodland cover and forest interior in the catchment
Woodland (Patch) Size
According to the Ministry of Natural Resources’ Natural Heritage Reference Manual (Second Edition), larger woodlands are more likely to contain a greater diversity of plant and animal species and communities than smaller woodlands and have a greater relative importance for mobile animal species such as forest birds.
Bigger forests often provide a different type of habitat. Many forest birds breed far more successfully in larger forests than they do in smaller woodlots and some rely heavily on forest interior conditions. Populations are often healthier in regions with more forest cover and where forest fragments are grouped closely together or connected by corridors of natural habitat. Small forests support small numbers of wildlife. Some species are “area-sensitive” and tend not to inhabit small woodlands, regardless of forest interior conditions. Fragmented habitat also isolates local populations, especially small mammals, amphibians and reptiles with limited mobility. This reduces the healthy mixing of genetic traits that helps populations survive over the long run (Conserving the Forest Interior. Ontario Extension Notes, 2000).
The Environment Canada Guideline also notes that for forest plants that do not disperse broadly or quickly, preservation of some relatively undisturbed large forest patches is needed to sustain them because of their restricted dispersal abilities and specialized habitat requirements and to ensure continued seed or propagation sources for restored or regenerating areas nearby.
The Natural Heritage Reference Manual continues by stating that a larger size also allows woodlands to support more resilient nutrient cycles and food webs and to be big enough to permit different and important successional stages to co-exist. Small, isolated woodlands are more susceptible to the effects of blowdown, drought, disease, insect infestations, and invasions by predators and non-indigenous plants. It is also known that the viability of woodland wildlife depends not only on the characteristics of the woodland in which they reside, but also on the characteristics of the surrounding landscape where the woodland is situated. Additionally, the percentage of forest cover in the surrounding landscape, the presence of ecological barriers such as roads, the ability of various species to cross the matrix surrounding the woodland and the proximity of adjacent habitats interact with woodland size in influencing the species assemblage within a woodland.
Rideau-Smiths Falls Catchment
In the Rideau-Smiths Falls catchment (in 2014), 71 (36 percent) of the 346 woodland patches are very small, being less than one hectare in size. Another 114 (58 percent) of the woodland patches ranging from one to less than 20 hectares in size tend to be dominated by edge-tolerant bird species. The remaining 13 (six percent of) woodland patches range between 20 and 85 hectares in size and may support a few area-sensitive species and some edge intolerant species, but will be dominated by edge tolerant species.
There are no woodland patches in the catchment exceeding the 100 plus hectare size needed to support 60 percent of edge-intolerant, forest dependent, area sensitive birds; nor are there any patches that top 200 hectares, which according to the Environment Canada Guideline will support 80 percent of edge-intolerant forest bird species (including most area sensitive species) that prefer interior forest habitat conditions.
Table 9 presents a comparison of woodland patch size in 2008 and 2014 along with any changes that have occurred over that time in the catchment. An increase (of 11 ha) has been observed in the overall woodland patch area between the two reporting periods with most change in woodland area occurring in the 50 to 100 hectare woodland patch size class range.
Table 9 Woodland patches in the Rideau-Smiths Falls Catchment (2008 and 2014)
* Includes treed swamps
Town of Smiths Falls
Table 10 presents a comparison of woodland patch size in 2008 and 2014 along with any changes that have occurred over that time in the Town of Smiths Falls. An increase (of six hectares) has been observed in the overall woodland patch area between the two reporting periods with most change in occurring in the 20 to 50 hectare woodland patch size class range.
Table 10 Woodland patches in the Town of Smiths Falls (2008 and 2014)
* Includes treed swamps
Forest Interior
The forest interior is habitat deep within woodlands. It is a sheltered, secluded environment away from the influence of forest edges and open habitats. Some people call it the “core” or the “heart” of a woodland. The presence of forest interior is a good sign of woodland health, and is directly related to the woodland’s size and shape. Large woodlands with round or square outlines have the greatest amount of forest interior. Small, narrow woodlands may have no forest interior conditions at all. Forest interior habitat is a remnant natural environment, reminiscent of the extensive, continuous forests of the past. This increasingly rare forest habitat is now a refuge for certain forest-dependent wildlife; they simply must have it to survive and thrive in a fragmented forest landscape (Conserving the Forest Interior. Ontario Extension Notes, 2000).
The Natural Heritage Reference Manual states that woodland interior habitat is usually defined as habitat more than 100 metres from the edge of the woodland and provides for relative seclusion from outside influences along with a habitat have centres that are more clearly buffered against the edge effects of agricultural activities or more harmful urban activities than those without.
Rideau-Smiths Falls Catchment
In the Rideau-Smiths Falls catchment (in 2014), the 198 woodland patches contain 39 forest interior patches (Figure 13) that occupy less than one percent (36 ha.) of the catchment land area (versus the five percent of interior forest in the Middle Rideau Subwatershed). This is below the ten percent figure referred to in the Environment Canada Guideline that is considered to be the minimum threshold for supporting edge intolerant bird species and other forest dwelling species in the landscape.
Most patches (38) have less than 10 hectares of interior forest, 32 of which have small areas of interior forest habitat less than one hectare in size.
Between 2008 and 2014, there has been a notable change in the number of woodland patches containing smaller areas of interior habitat (Table 11) with an increase of 18 woodlands containing less than one hectare of interior forest over the period. This has occurred as a result of the loss of interior forest habitat in the larger woodland patches in the catchment.
Table 11 Woodland Interior in the Rideau-Smiths Falls catchment (2008 and 2014)
Town of Smiths Falls
Table 12 presents a comparison of woodland forest interior in Smiths Falls between 2008 and 2014. The majority of woodlands have less than one hectare of interior forest with the only change occurring as a result of the ingrowth of one hectare of interior forest over that time.
Table 12 Woodland interior in the Town of Smiths Falls (2008 and 2014)
Wetland Cover
Wetlands are habitats forming the interface between aquatic and terrestrial systems. They are among the most productive and biologically diverse habitats on the planet. By the 1980s, according to the Natural Heritage Reference Manual, 68 percent of the original wetlands south of the Precambrian Shield in Ontario had been lost through encroachment, land clearance, drainage and filling.
Wetlands perform a number of important ecological and hydrological functions and provide an array of social and economic benefits that society values. Maintaining wetland cover in a watershed provides many ecological, economic, hydrological and social benefits that are listed in the Reference Manual and which may include:
- contributing to the stabilization of shorelines and to the reduction of erosion damage through the mitigation of water flow and soil binding by plant roots
- mitigating surface water flow by storing water during periods of peak flow (such as spring snowmelt and heavy rainfall events) and releasing water during periods of low flow (this mitigation of water flow also contributes to a reduction of flood damage)
- contributing to an improved water quality through the trapping of sediments, the removal and/or retention of excess nutrients, the immobilization and/or degradation of contaminants and the removal of bacteria
- providing renewable harvesting of timber, fuel wood, fish, wildlife and wild rice
- contributing to a stable, long-term water supply in areas of groundwater recharge and discharge
- providing a high diversity of habitats that support a wide variety of plants and animals
- acting as “carbon sinks” making a significant contribution to carbon storage
- providing opportunities for recreation, education, research and tourism
Historically, the overall wetland coverage within the Great Lakes basin exceeded 10 percent, but there was significant variability among watersheds and jurisdictions, as stated in the Environment Canada Guideline. In the Rideau Valley Watershed, it has been estimated that pre-settlement wetland cover averaged 37 percent using information provided by Ducks Unlimited Canada (2010) versus the 21 percent of wetland cover existing in 2014 derived from DRAPE imagery analysis.
Using the same dataset, it is estimated that pre-settlement (historic) wetland cover averaged 32 percent in the Middle Rideau subwatershed versus the 27 percent of cover existing in 2014. This decline in wetland cover is also evident in the Rideau-Smiths Falls catchment (as seen in Figure 14) where there has been a 10 percent decrease in the area of wetland cover from pre-settlement times to the present (as summarized in Table 13).
Figure 14 Catchment wetland cover
While there has been a reported ten percent decrease in wetland cover in the Rideau-Smiths Falls catchment from pre-settlement times, the remaining wetland cover in 2014 remains above the ecological thresholds cited in the Environment Canada Guideline. Nonetheless, in order to maintain critical hydrological and ecological functions along with related recreational and economic benefits provided by these wetland habitats in the catchment, a “no net loss” of currently existing wetlands should be employed to ensure the continued provision of tangible benefits accruing from them for landowners and surrounding communities.
Table 13 Wetland cover in the Middle Rideau subwatershed and Rideau-Smiths Falls catchment (Historic to 2014)
4. Stewardship and Protection
The RVCA and its partners are working to protect and enhance environmental conditions in the Middle Rideau Subwatershed. Figure 15 shows the location of all stewardship projects completed in the Rideau-Smiths Falls catchment.
Rural Clean Water Projects
From 2009 to 2014, two septic system replacements, two livestock fencing projects and one well replacement were completed. Between 2003 and 2008, two septic system replacements and two well upgrades were carried out. Prior to 2003, one septic system replacement was completed. Total value of all 10 projects is $48,337 with $34,499 of that amount funded through grant dollars from the RVCA.
Figure 15 Stewardship and potential restoration locations
Tree Planting Projects
The location of RVCA Tree Planting Program projects is shown in Figure 15. Prior to 2003, 48,050 trees were planted at six sites, resulting in the reforestation of 24 hectares. Total value of all eight projects is $105,098 with $36,023 of that amount coming from various fundraising sources. No trees were planted in the catchment between 2004 and 2014.
Through the RVCA Butternut Recovery Program, an additional 60 butternut trees were planted in the Rideau-Smiths Falls catchment, as part of efforts to introduce healthy seedlings from tolerant butternuts into various locations across Eastern Ontario.
Onatrio Drinking Water Stewardship Projects
Figure 15 shows the location of all Ontario Drinking Water Stewardship Program (ODWSP) projects in the Rideau-Smiths Falls catchment. This Ministry of the Environment funded program has supported four projects between 2009 and 2014. Total project value is $15,796 with landowners receiving $7,985 to support three livestock fencing projects and one well decommissioning.
Valley, Stream, Wetland and Hazard Land Regulation
The Rideau-Smiths Falls catchment covers 48 square kilometres with 15 square kilometres (or 31 percent) of the drainage area being within the regulation limit of Ontario Regulation 174/06 (Figure 16), giving protection to wetland areas and river or stream valleys that are affected by flooding and erosion hazards.
Wetlands occupy 13.2 sq. km. (or 27 percent) of the catchment. Of these wetlands, 7.5 sq. km (or 57 percent) are designated as provincially significant and included within the RVCA regulation limit. This leaves the remaining 5.7 sq. km (or 43 percent) of wetlands in the catchment outside the regulated area limit.
Of the 75.8 kilometres of stream in the catchment, regulation limit mapping has been plotted along 34.6 kilometers of streams (representing 46 percent of all streams in the catchment). Some of these regulated watercourses (22.2 km or 29 percent of all streams) flow through regulated wetlands; the remaining 12.4 km (or 36 percent) of regulated streams are located outside of those wetlands. Plotting of the regulation limit on the remaining 41.2 km (or 54 percent) of streams requires identification of flood and erosion hazards and valley systems.
Within the regulation limit, “development” and “site alteration” require RVCA permission. The “alteration to waterways” provision of Ontario Regulation 174/06 applies to all watercourses.
Figure 16 RVCA regulation limits
Vulnerable Drinking Water Areas
The Intake Protection Zone around the Town of Smiths Falls municipal drinking water source is located within the Rideau-Smiths Falls catchment (Figure 16). This zone is subject to mandatory policies in the Mississippi-Rideau Source Protection Plan developed under the Clean Water Act. These policies specifically regulate land uses and activities that are considered drinking water threats, thereby reducing the risk of contamination of the municipal drinking water source.
The Rideau-Smiths Falls drainage catchment is also considered to have a Highly Vulnerable Aquifer. This means that the nature of the overburden (thin soils, fractured bedrock) does not provide a high level of protection for the underlying groundwater making the aquifer more vulnerable to contaminants released on the surface. The Mississippi-Rideau Source Protection Plan includes policies that focus on the protection of groundwater region-wide due to the fact that most of the region, which encompasses the Mississippi and Rideau watersheds, is considered Highly Vulnerable Aquifer.
For detailed maps and policies that have been developed to protect drinking water sources, please go to the Mississippi-Rideau Source Protection Region website at www.mrsourcewater.ca to view the Mississippi-Rideau Source Protection Plan.
The Town of Smiths Falls has recently completed a number of Master Planning initiatives (as part of its Official Plan review process) including: the Downtown Revitalization and Waterfront Integration Master Plan (2013), the Downtown Community Improvement Plan (2013), the Smiths Falls Cultural Master Plan (2013) as well as the priorities of the 2011-2013 “Turning Point” Economic Development Action Plan, culminating in the release of the Smiths Falls 2034 Official Plan (2014).
The following list of “Challenges/Issues” and “Opportunities/Actions” contains some of those items (identified with an asterisk) taken from the Official Plan (with input from staff) and Master Planning documents that have implications for the sustainable use and management of the water resources of the Rideau River and Canal and lands adjacent to the waterfront in the Town of Smtihs Falls.
5. Challenges/Issues
Water Quality
Shorelines/Headwaters
- All riparian areas fall below the recommended 75 percent naturally vegetated riparian, 30 metre wide shoreline buffer target. In the Rideau-Smiths Falls catchment, the Rideau River and its tributaries contain 67 percent natural land cover (made up of wetland and woodland) and 33 percent non-natural land cover (comprised of crop and pastureland, rural/urban settlements and roads and railways). In the Town of Smiths Falls, the riparian buffer is made up of 53 percent non-natural land cover (comprised of commercial, industrial, institutional and residential areas, roads and railways and crop and pastureland) and 47 percent natural land cover (made up of wetland and woodland). Along the Rideau River and Canal in the Town, the shoreline buffer is made up of 71 percent non-natural land cover (commercial, institutional, residential areas and roads and railways) and 29 percent natural land cover (wetland and woodland)
- Emerald ash borer poses a significant threat to the ecology of the catchment, given the prominence of ash trees along shorelines and in riparian and wetland areas. Many tree stands are predominantly ash and with their anticipated loss, it is unclear what will replace them and the overall effect of their collective demise on the physical and natural functions/values they provide for erosion, water quality and fish and wildlife habitat protection. Infestation is now evident in many parts of the catchment and treatment of trees is an expensive but viable option for specific specimens
Water Levels
- Fluctuating water levels and high spring runoff turbidity in the Rideau River pose challenges to the Town of Smiths Falls municipal drinking water source. These variables are factors associated with seasonal damming and operation of the Poonamalie Dam by the Parks Canada Agency *
Development
- Private land ownership on the north shore of the lower basin in the Town of Smiths Falls poses a challenge for a cohesive parkland loop either side of the Rideau Canal *
- Reduced channel width of the Rideau Canal through Smiths Falls, particularly east of Parks Canada’s Combined Lock Station, limits the ability to develop marina or harbour infrastructure in close proximity to the Downtown *
Natural Hazards
- Floodplain mapping for the Middle Rideau is over 35 years out of date for that reach of the Rideau River extending from Smiths Falls to Burritts Rapids
Land Cover/Natural Heritage System
- Connection between natural heritage resources is an important ecological function which has yet to be analyzed or studied in Smiths Falls *
- The catchment contains 567 ha of unevaluated wetland (occupying 12 percent of its total area) that provides many important social, hydrological, biological and ecological functions/services. Although not under imminent threat from development activity, they do remain vulnerable to drainage and land clearing activities in the absence of any regulatory and planning controls that would otherwise protect them
6. Opportunities/Actions
Water Resources
Town of Smiths Falls
- Work with the Town to minimize the adverse effects on ground and surface water quality and quantity and protect property and natural resources from stormwater runoff generated in Smiths Falls as it proceeds with its Downtown and Waterfront Revitalization and other development projects with respect to:
- Major development or redevelopment that will be preceded by the preparation of a watershed or subwatershed plan prepared in consultation with the Conservation Authority and Provincial ministries and the Town *
- The servicing strategy for the north-eastern part of the Town which should take into account the need for watershed and/or sub-watershed planning *
- Subdivision and site plan applications where no sub-watershed plan or environmental management plan exists. Under these circumstances, the Town will review stormwater site management plans in consultation with the Conservation Authority *
- Assist the Town in protecting its water resources (aquifer/recharge areas, streams, creeks, river and riparian vegetation) that are vital to its health as a safe drinking water source, as well as the ecological and economic health of the region and its residents by:
- Restricting or carefully regulating public and private development in shoreline areas adjacent to the Rideau River and Canal so as to protect and preserve the health, function and stability of these waterbodies *
- Preserving water quality when establishing appropriate public access and recreational uses on land adjacent to the river and canal, creeks, wetlands and other significant water courses *
- Restricting or carefully regulating public and private development in upland areas so as to prevent uncontrolled runoff that could impact the health and stability of these waterbodies *
- Extend the RVCA’s Baseline Water Quality Monitoring Program to include monitoring sites through the Town of Smiths Falls to enable regular reporting of surface water quality along the Rideau River and Canal
Townships of Drummond/North Elmsley and Montague
- Educate residents/landowners about septic system care by providing information about sewage system maintenance (i.e., when to pump out septic systems and holding talks)
- Offer septic repair/replacement project funding provided by the Rideau Valley Rural Clean Water Program to residents/landowners
- Promote efforts to reduce pollutant loadings to the Rideau River and Canal through application of shoreline, stormwater and agricultural best management practices; also consider using low impact development (LID) methods to improve the quality and reduce the amount of stormwater runoff reaching the Rideau River ecosystem. This may be particularly beneficial in areas with extensive impervious surfaces (i.e., asphalt, concrete, buildings, and severely compacted soils) or on sensitive waterfront properties (with steep slopes/banks, shallow/impermeable soils
- Continue to protect the water resources of the Rideau River and Canal through implementation of municipal (Town of Smiths Falls, Townships of Drummond/North Elmsley and Montague) and agency (MOE, Parks Canada) land use planning and development policies, practices and standards
Shorelines/Headwaters
- Much of the shoreline of the Rideau River and Canal is held in public ownership, so that the best opportunity for shoreline restoration/enhancement rests with the Town of Smiths Falls, the Townships of Drummond/North Elmsley, Montague and Rideau Lakes and the Parks Canada Agency. RVCA offers its Shoreline Naturalization Program to municipalities, agencies, and landowners to assist with shoreline re-vegetation
- RVCA and its partners (Town of Smiths Falls, the municipalities of Drummond/North Elmsley, Montague and Rideau Lakes and Parks Canada Agency) are to continue educating landowners about the value and importance of natural shorelines and waterfront property best management practices with respect to shoreline use, development and shoreline vegetation retention and enhancement
- Protect the riparian buffer along the shoreline of the Rideau River and its tributaries during the development approvals process through adherence to and enforcement of municipal land-use policies and zoning standards
- Support the Town of Smiths Falls through its economic renewal, as it goes about implementing its Economic Development Action Plan (2011), Downtown Revitalization and Waterfront Integration Master Plan (2013) and Official Plan (2014) that “supports the retention or restoration of riparian corridors” (p.23). Efforts are to be focused on the Rideau River and Canal corridor including the 1) The “Lower Town” Waterfront Redevelopment Area; 2) The Rideau Canal and Waterfront Greenway; 3) The Lower Reach Park and Old Sly’s Lock area and 4) The Upper Reach and Swale Wetland. Specific projects associated with these areas of focus along the Town’s Waterfront include:
- Shoreline naturalization of the Rideau River and Canal in Lower Reach Park *
- Construction of a boardwalk and interpretative signage along the Rideau River and Canal *
- Completion of a cohesive parkland loop along the north and south shore of the Rideau River and Canal *
- Water based recreational infrastructure (beaches, boat launches, docks) along Lower Reach Park *
- Target shoreline restoration at sites identified in this report (shown as “Other riparian land cover” in Figure 1 and “Potential Riparian/Shoreline Restoration” in Figure 11) and explore other restoration and enhancement opportunities along the Rideau River and its tributaries
Development
Town of Smiths Falls
- There is potential for the redevelopment and intensification of the Town’s Water Treatment Plant and Mills Complex and along the Northshore of the upper basin. As parcels along the shoreline are quite large with several being under public ownership (Town or Parks Canada), there is a greater opportunity for a Private-Public-Partnership Project to make things happen
- Large parcels adjacent to the Swale wetland pose potential for restoration and repair as former industrial lands. Partnerships with REAL and Parks Canada can be leveraged to assist in providing interpretive centres/panels to encourage stewardship of the natural resource
- The potential relocation of the seasonal campground on the southern shore of the upper basin in the Town presents an opportunity for new tourism commercial and recreational uses while creating a visible gateway to the Rideau waterfront from Lombard Street
Rideau-Smiths Falls Catchment
- Collectively work with approval authorities (Township of Drummond/North Elmsley, Township of Montague, Township of Rideau Lakes, Town of Smiths Falls, Conservation Authority, the Health Unit and Mississippi-Rideau Septic System Office) to consistently implement current land use planning and development policies for water quality and shoreline protection adjacent to the Rideau River and Canal and other catchment streams (i.e., to attain a minimum 30 metre development setback from water)
- Explore ways and means to more effectively enforce and implement conditions of land-use planning and development approval to achieve net environmental gains (particularly with respect to rehabilitating or protecting naturally vegetated shorelines and water quality)
- Encourage Committees of Adjustment to take advantage of technical and environmental information and recommendations forthcoming from planning and environmental professionals
- Municipalities and agencies are encouraged to strengthen natural heritage and water resources official plan policies and zoning provisions (water setbacks, frontage and naturalized shorelines and wetland protection) where deemed appropriate
- Utilize RVCA subwatershed and catchment reports to help develop/revise official plan policies to protect surface water resources and the natural environment (including woodlands, wetlands and shoreline cover)
- Consider establishing RVCA regulations limits to protect additional wetlands
Land Cover/Natural Heritage System
- Support the Town of Smiths Falls with implementation of its Environmental Vision and related policies set out in the Official Plan with an emphasis on naturally vegetated areas (including parks and trail corridors), natural features (The Swale Wetland), corridors (including utility corridors) and ecological functions, mostly associated with the Town’s woodlands, wetlands, waterways (canal/river), unevaluated wetlands and previously disturbed areas that could be re-naturalized, all of which form the basis of a Natural Heritage System for Smiths Falls and natural connections for a Natural Heritage Linkage providing both recreation and leisure opportunities as well as habitat corridors. The concept of a “Natural Heritage System” is important to the long term sustainable function of the natural heritage resources of the area. The Conservation Authority will cooperate with Smiths Falls and senior levels of government to analyze and study connections between natural heritage features and areas to help define the natural heritage system in a meaningful way (that is an integral part of the Town’s economic renewal) (S.F.O.P., p.20)
Natural Hazards
- Continue to assist the Town of Smiths Falls with efforts to incorporate safety considerations into the Town’s planning and decision making processes to reduce those risks associated with development in hazardous areas, which can result in significant costs to individuals and the community, including major property damage as well as the potential loss of life and avoid expenses borne by the Town to repair and replace public infrastructure in hazardous areas (S.F.O.P., p.50)
- RVCA provides ongoing “hazardous lands management” support to the Town of Smiths Falls, the Townships of Drummond/North Elmsley, Montague and Rideau Lakes through its Hazardous Lands (flood plain, unstable slope) Management Program. In this catchment, this will require that updated floodplain mapping be prepared for the reach of the Rideau River extending from Smiths Falls to Burritts Rapids
Full Catchment Report
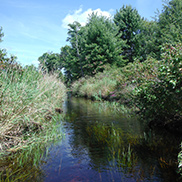
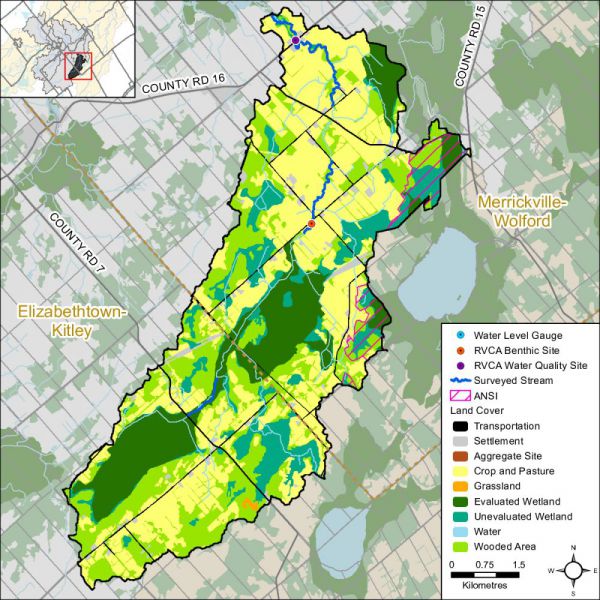


")
")

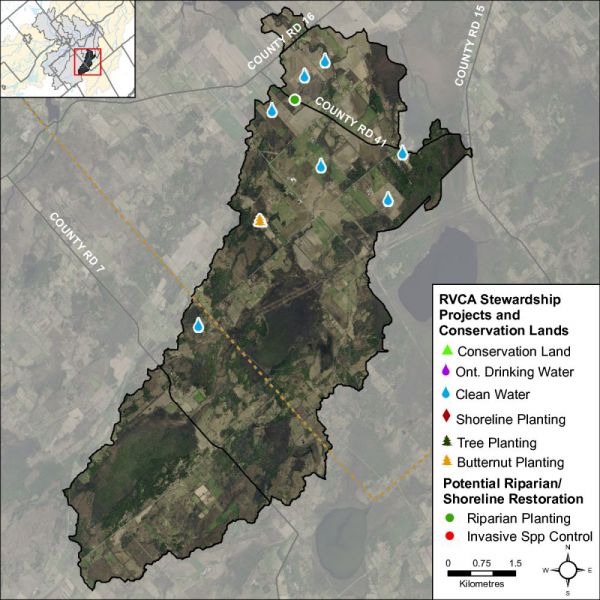
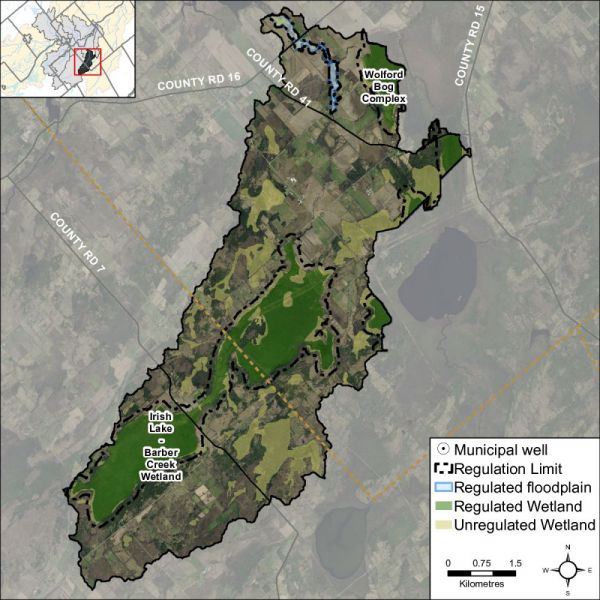
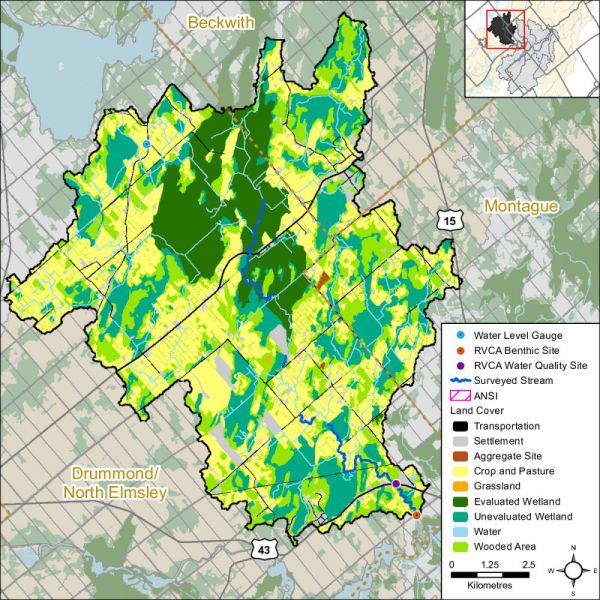


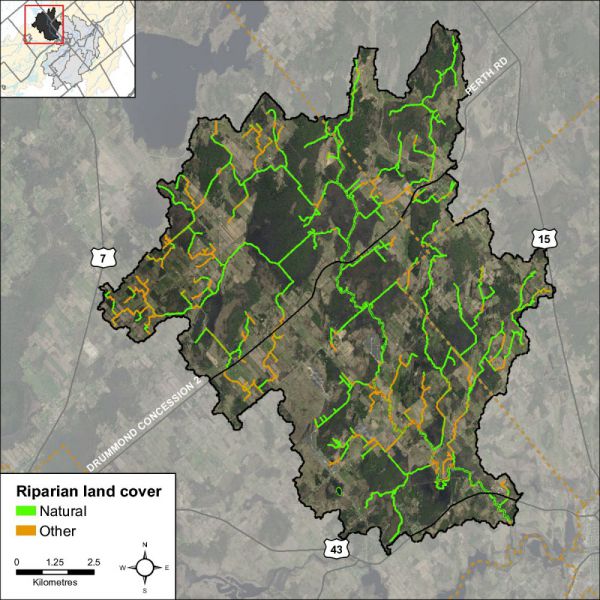


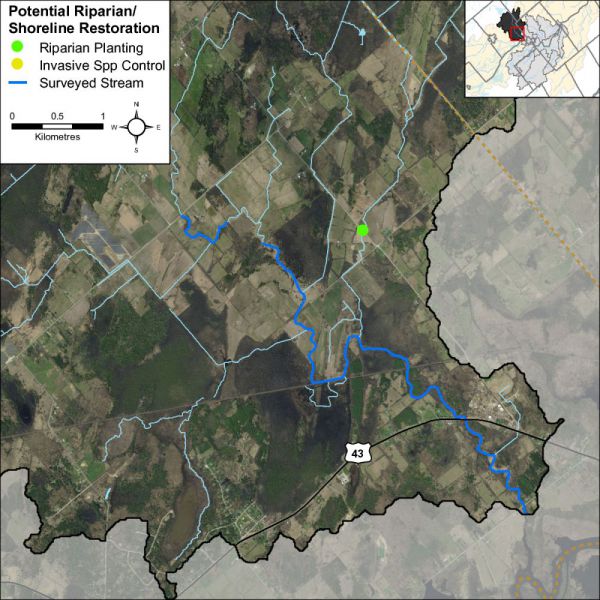

")


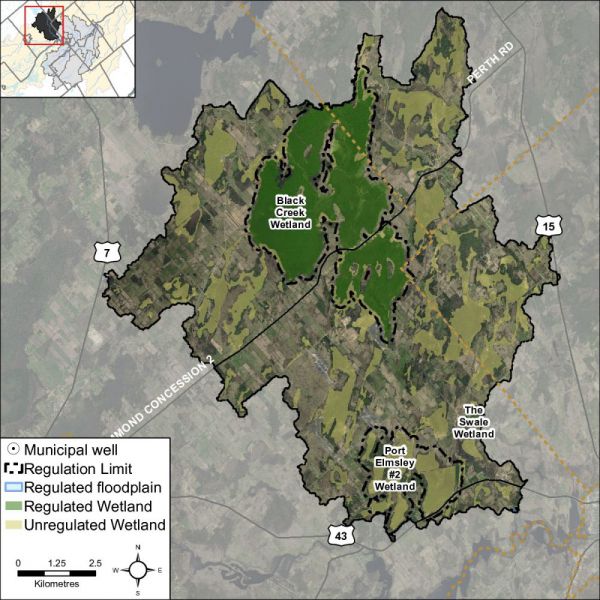
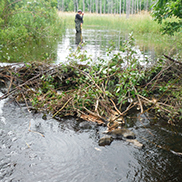


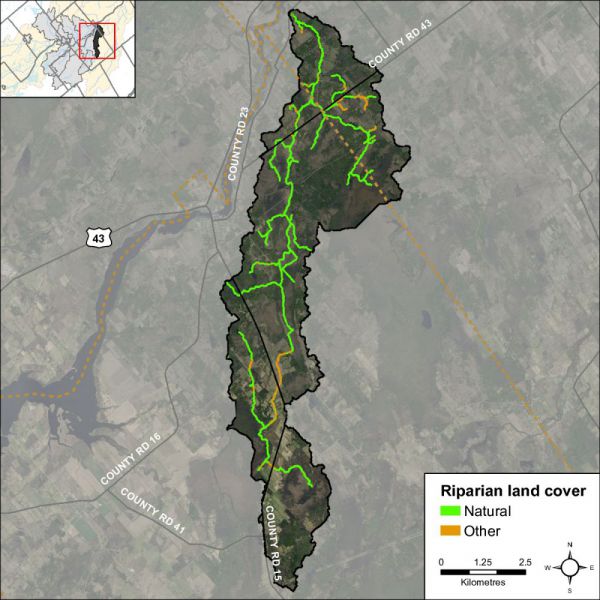


")
")

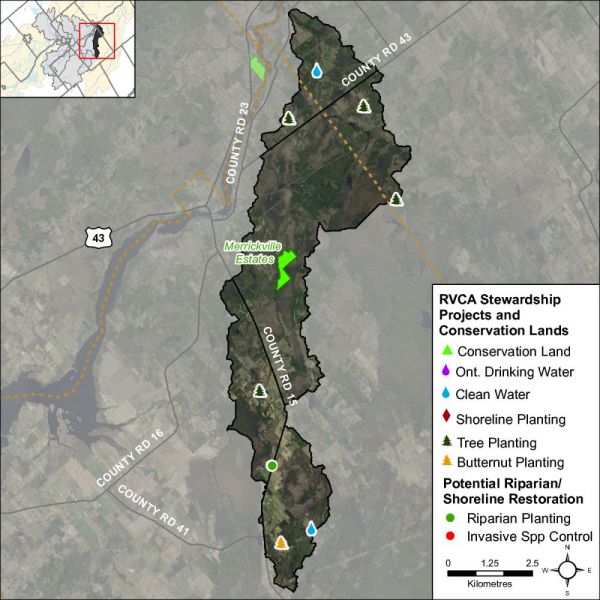
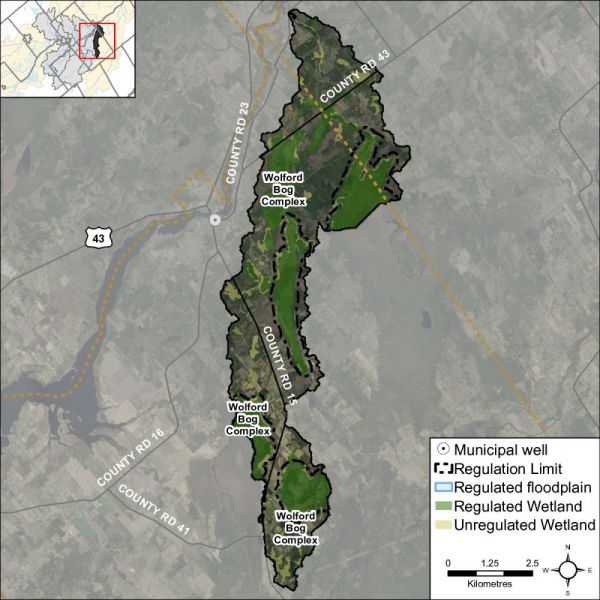


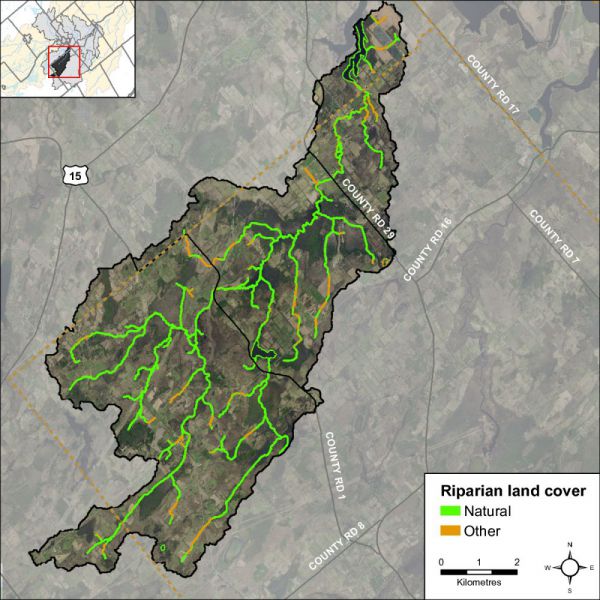


 captured downstream of the Motts Mills Dam")


")
")


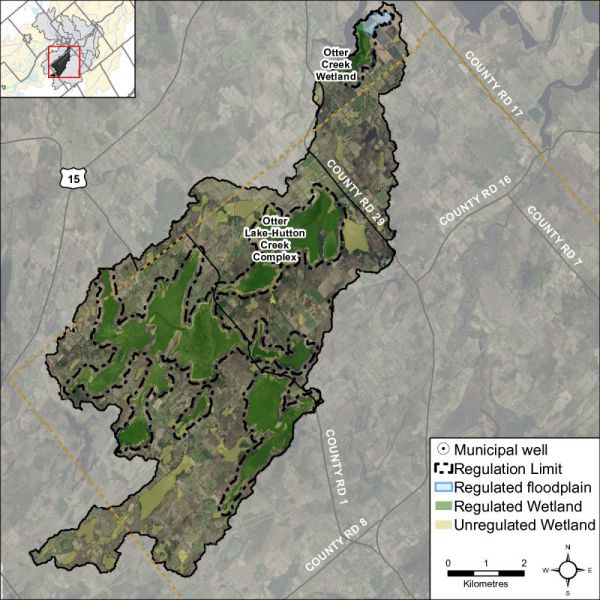


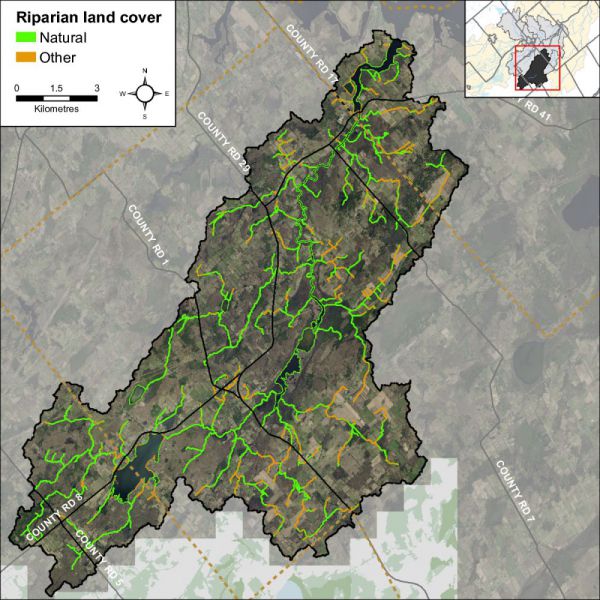


")
")

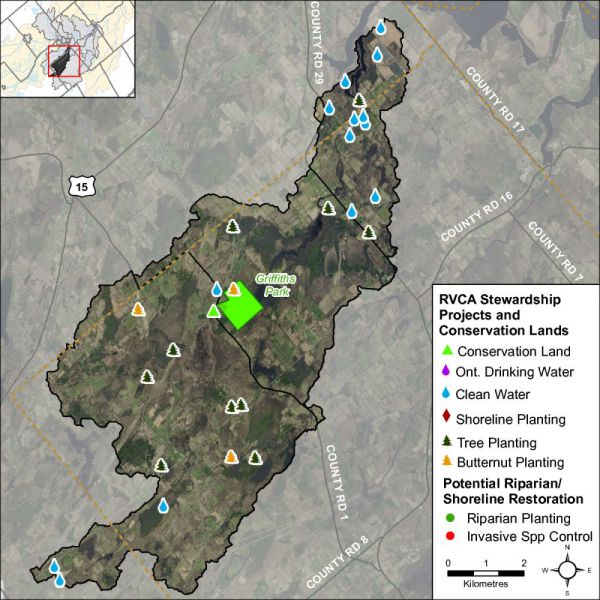


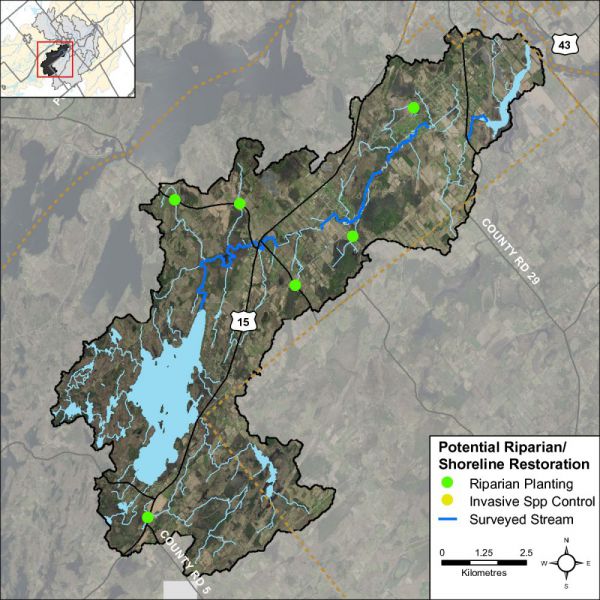
")

")


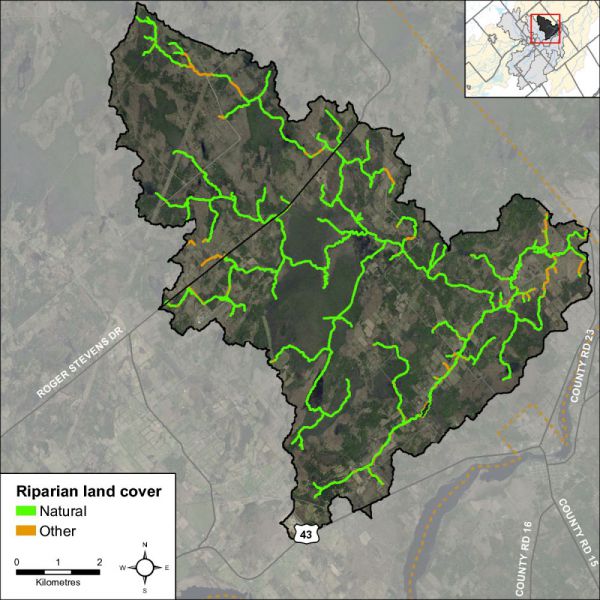


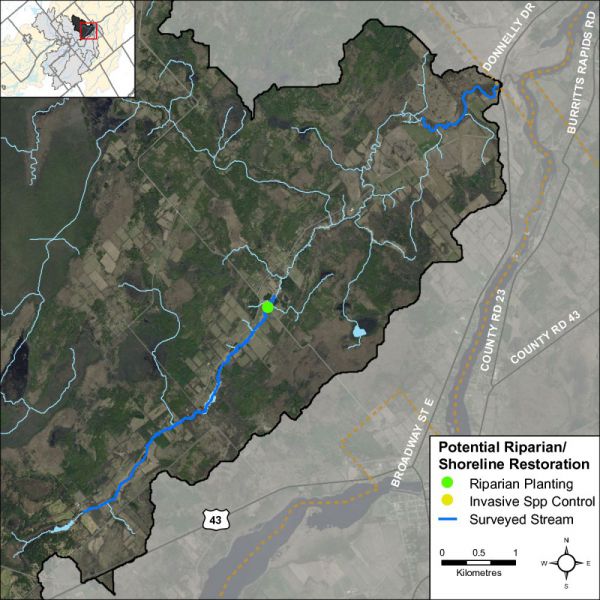
")
")

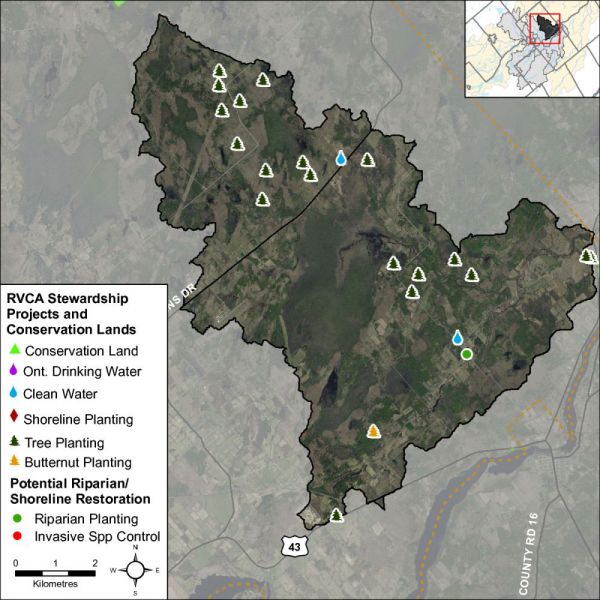
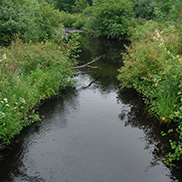


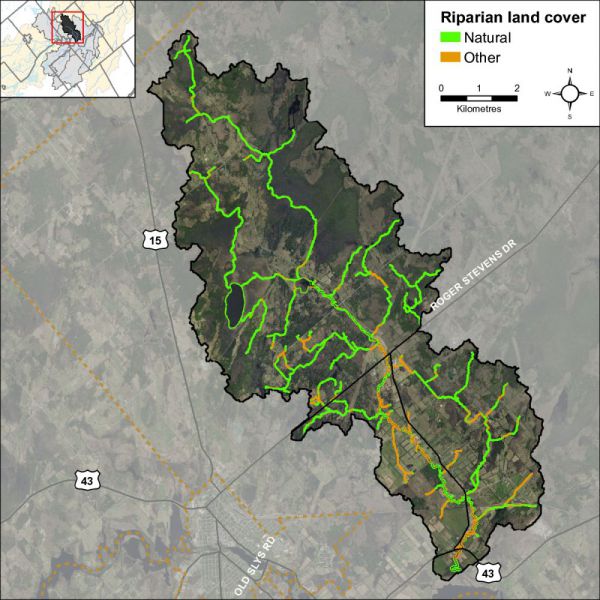


")
")


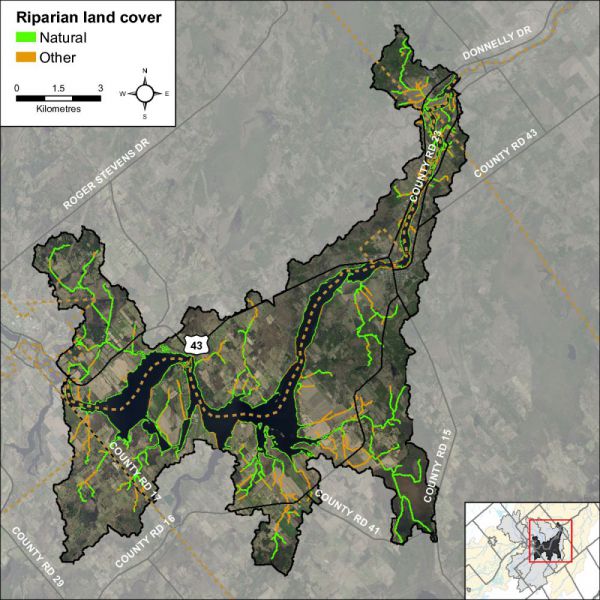


")
")

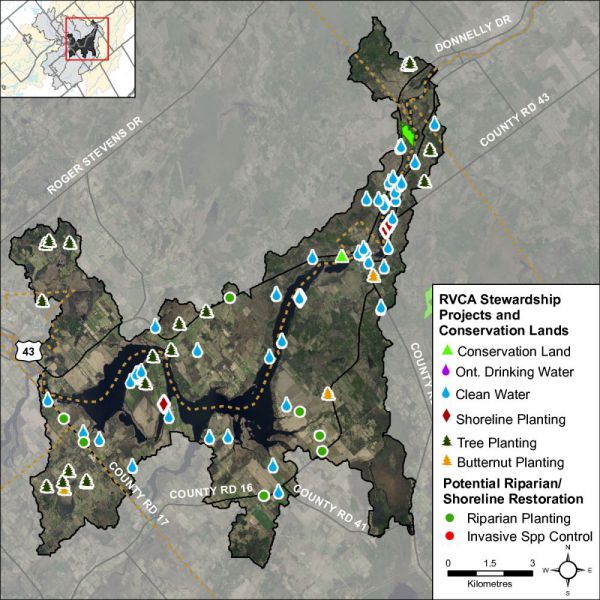
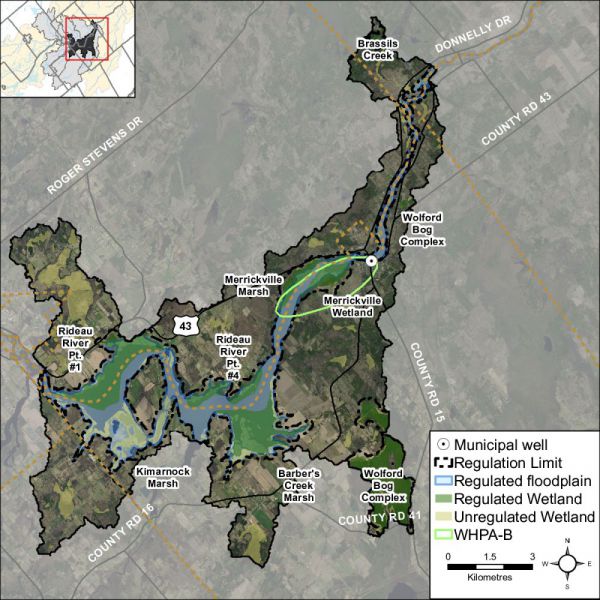
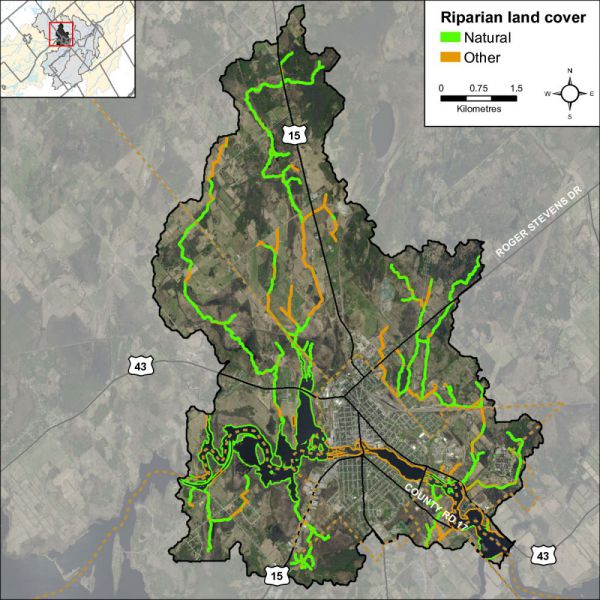


")