Open menu

Bobs Lake - Crow Lake

Bobs Lake - Crow Lake

BOBS AND CROW LAKE CATCHMENTS

Tay River Subwatershed Report 2017

BOBS AND CROW LAKE CATCHMENTS

LandCoverTay-RiverBobs-Lake-001-001Figure 1a Land cover in the Bobs Lake catchment
LandCoverTay-RiverCrow-Lake-001-001Figure 1b Land cover in the Crow Lake catchment

The RVCA produces individual reports for 14 catchments in the Tay River subwatershed. Using data collected and analyzed by the RVCA through its watershed monitoring and land cover classification programs, surface water quality and in-stream conditions are reported for the Tay River, Tay Watershed lakes and Tay tributaries along with a summary of environmental conditions for the surrounding countryside every six years, which includes analysis of data collected through the programs along with local information provided by stakeholders up to 2017.

This information is used to better understand the effects of human activity on our water resources, allows us to better track environmental change over time and helps focus watershed management actions where they are needed the most to help sustain the ecosystem services (cultural, aesthetic and recreational values; provisioning of food, fuel and clean water; regulation of erosion/natural hazard protection and water purification; supporting nutrient/water cycling and habitat provision) provided by the catchment’s lands and forests and waters (Millennium Ecosystem Assessment 2005).


The following sections of this report are a compilation of that work for the Bobs and Crow Lake catchments.

Table of Contents: Bobs and Crow Lake Catchments Report
Catchment Facts Section 1.0
Water Quality Conditions Section 2.0
Riparian Conditions Section 3.0
Land Cover Section 4.0
Stewardship and Water Resources Protection Section 5.0
Accomplishments Section 6.0
Challenges/Issues Section 7.0
Actions/Opportunities Section 8.0


For other Tay River catchments and the Tay River Subwatershed Report, please see Rideau Valley Conservation Authority Subwatershed Reports.

1.0 Bobs and Crow Lake Catchments: Facts

1.1 General/Physical Geography

Area of Municipality in the Bobs Lake Catchment
Township South Frontenac Tay Valley Central Frontenac Rideau Lakes
Km2 91 23 17 2
Percent 69 17 13 1
Area of Municipality in the Crow Lake Catchment
Township Central Frontenac South Frontenac
Km2 30 21
Percent 59 41

Geology/Physiography

The Bobs and Crow Lake catchments reside within part of the physiographic region known as the Algonquin Highlands. In the Tay River subwatershed, this ancient and hilly geologic region is made up of such Precambrian rocks as marble, conglomerates, and dark or colour banded granite-like rocks. A veneer of glacial drift (glacial till, sand etc.) overlies the bedrock.

Drainage Area

Bobs Lake Catchment: 132 square kilometers; occupies 16 percent of the Tay River subwatershed; three percent of the Rideau Valley watershed.

Crow Lake Catchment: 51 square kilometers; occupies six percent of the Tay River subwatershed; one percent of the Rideau Valley watershed.

Stream Length

Bobs Lake Catchment: All tributaries (including headwater streams) 324 km.

Crow Lake Catchment: All tributaries (including headwater streams) 132 km.

1.2 Vulnerable Areas

Aquifer Vulnerability

Bobs Lake Catchment: Mississippi-Rideau Source Water Protection program has mapped several small parts of this catchment as Significant Groundwater Recharge Areas and all of the catchment as a Highly Vulnerable Aquifer (HVA). There are no Well-Head Protection Areas in the catchment.

Crow Lake Catchment: Mississippi-Rideau Source Water Protection program did not identify any Significant Groundwater Recharge Areas and mapped all of the catchment as a Highly Vulnerable Aquifer (HVA). There are no Well-Head Protection Areas in the catchment.

Wetland Hydrology

A watershed model developed by the RVCA in 2009 was used to study the hydrologic function of wetlands in the Rideau Valley Watershed, including those found in the Bobs and Crow Lake catchments.

1.3 Conditions at a Glance

Aggregates

Bobs Lake Catchment: Three aggregate licenses within the catchment along with some sand and gravel areas of secondary and tertiary significance.

Crow Lake Catchment: One aggregate license within the catchment.

Fish Community/Thermal Regime

Bobs Lake Catchment: Warm, cool and cold water recreational and baitfish fishery with five species observed in Davern Creek during 2016. The fish community has not been sampled extensively along streams and headwater drainage features in the Bobs Lake catchment.

Crow Lake Catchment: Warm, cool and cold water recreational and baitfish fishery. The fish community has not been sampled along streams and headwater drainage features in the Crow Lake catchment.

Headwater Drainage Features

Bobs Lake Catchment: Predominantly natural and wetland features with two features having mixed modifications and six features have been straightened, historically.

Crow Lake Catchment: Predominantly natural and wetland features with only one feature with anthropogenic modifications. 

Land Cover Type (2014) - Bobs Lake Catchment
Bobs Lake Catchment Woodland Water Wetland Crop-Pasture Meadow-Thicket Settlement Transportation
Percent 50 25 13 4 3 2 2
Land Cover Type (2014) - Crow Lake Catchment
Crow Lake Catchment Woodland Wetland Water Meadow-Thicket Crop-Pasture Settlement Transportation
Percent 60 18 12 4 2 2 2
 
Land Cover Change (2008 to 2014) - Bobs Lake Catchment
Bobs Lake Catchment Woodland Meadow-Thicket Crop-Pasture Wetland Settlement Water Transportation
Hectares -20 -5 -1 +15 +5 +4 +2
Land Cover Change (2008 to 2014) - Crow Lake Catchment
Crow Lake Catchment Woodland Wetland Settlement
Hectares -6 +5 +2
Shoreline Cover Type: Bobs Lake Catchment (30 m. riparian area; 2014)
Catchment Percent Bobs Lake Percent Streams Percent
Woodland 56 Woodland 79 Wetland 46
Wetland 32 Settlement 14 Woodland 44
Settlement 5 Transportation 3 Crop-Pasture 4
Crop-Pasture 3 Wetland 2 Meadow-Thicket 3
Transportation 2 Crop-Pasture 1 Transportation 2
Meadow-Thicket 2 Meadow-Thicket 1 Settlement 1
Shoreline Cover Type: Crow Lake Catchment (30 m. riparian area; 2014)
Catchment Percent Crow Lake Percent Streams Percent
Woodland 56 Woodland 65 Woodland 51
Wetland 35 Settlement 21 Wetland 42
Settlement 3 Transportation 7 Meadow-Thicket 3
Meadow-Thicket 3 Wetland 4 Transportation 2
Transportation 2 Crop-Pasture 2 Crop-Pasture 1
Crop-Pasture 1 Meadow-Thicket 1 Settlement 1
 
Significant Natural Features
Bobs Lake Catchment 
Doran Lake Provincially Significant Wetland
Green Bay Non-Provincially Significant Wetland
Maberly Bog Area of Natural and Scientific Interest, Life Science Regional Candidate
Michael's Creek Marsh Provincially Significant Wetland
Species at Risk (Elemental Occurrence)
Status Bobs Lake Catchment
Endangered Northern Myotis --- --- --- ---
Threatened Blanding's Turtle Bobolink Cerulean Warbler Eastern Meadowlark Eastern Whip-poor-will
Special Concern Bald Eagle Common Five-lined Skink Louisiana Waterthrush Snapping Turtle ---
Status Crow Lake Catchment
Endangered Northern Myotis --- --- ---
Threatened Bobolink Eastern Meadowlark Eastern Whip-poor-will ---
Special Concern Eastern Milksnake Eastern Ribbonsnake Peregrine Falcon Snapping Turtle
Water Quality (Surface Chemistry) for the Protection of Aquatic Life
Bobs Lake    Bob Lake Bobs Lake Bobs Lake Bobs Lake Bobs Lake Bobs Lake Bobs Lake Crow Lake Rock Lake
Buck Bay Central Narrows East Basin Green Bay Mill Bay Mud Bay Norris Bay West Basin    
Fair to Very Good Fair to Good Fair to Very Good Good to Very Good Poor to Good Fair to Very Good Fair to Good Fair to Very Good Good to Very Good Fair to Very Good

Water Wells

Bobs Lake Catchment: Approximately 610 operational private water wells in the Bobs Lake catchment. Groundwater uses are mainly domestic but also include livestock, public and commercial uses.

Crow Lake Catchment: Approximately 140 operational private water wells in the Crow Lake catchment. Groundwater uses are mainly domestic but also include livestock and commercial uses.

1.4 Catchment Care

Environmental Management

The Greater Bobs and Crow Lake Association prepared the Stewardship Plan for Bobs and Crow Lakes (2007) to provide a summary of what is known about the Bobs and Crow Lake catchments along with the community’s vision for the lakes and a list of its main concerns and actions to address them.

Development in, and adjacent to, the Doran Lake and Michael's Creek Marsh Provincially Significant Wetlands along with the Green Bay Non-Provincially Significant Wetland in the Bobs Lake catchment is subject to Ontario Regulation 174-06 (entitled “Development, Interference with Wetlands and Alterations to Shorelines and Watercourses”) that protects the hydrologic function of the wetland and also protects landowners and their property from natural hazards (flooding, fluctuating water table, unstable soils) associated with them.

Bobs Lake catchment: One Environmental Compliance Approval was sought for a private sewage works.

Crow Lake catchment: One Environmental Compliance Approval was sought for a campground sewage works.

Environmental Monitoring

Chemical surface (in-stream/lake) water quality collection by the RVCA since 2003 (see Section 2 of this report).

Bobs Lake catchment: Thirty-nine drainage feature assessments were conducted by the RVCA in 2016 at road crossings in the catchment. The protocol measures zero, first and second order headwater drainage features and is a rapid assessment method characterizing the amount of water, sediment transport, and storage capacity within headwater drainage features (see Section 3.2 of this report).

Crow Lake catchment: Twenty-two drainage feature assessments were conducted by the RVCA in 2016 at road crossings in the catchment. The protocol measures zero, first and second order headwater drainage features and is a rapid assessment method characterizing the amount of water, sediment transport, and storage capacity within headwater drainage features. (see Section 3.3 of this report).

Classification of Bobs and Crow Lake catchment land cover types derived by the RVCA from colour aerial photography that was acquired during the spring of 2008 and 2014 (see Section 4.1 of this report).

The Mississippi Rideau Septic System Office has conducted 149 mandatory septic system inspections and 2 voluntary septic system re-inspections on 119 properties around Bobs Lake from 2004 to 2017 (see Section 5.5 of this report).

Groundwater chemistry information is available from the Ontario Geological Survey for one well (#13-AG-048) in the Bobs Lake catchment.

Stewardship

Bobs Lake catchment: Thirty-one stewardship projects were completed by landowners with assistance from the RVCA (see Section 5 of this report).

Crow Lake catchment: Sixteen stewardship projects were completed by landowners with assistance from the RVCA (see Section 5 of this report).

2.0 Bobs and Crow Lake Catchments: Water Quality Conditions

Surface water quality conditions are monitored by the Rideau Valley Conservation Authority’s (RVCA) Watershed Watch Program, which monitors watershed lakes to assess nutrient concentrations, water clarity, dissolved oxygen availability and pH. Figure 2 shows the locations of monitoring sites in the Bobs Lake catchment and Figure 3 shows the locations of monitoring sites in the Crow Lake catchment.

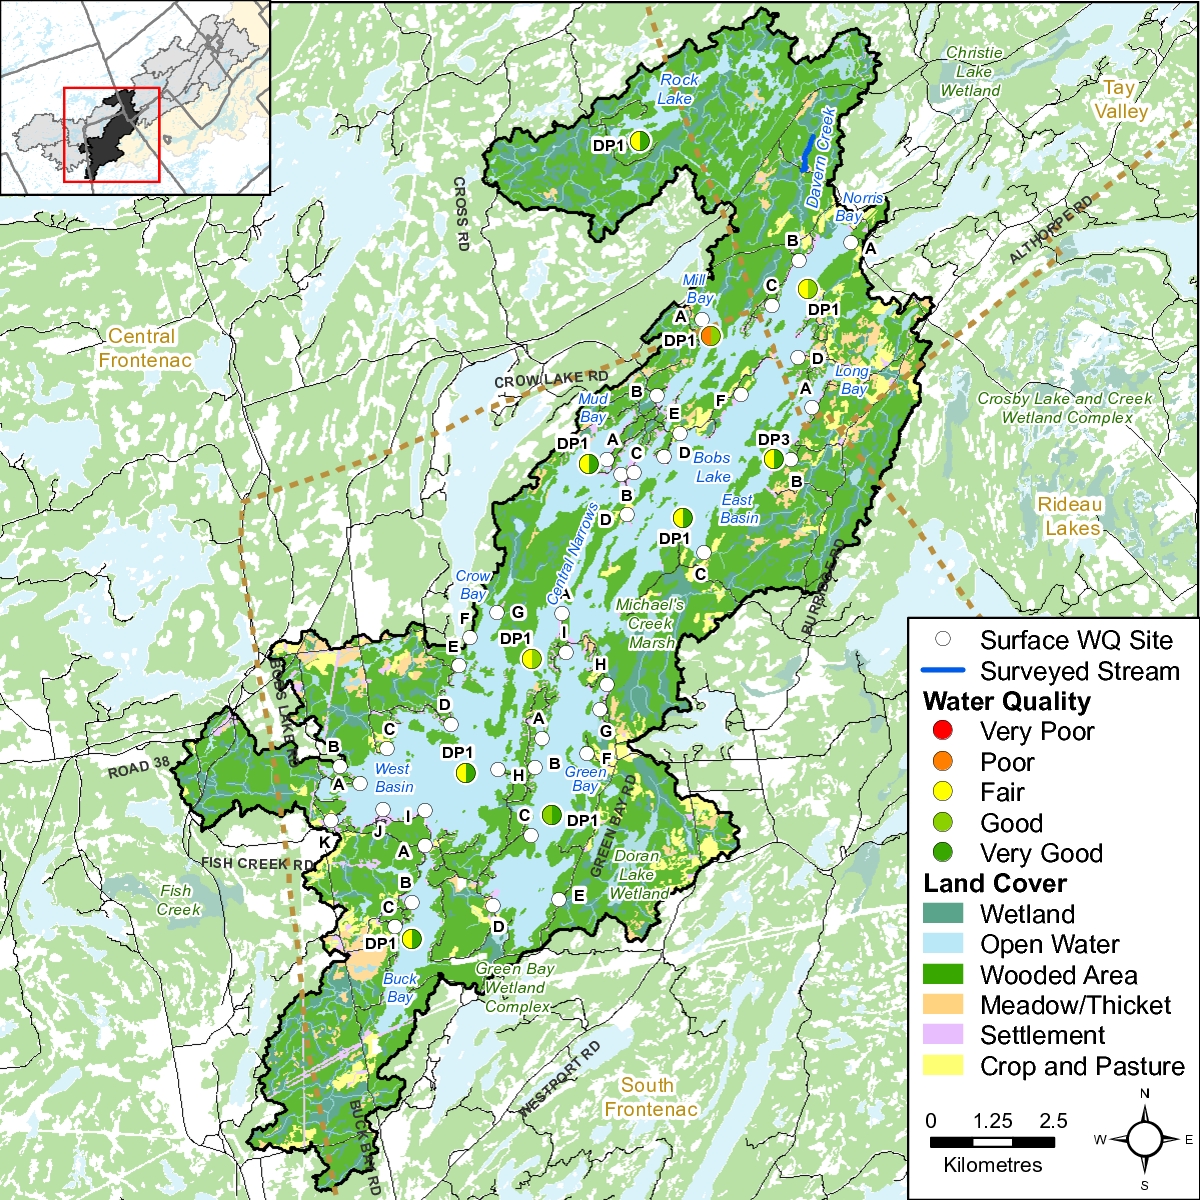
Figure 2 Water quality monitoring sites on Bobs and Rock Lakes
 

WaterQualityTay-RiverCrow-Lake-001-001

Figure 3 Water quality monitoring sites on Crow Lake
 

Water Quality Rating in the Bobs Lake Catchment

"Poor" indicates that water quality is frequently threatened or impaired with conditions that often depart from natural or desirable levels. A "Fair" rating indicates that water quality is usually protected but is occasionally threatened or impaired; conditions sometimes depart from natural or desirable levels. A rating of "Good" indicates that only a minor degree of threat or impairment is observed and conditions rarely depart from natural or desirable levels. ” Very Good” describes water quality as protected with virtual absence of threat or impairment; conditions are very close to natural or pristine levels. Each parameter is evaluated against established guidelines to determine water quality conditions. Those parameters that frequently exceed guidelines are presented below. Data has been analyzed over the 2006-2017 period for general trends and conditions. Table 1 shows the overall rating for the monitored surface water quality sites within the catchment and Table 2 outlines the Water Quality Index (WQI) scores and their corresponding ratings.

 
Table 1 Water Quality Index ratings for Bobs and Rock Lakes
SiteLocation 2006-20082009-20112012-20142015-2017
DP1Bobs Lake-Buck BayGood (88)Fair (65)Fair (77)Very Good (100)
DP1Bobs Lake-Green BayGood (88)Good (88)Very Good (100)Good (88)
DP1Bobs Lake-West BasinVery Good (100)Fair (77)Good (88)Very Good (100)
DP1Bobs Lake-Mud BayGood (88)Fair (65)Fair (77)Very Good (100)
DP1Bobs Lake-Norris BayGood (88)Good (88)Fair (77)Good (88)
DP1/DP3Bobs Lake-East Basin/Long BayGood (88)Fair (77)Fair (77)Good (88)
DP1Bobs Lake-Central NarrowsGood (88)Fair (77)Fair (77)Good (88)
DP1Bobs Lake-Mill BayPoor (59)Poor (48)Good (88)Fair (76)
 
Table 2 Water Quality Index ratings and corresponding index scores (RVCA terminology, original WQI category names in brackets)
RatingIndex Score
Very Good (Excellent)95-100
Good80-94
Fair65-79
Poor (Marginal)45-64

2.1 Bobs Lake Water Quality

Surface water quality conditions in Bobs Lake have been monitored by RVCA’s Watershed Watch Program since 2006. Data from the deep point sites (DP1 & DP3) has been used to calculate the WQI ratings for Bobs Lake.  In most basins (of which there are nine in Bobs Lake that are monitored), conditions were influenced by moderate nutrient concentrations, good oxygen availability and clear water. The following discussion explains how each of the monitored water quality parameters contributes to the water quality in each basin.

This report also considers data from additional shoreline sites that are monitored around the lake. These sites have not been included in the calculation of the CCME WQI rating, as they are not monitored with the same frequency as the deep point site. However, they do provide important information on water quality conditions in the near shore areas. For locations of shoreline sites please see Figure 2.

2.1.1 Bobs Lake: Buck Bay Water Quality

2.1.1.1 Buck Bay Nutrients

Total phosphorus (TP) is used as a primary indicator of excessive nutrient loading and contributes to abundant aquatic vegetation growth and depleted dissolved oxygen levels. The Provincial Water Quality Objective (PWQO) is used as the TP Guideline and states that in lakes, concentrations greater than 0.020 mg/l indicate an excessive amount of TP within the water column. Concentrations below 0.010 mg/l are generally considered to be minimal and unlikely to have problems associated with nutrient loading. Total Kjeldahl nitrogen (TKN) is used as a secondary indicator of nutrient loading. RVCA uses a guideline of 0.500 mg/l to assess TKN within surface waters1.

Nutrients at the Buck Bay Deep Point

TP and TKN sampling results collected by the RVCA are presented in Figures 3 to 6. Variability has occurred in the sampled TP concentrations at this site (Figure 3 and 4), however no significant trend2 was observed in the 2006-2017 dataset. Eighty-nine percent of samples analyzed for TP were less than the TP guideline and the average concentration was 0.013 mg/l (Table 3). TKN concentration also showed variability and an overall decline in concentrations was observed (Figures 5 and 6). Ninety-three percent of reported results were below the TKN guideline and the average TKN concentration was 0.362 mg/l (Table 3).

 
Figure 3 Total phosphorous sampling results at deep point site (DP1) on Buck Bay, 2006-2017
Figure 4 Average total phosphorus results at the deep point site (DP1) on Buck Bay, 2006-2017.
 
Figure 5 Total Kjeldahl nitrogen sampling results at deep point site (DP1) on Buck Bay, 2006-2017
Figure 6 Average total Kjeldahl nitrogen sampling results at the deep point site (DP1) on Buck Bay, 2006-2017.
Table 3 Summary of nutrient results for Buck Bay over the monitoring period, 2006-2017.
Total Phosphorous 2006-2017
SiteAverage (mg/l)Below Guideline No. Samples 
DP10.01389%44
Total Kjeldahl Nitrogen 2006-2017
SiteAverage (mg/l)Below Guideline No. Samples 


Overall, the data presented indicates that nutrient concentrations may be considered moderate with few instances of exceedance in the mid-lake, deep water site on Buck Bay.

 
Nutrients around Buck Bay

The average nutrient concentrations at monitored shoreline sites around the lake vary from year to year (Figures 7 and 8). Please note that in the 2006-2017 monitoring period only site A was sampled yearly; sites B, C and D were sampled in 2008 and 2013.

Average total phosphorous concentrations are below the TP guideline at all sites for all years monitored. The opposite is true for average TKN concentrations that exceed the guideline at all monitored sites. Site A is in a busy area near the entrance to Buck Bay from West Basin where increased boat traffic and sediment disturbance may contribute to the elevated results.

Figure 7 Average total phosphorous concentrations at shoreline monitoring sites on Buck Bay, 2006-2017.
Figure 8 Average total Kjeldahl nitrogen concentrations at shoreline monitoring sites on Buck Bay, 2006-2017
 
Summary of Buck Bay Nutrients

Buck Bay nutrient concentrations are generally below the guidelines, with few exceedances. It is possible that occasional problems with nutrient enrichment (i.e. algal blooms or excessive plant growth) may be observed in shallow, sheltered bays.

Efforts such as the diversion of runoff and enhanced shoreline buffers are important to continue to protect and enhance water quality and reduce future nutrient increases. This is particularly important for roadways and dwellings that boarder the lake. Nutrient exceedances may be partially attributed to the natural aging of a lake and basin characteristics. All residents can help minimize their impact on the lake by reducing nutrient inputs through practices such as proper maintenance of septic systems, keeping shorelines natural and using phosphate free soaps and detergents. Promotion of sound stewardship and protection around lake are important to maintain and protect water quality conditions into the future.

2.1.1.2 Buck Bay Water Clarity

Water clarity is measured using a Secchi disk during each deep point sample. Table 4 summarizes the recorded depths with an average depth of 4.7 m and shows that all readings have exceeded the minimum PWQO of 2 m indicating that algae in the water column is not at excessive levels (good water clarity). Less than 2 m will indicate overproduction in a lake or significant inputs to the water column that are limiting light availability. Figure 9 shows that no individual reading has been below the guideline and measured depths range from 2.1 m to 7.25 m. No trend was observed within the 2006-2017 data set, indicating that Secchi depths have not changed significantly over this period.

 
Table 4 Summary of Secchi depths recorded at the deep point (DP1) on Buck Bay, 2006-2017.
Secchi 2006-2017
SiteAverage (m)Above GuidelineNo. Samples 
 
Figure 9 Recorded Secchi depths at the deep point site (DP1) on Buck Bay, 2006-2017
Figure 9 Recorded Secchi depths at the deep point site (DP1) on Buck Bay, 2006-2017.
 
Summary of Buck Bay Water Clarity

Waters in Buck Bay are very clear and sufficient sunlight is able to penetrate the water column to support aquatic life and provide sufficient visibility for safe recreational use (boating, swimming).

2.1.1.3 Buck Bay Fish Habitat

Two other factors, dissolved oxygen/temperature and pH were also assessed to provide an overall sense of the health of Buck Bay from a fish habitat perspective. 

2.1.1.3.1 Buck Bay Dissolved Oxygen and Temperature

The red bars in Figure 10 show the depths where suitable conditions exist for warm water fish species (temperature less than 25°C and dissolved oxygen greater than 4 mg/l) at the deep point site. The vertical axis represents the total lake depth at each site where the profile is taken. Suitable conditions typically decline throughout the summer to about 11 m of the water column. Overall, no significant change was noted in conditions through the 2006-2017 period.

 
Figure 10. Depths suitable for warm water fish species at the deep point site (DP1) on Buck Bay, 2006-2017.
Figure 10. Depths suitable for warm water fish species at the deep point site (DP1) on Buck Lake, 2006-2017.


2.1.1.3.2 Buck Bay pH

pH is a basic water quality parameter used to assess the acidity of water, an important factor for aquatic life. Figure 11 shows monitored pH values over the 2006-2017 period.

Figure 11. pH concentrations at the monitored deep point site (DP1) on Buck Bay, 2006-2017.
Figure 11. pH concentrations at the deep point site (DP1) on Buck Bay, 2006-2017.
 

The majority of samples for both time periods were within guidelines established by the Canadian Council of Minister's of the Environment which state that pH should be between 6.5 and 9 to protect aquatic life (Table 5). Surface water’s that are found to be more alkaline (higher pH) are common in many regions of the Tay River subwatershed and can generally be attributed to the geology rather than anthropogenic activities.  Biological activities such as increased photosynthesis from algal blooms and plant growth may also influence pH.

Table 5 Summary of pH results at the deep point site (DP1) on Buck Bay, 2006-2017
pH 2006-2017
SiteAverage (mg/l)Within Guideline No. Samples 
 
Summary of Water Quality for Fish Habitat in Buck Bay

Overall the water chemistry data at the deep point describes suitable habitat conditions for fish species such as bass, walleye and pike. There is some evidence that the warming of the water column in the late summer/fall and limited oxygen availability at deeper depths may minimize the amount of habitat for some more sensitive species. pH conditions are within the end of the range recommended for the protection of aquatic life. Overall, the data indicates a healthy environment for aquatic species.


2.1.1.4 Buck Bay E. Coli

E. coli is sampled at monitored shoreline sites twice each sampling season. E. coli data was not used in the calculations of the WQI rating for the lake due to differences in sampling frequency and site locations, the results are summarized in Table 6. Throughout the 2006-2017 period 97 percent of samples were below the E. coli guideline of 100 colony forming units (CFU) per 100 ml set by the PWQO; across the lake the count at the geometric mean3 was 6 CFU/100ml (Table 6).

Table 6 Summary of E. coli results for Buck Bay, 2006-2017
E. coli 2006-2017
SiteGeometric mean (CFU/100ml)Below Guideline No. Samples 


Figure 12 show the distribution of counts across all shoreline sites. Site A is the only site monitored each year and typically has minimal counts and indicates that bacterial pollution should not be a concern. All sites fell well below the guideline of 100 CFU/100ml.

Figure 12.  Geometric mean of E. coli counts at monitored shoreline sites on Buck Bay, 2006-2017
Figure 12 Geometric mean of shoreline sites monitored on Buck Bay, 2006-2017
 
Summary of Buck Bay Bacterial Contamination

The results presented above provide evidence that bacterial contamination is not a significant concern in Buck Bay and the water should be safe for recreational use such as swimming and boating.


2.1.2 Bobs Lake: Green Bay Water Quality

2.1.2.1 Green Bay Nutrients

Total phosphorus (TP) is used as a primary indicator of excessive nutrient loading and contributes to abundant aquatic vegetation growth and depleted dissolved oxygen levels. The Provincial Water Quality Objective (PWQO) is used as the TP Guideline and states that in lakes, concentrations greater than 0.020 mg/l indicate an excessive amount of TP within the water column. Concentrations below 0.010 mg/l are generally considered to be minimal and unlikely to have problems associated with nutrient loading. Total Kjeldahl nitrogen (TKN) is used as a secondary indicator of nutrient loading. RVCA uses a guideline of 0.500 mg/l to assess TKN within surface waters.

Nutrients at the Green Bay Deep Point

TP and TKN sampling results collected by the RVCA are presented in Figures 13 to 16. Variability has occurred in the sampled TP concentrations at this site (Figure 13 and 14), however no significant trend was observed in the 2006-2017 dataset. TP results for Green Bay are consistently low, all samples analyzed for TP were less than the TP guideline and the average concentration was 0.009 mg/l (Table 7). TKN concentration also showed variability; however, similar to TP results no trend was observed (Figures 15 and 16). Ninety-five percent of reported results were below the TKN guideline and the average TKN concentration was 0.314 mg/l (Table 7).

 
 Figure 13 Total phosphorous sampling results at deep point site (DP1) on Green Bay, 2006-2017
Figure 13  Total phosphorus samples results at the deep point site (DP1) on Green Bay, 2006-2017
Figure 14 Average total phosphorus results at the deep point site (DP1) on Green Bay, 2006-2017.
 
Figure 15 Total Kjeldahl nitrogen sampling results at deep point site (DP1) on Green Bay, 2006-2017
Figure 15 Total Kjeldahl nitrogen sampling results at deep point site (DP1) on Green Bay, 2006-2017  Figure 16 Average total phosphorus results at the deep point site (DP1) on Green Bay, 2006-2017.
Figure 16 Average total Kjeldahl nitrogen results at the deep point site (DP1) on Green Bay, 2006-2017.
 
Table 7 Summary of nutrient results for Green Bay over the monitoring period, 2006-2017.
Total Phosphorous 2006-2017
SiteAverage (mg/l)Below Guideline No. Samples 
DP10.009100%44
Total Kjeldahl Nitrogen 2003-2008
SiteAverage (mg/l)Below Guideline No. Samples 


Overall, the data presented indicates that nutrient concentrations may be considered very low with few instances of exceedance in the mid-lake, deep water site on Green Bay.

Nutrients around Green Bay

The average nutrient concentrations at monitored shoreline sites around the lake vary from year to year (Figures 17 and 18). Please note that in the 2006-2017 monitoring period only sites D, F, and H were sampled yearly; sites A, B, C, E, G and I were sampled in 2008 and 2013.

Average total phosphorous concentrations are below the TP guideline at all sites; site D tends to have elevated results relative to other sites though results can still be considered low to moderate  (Figure 17). Average TKN concentrations were also below the guideline at all monitored sites; as with TP concentrations, TKN is also slightly elevated at site D relative to other monitored sites (Figure 18). Site D is in a shallow portion of the bay in close proximity to a roadway, it is possible that runoff from this road is contributing to elevated nutrient concentrations at this site.

 Figure 17 Average total phosphorous concentrations at shoreline monitoring sites on Green Bay, 2006-2017.
Figure 17 Average total phosphorous concentrations at shoreline monitoring sites on Green Bay, 2006-2017.
Figure 18 Average total Kjeldahl nitrogen concentrations at shoreline monitoring sites on Green Bay, 2006-2017.
 
 
Summary of Green Bay Nutrients

Green Bay nutrient concentrations are generally below the guidelines, with very instances of elevated results. It is possible that occasional problems with nutrient enrichment (i.e. algal blooms or excessive plant growth) may be observed in shallow, sheltered bays or following periods of heavy runoff.

Green Bay nutrient concentrations are generally below the guidelines, with very instances of elevated results. It is possible that occasional problems with nutrient enrichment (i.e. algal blooms or excessive plant growth) may be observed in shallow, sheltered bays or following periods of heavy runoff.

Efforts such as the diversion of runoff and enhanced shoreline buffers are important to continue to protect and enhance water quality and reduce future nutrient increases. This is particularly important for roadways and dwellings that boarder the lake. Nutrient exceedances may be partially attributed to the natural aging of a lake and basin characteristics. All residents can help minimize their impact on the lake by reducing nutrient inputs through practices such as proper maintenance of septic systems, keeping shorelines natural and using phosphate free soaps and detergents. Promotion of sound stewardship and protection around lake are important to maintain and protect water quality conditions into the future.

2.1.2.2 Green Bay Water Clarity

Water clarity is measured using a Secchi disk during each deep point sample. Table 8 summarizes the recorded depths with an average depth of 5.1 m and shows that all readings have exceeded the minimum PWQO of 2m indicating that algae in the water column is not at excessive levels (good water clarity). Less than 2 m will indicate overproduction in a lake or significant inputs to the water column that are limiting light availability. Figure 19 shows that no individual reading has been below the guideline and measured depths range from 2.9 m to 7.9 m. No trend was observed within the 2006-2017 data set, indicating that Secchi depths have not change significantly over this period.

Table 8 Summary of Secchi depths recorded at the deep point (DP1) on Green Bay, 2006-2017.
Secchi 2006-2017
SiteAverage (m)Above GuidelineNo. Samples
 
Figure 19 Recorded Secchi depths at the deep point site (DP1) on Green Bay, 2006-2017.
 
Summary of Green Bay Water Clarity

Waters in Green Bay are very clear and sufficient sunlight is able to penetrate the water column to support aquatic life and provide sufficient visibility for safe recreational use (boating, swimming).

2.1.2.3 Green Bay Fish Habitat

Two other factors, dissolved oxygen/temperature and pH were also assessed to provide an overall sense of the health of Green Bay from a fish habitat perspective.


2.1.2.3.1 Green Bay Dissolved Oxygen and Temperature

The red bars in Figure 20 show the depths where suitable conditions exist for warm water fish species (temperature less than 25°C and dissolved oxygen greater than 4 mg/l) at the deep point site. The vertical axis represents the total lake depth at each site where the profile is taken. Suitable conditions typically decline throughout the summer to about 21 m of the water column. Overall, no significant change was noted in conditions through the 2006-2017 period.

Figure 20. Depths suitable for warm water fish species at the deep point site (DP1) on Green Bay, 2006-2017.
Figure 20 Depths suitable for warm water fish species at the deep point site (DP1) on Green Bay, 2006-2017.
 

2.1.2.3.2 Green Bay pH

pH is a basic water quality parameter used to assess the acidity of water, an important factor for aquatic life. Figure 21 shows monitored pH values over the 2006-2017 period.

Figure 21. pH concentrations at the deep point sites (DP1) on Green Bay, 2006-2017.
Figure 21 pH concentrations at the deep point sites (DP1) on Green Bay, 2006-2017.
 

The majority of samples (95%, table 9) for both time periods were within guidelines established by the Canadian Council of Minister's of the Environment which state that pH should be between 6.5 and 9 to protect aquatic life. Surface water’s that are found to be more alkaline (higher pH) are common in many regions of the Tay River subwatershed and can generally be attributed to the geology rather than anthropogenic activities.  Biological activities such as increased photosynthesis from algal blooms and plant growth may also influence pH.

 
Table 9 Summary of pH results at the deep point site (DP1) on Green Bay 2006-2017
pH 2006-2017
SiteAverage (mg/l)Within Guideline No. Samples 
 
Summary of Water Quality for Fish Habitat in Green Bay

Overall the water chemistry data at the deep point describes suitable habitat conditions for fish species such as bass, walleye and pike. There is some evidence that the warming of the water column in the late summer/fall and limited oxygen availability at deeper depths may minimize the amount of habitat for some more sensitive species. pH conditions are within the end of the range recommended for the protection of aquatic life. Overall, the data indicates a healthy environment for aquatic species.


2.1.2.4 Green Bay E. Coli

E. coli is sampled at monitored shoreline sites twice each sampling season. E. coli data was not used in the calculations of the WQI rating for the lake due to differences in sampling frequency and site locations, the results are summarized in Table 10. Throughout the 2006-2017 period 99 percent of samples were below the E. coli guideline of 100 colony forming units (CFU) per 100 ml set by the PWQO; across the lake the count at the geometric mean was only 3 CFU/100ml (Table 10).

Table 10 Summary of E. coli results for Green Bay, 2006-2017
E. coli 2006-2017
SiteGeometric mean (CFU/100ml)Below Guideline No. Samples 


Figure 22 Geometric mean of shoreline sites monitored on Green Bay, 2006-2017
 

Figure 22 shows the distribution of counts across all shoreline sites.  All sites fall well below the guideline of 100 CFU/100ml; site F does have elevated results relative to other monitored locations.  However, counts have been variable from year to year and as previously noted the geometric mean in any year does not exceed the guideline, therefore these results do not indicate reason for concern. Given the proximity of agricultural lands to this site it is possible that runoff from livestock or manure application may be contributing to the occasional periods of elevated results.  Improving natural shoreline cover,  buffers and fencing along this shore may help reduce runoff from surrounding land uses.

Summary of Green Bay Bacterial Contamination

The results presented above provide evidence that bacterial contamination is not a significant concern in Green Bay and the water should be safe for recreational use such as swimming and boating.

2.1.3 Bobs Lake: West Basin Water Quality

2.1.3.1 West Basin Nutrients

Total phosphorus (TP) is used as a primary indicator of excessive nutrient loading and contributes to abundant aquatic vegetation growth and depleted dissolved oxygen levels. The Provincial Water Quality Objective (PWQO) is used as the TP Guideline and states that in lakes, concentrations greater than 0.020 mg/l indicate an excessive amount of TP within the water column. Concentrations below 0.010 mg/l are generally considered to be minimal and unlikely to have problems associated with nutrient loading. Total Kjeldahl nitrogen (TKN) is used as a secondary indicator of nutrient loading. RVCA uses a guideline of 0.500 mg/l to assess TKN within surface waters.

Nutrients at the West Basin Deep Point

TP and TKN sampling results collected by the RVCA are presented in Figures 23 to 26. Variability has occurred in the sampled TP concentrations at this site (Figure 23 and 24), however no significant trend was observed in the 2006-2017 dataset. TP results for West Basin may be considered minimal, 96 percent of samples analyzed for TP were less than the TP guideline and the average concentration was 0.010 mg/l (Table 11). TKN concentration also showed variability; however similar to TP results no trend was observed (Figures 25 and 26). Ninety-three percent of reported results were below the TKN guideline and the average TKN concentration was 0.360 mg/l (Table 11).

 
Figure 23 Total phosphorus sampling results at deep point site (DP1) in the West Basin, 2006-2017
Figure 24 Average total phosphorus results at the deep point site (DP1) on Green Bay, 2006-2017.
Figure 24 Average total phosphorus results at the deep point site (DP1) in the West Basin, 2006-2017.
 
Figure 25 Total Kjeldahl nitrogen sampling results at deep point site (DP1) on West Basin, 2006-2017
Figure 25 Total Kjeldahl nitrogen sampling results at deep point site (DP1) in the West Basin, 2006-2017
Figure 25 Total Kjeldahl nitrogen sampling results at deep point site (DP1) on West Basin, 2006-2017 Figure 26 Average total phosphorus results at the deep point site (DP1) on Green Bay, 2006-2017.
Figure 26 Average total Kjeldahl nitrogen results at the deep point site (DP1) in the West Basin, 2006-2017.
 
Table 11 Summary of nutrient results for West Basin over the monitoring period, 2006-2017.
Total Phosphorous 2006-2017
SiteAverage (mg/l)Below Guideline No. Samples 
DP10.01096%45
Total Kjeldahl Nitrogen 2006-2017
SiteAverage (mg/l)Below Guideline No. Samples 

Overall, the data presented indicates that nutrient concentrations may be considered very low with few instances of elevated samples in the mid-lake, deep water site in the West Basin.

Nutrients around West Basin

The average nutrient concentrations at monitored shoreline sites around the lake vary from year to year (Figures 27 and 28). Please note that in the 2006-2017 monitoring period only sites A and B were sampled yearly; sites C, D, E, F, G, and H were sampled in 2008 and 2013, site K was sampled in 2008, 2013, 2015 and 2017.

Average total phosphorous concentrations are below the TP guideline at the majority of sites with instances of elevated concentrations at sites B and K (Figure 27). Average TKN concentrations were also below the guideline at all monitored sites; as with TP results elevated concentrations are also observed at sites B and K (Figure 28). Both of these sites are located at inflow locations and it is possible that runoff from surrounding areas is contributing to elevated concentrations.

 
Figure 27 Average total phosphorous concentrations at shoreline monitoring sites on West Basin, 2006-2017.
Figure 28 Average total Kjeldahl nitrogen concentrations at shoreline monitoring sites on West Basin, 2006-2017.
 
 
Summary of West Basin Nutrients

West Basin nutrient concentrations are generally below the guidelines, with few samples having elevated results. It is possible that occasional problems with nutrient enrichment (i.e. algal blooms or excessive plant growth) may be observed in shallow, sheltered bays or following periods of heavy runoff.

Efforts such as the diversion of runoff and enhanced shoreline buffers are important to continue to protect and enhance water quality and reduce future nutrient increases. This is particularly important for roadways and dwellings that boarder the lake. Nutrient exceedances may be partially attributed to the natural aging of a lake and basin characteristics. All residents can help minimize their impact on the lake by reducing nutrient inputs through practices such as proper maintenance of septic systems, keeping shorelines natural and using phosphate free soaps and detergents. Promotion of sound stewardship and protection around lake and throughout the catchment are important to maintain and protect water quality conditions into the future.

2.1.3.2 West Basin Water Clarity

Water clarity is measured using a Secchi disk during each deep point sample. Table 12 summarizes the recorded depths with an average depth of 4.2 m and shows that all readings have exceeded the minimum PWQO of 2m indicating that algae in the water column is not at excessive levels (good water clarity). Less than 2 m will indicate overproduction in a lake or significant inputs to the water column that are limiting light availability. Figure 29 shows that no individual reading has been below the guideline and measured depths range from 2.8 m to 6 m. No trend was observed within the 2006-2017 data set, indicating that Secchi depths have not change significantly over this period.

Table 12 Summary of Secchi depths recorded at the deep point (DP1) on West Basin, 2006-2017.
Secchi 2006-2017
SiteAverage (m)Above GuidelineNo. Samples 
 
Figure 29 Recorded Secchi depths at the deep point site (DP1) on West Basin, 2006-2017.
 
Summary of West Basin Water Clarity

Waters in West Basin are very clear and sufficient sunlight is able to penetrate the water column to support aquatic life and provide sufficient visibility for safe recreational use (boating, swimming).

2.1.3.3 West Basin Fish Habitat

Two other factors, dissolved oxygen/temperature and pH were also assessed to provide an overall sense of the health of West Basin from a fish habitat perspective. 

2.1.3.3.1 West Basin Dissolved Oxygen and Temperature

The red bars in Figure 30 show the depths where suitable conditions exist for warm water fish species (temperature less than 25°C and dissolved oxygen greater than 4 mg/l) at the deep point site. The vertical axis represents the total lake depth at each site where the profile is taken. Suitable conditions typically decline throughout the late summer/fall to about 17 m of the water column. Overall, no significant change was noted in conditions through the 2006-2017 period.

Figure 30. Depths suitable for warm water fish species at the deep point site (DP1) on West Basin, 2006-2017.
Figure 30 Depths suitable for warm water fish species at the deep point site (DP1) on West Basin, 2006-2017.


2.3.3.3.2 West Basin pH

pH is a basic water quality parameter used to assess the acidity of water, an important factor for aquatic life. Figure 31 shows monitored pH values over the 2006-2017 period.

Figure 31. pH concentrations at the deep point sites (DP1) on West Basin, 2006-2017.
Figure 31 pH concentrations at the deep point sites (DP1) on West Basin, 2006-2017.
 

All samples (100%, table 13) were within guidelines established by the Canadian Council of Minister's of the Environment which state that pH should be between 6.5 and 9 to protect aquatic life. A slight decline was noted in pH values. Anthropogenic and biological activities such as increased photosynthesis from algal blooms and plant growth may act to influence pH.

Table 13 Summary of pH results at the deep point site (DP1) on West Basin, 2006-2017
pH 2006-2017
SiteAverage (mg/l)Within Guideline No. Samples 
 
Summary of Water Quality for Fish Habitat in West Basin

Overall the water chemistry data at the deep point describes suitable habitat conditions for fish species such as bass, walleye and pike. There is some evidence that the warming of the water column in the late summer/fall and limited oxygen availability at deeper depths may minimize the amount of habitat for some more sensitive species. pH conditions are within the range recommended for the protection of aquatic life. Overall, the data indicates a healthy environment for aquatic species.


2.1.3.4 West Basin E. Coli

E. coli is sampled at monitored shoreline sites twice each sampling season. E. coli data was not used in the calculations of the WQI rating for the lake due to differences in sampling frequency and site locations, the results are summarized in Table 14. Throughout the 2006-2017 period 97 percent of samples were below the E. coli guideline of 100 colony forming units (CFU) per 100 ml set by the PWQO; across the lake the count at the geometric mean was 7 CFU/100ml (Table 14).

 
Table 14 Summary of E. coli results for West Basin, 2006-2017
E. coli 2006-2017
SiteGeometric mean (CFU/100ml)Below Guideline No. Samples 
 
Figure 32 Geometric mean of shoreline sites monitored on West Basin, 2006-2017
 

Figure 32 shows the distribution of counts across all shoreline sites.  All sites fell well below the guideline of 100 CFU/100ml, site B does have elevated results relative to other monitored locations.  However, counts have been variable from year to year and as previously noted the geometric mean in any year does not exceed the guideline. This same site also had elevated nutrient concentrations and is the inflow from Eagle Creek, it may be beneficial to examine if possible sources of nutrient/bacterial contamination could be minimized at this site to protect existing conditions and prevent against future deterioration.

Summary of West Basin E. Coli

The results presented above provide evidence that bacterial contamination is not a significant concern in West Basin and the water should be safe for recreational use such as swimming and boating.

2.1.4 Bobs Lake: Norris Bay Water Quality

2.1.4.1 Norris Bay Nutrients

Total phosphorus (TP) is used as a primary indicator of excessive nutrient loading and contributes to abundant aquatic vegetation growth and depleted dissolved oxygen levels. The Provincial Water Quality Objective (PWQO) is used as the TP Guideline and states that in lakes, concentrations greater than 0.020 mg/l indicate an excessive amount of TP within the water column. Concentrations below 0.010 mg/l are generally considered to be minimal and unlikely to have problems associated with nutrient loading. Total Kjeldahl nitrogen (TKN) is used as a secondary indicator of nutrient loading. RVCA uses a guideline of 0.500 mg/l to assess TKN within surface waters.

 
Nutrients at the Norris Bay Deep Point

TP and TKN sampling results collected by the RVCA are presented in Figures 33 to 36. Variability has occurred in the sampled TP concentrations at this site (Figure 33 and 34), however no significant trend was observed in the 2006-2017 dataset. TP results for Norris Bay are very low, 95 percent of samples analyzed for TP were less than the TP guideline and the average concentration was 0.011mg/l (Table 15). TKN concentration also showed variability; however similar to TP results no trend was observed (Figures 35 and 36). Ninety-eight percent of reported results were below the TKN guideline and the average TKN concentration was 0.344 mg/l (Table 15).

 
Figure 33 Total phosphorus sampling results at deep point site (DP1) in the Norris Bay, 2006-2017
Figure 33 Total phosphorus sampling results at deep point site (DP1) on Norris Bay, 2006-2017
Figure 34 Average total phosphorus results at the deep point site (DP1) on Norris Bay, 2006-2017.
 
Figure 35 Total Kjeldahl nitrogen sampling results at deep point site (DP1) on Norris Bay, 2006-2017
Figure 36 Average total Kjeldahl nitrogen results at the deep point site (DP1) on Norris Bay, 2006-2017.
 
Table 15 Summary of nutrient results for Norris Bay over the monitoring period, 2006-2017.
Total Phosphorous 2006-2017
SiteAverage (mg/l)Below Guideline No. Samples 
DP10.01195%43
Total Kjeldahl Nitrogen 2006-2017
SiteAverage (mg/l)Below Guideline No. Samples 


Overall, the data presented indicates that nutrient concentrations may be considered very low with few instances of elevated samples in the deep water site in Norris Bay.

Nutrients around Norris Bay

The average nutrient concentrations at monitored shoreline sites around the lake vary from year to year (Figures 37 and 38). Please note that in the 2006-2017 shoreline sites A, B, C and D were only sampled in 2008 and 2013.

Average total phosphorous concentrations are below the TP guideline at all sites withe the exception of site A in both monitoring years (Figure 37), this site is out the outlet of the lake and elevated concentrations may result from increased loading periods. Average TKN concentrations were below the guideline at all monitored sites in 2008; in 2013 average results exceeded the guideline at all sites except C.

Figure 37 Average total phosphorous concentrations at shoreline monitoring sites on Norris Bay, 2006-2017.
Figure 38 Average total Kjeldahl nitrogen concentrations at shoreline monitoring sites on Norris Bay, 2006-2017.
 
 
Summary of Norris Bay Nutrients

Nutrient concentrations in Norris Bay are inconsistent, and results have had variability between the two monitoring years. It is possible that occasional problems with nutrient enrichment (i.e. algal blooms or excessive plant growth) may be observed in shallow, sheltered bays or following periods of heavy runoff.

Norris Bay includes the outlet to the lake it has increased potential for nutrient loading.  Efforts such as the diversion of runoff and enhanced shoreline buffers are important to continue to protect and enhance water quality and reduce future nutrient increases.   It is particularly important for roadways and dwellings that boarder the lake. Nutrient exceedances may be partially attributed to the natural aging of a lake and basin characteristics. All residents can help minimize their impact on the lake by reducing nutrient inputs through practices such as proper maintenance of septic systems, keeping shorelines natural and using phosphate free soaps and detergents. Promotion of sound stewardship and protection around lake and throughout the catchment are important to maintain and protect water quality conditions into the future.

2.1.4.2 Norris Bay Water Clarity

Water clarity is measured using a Secchi disk during each deep point sample. Table 16 summarizes the recorded depths with an average depth of 4.5 m and shows that all readings have exceeded the minimum PWQO of 2m indicating that algae in the water column is not at excessive levels (good water clarity). Less than 2 m will indicate overproduction in a lake or significant inputs to the water column that are limiting light availability. Figure 39 shows that no individual reading has been below the guideline and measured depths range from 2.5 m to 7.5 m. No trend was observed within the 2006-2017 data set, indicating that Secchi depths have not change significantly over this period.

 
Table 16 Summary of Secchi depths recorded at the deep point (DP1) on Norris Bay, 2006-2017.
Secchi 2006-2017
SiteAverage (m)Above GuidelineNo. Samples 
 
Figure 39 Recorded Secchi depths at the deep point site (DP1) on Norris Bay, 2006-2017.
 
Summary of Norris Bay Water Clarity

Waters in Norris Bay are very clear and sufficient sunlight is able to penetrate the water column to support aquatic life and provide sufficient visibility for safe recreational use (boating, swimming).

2.1.4.3 Norris Bay Fish Habitat

Two other factors, dissolved oxygen/temperature and pH were also assessed to provide an overall sense of the health of Norris Bay from a fish habitat perspective. 

2.1.4.3.1 Norris Bay Dissolved Oxygen and Temperature

The red bars in Figure 40 show the depths where suitable conditions exist for warm water fish species (temperature less than 25°C and dissolved oxygen greater than 4 mg/l) at the deep point site. The vertical axis represents the total lake depth at each site where the profile is taken. Suitable conditions typically decline throughout the late summer to about 7.5 m of the water column, habitat conditions were very limited in 2007, 2010 and 2015. Overall, no significant change was noted in conditions through the 2006-2017 period.

 
  Figure 40. Depths suitable for warm water fish species at the deep point site (DP1) on Norris Bay, 2006-2017.
Figure 40 Depths suitable for warm water fish species at the deep point site (DP1) on Norris Bay, 2006-2017.
 
2.1.4.3.2 Norris Bay pH

pH is a basic water quality parameter used to assess the acidity of water, an important factor for aquatic life. Figure 41 shows monitored pH values over the 2006-2017 period.

Figure 41. pH concentrations at the deep point sites (DP1) on Norris Bay, 2006-2017.
Figure 41 pH concentrations at the deep point sites (DP1) on Norris Bay, 2006-2017.
 

All samples (100%, table 17) were within guidelines established by the Canadian Council of Minister's of the Environment which state that pH should be between 6.5 and 9 to protect aquatic life. A slight decline was noted in pH values. Anthropogenic and biological activities such as increased photosynthesis from algal blooms and plant growth may act to influence pH.

Table 17 Summary of pH results at the deep point site (DP1) on Norris Bay, 2006-2017
pH 2006-2017
SiteAverage (mg/l)Within Guideline No. Samples 


Summary of Water Quality for Fish Habitat in Norris Bay

Overall the water chemistry data at the deep point describes suitable habitat conditions for fish species such as bass, walleye and pike. There is some evidence that the warming of the water column in the late summer and limited oxygen availability at deeper depths may minimize the amount of habitat for some more sensitive species. pH conditions are within the range recommended for the protection of aquatic life. Overall, the data indicates a healthy environment for aquatic species.


2.1.4.4 Norris Bay E. Coli

E. coli is sampled at monitored shoreline sites twice each sampling season. E. coli data was not used in the calculations of the WQI rating for the lake due to differences in sampling frequency and site locations, the results are summarized in Table 18. Throughout the 2006-2017 period 82 percent of samples were below the E. coli guideline of 100 colony forming units (CFU) per 100 ml set by the PWQO; across the lake the count at the geometric mean was 9 CFU/100ml (Table 18).

Table 18 Summary of E. coli results for Norris Bay, 2006-2017
E. coli 2006-2017
SiteGeometric mean (CFU/100ml)Below Guideline No. Samples 
 
Figure 42 Geometric mean of shoreline sites monitored on Norris Bay, 2006-2017
 

Figure 42 shows the distribution of counts across all shoreline sites.  Site A and B have shown to have higher counts, which just  meet or exceed the E. coli guideline, site B does have elevated results relative to other monitored locations.  However, monitoring at the sites on Norris Bay has been infrequent, and given the limited number of samples it is difficult to make a  conclusion on bacterial counts. Consideration should be given to increasing the frequency of monitoring at these sites, particularly A and B.

Summary of Norris Bay Bacterial Contamination

The results presented above provide evidence that bacterial contamination is not a significant concern at site C on Norris Bay and the water should be safe for recreational use such as swimming and boating. More data is required to assess bacterial concentrations at sites A, B and D.

2.1.5. Bobs Lake: East Basin/Long Bay

2.1.5.1 East Basin/Long Bay Nutrients

Total phosphorus (TP) is used as a primary indicator of excessive nutrient loading and contributes to abundant aquatic vegetation growth and depleted dissolved oxygen levels. The Provincial Water Quality Objective (PWQO) is used as the TP Guideline and states that in lakes, concentrations greater than 0.020 mg/l indicate an excessive amount of TP within the water column. Concentrations below 0.010 mg/l are generally considered to be minimal and unlikely to have problems associated with nutrient loading. Total Kjeldahl nitrogen (TKN) is used as a secondary indicator of nutrient loading. RVCA uses a guideline of 0.500 mg/l to assess TKN within surface waters.

Nutrients at the East Basin/Long Bay Deep Points

TP and TKN sampling results collected by the RVCA are presented in Figures 43 to 46. Variability has occurred in the sampled TP concentrations at this site (Figure 43 and 44), a slight decline in TP concentrations was observed in the 2006-2017 dataset. TP results for East Basin/Long Bay are very low, 94 percent of samples analyzed for TP were less than the TP guideline and the average concentration was 0.010 mg/l (Table 19). TKN concentration also showed variability; no trend was observed in TKN concentratons (Figures 45 and 46). Ninety-five percent of reported results were below the TKN guideline and the average TKN concentration was 0.345 mg/l (Table 19).

 
Figure 43 Total phosphorus sampling results at the deep point sites (DP1 and DP3) in East Basin and Long Bay, 2006-2017
Figure 44 Average total phosphorus results at the deep point sites (DP1 and DP3) on East Basin and Long Bay, 2006-2017.
 
Figure 45 Total Kjeldahl nitrogen sampling results at the deep point sites (DP1 and DP3) in East Bain and Long Bay, 2006-2017.
Figure 46 Average total Kjeldahl nitrogen results at the deep point sites (DP1 and DP3) on East Basin and Long Bay, 2006-2017.
 
 
Table 19 Summary of nutrient results for East Basin and Long Bay over the monitoring period, 2006-2017.
Total Phosphorous 2006-2017
SiteAverage (mg/l)Below Guideline No. Samples 
DP10.01094%86
Total Kjeldahl Nitrogen 2006-2017
SiteAverage (mg/l)Below Guideline No. Samples 


Overall, the data presented indicates that nutrient concentrations may be considered very low with few instances of elevated samples in the deep water site in Norris Bay.

Nutrients around East Basin/Long Bay

The average nutrient concentrations at monitored shoreline sites around the lake vary from year to year (Figures 47 and 48). Please note that in the 2006-2017 shoreline sites A, C, E and F were only sampled in 2008 and 2013, sites B and D were sampled each year.

Average total phosphorous concentrations are below the TP guideline at all sites withe the exception of site B in 2009 (Figure 47), this site is at the mouth of a small creek that flows into the lake, temporary elevated concentrations may have resulted from a period of high runoff. Average TKN concentrations were below the guideline at all monitored sites with the exception of site B also in 2009 and site D in 2014 (Figure 48).  Site D is in a small bay with wetland influences, nitrogen rich soils are associated with wetlands and are likely contributing to elevated concentrations at this site. 

Figure 47 Average total phosphorous concentrations at shoreline monitoring sites on East Basin/Long Bay, 2006-2017
Figure 47 Average total phosphorous concentrations at shoreline monitoring sites on East Basin/Long Bay, 2006-2017.
Figure 48 Average total Kjeldahl nitrogen concentrations at shoreline monitoring sites on East Basin/Long Bay, 2006-2017.
 
 
Summary of East Basin/Long Bay Nutrients

Nutrient concentrations in East Basin/Long Bay are generally below guidelines with few exceedances. There is evidence of periods of elevated nutrients and sites B and D, but as elevated concentrations are not observed every year it is likely that this are isolated events. It is possible that occasional problems with nutrient enrichment (i.e. algal blooms or excessive plant growth) may be observed in both these shallow, sheltered bays or following periods of heavy runoff.

 Efforts such as the diversion of runoff and enhanced shoreline buffers are important to continue to protect and enhance water quality and reduce future nutrient increases.  For instance the close proximity of a road way near site B increases the potential for runoff. Nutrient exceedances may be partially attributed to the natural aging of a lake and basin characteristics. All residents can help minimize their impact on the lake by reducing nutrient inputs through practices such as proper maintenance of septic systems, keeping shorelines natural and using phosphate free soaps and detergents. Promotion of sound stewardship and protection around lake and throughout the catchment are important to maintain and protect water quality conditions into the future.

2.1.5.2 East Basin/Long Bay Water Clarity

Water clarity is measured using a Secchi disk during each deep point sample. Table 20 summarizes the recorded depths with an average depth of 4.7 m and shows that all readings have exceeded the minimum PWQO of 2m indicating that algae in the water column is not at excessive levels (good water clarity). Less than 2 m will indicate overproduction in a lake or significant inputs to the water column that are limiting light availability. Figure 49 shows that no individual reading has been below the guideline and measured depths range from 2.3 m to 7.5 m. No trend was observed within the 2006-2017 data set, indicating that Secchi depths have not change significantly over this period.

Table 20 Summary of Secchi depths recorded at the deep point sites (DP1 and DP3) on East Basin/Long Bay, 2006-2017.
Secchi 2006-2017
SiteAverage (m)Above GuidelineNo. Samples 
 
Figure 49 Recorded Secchi depths at the deep point sites (DP1 and DP3) on East Basin/Long Bay, 2006-2017.
 
Summary of East Basin/Long Bay Water Clarity

Waters in East Basin/Long Bay are very clear and sufficient sunlight is able to penetrate the water column to support aquatic life and provide sufficient visibility for safe recreational use (boating, swimming).

2.1.5.3 East Basin/Long Bay Fish Habitat

Two other factors, dissolved oxygen/temperature and pH were also assessed to provide an overall sense of the health of East Basin/Long Bay from a fish habitat perspective. 


2.1.5.3.1 East Basin/Long Bay Dissolved Oxygen and Temperature

The red bars in Figure 50 show the depths where suitable conditions exist for warm water fish species (temperature less than 25°C and dissolved oxygen greater than 4 mg/l) at the deep point site. The vertical axis represents the total lake depth at each site where the profile is taken. Suitable conditions typically decline throughout the late summer to about 8 m of the water column, habitat conditions were very limited in 2009 and 2010. Through the 2006-2017 period and increasing trend was observed in dissolved oxygen concentrations.

Figure 50. Depths suitable for warm water fish species at the deep point sites (DP1 and DP3) on East Bain/Long Bay, 2006-2017.
Figure 50 Depths suitable for warm water fish species at the deep point sites (DP1 and DP3) on East Basin/Long Bay, 2006-2017.
 

2.1.5.3.2 East Basin/Long Bay pH

pH is a basic water quality parameter used to assess the acidity of water, an important factor for aquatic life. Figure 51 shows monitored pH values over the 2006-2017 period.

Figure 51. pH concentrations at the two deep point sites (DP1 and DP3) on East Basin/Long Bay, 2006-2017.
Figure 51 pH concentrations at the two deep point sites (DP1 and DP3) on East Basin/Long Bay, 2006-2017.
 

The majority of samples (97%, table 21) were within guidelines established by the Canadian Council of Minister's of the Environment which state that pH should be between 6.5 and 9 to protect aquatic life. A slight decline was noted in pH values. Anthropogenic and biological activities such as increased photosynthesis from algal blooms and plant growth may act to influence pH.

 
Table 21 Summary of pH results at the two deep point sites (DP1 and DP3) on East Basin/Long Bay, 2006-2017
pH 2006-2017
SiteAverage (mg/l)Within Guideline No. Samples 


Summary of Water Quality for Fish Habitat in East Basin/Long Bay

Overall the water chemistry data at the deep point describes suitable habitat conditions for fish species such as bass, walleye and pike. There is some evidence that the warming of the water column in the late summer and limited oxygen availability at deeper depths may minimize the amount of habitat for some more sensitive species. pH conditions are within the range recommended for the protection of aquatic life. Overall, the data indicates a healthy environment for aquatic species.


2.1.5.4 East Basin/Long Bay E. Coli

E. coli is sampled at monitored shoreline sites twice each sampling season. E. coli data was not used in the calculations of the WQI rating for the lake due to differences in sampling frequency and site locations, the results are summarized in Table 22. Throughout the 2006-2017 period 100 percent of samples were below the E. coli guideline of 100 colony forming units (CFU) per 100 ml set by the PWQO; across the lake the count at the geometric mean was 6 CFU/100ml (Table 22).

Table 22 Summary of E. coli results for East Basin/Long Bay, 2006-2017
E. coli 2006-2017
SiteGeometric mean (CFU/100ml)Below Guideline No. Samples 
 
Figure 52 Geometric mean of shoreline sites monitored on East Basin/Long Bay, 2006-2017
 

Figure 52 shows the distribution of counts across all shoreline sites.  Sites B and D are monitored each year, while sites A, C, E and F were only monitored in 2008 and 2013, results at all sites were well below the guideline. 

 
Summary of East Basin/Long Bay Bacterial Contamination

The results presented above provide evidence that bacterial contamination is not a significant concern in East Basin/Long Bay and the water should be safe for recreational use such as swimming and boating.

2.1.6 Bobs Lake: Central Narrows Water Quality

2.1.6.1 Central Narrows Nutrients

Total phosphorus (TP) is used as a primary indicator of excessive nutrient loading and contributes to abundant aquatic vegetation growth and depleted dissolved oxygen levels. The Provincial Water Quality Objective (PWQO) is used as the TP Guideline and states that in lakes, concentrations greater than 0.020 mg/l indicate an excessive amount of TP within the water column. Concentrations below 0.010 mg/l are generally considered to be minimal and unlikely to have problems associated with nutrient loading. Total Kjeldahl nitrogen (TKN) is used as a secondary indicator of nutrient loading. RVCA uses a guideline of 0.500 mg/l to assess TKN within surface waters.

Nutrients at the Central Narrows Deep Point

TP and TKN sampling results collected by the RVCA are presented in Figures 53 to 56. Variability has occurred in the sampled TP concentrations at this site (Figure 53 and 54), however there has been no significant increase or decrease in sampled concentrations. TP results for Central Narrows are low, 89 percent of samples analyzed for TP were less than the TP guideline and the average concentration was 0.011 mg/l (Table 23). TKN concentration also showed variability; as with TP concentration no trend was observed for this parameter (Figures 55 and 56). Ninety-three percent of reported results were below the TKN guideline and the average TKN concentration was 0.352 mg/l (Table 23).

 
Figure 53 Total phosphorus sampling results at the deep point site (DP1) in Central Narrows, 2006-2017
Figure 54 Average total phosphorus results at the deep point site (DP1) in Central Narrows
 
 
Figure 55 Total Kjeldahl nitrogen sampling results at the deep point site (DP1) in Central Narrows, 2006-2017.
Figure 56 Average total Kjeldahl nitrogen results at the deep point site (DP1) on Central Narrows, 2006-2017.
 
Table 23 Summary of nutrient results for Central Narrows over the monitoring period, 2006-2017.
Total Phosphorous 2006-2017
SiteAverage (mg/l)Below Guideline No. Samples 
DP10.01189%44
Total Kjeldahl Nitrogen 2006-2017
SiteAverage (mg/l)Below Guideline No. Samples 


Overall, the data presented indicates that nutrient concentrations may be considered very low with few instances of elevated samples in the deep water site in Central Narrows.

Nutrients around Central Narrows

The average nutrient concentrations at the monitored shoreline sites around the lake vary from year to year (Figures 57 and 58). Please note that there is only one site, A, monitored in this basin.  Sampling is completed every fifth year, therefore data is only available from 2008 and 2013 within the 2006-2017 period.

Average total phosphorous concentrations were below the TP guideline in both monitoring years (Figure 57). The TP concentrations was higher in 2013 compared to 2008, however given the limited data it is not possible to say if if this is indicative of a significant change.  Average TKN concentrations were below the guideline in both sampling years and concentrations were fairly comparable (Figure 58). Given that deep point nutrient concentrations have not shown any significant changes and samples at site A have been below guidelines, nutrient enrichment does not appear to be a concern in the nearshore area of Central Narrows.  

Figure 57 Average total phosphorous concentrations at the shoreline monitoring site in Central Narrows.
Figure 57 Average total phosphorous concentrations at the shoreline monitoring site in Central Narrows, 2006-2017.
Figure 58 Average total Kjeldahl nitrogen concentrations at the shoreline monitoring sites in Central Narrows, 2006-2017.
 
 
Summary of Central Narrows Nutrients

Nutrient concentrations in Central Narrows are generally below guidelines with few exceedances. There have been some instances of elevated nutrients at the deep point, but are inconsistent and do not point to a trend of increasing nutrient concentrations. It is possible that occasional problems with nutrient enrichment (i.e. algal blooms or excessive plant growth) may be observed in shallow, sheltered bays or following periods of heavy runoff.

Efforts such as the diversion of runoff and enhanced shoreline buffers are important to continue to protect and enhance water quality and reduce future nutrient increases. Nutrient exceedances may be partially attributed to the natural aging of a lake and basin characteristics. All residents can help minimize their impact on the lake by reducing nutrient inputs through practices such as proper maintenance of septic systems, keeping shorelines natural and using phosphate free soaps and detergents. Promotion of sound stewardship and protection around lake and throughout the catchment are important to maintain and protect water quality conditions into the future.

2.1.6.2 Central Narrows Water Clarity

Water clarity is measured using a Secchi disk during each deep point sample. Table 24 summarizes the recorded depths with an average depth of 4.3 m and shows that all readings have exceeded the minimum PWQO of 2m indicating that algae in the water column is not at excessive levels (good water clarity). Less than 2 m will indicate overproduction in a lake or significant inputs to the water column that are limiting light availability. Figure 59 shows that no individual reading has been below the guideline and measured depths range from 2.8 m to 6 m. No trend was observed within the 2006-2017 data set, indicating that Secchi depths have not change significantly over this period.

Table 24 Summary of Secchi depths recorded at the deep point site (DP1) in Central Narrows, 2006-2017.
Secchi 2006-2017
SiteAverage (m)Above GuidelineNo. Samples 
 
Figure 59 Recorded Secchi depths at the deep point site (DP1) on Central Narrows, 2006-2017.
 
Summary of Central Narrows Water Clarity

Waters in Central Narrows are very clear and sufficient sunlight is able to penetrate the water column to support aquatic life and provide sufficient visibility for safe recreational use (boating, swimming).

2.1.6.3 Central Narrows Fish Habitat

Two other factors, dissolved oxygen/temperature and pH were also assessed to provide an overall sense of the health of Central Narrows from a fish habitat perspective. 

2.1.6.3.1 Central Narrows Dissolved Oxygen and Temperature

The red bars in Figure 60 show the depths where suitable conditions exist for warm water fish species (temperature less than 25°C and dissolved oxygen greater than 4 mg/l) at the deep point site. The vertical axis represents the total lake depth at each site where the profile is taken. Suitable conditions typically decline throughout the late summer/fall to approximately 10m of the water column, habitat conditions were very limited in 2009. Through the 2006-2017 period  there was no significant change in habitat conditions (dissolved oxygen/temperature).

Figure 60. Depths suitable for warm water fish species at the deep point site (DP1) on Central Narrows, 2006-2017.
Figure 60 Depths suitable for warm water fish species at the deep point site (DP1) on Central Narrows, 2006-2017.
 

2.1.6.3.2 Central Narrows pH

pH is a basic water quality parameter used to assess the acidity of water, an important factor for aquatic life. Figure 61 shows monitored pH values over the 2006-2017 period.

Figure 50. Depths suitable for warm water fish species at the deep point site (DP1) on Central Narrows, 2006-2017.
Figure 61 pH concentrations at the two deep point site (DP1) in Central Narrows, 2006-2017.
 

The majority of samples (97%, Table 25) were within guidelines established by the Canadian Council of Minister's of the Environment which state that pH should be between 6.5 and 9 to protect aquatic life. A slight decline was noted in pH values. Anthropogenic and biological activities such as increased photosynthesis from algal blooms and plant growth may act to influence pH.

Table 25 Summary of pH results at the two deep point site (DP1) in Central Narrows, 2006-2017
pH 2006-2017
SiteAverage (mg/l)Within Guideline No. Samples 


Summary of Water Quality in Central Narrows for Fish habitat

Overall the water chemistry data at the deep point describes suitable habitat conditions for fish species such as bass, walleye and pike. There is some evidence that the warming of the water column in the late summer and limited oxygen availability at deeper depths may minimize the amount of habitat for some more sensitive species. pH conditions are within the range recommended for the protection of aquatic life. Overall, the data indicates a healthy environment for aquatic species.

2.1.6.4 Central Narrows E. Coli

E. coli is sampled at monitored shoreline sites twice each sampling season. E. coli data was not used in the calculations of the WQI rating for the lake due to differences in sampling frequency and site locations, the results are summarized in Table 26. As previously noted the site A is the only shoreline site monitored in this basin and is limited to results from 2008 and 2013. The results indicate that  100 percent of samples were below the E. coli guideline of 100 colony forming units (CFU) per 100 ml set by the PWQO; across the lake the count at the geometric mean was 2.5 CFU/100ml (Table 26).

 
Table 26 Summary of E. coli results for Central Narrows, 2006-2017
E. coli 2006-2017
SiteGeometric mean (CFU/100ml)Below Guideline No. Samples 


Figure 50. Depths suitable for warm water fish species at the deep point site (DP1) on Central Narrows, 2006-2017.
Figure 62 Geometric mean of shoreline sites monitored in Central Narrows, 2006-2017
 

Figure 62 shows the distribution of counts across all shoreline sites.  Please note that results are based on a minimal number of samples (Table 26), all results were well below the guideline. 

Summary of Central Narrows Bacterial Contamination

The results presented above provide evidence that bacterial contamination is not a significant concern in Central Narrows and the water should be safe for recreational use such as swimming and boating.

2.1.7 Bobs Lake: Mill Bay Water Quality

2.1.7.1 Mill Bay Nutrients

Total phosphorus (TP) is used as a primary indicator of excessive nutrient loading and contributes to abundant aquatic vegetation growth and depleted dissolved oxygen levels. The Provincial Water Quality Objective (PWQO) is used as the TP Guideline and states that in lakes, concentrations greater than 0.020 mg/l indicate an excessive amount of TP within the water column. Concentrations below 0.010 mg/l are generally considered to be minimal and unlikely to have problems associated with nutrient loading. Total Kjeldahl nitrogen (TKN) is used as a secondary indicator of nutrient loading. RVCA uses a guideline of 0.500 mg/l to assess TKN within surface waters.

Nutrients at the Mill Bay Deep Points

TP and TKN sampling results collected by the RVCA are presented in Figures 63 to 66. Variability has occurred in the sampled TP concentrations at this site with particularly high average concentrations were observed in 2006 and 2016, it appears that in both these years elevated results were due to a single sample that is uncharacteristically high (Figure 63 and 64). Overall, there has been no significant increase or decrease in sampled concentrations. TP results for Mill Bay are typically low, 85 percent of samples analyzed for TP were less than the TP guideline and the average concentration was 0.016 mg/l (Table 27). TKN concentration also showed variability; as with TP concentration no trend was observed for this parameter (Figures 65 and 66). Seventy-four percent of reported results were below the TKN guideline and the average TKN concentration was 0.439 mg/l (Table 27).

 
Figure 63 Total phosphorus sampling results at the deep point site (DP1) in Mill Bay, 2006-2017.
Figure 63 Total phosphorus sampling results at the deep point site (DP1) in Mill Bay, 2006-2017. Figure 64 Average total phosphorus results at the deep point site (DP1) in Mill Bay, 2006-2017.
Figure 64 Average total phosphorus results at the deep point site (DP1) in Mill Bay, 2006-2017.
 
Figure 65 Total Kjeldahl nitrogen sampling results at the deep point site (DP1) in Mill Bay, 2006-2017.
Figure 66 Average total Kjeldahl nitrogen results at the deep point site (DP1) in Mill Bay, 2006-2017.
 
Table 27 Summary of nutrient results for Mill Bay over the monitoring period, 2006-2017.
Total Phosphorous 2006-2017
SiteAverage (mg/l)Below Guideline No. Samples 
DP10.01685%39
Total Kjeldahl Nitrogen 2006-2017
SiteAverage (mg/l)Below Guideline No. Samples 


Overall, the data presented indicates that nutrient concentrations may be considered low with occasional reports of elevated samples at the deep water site on  Mill Bay.

 
Nutrients around Mill Bay

The average nutrient concentrations at the monitored shoreline sites around the lake vary from year to year (Figures 67 and 68). Please note that there are only two sites monitored in this basin, A and B.  Yearly sampling is completed at site B and every fifth year at site A; therefore data is only available from 2008 and 2013 for site A within the 2006-2017 period.

Average total phosphorous concentrations are inconsistent at site B, and exceeded the guideline in 2012 and 2013, concentrations have been lower in subsequent years (Figure 67). All results at site A have been below the guideline.   Average TKN concentrations typically exceed the guideline (Figure 68).  This may be the result of inflow from wetlands, re-suspension of nutrients in the shallow bay and runoff from developed shorelines.   

Figure 67 Average total phosphorous concentrations at the shoreline monitoring site in Mill Bay, 2006-2017.
Figure 68 Average total Kjeldahl nitrogen concentrations at the shoreline monitoring sites in Mill Bay, 2006-2017.
 
 
Summary of Mill Bay Nutrients

Nutrient concentrations in Mill Bay are generally below guidelines with elevated concentrations being more common at monitored shoreline sites.  It is possible that occasional problems with nutrient enrichment (i.e. algal blooms or excessive plant growth) may be observed in shallow, sheltered bays or following periods of heavy runoff.

Efforts such as the diversion of runoff and enhanced shoreline buffers are important to continue to protect and enhance water quality and reduce future nutrient increases. Nutrient exceedances may be partially attributed to the natural aging of a lake and basin characteristics. All residents can help minimize their impact on the lake by reducing nutrient inputs through practices such as proper maintenance of septic systems, keeping shorelines natural and using phosphate free soaps and detergents. Promotion of sound stewardship and protection around lake and throughout the catchment are important to maintain and protect water quality conditions into the future.

2.1.7.2 Mill Bay Water Clarity

Water clarity is measured using a Secchi disk during each deep point sample. Table 28 summarizes the recorded depths with an average depth of 3.3 m and shows that all readings have exceeded the minimum PWQO of 2m indicating that algae in the water column is not at excessive levels (good water clarity). Less than 2 m will indicate overproduction in a lake or significant inputs to the water column that are limiting light availability. Figure 69 shows that no individual reading has been below the guideline and measured depths range from 2.3 m to 5 m. No trend was observed within the 2006-2017 data set, indicating that Secchi depths have not change significantly over this period.

Table 28 Summary of Secchi depths recorded at the deep point site (DP1) on Mill Bay, 2006-2017.
Secchi 2006-2017
SiteAverage (m)Above GuidelineNo. Samples 


Figure 69 Recorded Secchi depths at the deep point site (DP1) on Mill Bay, 2006-2017.
 
Summary of Mill Bay Water Clarity

Waters in Mill Bay are very clear and sufficient sunlight is able to penetrate the water column to support aquatic life and provide sufficient visibility for safe recreational use (boating, swimming).

2.1.7.3 Mill Bay Fish Habitat

Two other factors, dissolved oxygen/temperature and pH were also assessed to provide an overall sense of the health of Mill Bay from a fish habitat perspective. 

2.1.7.3.1 Mill Bay Dissolved Oxygen and Temperature

The red bars in Figure 70 show the depths where suitable conditions exist for warm water fish species (temperature less than 25°C and dissolved oxygen greater than 4 mg/l) at the deep point site. The vertical axis represents the total lake depth at each site where the profile is taken. Suitable conditions typically exist to about 3m within the water column. Through the 2006-2017 period  there was no significant change in habitat conditions (dissolved oxygen/temperature).

 Figure 70. Depths suitable for warm water fish species at the deep point site (DP1) on Mill Bay, 2006-2017.
Figure 70 Depths suitable for warm water fish species at the deep point site (DP1) on Mill Bay, 2006-2017.


2.1.7.3.2 Mill Bay pH

pH is a basic water quality parameter used to assess the acidity of water, an important factor for aquatic life. Figure 71 shows monitored pH values over the 2006-2017 period.

Figure 71. pH concentrations at the two deep point site (DP1) in Mill Bay, 2006-2017.
Figure 71 pH concentrations at the deep point site (DP1) in Mill Bay, 2006-2017.
 

The majority of samples (97%, table 29) were within guidelines established by the Canadian Council of Minister's of the Environment which state that pH should be between 6.5 and 9 to protect aquatic life. No significant change was observed in pH results over the 2006-2017 period.

Table 29 Summary of pH results at the deep point site (DP1) in Mill Bay, 2006-2017
pH 2006-2017
SiteAverage (mg/l)Within Guideline No. Samples 
Summary of Water Quality for Fish Habitat in Mill Bay

Overall the water chemistry data at the deep point describes suitable habitat conditions for fish species such as bass, walleye and pike. There is some evidence that the warming of the water column in the late summer and limited oxygen availability at deeper depths may minimize the amount of habitat for some more sensitive species. pH conditions are within the range recommended for the protection of aquatic life. Overall, the data indicates a healthy environment for aquatic species.

2.1.7.4 Mill Bay E. Coli

E. coli is sampled at monitored shoreline sites twice each sampling season. E. coli data was not used in the calculations of the WQI rating for the lake due to differences in sampling frequency and site locations, the results are summarized in Table 30. The results indicate that  100 percent of samples were below the E. coli guideline of 100 colony forming units (CFU) per 100 ml set by the PWQO; across the lake the count at the geometric mean was 3.6 CFU/100ml (Table 30)

Table 30 Summary of E. coli results for Mill Bay, 2006-2017
E. coli 2006-2017
SiteGeometric mean (CFU/100ml)Below Guideline No. Samples 


Figure 72 Geometric mean of shoreline sites monitored in Mill Bay, 2006-2017
 

Figure 72 shows the distribution of counts across all shoreline sites.  Please note that results are based on a minimal number of samples (Table 30), all results were well below the guideline. 

Summary of Mill Bay Bacterial Contamination

The results presented above provide evidence that bacterial contamination is not a significant concern in Mill Bay and the water should be safe for recreational use such as swimming and boating.

2.1.8 Bobs Lake: Mud Bay Water Quality

2.1.8.1 Mud Bay Nutrients

Total phosphorus (TP) is used as a primary indicator of excessive nutrient loading and contributes to abundant aquatic vegetation growth and depleted dissolved oxygen levels. The Provincial Water Quality Objective (PWQO) is used as the TP Guideline and states that in lakes, concentrations greater than 0.020 mg/l indicate an excessive amount of TP within the water column. Concentrations below 0.010 mg/l are generally considered to be minimal and unlikely to have problems associated with nutrient loading. Total Kjeldahl nitrogen (TKN) is used as a secondary indicator of nutrient loading. RVCA uses a guideline of 0.500 mg/l to assess TKN within surface waters.

Nutrients at the Mud Bay Deep Point

TP and TKN sampling results collected by the RVCA are presented in Figures 73 to 76. Variability has occurred in the sampled TP concentrations at this site with particularly high samples observed in 2010, 2011 and 2013.  Though these results provide an example of occasional exceedances, yearly average concentrations are below guidelines and there has been no significant trend detected (Figure 73 and 74). Overall, TP results for Mud Bay are typically low, 88 percent of samples analyzed for TP were less than the TP guideline and the average concentration was 0.013 mg/l (Table 31). TKN concentration also showed variability; as with TP concentration no trend was observed for this parameter (Figures 75 and 76). Ninety-five percent of reported results were below the TKN guideline and the average TKN concentration was 0.355 mg/l (Table 31).

 
Figure 73 Total phosphorus sampling results at the deep point site (DP1) in Mud Bay, 2006-2017.
Figure 74 Average total phosphorus results at the deep point site (DP1) in Mud Bay,
Figure 74 Average total phosphorus results at the deep point site (DP1) in Mud Bay, 2006-2017.
 
Figure 75 Total Kjeldahl nitrogen sampling results at the deep point site (DP1) in Mud Bay, 2006-2017.
Figure 76 Average total Kjeldahl nitrogen results at the deep point site (DP1) in Mud Bay, 2006-2017.
 
Table 31 Summary of nutrient results for Mud Bay over the monitoring period, 2006-2017.
Total Phosphorous 2006-2017
SiteAverage (mg/l)Below Guideline No. Samples 
DP10.01388%43
Total Kjeldahl Nitrogen 2006-2017
SiteAverage (mg/l)Below Guideline No. Samples 


Overall, the data presented indicates that nutrient concentrations may be considered low with occasional reports of elevated samples at the deep water site on  Mud Bay.

Nutrients around Mud Bay

The average nutrient concentrations at most monitored shoreline sites around the lake vary from year to year (Figures 77 and 78). Please note that site B is the only shoreline site monitored yearly in Mud Bay. Sites A, C and D are monitored every fifth year; therefore data is only available from 2008 and 2013 for site within the 2006-2017 period. The exception to this is site A which was monitored in 2006.

Average total phosphorous concentrations are inconsistent at site B and are typically greater than TP concentrations at other sites, though have not exceeded the guideline (Figure 77). Average TKN concentrations reflect a similar pattern to TP concentrations and all average concentrations are below the guideline (Figure 78).

Figure 77 Average total phosphorous concentrations at the shoreline monitoring site in Mud Bay, 2006-2017.
Figure 78 Average total Kjeldahl nitrogen concentrations at the shoreline monitoring sites in Mud Bay, 2006-2017.
 
 
Summary of Mud Bay Nutrients

Nutrient concentrations in Mud Bay are generally below guidelines with elevated concentrations being more common at monitored shoreline sites.  It is possible that occasional problems with nutrient enrichment (i.e. algal blooms or excessive plant growth) may be observed in shallow, sheltered bays or following periods of heavy runoff.

Efforts such as the diversion of runoff and enhanced shoreline buffers are important to continue to protect and enhance water quality and reduce future nutrient increases. Nutrient exceedances may be partially attributed to the natural aging of a lake and basin characteristics. All residents can help minimize their impact on the lake by reducing nutrient inputs through practices such as proper maintenance of septic systems, keeping shorelines natural and using phosphate free soaps and detergents. Promotion of sound stewardship and protection around lake and throughout the catchment are important to maintain and protect water quality conditions into the future.

2.1.8.2 Mud Bay Water Clarity

Water clarity is measured using a Secchi disk during each deep point sample. Table 32 summarizes the recorded depths with an average depth of 4.7 m and shows that all readings have exceeded the minimum PWQO of 2m indicating that algae in the water column is not at excessive levels (good water clarity). Less than 2 m will indicate overproduction in a lake or significant inputs to the water column that are limiting light availability. Figure 79 shows that no individual reading has been below the guideline and measured depths have been variable ranging from 2.6 m to 8 m. Overall, no trend was observed within the 2006-2017 data set, indicating that Secchi depths have not change significantly over this period.

Table 32 Summary of Secchi depths recorded at the deep point site (DP1) on Mud Bay, 2006-2017.
Secchi 2006-2017
SiteAverage (m)Above GuidelineNo. Samples 
 
Figure 79 Recorded Secchi depths at the deep point site (DP1) on Mud Bay, 2006-2017.
 
Summary of Mud Bay Nutrients

Waters in Mud Bay are very clear and sufficient sunlight is able to penetrate the water column to support aquatic life and provide sufficient visibility for safe recreational use (boating, swimming).

2.1.8.3 Mud Bay Fish Habitat

Two other factors, dissolved oxygen/temperature and pH were also assessed to provide an overall sense of the health of Mud Bay from a fish habitat perspective. 

2.1.8.3.1 Mud Bay Dissolved Oxygen and Temperature

The red bars in Figure 80 show the depths where suitable conditions exist for warm water fish species (temperature less than 25°C and dissolved oxygen greater than 4 mg/l) at the deep point site. The vertical axis represents the total lake depth at each site where the profile is taken. Suitable conditions typically exist to about 6m within the water column. In 2007, 2010 and 2011 measurements in the late summer showed very limited conditions. Overall,  through the 2006-2017 period  there was no significant change in habitat conditions (dissolved oxygen/temperature).

Figure 80. Depths suitable for warm water fish species at the deep point site (DP1) on Mud Bay, 2006-2017.
Figure 80 Depths suitable for warm water fish species at the deep point site (DP1) on Mud Bay, 2006-2017.


2.1.8.3.2 Mud Bay pH

pH is a basic water quality parameter used to assess the acidity of water, an important factor for aquatic life. Figure 81 shows monitored pH values over the 2006-2017 period.

Figure 81. pH concentrations at the two deep point site (DP1) in Mud Bay, 2006-2017.
Figure 81. pH concentrations at the deep point site (DP1) in Mud Bay, 2006-2017.
 

All samples (Table 33) were within guidelines established by the Canadian Council of Minister's of the Environment which state that pH should be between 6.5 and 9 to protect aquatic life. No significant change was observed in pH results over the 2006-2017 period.

Table 33 Summary of pH results at the deep point site (DP1) in Mud Bay, 2006-2017
pH 2006-2017
SiteAverage (mg/l)Within Guideline No. Samples 


Summary of Water Quality in Mud Bay for Fish Habitat

Overall the water chemistry data at the deep point describes suitable habitat conditions for warm water fish. There is some evidence that the warming of the water column in the late summer that may minimize the amount of habitat for some more sensitive species. pH conditions are within the range recommended for the protection of aquatic life. Overall, the data indicates a healthy environment for aquatic species.

2.1.8.4 Mud Bay E. Coli

E. coli is sampled at monitored shoreline sites twice each sampling season. E. coli data was not used in the calculations of the WQI rating for the lake due to differences in sampling frequency and site locations, the results are summarized in Table 34. The results indicate that  100 percent of samples were below the E. coli guideline of 100 colony forming units (CFU) per 100 ml set by the PWQO; across the lake the count at the geometric mean was 3.0 CFU/100ml (Table 34)

Table 34 Summary of E. coli results for Mud Bay, 2006-2017
E. coli 2006-2017
SiteGeometric mean (CFU/100ml)Below Guideline No. Samples 


Figure 82 Geometric mean of shoreline sites monitored in Mud Bay, 2006-2017
 

Figure 82 shows the distribution of counts across all shoreline sites.  Please note that results are based on a minimal number of samples (Table 34), all results were well below the guideline. 

Summary of Mud Bay Bacterial Contamination

The results presented above provide evidence that bacterial contamination is not a significant concern in Mud Bay and the water should be safe for recreational use such as swimming and boating.

2.2 Rock Lake Water Quality

2.2.1 Rock Lake Nutrients

Total phosphorus (TP) is used as a primary indicator of excessive nutrient loading and contributes to abundant aquatic vegetation growth and depleted dissolved oxygen levels. The Provincial Water Quality Objective (PWQO) is used as the TP Guideline and states that in lakes, concentrations greater than 0.020 mg/l indicate an excessive amount of TP within the water column. Concentrations below 0.010 mg/l are generally considered to be minimal and unlikely to have problems associated with nutrient loading. Total Kjeldahl nitrogen (TKN) is used as a secondary indicator of nutrient loading. RVCA uses a guideline of 0.500 mg/l to assess TKN within surface waters.

Nutrients at the Rock Lake Deep Points

TP and TKN sampling results collected by the RVCA are presented in Figures 83 to 86. Concentrations have shown some variability from year to year, but overall the sample mean has been well below the guideline, there has been no significant trend in TP based on sampling results (Figure 83 and 84). Overall, TP results for Mud Bay are very low, 95 percent of samples analyzed for TP were less than the TP guideline and the average concentration was 0.009 mg/l (Table 35). TKN results  showed a declining trend in concentrations (Figures 85 and 86). Ninety-eight percent of reported results were below the TKN guideline and the average TKN concentration was 0.343 mg/l (Table 35).

 
Figure 83 Total phosphorus sampling results at the deep point site (DP1) in Rock Lake, 2006-2017.
Figure 84 Average total phosphorus results at the deep point site (DP1) in Rock Lake 2006-2017.
 
Figure 85 Total Kjeldahl nitrogen sampling results at the deep point site (DP1) in Rock Lake, 2006-2017.
Figure 85 Total Kjeldahl nitrogen sampling results at the deep point site (DP1) in Rock Lake, 2006-2017. Figure 86 Average total Kjeldahl nitrogen results at the deep point site (DP1) in Rock Lake 200
Figure 86 Average total Kjeldahl nitrogen results at the deep point site (DP1) in Rock Lake 2006-2017.
 
Table 35 Summary of nutrient results for Rock Lake over the monitoring period, 2006-2017.
Total Phosphorous 2006-2017
SiteAverage (mg/l)Below Guideline No. Samples 
DP10.00995%44
Total Kjeldahl Nitrogen 2003-2008
SiteAverage (mg/l)Below Guideline No. Samples 


Overall, the data presented indicates that nutrient concentrations may be considered minimal with very few instances of elevated samples at the deep water site on Rock Lake.

Summary of Rock Lake Nutrients

Nutrient concentrations in Rock Lake are below guidelines with elevated concentrations being very rare. It is possible that occasional problems with nutrient enrichment (i.e. algal blooms or excessive plant growth) may be observed in shallow, sheltered bays or following periods of heavy runoff.

Efforts such as the diversion of runoff and enhanced shoreline buffers are important to continue to protect and enhance water quality and reduce future nutrient increases. Nutrient exceedances may be partially attributed to the natural aging of a lake and basin characteristics. All residents can help minimize their impact on the lake by reducing nutrient inputs through practices such as proper maintenance of septic systems, keeping shorelines natural and using phosphate free soaps and detergents. Promotion of sound stewardship and protection around lake and throughout the catchment are important to maintain and protect water quality conditions into the future.

2.2.2 Rock Lake Water Clarity

Water clarity is measured using a Secchi disk during each deep point sample. Table 36 summarizes the recorded depths with an average depth of 4.1 m and shows that all readings have exceeded the minimum PWQO of 2m indicating that algae in the water column is not at excessive levels (good water clarity). Less than 2 m will indicate overproduction in a lake or significant inputs to the water column that are limiting light availability. Figure 87 shows that no individual reading has been below the guideline and measured depths have been variable ranging from 2.5 m to 6.5 m. Overall, no trend was observed within the 2006-2017 data set, indicating that Secchi depths have not change significantly over this period.

Table 36 Summary of Secchi depths recorded at the deep point site (DP1) on Rock Lake, 2006-2017.
Secchi 2006-2017
SiteAverage (m)Above GuidelineNo. Samples 


Figure 87 Recorded Secchi depths at the deep point site (DP1) on Rock Lake, 2006-2017.
 
Summary of Rock Lake Water Clarity

Waters in Rock Lake are very clear and sufficient sunlight is able to penetrate the water column to support aquatic life and provide sufficient visibility for safe recreational use (boating, swimming).

2.2.3 Rock Lake Fish Habitat

Two other factors, dissolved oxygen/temperature and pH were also assessed to provide an overall sense of the health of Rock Lake from a fish habitat perspective. 

2.2.3.1 Rock Lake Dissolved Oxygen and Temperature

The red bars in Figure 88 show the depths where suitable conditions exist for warm water fish species (temperature less than 25°C and dissolved oxygen greater than 4 mg/l) at the deep point site. The vertical axis represents the total lake depth at each site where the profile is taken. Suitable conditions typically exist to about 24m within the water column. Through the 2006-2017 period there was no significant change in habitat conditions (dissolved oxygen/temperature).

Figure 88. Depths suitable for warm water fish species at the deep point site (DP1) on Rock Lake, 2006-2017.
Figure 88 Depths suitable for warm water fish species at the deep point site (DP1) on Rock Lake, 2006-2017.


2.2.3.2 Rock Lake pH

pH is a basic water quality parameter used to assess the acidity of water, an important factor for aquatic life. Figure 89 shows monitored pH values over the 2006-2017 period.

Figure 89. pH concentrations at the two deep point site (DP1) in Rock Lake, 2006-2017.
Figure 89. pH concentrations at the deep point site (DP1) in Rock Lake, 2006-2017.
 

The majority of samples (95%, table 37) were within guidelines established by the Canadian Council of Minister's of the Environment which state that pH should be between 6.5 and 9 to protect aquatic life. No significant change was observed in pH results over the 2006-2017 period.

Table 37 Summary of pH results at the deep point site (DP1) in Rock Lake, 2006-2017
pH 2006-2017
SiteAverage (mg/l)Within Guideline No. Samples 
 
Summary of Water Quality for Fish Habitat in Rock Lake

Overall the water chemistry data at the deep point describes suitable habitat conditions for fish species such as bass, walleye and pike. There is some evidence that the warming of the water column in the late summer that may minimize the amount of habitat for some more sensitive species. pH conditions are within the range recommended for the protection of aquatic life. Overall, the data indicates a healthy environment for aquatic species.

2.3 Crow Lake Water Quality

Surface water quality conditions in Crow Lake have been monitored by RVCA’s Watershed Watch Program since 2003. Data from the deep point sites (DP1) have been used to calculate the WQI rating for Crow Lake, which averaged “Good-Very Good” over the 2006-2017 period (Table 38). Low nutrient concentrations, good oxygen availability and clear water all influenced this rating. The following discussion explains how each of the monitored water quality parameters contributes to the lake’s water quality.

This report also considers data from 10 additional shoreline sites that are monitored around the lake. These sites have not been included in the calculation of the CCME WQI rating, as they are not monitored with the same frequency as the deep point site. However, they do provide important information on water quality conditions in the near shore areas. For locations of the deep point and shoreline sites (A-J) please see Figure 3.  

Table 38 Water Quality Index rating for Crow Lake
SiteLocation 2006-20082009-20112012-20142015-2017


2.3.1 Crow Lake Nutrients

Total phosphorus (TP) is used as a primary indicator of excessive nutrient loading and contributes to abundant aquatic vegetation growth and depleted dissolved oxygen levels. The Provincial Water Quality Objective (PWQO) is used as the TP Guideline and states that in lakes, concentrations greater than 0.020 mg/l indicate an excessive amount of TP within the water column. Concentrations below 0.010 mg/l are generally considered to be minimal and unlikely to have problems associated with nutrient loading.

Total Kjeldahl nitrogen (TKN) is used as a secondary indicator of nutrient loading. RVCA uses a guideline of 0.500 mg/l to assess TKN[1] within surface waters.

Nutrients at the Crow Lake Deep Point

TP and TKN sampling results collected by the RVCA are presented in Figures 90 to 93. Some variability has occurred in the sampled TP concentrations at this site (Figure 90 and 91), no significant trend[2] was observed in the 2006-2017 dataset. Ninety-three percent of samples analyzed for TP were less than the TP guideline and the average concentration was 0.010 mg/l (Table 39).  TKN concentration also showed variability as with TP concentrations no significant change was observed (Figures 92 and 93). Ninety-five percent of reported results were below the TKN guideline and the average TKN concentration was very low at 0.298 mg/l (Table 39).

 
Figure 3 Total phosphorous sampling results at deep point site on Crow Lake, 2006-2017.
Figure 90 Total phosphorous sampling results at deep point site on Crow Lake, 2006-2017.
Figure 3 Average total phosphorous results at deep point site on Crow Lake, 2006-2017.
Figure 91 Average total phosphorous results at deep point site on Crow Lake, 2006-2017.
 
Figure 4 Total Kjeldahl nitrogen sampling results at deep point site on Crow Lake, 2006-2017
Figure 92 Total Kjeldahl nitrogen sampling results at deep point site on Crow Lake, 2006-2017
Figure 4 Total Kjeldahl nitrogen sampling results at deep point site on Crow Lake, 2006-2017  Figure 5 Average total Kjeldahl nitrogen sampling results at the deep point site on Crow Lake, 2006-2017
Figure 93 Average total Kjeldahl nitrogen sampling results at the deep point site on Crow Lake, 2006-2017
 
Table 39 Summary of nutrient results for Crow Lake over the monitoring period, 2006-2017.
Total Phosphorous 2006-2017
SiteAverage (mg/l)Below Guideline No. Samples 
DP10.01093%44
Total Kjeldahl Nitrogen 2006-2017
SiteAverage (mg/l)Below Guideline No. Samples 


Overall, the data presented indicates that nutrient concentrations may be considered low with very few exceedances in the mid-lake, deep water site on Crow Lake.


Nutrients around Crow Lake

The average nutrient concentrations at monitored shoreline sites around the lake vary from year to year (Figures 94 and 95). Please note that in the 2006-2017 monitoring period sites A, E and J were monitored yearly; while sites B, C, D, F, G, H and I were only sampled in 2008 and 2013.

Average total phosphorous concentrations are below the TP guideline at all of the sites, with the exception of site E in 2007 (Figure 94); all subsequent results are below the guideline.  Average TKN concentrations were also below the guideline at all sites (Figure 95).


Figure 7 Average total phosphorous concentrations at shoreline monitoring sites in Crow Lake, 2006-2017
Figure 94 Average total phosphorous concentrations at shoreline monitoring sites in Crow Lake, 2006-2017
Figure 8 Average total Kjeldahl nitrogen concentrations at shoreline monitoring sites in Crow Lake, 2006-2017
Figure 95 Average total Kjeldahl nitrogen concentrations at shoreline monitoring sites in Crow Lake, 2006-2017
 
 
Summary of Crow Lake Nutrtients

Crow Lake nutrient concentrations are consistently below the guidelines, with very few exceedances. It is possible that occasional problems with nutrient enrichment (i.e. algal blooms or excessive plant growth) may be observed in some shallow, sheltered bays.

Efforts such as the diversion of runoff and enhanced shoreline buffers are important to continue to protect and enhance water quality, and reduce future nutrient increases-particularly in developed areas. Nutrient exceedances may be partially attributed to the natural aging of a lake and basin characteristics. All residents can help minimize their impact on the lake by reducing nutrient inputs through practices such as proper maintenance of septic systems, keeping shorelines natural and using phosphate free soaps and detergents. Promotion of sound stewardship and protection around lake is important to maintain and protect water quality conditions into the future.

2.3.2 Crow Lake Water Clarity

Water clarity is measured using a Secchi disk during each deep point sample. Table 40 summarizes the recorded depths with an average depth of 5.1 m and shows that all readings have exceeded the minimum PWQO of 2 m; indicating that algae in the water column is not at excessive levels (good water clarity). Less than 2 m will indicate overproduction in a lake or significant inputs to the water column that are limiting light availability. Figure 96 shows that no individual reading has been below the guideline and measured depths range from 3.0 m to 7.2 m. No trend was observed in Secchi depths over the 2006-2017 data set.

Table 40 Summary of Secchi depths recorded at the deep point sites on Crow Lake, 2006-2017
Secchi 2006-2017
SiteAverage (m)Above GuidelineNo. Samples 


Figure 9 Recorded Secchi depths at the deep point sites on Crow Lake, 2006-2017
Figure 96 Recorded Secchi depths at the deep point sites on Crow Lake, 2006-2017
 
Summary of Crow Lake Water Clarity

Waters in Crow Lake are generally clear and sufficient sunlight is able to penetrate the water column to support aquatic life and provide sufficient visibility for safe recreational use (boating, swimming).

2.3.3 Crow Lake Fish Habitat

Two other factors, dissolved oxygen/temperature and pH were also assessed to provide an overall sense of the health of Crow Lake from a fish habitat perspective. 

2.3.3.1 Crow Lake Dissolved Oxygen and Temperature

The red bars in Figure 97 show the depths where suitable conditions exist for warm water fish species (temperature less than 25°C and dissolved oxygen greater than 4 mg/l) at the deep point site. The vertical axis represents the total lake depth at each site where the profile is taken. Suitable conditions typically were observed over the monitoring periods to about 20m of the water column. Overall, no significant change was noted in conditions through the 2006-2017 period.

Figure 10 Depths suitable for warm water fish species on Crow Lake, 2006-2017.
Figure 97 Depths suitable for warm water fish species on Crow Lake, 2006-2017.
 

2.3.3.2 Crow Lake pH

All samples were within guidelines established by the Canadian Council of Minister's of the Environment which state that pH should be between 6.5 and 9 to protect aquatic life (Table 41, Figure 98).  Surface water’s that are found to be more alkaline (higher pH) are common in many regions of the Tay River subwatershed and can generally be attributed to the geology rather than anthropogenic activities. Biological activities such as increased photosynthesis from algal blooms and plant growth may also influence pH. A slight declining trend was observed throughout the 2006-2017 period.

Figure 20 pH concentrations at the deep point site on Crow Lake, 2006-2017
Figure 98 pH concentrations at the deep point site on Crow Lake, 2006-2017
 
 
Table 41 Summary of pH results at the deep point site on Crow Lake, 2006-2017
pH 2006-2017
SiteAverage (mg/l)Within Guideline No. Samples 


Summary of Water Quality for Fish Habitat in Crow Lake

Overall the water chemistry data at the deep point describes suitable habitat conditions for fish species such as bass, walleye and pike. pH conditions are within the range recommended for the protection of aquatic life. Overall, the data indicates a healthy environment for aquatic species.


2.3.4 Crow Lake E. Coli

E. coli is sampled at monitored shoreline sites twice each sampling season. E. coli data was not used in the calculations of the WQI rating for the lake due to differences in sampling frequency and site locations. E. coli data has been summarized in Table 42.

Throughout the 2006-2017 period 100 percent of samples collected by RVCA were below the E. coli guideline of 100 colony forming units (CFU) per 100 ml set by the PWQO; across the lake the count at the geometric mean was 3 CFU/100ml (Table 42). This provides support that there is little indication of bacterial contamination around the lake. Figure 99 show the distribution of counts across all shoreline sites, all of which fall well below the guideline of 100 CFU/100ml.

Table 42 Summary of E. coli results for Crow Lake, 2006-2017
E. coli 2006-2017
SiteGeometric mean (CFU/100ml)Below Guideline No. Samples 


Figure 12 Geometric mean of shoreline sites monitored on Crow Lake, 2006-2017
Figure 99 Geometric mean of shoreline sites monitored on Crow Lake, 2006-2017
 
Summary of Crow Lake Bacterial Contamination

The results presented above indicate that bacterial contamination is not a significant concern in Crow Lake and the water should be safe for recreational use such as swimming and boating.


[1] No Ontario guideline for TKN is presently available; however, waters not influenced by excessive organic inputs typically range from 0.100 to 0.500 mg/l, Environment Canada (1979) Water Quality Sourcebook, A Guide to Water Quality Parameters, Inland Waters Directorate, Water Quality Branch, Ottawa, Canada

[2]Trends in the data were assessed using the Mann-Kendall trend test and Sens slope statistic.

[3]A type of mean or average, which indicates the central tendency or typical value of a set of numbers by using the product of their values (as opposed to the arithmetic mean which uses their sum). It is often used to summarize a variable that varies over several orders of magnitude, such as E. coli counts.

3.0  Bobs and Crow Lake Catchments: Riparian Conditions

3.1  Bobs Lake: Aquatic Habitat

3.1.1 Groundwater

Groundwater discharge areas can influence stream temperature, contribute nutrients, and provide important stream habitat for fish and other biota. During stream surveys, indicators of groundwater discharge are noted when observed. Indicators include: springs/seeps, watercress, iron staining, significant temperature change and rainbow mineral film.  Figure 100 shows areas where one or more of the above groundwater indicators were observed during headwater assessments. 

Figure 100 Groundwater indicators observed in the Bobs Lake catchment
 

3.1.2 Fish Community

The Bobs Lake catchment is classified as a mixed community of warm and cool water recreational and baitfish fishery (Figure 101). The fish community has not been sampled extensively in the Bobs Lake catchment.

Figure 101 Fish sampling locations in the Bobs Lake catchment
 

Table 43 contains a list of species observed in the watershed.

Table 43 Fish species observed in the Bobs Lake catchment
Fish SpeciesScientific NameFish codeHistorical2016
bluntnose minnowPimephales notatusBnMinX
brassy minnowHybognathus hankinsoniBrMinX
brook sticklebackCulaea inconstansBrStiXX
brown bullheadAmeiurus nebulosusBrBulX
carps and minnowsCyprinidaeCA_MIX
common shinerLuxilus cornutusCoShiX
creek chubSemotilus atromaculatusCrChuX
fallfishSemotilus corporalisFallfX
fathead minnowPimephales promelasFhMinX
finescale dacePhoxinus neogaeusFsDacX
iowa darterEtheostoma exileIoDarX
lake troutSalvelinus namaycushLaTroX
largemouth bassMicropterus salmoidesLmBasX
logperchPercina caprodesLogpeX
micropterus sp.Micropterus sp.MicSpX
northern pikeEsox luciusNoPikX
northern redbelly daceChrosomus eosNRDacX
pumpkinseedLepomis gibbosusPumpkXX
rock bassAmbloplites rupestrisRoBasX
smallmouth bassMicropterus dolomieuSmBasX
walleyeSander vitreusWalleX
white suckerCatostomus commersoniiWhSucX
yellow bullheadAmeiurus natalisYeBulX
yellow perchPerca flavescensYePerX
 

3.1.3 Migratory Obstructions

Migratory obstructions represent limitations to fish dispersal within a system and may restrict access to important spawning and rearing habitat. Migratory obstructions can be natural or manmade, and they can be permanent or seasonal. Figure 102 shows that the Bobs Lake catchment area had eight perched culverts and one dam at the time of the survey in 2016.  

Figure 102 Migratory obstructions in the Bobs Lake catchment
 

3.1.4 Riparian Restoration

Figure 103 depicts the locations of various riparian restoration opportunities as a result of observations made during the headwater drainage feature surveys.   

Figure 103 Riparian restoration opportunities in the Bobs Lake catchment
 

3.2 Bobs Lake Catchment: Headwater Drainage Feature Assessment

3.2.1 Headwaters Sampling Locations

The RVCA Stream Characterization program assessed Headwater Drainage Features for the Bobs Lake catchment in 2016. This protocol measures zero, first and second order headwater drainage features (HDF).  It is a rapid assessment method characterizing the amount of water, sediment transport, and storage capacity within headwater drainage features (HDF). RVCA is working with other Conservation Authorities and the Ministry of Natural Resources and Forestry to implement the protocol with the goal of providing standard datasets to support science development and monitoring of headwater drainage features.  An HDF is a depression in the land that conveys surface flow. Additionally, this module provides a means of characterizing the connectivity, form and unique features associated with each HDF (OSAP Protocol, 2013). In 2016 the program sampled 39 sites at road crossings in the Bobs Lake catchment area (Figure 104).  

Figure 104 Location of the headwater sampling sites in the Bobs Lake catchment
 

3.2.2 Headwater Feature Type

The headwater sampling protocol assesses the feature type in order to understand the function of each feature.  The evaluation includes the following classifications: defined natural channel, channelized or constrained, multi-thread, no defined feature, tiled, wetland, swale, roadside ditch and pond outlet.  By assessing the values associated with the headwater drainage features in the catchment area we can understand the ecosystem services that they provide to the watershed in the form of hydrology, sediment transport, and aquatic and terrestrial functions.  The headwater drainage features in the Bobs Lake catchment are predominantly natural and wetland features.  Figure 105 shows the feature type of the primary feature at the sampling locations.

Figure 105 Headwater feature types in the Bobs Lake catchment
 

3.2.3 Headwater Feature Flow

The observed flow condition within headwater drainage features can be highly variable depending on timing relative to the spring freshet, recent rainfall, soil moisture, etc.  Flow conditions are assessed in the spring and in the summer to determine if features are perennial and flow year round, if they are intermittent and dry up during the summer months or if they are ephemeral systems that do not flow regularly and generally respond to specific rainstorm events or snowmelt.  Flow conditions in headwater systems can change from year to year depending on local precipitation patterns.  Figure 106 shows the observed flow condition at the sampling locations in the Bobs Lake catchment in 2016.

Figure 106 Headwater feature flow conditions in the Bobs Lake catchment
 
A spring photo of the headwater sample site in the Bobs Lake catchment located on Green Bay Road
 
A summer photo of the headwater sample site in the Bobs Lake catchment located on Green Bay Road
 

3.2.4 Feature Channel Modifications

Channel modifications were assessed at each headwater drainage feature sampling location.  Modifications include channelization, dredging, hardening and realignments.  The Bobs Lake catchment area had a majority of features with no channel modifications observed, two locations had mixed modifications and six had been historically dredged or channelized.  Figure 107 shows the channel modifications observed at the sampling locations for the Bobs Lake catchment.

 
Figure 107 Headwater feature channel modifications in the Bobs Lake catchment
 

3.2.5 Headwater Feature Vegetation

Headwater feature vegetation evaluates the type of vegetation that is found within the drainage feature.  The type of vegetation within the channel influences the aquatic and terrestrial ecosystem values that the feature provides.  For some types of headwater features the vegetation within the feature plays a very important role in flow and sediment movement and provides wildlife habitat.  The following classifications are evaluated no vegetation, lawn, wetland, meadow, scrubland and forest.  Figure 108 depicts the dominant vegetation observed at the sampled headwater sites in the Bobs Lake catchment.

Figure 108 Headwater feature vegetation types in the Bobs Lake catchment
 

3.2.6 Headwater Feature Riparian Vegetation

Headwater riparian vegetation evaluates the type of vegetation that is found along the adjacent lands of a headwater drainage feature.  The type of vegetation within the riparian corridor influences the aquatic and terrestrial ecosystem values that the feature provides to the watershed.  Figure 109 depicts the type of riparian vegetation observed at the sampled headwater sites in the Bobs Lake catchment.  The majority of the headwater drainage features are classified as having natural riparian vegetation with eleven features having altered vegetation.

Figure 109 Headwater feature riparian vegetation types in the Bobs Lake catchment
 

3.2.7 Headwater Feature Sediment Deposition

Assessing the amount of recent sediment deposited in a channel provides an index of the degree to which the feature could be transporting sediment to downstream reaches (OSAP, 2013).  Evidence of excessive sediment deposition might indicate the requirement to follow up with more detailed targeted assessments upstream of the site location to identify potential best management practices to be implemented.  Sediment deposition ranged from none to substantial for the headwater sites sampled in the Bobs Lake catchment area.  Figure 110 depicts the degree of sediment deposition observed at the sampled headwater sites in the Bobs Lake catchment.  Sediment deposition conditions ranged from no sediment deposition to substantial levels of deposition.

Figure 110 Headwater feature sediment deposition in the Bobs Lake catchment
 

3.2.8 Headwater Feature Upstream Roughness

Feature roughness will provide a measure of the amount of materials within the bankfull channel that could slow down the velocity of water flowing within the headwater feature (OSAP, 2013).  Materials on the channel bottom that provide roughness include vegetation, woody Structure and boulders/cobble substrates.  Roughness can provide benefits in mitigating downstream erosion on the headwater drainage feature and the receiving watercourse by reducing velocities.  Roughness also provides important habitat conditions for aquatic organisms.  Figure 111 shows that the feature roughness conditions at the sampling locations in the Bobs Lake catchment were highly variable ranging from minimal to extreme roughness conditions.

Figure 111 Headwater feature roughness in the Bobs Lake catchment
 

3.3 Crow Lake Catchment: Headwater Drainage Features Assessment

3.3.1 Headwater Sampling Locations

The RVCA Stream Characterization program assessed Headwater Drainage Features for the Crow Lake catchment in 2016. This protocol measures zero, first and second order headwater drainage features (HDF).  It is a rapid assessment method characterizing the amount of water, sediment transport, and storage capacity within headwater drainage features (HDF). RVCA is working with other Conservation Authorities and the Ministry of Natural Resources and Forestry to implement the protocol with the goal of providing standard datasets to support science development and monitoring of headwater drainage features.  An HDF is a depression in the land that conveys surface flow. Additionally, this module provides a means of characterizing the connectivity, form and unique features associated with each HDF (OSAP Protocol, 2013). In 2016 the program sampled 22 sites at road crossings in the Crow Lake catchment area (Figure 112).  

Figure 112 Location of the headwater sampling site in the Crow Lake catchment
 

3.3.2 Headwater Feature Type

The headwater sampling protocol assesses the feature type in order to understand the function of each feature.  The evaluation includes the following classifications: defined natural channel, channelized or constrained, multi-thread, no defined feature, tiled, wetland, swale, roadside ditch and pond outlet.  By assessing the values associated with the headwater drainage features in the catchment area we can understand the ecosystem services that they provide to the watershed in the form of hydrology, sediment transport, and aquatic and terrestrial functions.  The headwater drainage features in the Crow Lake catchment are predominantly natural and wetland features.  Figure 113 shows the feature type of the primary feature at the sampling locations.

Figure 113 Headwater feature types in the Crow Lake catchment
 

3.3.3 Headwater Feature Flow

The observed flow condition within headwater drainage features can be highly variable depending on timing relative to the spring freshet, recent rainfall, soil moisture, etc.  Flow conditions are assessed in the spring and in the summer to determine if features are perennial and flow year round, if they are intermittent and dry up during the summer months or if they are ephemeral systems that do not flow regularly and generally respond to specific rainstorm events or snowmelt.  Flow conditions in headwater systems can change from year to year depending on local precipitation patterns.  Figure 114 shows the observed flow condition at the sampling locations in the Crow Lake catchment in 2016.

Figure 114 Headwater feature flow conditions in the Crow Lake catchment
 
A spring photo of the headwater sample site in the Crow Lake catchment located on Oak Bluffs Road
 
A summer photo of the headwater sample site in the Crow Lake catchment located on Oak Bluffs Road
 

3.3.4 Headwater Feature Channel Modifications

Channel modifications were assessed at each headwater drainage feature sampling location.  Modifications include channelization, dredging, hardening and realignments.  The Crow Lake catchment area had a majority of features with no channel modifications observed, only one location had mixed modifications.  Figure 115 shows the channel modifications observed at the sampling locations for the Crow Lake catchment.

 
Figure 115 Headwater feature channel modifications in the Crow Lake catchment
 

3.3.5 Headwater Feature Vegetation

Headwater feature vegetation evaluates the type of vegetation that is found within the drainage feature.  The type of vegetation within the channel influences the aquatic and terrestrial ecosystem values that the feature provides.  For some types of headwater features the vegetation within the feature plays a very important role in flow and sediment movement and provides wildlife habitat.  The following classifications are evaluated no vegetation, lawn, wetland, meadow, scrubland and forest.  Figure 116 depicts the dominant vegetation observed at the sampled headwater sites in the Crow Lake catchment.

Figure 116 Headwater feature vegetation types in the Crow Lake catchment
 

3.3.6 Headwater Feature Riparian Vegetation

Headwater riparian vegetation evaluates the type of vegetation that is found along the adjacent lands of a headwater drainage feature.  The type of vegetation within the riparian corridor influences the aquatic and terrestrial ecosystem values that the feature provides to the watershed.  Figure 117 depicts the type of riparian vegetation observed at the sampled headwater sites in the Crow Lake catchment.  The majority of the headwater drainage features are classified as having natural riparian vegetation with only four features having altered vegetation typically in the form of ornamental grass or agricultural crops in the riparian zone.

Figure 117 Headwater feature riparian vegetation types in the Crow Lake catchment
 

3.3.7 Headwater Feature Sediment Deposition

Assessing the amount of recent sediment deposited in a channel provides an index of the degree to which the feature could be transporting sediment to downstream reaches (OSAP, 2013).  Evidence of excessive sediment deposition might indicate the requirement to follow up with more detailed targeted assessments upstream of the site location to identify potential best management practices to be implemented.  Sediment deposition ranged from none to substantial for the headwater sites sampled in the Crow Lake catchment area.  Figure 118 depicts the degree of sediment deposition observed at the sampled headwater sites in the Crow Lake catchment.  Sediment deposition conditions ranged from no sediment deposition to moderate.

Figure 118 Headwater feature sediment deposition in the Crow Lake catchment
 

3.3.8 Headwater Feature Upstream Roughness

Feature roughness will provide a measure of the amount of materials within the bankfull channel that could slow down the velocity of water flowing within the headwater feature (OSAP, 2013).  Materials on the channel bottom that provide roughness include vegetation, woody Structure and boulders/cobble substrates.  Roughness can provide benefits in mitigating downstream erosion on the headwater drainage feature and the receiving watercourse by reducing velocities.  Roughness also provides important habitat conditions for aquatic organisms.  Figure 119 shows that the feature roughness conditions at the sampling locations in the Crow Lake catchment were highly variable ranging from minimal to extreme.

Figure 119 Headwater feature roughness in the Crow Lake catchment
 

4.0 Bobs and Crow Lake Catchments: Land Cover

Land cover and any change in coverage that has occurred over a six year period is summarized for the Bobs and Crow Lake catchments using spatially continuous vector data representing the catchment during the spring of 2008 and 2014. This dataset was developed by the RVCA through heads-up digitization of 20cm DRAPE ortho-imagery at a 1:4000 scale and details the surrounding landscape using 10 land cover classes.

4.1.1 Bobs Lake Catchment Land Cover/Change

As shown in Table 44 and Figure 1a, the dominant land cover type in 2014 is woodland.

Table 44 Land cover in the Bobs Lake catchment (2008 vs.2014)
Land Cover20082014Change - 2008 to 2014
AreaAreaArea
HaPercentHaPercentHaPercent
Woodland*656250654250-20
Water3234253238254
Wetland**17741317891315
>Evaluated(324)(2)(324)(2)(0)(0)
>Unevaluated(1450)(11)(1465)(11)(15)(0)
Crop and Pasture56945684-1
Meadow-Thicket39933943-5
Settlement315232025
Transportation327232922
Aggregate20<120<1
* Does not include treed swamps ** Includes treed swamps
 

From 2008 to 2014, there was an overall change of 33 hectares (from one land cover class to another). Most of the change in the Bobs Lake catchment is a result of woodland reverting to wetland and being converted to settlement (Figure 120).

LandCoverChangeNewTay-RiverBobs-Lake-001-001
Figure 120 Land cover change in the Bobs Lake catchment (2008 to 2014)
 

Table 45 provides a detailed breakdown of all land cover change that has taken place in the Bobs Lake catchment between 2008 and 2014.

Table 45 Land cover change in the Bobs Lake catchment (2008 to 2014)
Change - 2008 to 2014
Land CoverArea
Ha.Percent
Woodland to Unevaluated Wetland13.440.8
Woodland to Settlement6.118.6
Settlement to Unevaluated Wetland3.811.7
Meadow-Thicket to Woodland1.95.9
Meadow-Thicket to Unevaluated Wetland1.75.3
Woodland to Transportation1.44.2
Meadow-Thicket to Settlement1.13.3
Crop and Pasture to Settlement13
Meadow-Thicket to Transportation0.61.9
Unevaluated Wetland to Settlement0.61.7
Woodland to Crop and Pasture0.51.5
Crop and Pasture to Unevaluated Wetland0.41.3


4.1.2 Crow Lake Catchment Change

As shown in Table 46 and Figure 1b, the dominant land cover type in 2014 is woodland.

Table 46 Land cover (2008 vs. 2014) in the Crow Lake catchment
Land Cover20082014Change - 2008 to 2014
AreaAreaArea
HaPercentHaPercentHaPercent
Woodland*305460304860-6
Wetland **886188911851
>Unevaluated886188911851
Water5841258412
Meadow-Thicket20742074
Crop and Pasture12421242
Settlement107210922
Transportation10121012
* Does not include treed swamps ** Includes treed swamps
 

From 2008 to 2014, there was an overall change of six hectares (from one land cover class to another). Most of the change in the Crow Lake catchment is a result of woodland reverting to wetland (Figure 121).

LandCoverChangeNewTay-RiverCrow-Lake-001-001

Figure 121 Land cover change in the Crow Lake catchment (2008 to 2014)
 

Table 47 provides a detailed breakdown of all land cover change that has taken place in the Crow Lake catchment between 2008 and 2014.

Table 47 Land cover change in the Crow Lake catchment (2008 to 2014)
Land CoverChange - 2008 to 2014
Area
Ha.Percent
Wooded Area to Unevaluated Wetland4.274
Crop and Pasture to Settlement0.814
Wooded Area to Settlement0.712

4.2 Woodland Cover

In the Environment Canada Guideline (Third Edition) entitled “How Much Habitat Is Enough?” (hereafter referred to as the “Guideline”) the opening narrative under the Forest Habitat Guidelines section states that prior to European settlement, forest was the predominant habitat in the Mixedwood Plains ecozone. The remnants of this once vast forest now exist in a fragmented state in many areas (including the Rideau Valley watershed) with woodland patches of various sizes distributed across the settled landscape along with higher levels of forest cover associated with features such as the Frontenac Axis (within the on-Shield areas of the Rideau Lakes and Tay River subwatersheds). The forest legacy, in terms of the many types of wildlife species found, overall species richness, ecological functions provided and ecosystem complexity is still evident in the patches and regional forest matrices (found in the Tay River subwatershed and elsewhere in the Rideau Valley watershed). These ecological features are in addition to other influences which forests have on water quality and stream hydrology including reducing soil erosion, producing oxygen, storing carbon along with many other ecological services that are essential not only for wildlife but for human well-being.

The Guideline also notes that forests provide a great many habitat niches that are in turn occupied by a great diversity of plant and animal species. They provide food, water and shelter for these species - whether they are breeding and resident locally or using forest cover to help them move across the landscape. This diversity of species includes many that are considered to be species at risk. Furthermore, from a wildlife perspective, there is increasing evidence that the total forest cover in a given area is a major predictor of the persistence and size of bird populations, and it is possible or perhaps likely that this pattern extends to other flora and fauna groups. The overall effect of a decrease in forest cover on birds in fragmented landscapes is that certain species disappear and many of the remaining ones become rare, or fail to reproduce, while species adapted to more open and successional habitats, as well as those that are more tolerant to human-induced disturbances in general, are able to persist and in some cases thrive. Species with specialized-habitat requirements are most likely to be adversely affected. The overall pattern of distribution of forest cover, the shape, area and juxtaposition of remaining forest patches and the quality of forest cover also play major roles in determining how valuable forests will be to wildlife and people alike.

The current science generally supports minimum forest habitat requirements between 30 and 50 percent, with some limited evidence that the upper limit may be even higher, depending on the organism/species phenomenon under investigation or land-use/resource management planning regime being considered/used.

 
Bobs Lake Catchment

As shown in Figure 122, 50 percent of the Bobs Lake catchment contains 6542 hectares of upland forest and 49 hectares of lowland forest (treed swamps) versus the 47 percent of woodland cover in the Tay River subwatershed. This is greater than the 30 percent of forest cover that is identified as the minimum threshold required to sustain forest birds according to the Guideline and which may only support less than one half of potential species richness and marginally healthy aquatic systems. When forest cover drops below 30 percent, forest birds tend to disappear as breeders across the landscape.

Figure 122 Woodland cover and forest interior in the Bobs Lake catchment (2014)
 
Crow Lake Catchment

As shown in Figure 123, 61 percent of the Crow Lake catchment contains 3048 hectares of upland forest and 26 hectares of lowland forest (treed swamps) versus the 47 percent of woodland cover in the Tay River subwatershed. This is greater than the 30 percent of forest cover that is identified as the minimum threshold required to sustain forest birds according to the Guideline and which may only support less than one half of potential species richness and marginally healthy aquatic systems. When forest cover drops below 30 percent, forest birds tend to disappear as breeders across the landscape.

Figure 123 Woodland cover and forest interior in the Crow Lake catchment (2014)
 

4.2.1 Woodland (Patch) Size

According to the Ministry of Natural Resources’ Natural Heritage Reference Manual (Second Edition), larger woodlands are more likely to contain a greater diversity of plant and animal species and communities than smaller woodlands and have a greater relative importance for mobile animal species such as forest birds.

Bigger forests often provide a different type of habitat. Many forest birds breed far more successfully in larger forests than they do in smaller woodlots and some rely heavily on forest interior conditions. Populations are often healthier in regions with more forest cover and where forest fragments are grouped closely together or connected by corridors of natural habitat. Small forests support small numbers of wildlife. Some species are “area-sensitive” and tend not to inhabit small woodlands, regardless of forest interior conditions. Fragmented habitat also isolates local populations, especially small mammals, amphibians and reptiles with limited mobility. This reduces the healthy mixing of genetic traits that helps populations survive over the long run (Conserving the Forest Interior. Ontario Extension Notes, 2000).

The Environment Canada Guideline also notes that for forest plants that do not disperse broadly or quickly, preservation of some relatively undisturbed large forest patches is needed to sustain them because of their restricted dispersal abilities and specialized habitat requirements and to ensure continued seed or propagation sources for restored or regenerating areas nearby.

The Natural Heritage Reference Manual continues by stating that a larger size also allows woodlands to support more resilient nutrient cycles and food webs and to be big enough to permit different and important successional stages to co-exist. Small, isolated woodlands are more susceptible to the effects of blowdown, drought, disease, insect infestations, and invasions by predators and non-indigenous plants. It is also known that the viability of woodland wildlife depends not only on the characteristics of the woodland in which they reside, but also on the characteristics of the surrounding landscape where the woodland is situated. Additionally, the percentage of forest cover in the surrounding landscape, the presence of ecological barriers such as roads, the ability of various species to cross the matrix surrounding the woodland and the proximity of adjacent habitats interact with woodland size in influencing the species assemblage within a woodland.

Bobs Lake Catchment

In the Bobs Lake catchment (in 2014), three hundred and twenty-six (54 percent) of the 609 woodland patches are very small, being less than one hectare in size. Another 225 (37 percent) of the woodland patches ranging from one to less than 20 hectares in size tend to be dominated by edge-tolerant bird species. The remaining 58 (nine percent of) woodland patches range between 20 and 809 hectares in size. Forty-three of these patches contain woodland between 20 and 100 hectares and may support a few area-sensitive species and some edge intolerant species, but will be dominated by edge tolerant species.

Conversely, 15 (two percent) of the 609 woodland patches in the drainage area exceed the 100 plus hectare size needed to support most forest dependent, area sensitive birds and are large enough to support approximately 60 percent of edge-intolerant species. Six patches top 200 hectares, which according to the Environment Canada Guideline will support 80 percent of edge-intolerant forest bird species (including most area sensitive species) that prefer interior forest habitat conditions.

Table 48 presents a comparison of woodland patch size in 2008 and 2014 along with any changes that have occurred over that time. A decrease (of 20 hectares) has been observed in the overall woodland patch area between the two reporting periods with most change occurring in the 50 to 100 woodland patch size class range.

Table 48 Woodland patches in the Bobs Lake catchment (2008 and 2014)
Woodland Patch Size Range (ha)Woodland* PatchesPatch Change
200820142008 to 2014
NumberAreaNumberAreaNumberArea
CountPercent HaPercentCountPercent HaPercentCountHa
Less than 1 31753120232654121291
1 to 2022237936142253795314317
20 to 503059691530596815-1
50 to 1001329751513295214-23
100 to 2009213212091131920-2
Greater than 2006122903461227835-12
*Includes treed swamps
 
Crow Lake Catchment

In the Crow Lake catchment (in 2014), one hundred and four (54 percent) of the 191 woodland patches are very small, being less than one hectare in size. Another 66 (34 percent) of the woodland patches ranging from one to less than 20 hectares in size tend to be dominated by edge-tolerant bird species. The remaining 21 (12 percent of) woodland patches range between 21 and 599 hectares in size. Twelve of these patches contain woodland between 20 and 100 hectares and may support a few area-sensitive species and some edge intolerant species, but will be dominated by edge tolerant species.

Conversely, nine (five percent) of the 191 woodland patches in the drainage area exceed the 100 plus hectare size needed to support most forest dependent, area sensitive birds and are large enough to support approximately 60 percent of edge-intolerant species. Four patches top 200 hectares, which according to the Environment Canada Guideline will support 80 percent of edge-intolerant forest bird species (including most area sensitive species) that prefer interior forest habitat conditions.

Table 49 presents a comparison of woodland patch size in 2008 and 2014 along with any changes that have occurred over that time. A decrease (of five hectares) has been observed in the overall woodland patch area between the two reporting periods with most change occurring in the greater than 200 woodland patch size class range.

Table 49 Woodland patches in the Crow Lake catchment (2008 and 2014)
Woodland Patch Size Range (ha)Woodland* PatchesPatch Change
200820142008 to 2014
NumberAreaNumberAreaNumberArea
CountPercent HaPercentCountPercent HaPercentCountHa
Less than 1 10254311104543112
1 to 206534348116634348111
20 to 50952448952448
50 to 100322297322297
100 to 20053699235369823-1
Greater than 2004215295042152550-4
*Includes treed swamps
 

4.2.2 Woodland (Forest) Interior Habitat

The forest interior is habitat deep within woodlands. It is a sheltered, secluded environment away from the influence of forest edges and open habitats. Some people call it the “core” or the “heart” of a woodland. The presence of forest interior is a good sign of woodland health, and is directly related to the woodland’s size and shape. Large woodlands with round or square outlines have the greatest amount of forest interior. Small, narrow woodlands may have no forest interior conditions at all. Forest interior habitat is a remnant natural environment, reminiscent of the extensive, continuous forests of the past. This increasingly rare forest habitat is now a refuge for certain forest-dependent wildlife; they simply must have it to survive and thrive in a fragmented forest landscape (Conserving the Forest Interior. Ontario Extension Notes, 2000).

The Natural Heritage Reference Manual states that woodland interior habitat is usually defined as habitat more than 100 metres from the edge of the woodland and provides for relative seclusion from outside influences along with a moister, more sheltered and productive forest habitat for certain area sensitive species. Woodlands with interior habitat have centres that are more clearly buffered against the edge effects of agricultural activities or more harmful urban activities than those without.

Bobs Lake Catchment

In the Bobs Lake catchment (in 2014), the 609 woodland patches contain 76 forest interior patches (Figure 122) that occupy seven percent (646 ha.) of the catchment land area (which is greater than the five percent of interior forest in the Tay River subwatershed). This is below the ten percent figure referred to in the Environment Canada Guideline that is considered to be the minimum threshold for supporting edge intolerant bird species and other forest dwelling species in the landscape.

Most patches (58) have less than 10 hectares of interior forest, 27 of which have small areas of interior forest habitat less than one hectare in size. The remaining 18 patches contain interior forest between 11 and 78 hectares in area. Between 2008 and 2014, the greatest change in woodland interior patch area has taken place in the 50 to 100 hectare range (Table 50), suggesting an increase in forest fragmentation over the six year period.

Table 50 Woodland interior in the Bobs Lake catchment (2008 and 2014)
Woodland Interior Habitat Size Range (ha)Woodland InteriorInterior Change
200820142008 to 2014
NumberAreaNumberAreaNumberArea
CountPercentHaPercentCountPercent HaPercentCountHa
Less than 1 273671273671
1 to 10314110216314110116-1
10 to 30101316525111419430129
30 to 504513721451552418
50 to 10045241373418929-1-52
 
Crow Lake Catchment

In the Crow Lake catchment (in 2014), the 191 woodland patches contain 35 forest interior patches (Figure 123) that occupy four percent (196 ha.) of the catchment land area (which is less than the five percent of interior forest in the Tay River subwatershed). This is below the ten percent figure referred to in the Environment Canada Guideline that is considered to be the minimum threshold for supporting edge intolerant bird species and other forest dwelling species in the landscape.

Most patches (27) have less than 10 hectares of interior forest, fifteen of which have small areas of interior forest habitat less than one hectare in size. The remaining eight patches contain interior forest between 11 and 32 hectares in area. Between 2008 and 2014, there was an overall loss of two hectares of interior forest habitat in the catchment (Table 51).

Table 51 Woodland interior in the Crow Lake catchment (2008 and 2014)
Woodland Interior Habitat Size Range (ha)Woodland InteriorInterior Change
200820142008 to 2014
NumberAreaNumberAreaNumberArea
CountPercentHaPercentCountPercent HaPercentCountHa
Less than 1 154353154353
1 to 101234462312344623
10 to 307201145772011358-1
30 to 50133317133216-1
*Includes treed swamps
 

4.3 Wetland Cover

Wetlands are habitats forming the interface between aquatic and terrestrial systems. They are among the most productive and biologically diverse habitats on the planet. By the 1980s, according to the Natural Heritage Reference Manual, 68 percent of the original wetlands south of the Precambrian Shield in Ontario had been lost through encroachment, land clearance, drainage and filling.

Wetlands perform a number of important ecological and hydrological functions and provide an array of social and economic benefits that society values. Maintaining wetland cover in a watershed provides many ecological, economic, hydrological and social benefits that are listed in the Reference Manual and which may include:

  • contributing to the stabilization of shorelines and to the reduction of erosion damage through the mitigation of water flow and soil binding by plant roots
  • mitigating surface water flow by storing water during periods of peak flow (such as spring snowmelt and heavy rainfall events) and releasing water during periods of low flow (this mitigation of water flow also contributes to a reduction of flood damage)
  • contributing to an improved water quality through the trapping of sediments, the removal and/or retention of excess nutrients, the immobilization and/or degradation of contaminants and the removal of bacteria
  • providing renewable harvesting of timber, fuel wood, fish, wildlife and wild rice
  • contributing to a stable, long-term water supply in areas of groundwater recharge and discharge
  • providing a high diversity of habitats that support a wide variety of plants and animals
  • acting as “carbon sinks” making a significant contribution to carbon storage
  • providing opportunities for recreation, education, research and tourism

Historically, the overall wetland coverage within the Great Lakes basin exceeded 10 percent, but there was significant variability among watersheds and jurisdictions, as stated in the Environment Canada Guideline. In the Rideau Valley Watershed, it has been estimated that pre-settlement wetland cover averaged 35 percent using information provided by Ducks Unlimited Canada (2010) versus the 21 percent of wetland cover existing in 2014 derived from DRAPE imagery analysis.

Bobs Lake Catchment

Reliable, pre-settlement wetland cover data is unavailable for the Bobs Lake catchment; however, data for the years 2008 and 2014 is available and shows that wetland cover remains largely unchanged at 14 percent in 2014 (as shown in Figure 124 and indicated in Table 52). To maintain critical hydrological, ecological functions along with related recreational and economic benefits provided by these wetland habitats in the catchment, a “no net loss” of currently existing wetlands should be employed to ensure the continued provision of tangible benefits accruing from them to landowners and surrounding communities.

CurrentWetlandTay-RiverBobs-Lake-001-001

Figure 124 Wetland cover in the Bobs Lake catchment (2014)
 
Table 52 Wetland cover in the Bobs Lake catchment (2014)
Wetland Cover Pre-settlement20082014Change - Historic to 2014
Area  Area  Area  Area  
Ha Percent Ha Percent Ha Percent Ha Percent 
Bobs Laken/an/a177413178914n/an/a
Tay Rivern/an/a15280191533019n/an/a
 
Crow Lake Catchment

Reliable, pre-settlement wetland cover data is unavailable for the Crow Lake catchment; however, data for the years 2008 and 2014 is available and shows that wetland cover remains largely unchanged at 18 percent in 2014 (as indicated in Table 53 and shown in Figure 125). To maintain critical hydrological, ecological functions along with related recreational and economic benefits provided by these wetland habitats in the catchment, a “no net loss” of currently existing wetlands should be employed to ensure the continued provision of tangible benefits accruing from them to landowners and surrounding communities.

CurrentWetlandTay-RiverCrow-Lake-001-001

Figure 125 Wetland cover in the Crow Lake catchment (2014)
 
Table 53 Wetland cover in the Crow Lake catchment (2014)
Wetland Cover Pre-settlement20082014Change - Historic to 2014
Area  Area  Area  Area  
Ha Percent Ha Percent Ha Percent Ha Percent 
Crow Laken/an/a8861789118n/an/a
Tay Rivern/an/a15280191533019n/an/a
 

4.4 Shoreline Cover

The riparian or shoreline zone is that special area where the land meets the water. Well-vegetated shorelines are critically important in protecting water quality and creating healthy aquatic habitats, lakes and rivers. Natural shorelines intercept sediments and contaminants that could impact water quality conditions and harm fish habitat in streams. Well established buffers protect the banks against erosion, improve habitat for fish by shading and cooling the water and provide protection for birds and other wildlife that feed and rear young near water. A recommended target (from the Environment Canada Guideline) is to maintain a minimum 30 metre wide vegetated buffer along at least 75 percent of the length of both sides of rivers, creeks and streams.

 
Bobs Lake Catchment

Figure 126 shows the extent of the ‘Natural’ vegetated riparian zone (predominantly wetland/woodland features) and ‘Other’ anthropogenic cover (crop/pastureland, roads/railways, settlements) along a 30-metre-wide area of land around Bobs Lake, other lakes and along both sides of the shoreline of the many unnamed watercourses (including headwater streams) found in the Bobs Lake catchment.

Figure 126 Natural and other riparian land cover in the Bobs Lake catchment (2014)
 

This analysis shows that the Bobs Lake catchment riparian buffer is composed of woodland (56 percent), wetland (32 percent), settlement (five percent), crop and pastureland (three percent), transportation (two percent) and meadow-thicket (two percent). Along the many watercourses (including headwater streams) flowing into Bobs Lake, the riparian buffer is composed of wetland (46 percent), woodland (44 percent), crop and pastureland (four percent), meadow-thicket (three percent), roads (two percent), and settlement areas (one percent).

Around Bobs Lake itself, the shoreline buffer is dominated by woodland (79 percent) and cottages, houses and camps (14 percent) with the remainder comprised of roads (three percent), wetlands (two percent) and crop and pastureland (one percent) along with meadow-thicket (one percent).

Additional statistics for the Bobs Lake catchment and Bobs Lake itself are presented in Tables 54 to 56 and show that there has been little change in shoreline cover from 2008 to 2014.

 
Table 54 Riparian land cover in the Bobs Lake catchment (2008 vs. 2014)
Riparian Land Cover20082014Change - 2008 to 2014
AreaAreaArea
Ha.Percent Ha.PercentHa.Percent
Woodland1194.3256.361190.6256.18-3.70-0.18
Wetland663.2531.29669.1631.575.910.28
> Unevaluated(592.22)(27.94)(598.13)(28.22)(5.91)(0.28)
> Evaluated(71.03)(3.35)(71.03)(3.35)(0.00)(0.00)
Settlement102.684.85101.594.79-1.09-0.06
Crop & Pasture60.642.8660.582.86-0.060.00
Transportation49.652.3449.752.350.100.01
Table 55 Riparian land cover around Bobs Lake (2008 vs. 2014)
Riparian Land Cover20082014Change - 2008 to 2014
AreaAreaArea
Ha.Percent Ha.PercentHa.Percent
Woodland439.0278.61438.1178.45-0.91-0.16
Wetland13.322.3913.442.410.120.02
> Unevaluated(12.84)(2.30)(12.96)(2.32)(0.12)(0.02)
> Evaluated(0.48)(0.09)(0.48)(0.09)(0.00)(0.00)
Settlement79.3414.2180.1314.350.790.14
Transportation17.673.1717.673.170.000.00
Meadow-Thicket4.640.834.640.830.000.00
Crop & Pasture4.440.804.440.800.000.00
Table 56 Riparian land cover along streams in the Bobs Lake catchment (2008 vs. 2014)
Riparian Land Cover20082014Change - 2008 to 2014
AreaAreaArea
Ha.Percent Ha.PercentHa.Percent
Wetland604.7445.19610.5345.635.790.44
> Unevaluated(536.11)(40.06)(541.90)(40.50)(5.79)(0.44)
>Evaluated(68.63)(5.13)(68.63)(5.13)(0.00)(0.00)
Woodland591.5644.21588.7744.00-2.79-0.21
Crop & Pasture54.454.0754.394.06-0.06-0.01
Meadow-Thicket39.102.9237.942.84-1.16-0.08
Transportation29.282.1929.392.200.110.01


Crow Lake Catchment

Figure 127 shows the extent of the ‘Natural’ vegetated riparian zone (predominantly wetland/woodland features) and ‘Other’ anthropogenic cover (crop/pastureland, roads/railways, settlements) along a 30-metre-wide area of land around Crow Lake, other lakes and along both sides of the shoreline of the many unnamed watercourses (including headwater streams) found in the Crow Lake catchment.

Figure 127 Natural and other riparian land cover in the Crow Lake catchment
 

This analysis shows that the riparian zone in the Crow Lake catchment is composed of woodland (56 percent), wetland (35 percent), meadow-thicket (three percent), settlement (three percent),  roads (two percent) and crop and pastureland (one percent).

Along the many watercourses (including headwater streams) flowing into Beaver, Crow, Sucler and Victoria Lake, the riparian buffer is composed of woodland (51 percent), wetland (42 percent), meadow-thicket (three percent), roads (two percent), settlement areas (one percent) and crop and pastureland (one percent).

Around Crow Lake itself, the shoreline buffer is dominated by woodland (65 percent) and cottages, houses and camps (21 percent) with the remainder comprised of roads (seven percent), wetlands (four percent), crop and pastureland (two percent) and meadow-thicket (one percent).

Additional statistics for the Crow Lake catchment are presented in Tables 57 to 59 and show that there has been little change in shoreline cover from 2008 to 2014.

 
Table 57 Riparian land cover (2008 vs. 2014) in the Crow Lake catchment
Riparian Land Cover20082014Change - 2008 to 2014
AreaAreaArea
Ha.Percent Ha.PercentHa.Percent
Woodland4565645556-1
Wetland28435285351
> Unevaluated(284)(35)(285)(35)(1)(0)
Meadow-Thicket263263
Settlement233233
Transportation162162
Crop & Pasture7171
Table 58 Riparian land cover (2008 vs. 2014) around Crow Lake
Riparian Land Cover20082014Change - 2008 to 2014
AreaAreaArea
Ha.Percent Ha.PercentHa.Percent
Woodland37.3765.0137.3765.010.000.00
Settlement12.2521.3112.3021.410.100.10
Transportation3.776.573.776.570.000.00
Wetland2.103.662.103.660.000.00
> Unevaluated(2.10)(3.66)(2.10)(3.66)(0.00)(0.00)
Crop & Pasture1.372.401.322.30-0.10-0.10
Meadow-Thicket0.601.060.601.060.000.00
Table 59 Riparian land cover (2008 vs. 2014) along streams in the Crow Lake Catchment
Riparian Land Cover20082014Change - 2008 to 2014
AreaAreaArea
Ha.Percent Ha.PercentHa.Percent
Woodland334.8350.72334.4650.67-0.37-0.05
Wetland275.2141.69275.5841.750.370.06
> Unevaluated(275.21)(41.69)(275.58)(41.75)(0.37)(0.06)
Meadow-Thicket23.213.5223.213.520.000.00
Transportation10.491.5910.491.590.000.00
Settlement10.231.5510.231.550.000.00

5.0 Bobs and Crow Lake Catchments: Stewardship and Water Resources Protection

The RVCA and its partners are working to protect and enhance environmental conditions in the Tay River Watershed. Figure 128 shows the location of all stewardship projects completed in the Bobs Lake catchment and Figure 129 shows the location of all stewardship projects completed in the Crow Lake catchment.

StewardshipTay-RiverBobs-Lake-001-001

Figure 128 Stewardship site locations in the Bobs Lake catchment
 

StewardshipTay-RiverCrow-Lake-001-001

Figure 129 Stewardship site locations in the Crow Lake catchment
 

5.1 Rural Clean Water

The Rural Clean Water Program provides technical and financial assistance to farmers and other rural landowners, to aid in the implementation of projects that protect water quality. Funding is granted to those projects that support best management practices for application in the protection and improvement of surface and ground water resources.  The program also supports climate change adaptation and low impact development projects as well as educating rural landowners about environmental stewardship of private property. Examples of supported projects include livestock exclusion fencing, controlled tile drainage, cover crops, erosion control, well related projects, and many more. For a list of eligible projects and to apply for funding, see Rural Clean Water.

In the Bobs Lake Catchment from 2011 to 2016, four erosion control projects, four windbreaks/buffers, and two septic system repairs were completed; prior to this, three septic system repairs, two erosion control projects and one windbreak/buffer had been completed. When combined, these projects are keeping 4.84 kilograms of Phosphorus out of our lakes, rivers and streams every year. Total value of all 16 projects is $93,593 with $25,868 of that amount funded through grant dollars from the RVCA.

In the Crow Lake Catchment from 2011 to 2016, five windbreaks/buffers and three erosion control projects were completed; prior to this, one septic system repairs was completed. When combined, these projects are keeping 37.46 kilograms of Phosphorus out of our lakes, rivers and streams each year. Total value of all nine projects is $24,859 with $12,996 of that amount funded through grant dollars from the RVCA.


5.2 Private Land Forestry

Forest cover and tree planting continues to be one of the most widely supported strategies to improve our environment. The many benefits of forest cover include carbon sequestration, flood mitigation and water quality improvement as well as providing wildlife habitat.

Through the RVCA's Trees for Tomorrow Program, 27,550 trees have been planted in the Bobs Lake Catchment at three sites from 2011 to 2016; prior to this, no trees have been planted in the catchment with the program's assistance. This has resulted in the reforestation of 14 hectares at a total project value of $58,992 with $52,767 of that amount coming from fundraising sources.

An additional 10 butternut trees were planted through the RVCA Butternut Recovery Program in the Bobs Lake Catchment as part of efforts to introduce healthy seedlings from tolerant butternuts into various locations across Eastern Ontario.

In the Crow Lake Catchment prior to 2005, 500 trees were planted for a total project value of $500. No other trees have been planted since then using the services of the Trees for Tomorrow Program.

For more information about the Program and landowner eligibility, please see the following: Tree Planting in the Rideau Valley Watershed and Trees for Tomorrow.

5.3 Shoreline Naturalization

Natural shoreline buffers rich in native plants are critically important to protecting the health of our lakes, rivers and streams. Shoreline vegetation protects water quality and aquatic habitat by intercepting potentially harmful contaminants such as nutrients, pollutants and sediment, regulating water temperatures, slowing runoff and providing important fish and wildlife habitat. Natural shorelines also help improve climate change resiliency by increasing flood storage and providing protection from erosion during extreme weather events.

Though the RVCA’s Shoreline Naturalization Program, landowners (private and public property owners) have naturalized more than 2.3 km of shoreline in the Tay Watershed by planting over 10,563 native trees and shrubs at 96 sites since 2008. A number of these projects have been undertaken in partnership with community groups like the Greater Bobs and Crow Lakes Association.

In the Bobs Lake Catchment, a total of 1034 native trees and shrubs have been planted along 260 metres of shoreline at an average buffer width of three metres for a total project value of $8,081. 

In the Crow Lake Catchment, a total of 446 native trees and shrubs have been planted along 147 metres of shoreline at an average buffer width of four metres for a total project value of $5,284.


5.4 Septic System Re-inspection

Septic system re-inspection is provided by the RVCA through the Mississippi Rideau Septic System Office at the request of South Frontenac and Tay Valley Townships.

Since 2004, the service has performed 151 mandatory and voluntary septic system re-inspections on 119 properties in the Bobs Lake catchment, of which, one hundred and forty-nine mandatory inspections were conducted on 117 properties around Bobs Lake in Tay Valley Township along with other two voluntary re-inspections on two properties in the Township of South Frontenac.

Remedial/maintenance work (i.e. pump outs and baffle replacements that generally do not require a permit) was recommended for 27 of those inspections; two more inspections resulted in additional information being supplied to landowners and one other inspection identified the need for a septic system replacement.

5.5 Valley, Stream, Wetland and Hazard Lands

The Bobs Lake Catchment covers 132 square kilometres with 9.3 square kilometres (or seven percent) of the drainage area being within the regulation limit of Ontario Regulation 174/06 (Figure 130), giving protection to wetland areas and river or stream valleys that are affected by flooding and erosion hazards.

Wetlands occupy 11 square kilometres (or 21 percent) of the catchment. Of these wetlands, two square kilometres (or 18 percent) are designated as provincially significant and included within the RVCA regulation limit. This leaves the remaining 9 sq. km (or 82 percent) of wetlands in the catchment outside the regulated area limit.

Of the 324.3 kilometres of stream in the catchment, regulation limit mapping has been plotted along 22.8 kilometers of streams (representing seven percent of all streams in the catchment). Some of these regulated streams (16.4 km) flow through regulated wetlands; the remaining 6.4 kilometres of regulated streams are located outside of those wetlands. Plotting of the regulation limit on the remaining 301.5 kilometres (or 93 percent) of streams requires identification of flood and erosion hazards and valley systems.

Within those areas of the Bobs Lake catchment subject to the regulation (limit), efforts (have been made and) continue through RVCA planning and regulations input and review to manage the impact of development (and other land management practices) in areas where “natural hazards” are associated with rivers, streams, valley lands and wetlands. For areas beyond the regulation limit, protection of the catchment’s watercourses is only provided through the “alteration to waterways” provision of the regulation.


RegulatedFeaturesNewTay-RiverBobs-Lake-001-001

Figure 130 Regulated natural features and hazards in the Bobs Lake catchment
 

The Crow Lake Catchment covers 50.7 square kilometres and contains 18 square kilometres of wetland along with 131.9 kilometres of stream. None of these natural features are subject to the regulation limit of Ontario Regulation 174/06 (Figure 78) for the protection of wetland areas and river or stream valleys that are affected by flooding and erosion hazards.

For areas where no regulation limit exists, protection of the catchment’s watercourses is provided through the “alteration to waterways” provision of the regulation.


RegulatedFeaturesNewTay-RiverCrow-Lake-001-001

Figure 131 Regulated natural features and hazards in the Crow Lake catchment
 

5.6 Vulnerable Drinking Water Areas

Mississippi-Rideau Source Water Protection Program has mapped several small areas of the Bobs Lake Catchment as a Significant Groundwater Recharge Area and all of the catchment as a Highly Vulnerable Aquifer (HVA). This means that the nature of the overburden (thin soils, fractured bedrock) does not provide a high level of protection for the underlying groundwater making the aquifer more vulnerable to contaminants released on the surface. There are no Well-Head Protection Areas in the catchment.

Mississippi-Rideau Source Water Protection Program has not mapped any area of the Crow Lake Catchment as a Significant Groundwater Recharge Area. It has, however, mapped all of the catchment as a Highly Vulnerable Aquifer (HVA). This means that the nature of the overburden (thin soils, fractured bedrock) does not provide a high level of protection for the underlying groundwater making the aquifer more vulnerable to contaminants released on the surface. There are no Well-Head Protection Areas in the catchment.

The Mississippi-Rideau Source Protection Plan includes policies that focus on the protection of groundwater region-wide due to the fact that most of the region, which encompasses the Mississippi and Rideau watersheds, is considered Highly Vulnerable Aquifer. For detailed maps and policies that have been developed to protect drinking water sources, visit the Mississippi-Rideau Source Protection Region website.

6.0 Bobs and Crow Lake Catchments: Accomplishments

Developed by the Greater Bobs and Crow Lakes Association and its partners, the Stewardship Plan for Bobs and Crow Lakes (2007) provides information on many aspects of the lake environment, as well as issues of concern and actions to be taken to maintain and improve the long-term health of the lakes. The following list includes some of the accomplishments of the Bobs and Crow Lakes Association and residents that have implications for the well-being of the land and water resources of the lake ecosystem. Specific achievements of the Bobs and Crow Lake communities are indicated by an asterisk.

Bobs and Crow Lake Catchment Health

Shoreline Naturalization

1034 native trees and shrubs have been planted at 18 project sites on Bobs Lake by the RVCA’s Shoreline Naturalization Program at an average buffer width of three metres along 260 metres of shoreline.

446 native trees and shrubs have been planted at seven project sites on Crow Lake by the RVCA’s Shoreline Naturalization Program at an average buffer width of four metres along 147 metres of shoreline.

Tree Planting

27,550 trees have been planted at three sites in the Bobs Lake catchment by the RVCA Private Land Forestry Program, resulting in the reforestation of 14 hectares.

500 trees have been planted at one site in the Crow Lake catchment by the RVCA Private Land Forestry Program.

Water Levels

Surface water flows and levels at the new Bolingbroke Dam on Bobs Lake will be better monitored as a result of input from the Greater Bobs and Crow Lakes Association. This information will enhance the management of the water control structure so that it will be better aligned with Parks Canada's established rule curve for this reservoir lake of the Rideau Canal.*

Water Quality

Bobs Lake, Crow Lake and Rock Lake are each sampled yearly by the RVCA for five parameters, four times a year to assess surface chemistry water quality conditions.

Ten Rural Clean Water projects were completed in the Bobs Lake catchment by the RVCA Rural Clean Water Program.

Eight Rural Clean Water projects were completed in the Crow Lake catchment by the RVCA Rural Clean Water Program.

Township of Central Frontenac will implement a septic re-inspection program (mandatory/voluntary) in 2019. The service is to be provided by the Mississippi-Rideau Septic System Office.

Bobs and Crow Lake Catchment Habitat

In-stream Habitat

39 headwaters sites were sampled by the RVCA's Stream Characterization Program.

Greater Bobs and Crow Lakes Association Leadership

Lake Planning

The Stewardship Plan for Bobs and Crow Lakes (2007) was published in March 2007. Since then, projects and issues related to the aim of the Plan have been discussed annually at the Lake Association’s Annual General Meeting, which is to 1) identify the qualities that make the area such a desirable place for people to live or visit and the challenges that put those qualities at risk 2) recommend a series of actions that will help to ensure the sustainability of the lakes, the lands, the natural ecosystem and the way of life that we value and 3) serve as a reference and guide to support continued activity for the stewardship of the lakes.*

As of 2017, the Bobs and Crow Lake Association and its Foundation has been partnering with the RVCA to provide additional program support to landowners interested in naturalizing their shoreline, protecting their shoreline from erosion and repairing septic systems.

Liaison with Other Lake Associations

The Greater Bobs and Crow Lakes Association continues to liaise with other local lake associations through its participation in the Lake Networking Group.*

7.0 Bobs and Crow Lake Catchments: Challenges/Issues

Developed by the Greater Bobs and Crow Lakes Association and its partners, the Stewardship Plan for Bobs and Crow Lakes (2007) provides information on many aspects of the lake environment, as well as issues of concern identified by the lake community that could threaten the long-term health of the lakes. The following list includes some of those identified issues that have implications for the land and water resources of the lake ecosystem. Specific issues noted by the lake community are indicated by an asterisk.

Development

Municipal jurisdiction is split between the three area municipalities (South/Central Frontenac and Tay Valley), which has created some inconsistencies in land use policies and zoning requirements and the ability to implement a comprehensive septic re-inspection program.*

There are numerous valid mining claims which are a significant cause for concern for local residents, particularly as it relates to property rights and the impact of mining activity on wildlife habitat and water quality.*

Waterfront property development is occurring primarily through the transformation of traditional, seasonal cottages into larger year-round dwellings. This transition is taking place either through re-development of an existing cottage lot or incremental alterations (additions, sleeping cabins, gazebos, decks, sheds, boat houses, garages, lawns, shoreline modifications, docks), all of which may put additional stress on the sensitive shoreline zone and the lake along with potential, added septic system loading.

Many waterfront properties contain existing non-conforming dwellings with respect to minimum water frontage and lot area and are often located within 30 metres of the water that require minor variances for expansion and/or reconstruction of dwellings where standard development setbacks from water are difficult to achieve. In these cases, of which there are many, staff at South/Central Frontenac and Tay Valley Townships and the Conservation Authority often meet with resistance and push back when attempts are made to implement standards for development setbacks, vegetated shorelines and septic systems.

Monitoring implementation of conditions of planning and regulatory approvals is challenging due to a lack of resources.

Headwaters/In-water Habitat/Shorelines

Crow Lake has 70 percent of its shoreline composed of natural vegetation. This is below the 75 percent target that is recommended by experts for the protection of the catchment’s waterbodies and watercourses, 30 metres back from the shoreline of streams, rivers and lakes (see Section 4.4 of this report).

Bobs and Crow Lake benefit from considerable lengths of natural shoreline. However many waterfront properties (particularly those in Buck/Mud/Long Bay and Crow Lake Village) have significant lengths of shoreline that are ornamental (see Section 4.4 of this report).

Bobs Lake has seen a small increase in the area of settlement (0.79 ha.) along its shoreline between 2008 and 2014, due primarily to a loss of woodland (see Section 4.4 of this report).

Crow Lake has seen a small increase in the area of settlement (0.10 ha.) along its shoreline between 2008 and 2014, due primarily to a loss of crop and pastureland (see Section 4.4 of this report).

Five of 39 sampled headwater sites in the Bobs Lake catchment have been modified (four are channelized, one is a roadside ditch)(see Section 3.2.2 of this report).

One of 22 sampled headwater sites in the Crow Lake catchment has been modified (i.e., is a roadside ditch)(see Section 3.3.2 of this report).

Littoral zone mapping identifying substrate type, vegetation and habitat features along with opportunities for shoreline enhancement is unavailable for Bobs and Crow Lake.

Land Cover

Bobs Lake catchment land cover has changed (2008 to 2014) as a result of an increase in the area of wetland (15 ha.), settlement (5 ha.), water (4 ha.) and transportation infrastructure (2 ha.) and a loss of woodland (20 ha.), meadow-thicket (5 ha.) and crop and pastureland (1 ha.)(see Section 4.1.1 of this report).

Crow Lake catchment land cover has changed (2008 to 2014) as a result of an increase in the area of wetland (5 ha.) and settlement (2 ha.) and loss of woodland (6 ha.)(see Section 4.1.2 of this report).

Wetlands cover 13 percent (1789 ha.) of the Bobs Lake catchment and 18 percent (891 ha.) of the Crow Lake catchment. Eighty-two percent (1465 ha.) of the Bobs Lake catchment wetlands along with one hundred percent (891 ha.) of the Crow Lake catchment wetlands remain unevaluated and unregulated and although they are not under imminent threat from development activity, they do remain vulnerable to drainage and land clearing activities in the absence of any regulatory and planning controls that would otherwise protect them for the many important hydrological, social, biological and ecological functions/services/values they provide to landowners and the surrounding community (see Section 4.3 of this report).

Water Levels

Greater Bobs and Crow Lakes Association has been concerned for many years about the operational management of the water control structure on Bobs Lake (locally known as the Bolingbroke Dam). Refurbishment of that structure (now taking place) should include a review of past water level practices guided by the Bobs Lake rule curve to better inform future operations.*

Water Quality

Bobs Lake surface chemistry water quality rating ranges from Poor to Very Good at the nine deep point monitoring sites on the lake (see Section 2.1 of this report).

Crow Lake surface chemistry water quality does not exhibit any sampling concerns (see Section 2.3 of this report).

Rock Lake surface chemistry water quality rating ranges from Fair to Very Good. The score at this site is largely influenced by occasional high nutrient concentrations, bacterial pollution and metal (aluminum) exceedances (see Section 2.2 of this report).

Bobs and Crow Lake catchment instream biological water quality conditions are unavailable due to unsuitable benthic invertebrate sample locations.

Thirty (of 151) mandatory and voluntary septic system inspections conducted from 2004 to 2017 on Bobs Lake in South Frontenac and Tay Valley Townships revealed the need for remedial work on 27 septic systems, a septic replacement on another system along with more information to be supplied to an additional two landowners about their septic systems. Those properties with concerns are identified in the yearly report submitted by the Mississippi Rideau Septic System Office to the Townships.

No septic system re-inspection program (mandatory or voluntary) exists for Crow Lake.

8.0 Bobs and Crow Lake Catchments: Actions/Opportunities

Developed by the Greater Bobs and Crow Lakes Association and its partners, the Stewardship Plan for Bobs and Crow Lakes (2007) provides information on many aspects of the lake environment, as well as actions to be taken to maintain and improve the long-term health of the lakes. The following list includes some of those identified actions that have implications for the well-being of the land and water resources of the lake ecosystem. Specific actions noted by the Bobs Lake community are indicated by an asterisk.

Bobs and Crow Lake Catchments Health

Development

Work with approval authorities (Central Frontenac Township, Frontenac County, Kingston Frontenac Lennox and Addington Health Unit, Mississippi Rideau Septic System Office, RVCA, South Frontenac and Tay Valley Townships) and waterfront property owners (including the Greater Bobs and Crow Lakes Association and Rock Lake community) to consistently implement current land use planning and development policies for water quality and shoreline protection adjacent to Bobs and Crow Lake and headwater streams in the catchment (i.e., a minimum 30 metre development setback from water).

Explore ways and means to more effectively enforce and implement conditions of land-use planning and development approval to achieve net environmental gains (particularly with respect to rehabilitating or protecting naturally vegetated shorelines and water quality).

Encourage Committees of Adjustment to take advantage of technical and environmental information and recommendations forthcoming from planning and environmental professionals.

Municipalities in the Tay Watershed are encouraged to strengthen natural heritage and water resources official plan policies and zoning provisions (pertaining to water setbacks, frontage and naturalized shorelines and wetland protection) where deemed appropriate. 

Work with Central Frontenac Township, Frontenac County, South Frontenac and Tay Valley Townships and agencies to ensure that development approvals around lakes and along watercourses take into consideration the protection of fish habitat (including the near-shore nursery and spawning habitat).

Municipal and agency planners together with development proponents are to use the 2014 Site Evaluation Guidelines to inform decision-making about the application of development setbacks on lots with shallow soils/bedrock, steep slopes and sparse vegetation cover along with the use of the appropriate, development related, best management practices.

Utilize RVCA subwatershed and catchment reports to help develop/revise official plan policies to protect surface water resources and the natural environment (including woodlands, wetlands and shoreline cover).

Use 1:100 year flood elevation information now available for Bobs Lake as an additional factor to be considered when assessing development setbacks at the shoreline and protecting property owners from flood hazards.

Establish RVCA regulation limits around the 82 percent (1465 ha.) of wetlands in the Bobs Lake catchment along with the 100 hundred percent (891 ha.) of wetlands in the Crow Lake catchment catchment that are unevaluated. Doing this will help protect landowners from natural hazards including mitigating surface water flow by storing water during periods of peak flow (such as spring snowmelt and heavy rainfall events) and releasing water during periods of low flow (this mitigation of water flow reduces flood damage), as well as contributing to the stabilisation of shorelines and to the reduction of soil erosion damage through water flow mitigation and plant soil binding/retention.

Shorelines

Take advantage of the RVCA Shoreline Naturalization Program to re-naturalize altered creek, lake and stream shoreline identified in this report as “Unnatural Riparian Land Cover". Concentrate stewardship efforts on Bobs and Crow Lakes waterfront properties shown in orange on the Riparian Land Cover map (see Figures 126/127 in Section 4.4 of this report). Other stewardship opportunities in the catchment may be determined based on septic system inspections and surface water quality monitoring results.

Promote the use of bioengineering methods (using native shrub/tree planting, fascines, live stakes) as a shoreline erosion mitigation measure as well as a cost effective alternative to shoreline hardening (with rip rap, armour stone, gabion baskets, walls)

Educate landowners about the value and importance of headwater drainage features, natural shorelines and waterfront property best management practices with respect to shoreline use and development, septic system installation and maintenance and shoreline vegetation retention and enhancement (Central Frontenac Township, Frontenac County, Greater Bobs and Crow Lakes Association, Kingston Frontenac Lennox and Addington Health Unit, Mississippi-Rideau Septic System Office, Rock Lake community, RVCA, South Frontenac and Tay Valley Townships).

Water Quality

Greater Bobs and Crow Lakes Association will work with the Township of South Frontenac to establish a septic system re-inspection program on Bobs and Crow Lake along with an associated educational program.*

Consider further investigation of the Poor to Very Good surface chemistry water quality rating on Bobs Lake as part of a review of RVCA's Watershed Watch, Baseline and Benthic Invertebrate surface water quality monitoring.

Offer funding provided by the RVCA Rural Clean Water Program to landowners with potential projects that could improve water quality on Bobs and Crow Lakes and their tributaries (e.g., livestock fencing, septic system repair/replacement and streambank erosion control/stabilisation). Concentrate efforts at septic systems requiring remedial work or replacement, including the 28 identified as needing additional maintenance/remedial/replacement work since 2004.

Educate waterfront property owners about septic system care by providing information about sewage system maintenance (i.e., when to pump out septic systems and holding talks) through initiatives such as the Septic Savvy Workshop and services provided by the Mississippi Rideau Septic System Office.

Reduce pollutant loadings to Bobs Lake through education about the application of shoreline, stormwater and agricultural best management practices; also consider using low impact development (LID) methods to improve the quality and reduce the amount of stormwater runoff directly reaching the lake ecosystem. This will be particularly beneficial in areas with extensive impervious surfaces (i.e., asphalt, concrete, buildings, and severely compacted soils) or on sensitive waterfront properties (with steep slopes/banks, shallow/impermeable soils).

Bobs and Crow Lake Catchments Habitat

Aquatic Habitat/Fisheries/Wildlife

Increase boating enforcement in established high hazard areas (e.g. narrows, environmentally sensitive areas like wildlife and fish nesting sites and high density population areas) and post signage in sensitive shoreline and wetland habitats to discourage intrusion by personal watercraft.*

Educate waterfront property owners about: 1) fish habitat requirements, spawning timing and near-shore and in-water activities that can disturb or destroy fish habitat and spawning sites 2) the causes of excessive algae and aquatic vegetation growth (see the RVCA publication entitled Algae and Aquatic Plant Educational Manual) and 3) healthy lake ecosystems and associated water level fluctuations in a natural environment.

Greater Bobs and Crow Lakes Association Leadership

Lake Planning

The Greater Bobs and Crow Lakes Association is leading the coordination of the implementation of the recommendations of the Stewardship Plan for Bobs and Crow Lakes (2007).

Consider a ten-year review of the Stewardship Plan for Bobs and Crow Lakes (2007).

Use the information contained in the Tay River Subwatershed Report 2017 and Bobs Lake Catchment Report 2017 to assist with implementation of the Bobs and Crow Lakes Stewardship Plan (2007) and an update to it.

Water Levels

Surface water flows and levels at the new Bolingbroke Dam on Bobs Lake will be better monitored as a result of input from the Greater Bobs and Crow Lakes Association. This information will help to ensure that management of the water control structure will more closely align with Parks Canada's existing rule curve (and any subsequent revisions to it) for this reservoir lake of the Rideau Canal.*

Continue dialogue with the Parks Canada - Rideau Canal Office (RCO) and others to ensure that water levels are managed in a manner that balances fish and wildlife habitat needs within the riparian zone along with recreational and aesthetic uses of Bobs Lake, while recognizing the need to maintain downstream water levels and accommodate other uses of the lake. Establish an education and communications program about managing water levels so that people are aware of the possibilities and limitations inherent in the operation of the new Bolingbroke Dam.*