3. Otter Creek and Lake Riparian Conditions
Shoreline Buffer Land Cover Evaluation
The riparian or shoreline zone is that special area where land meets water. Well-vegetated shorelines are critically important in protecting water quality and creating healthy aquatic habitats, lakes and rivers. Natural shorelines intercept sediments and contaminants that could impact water quality conditions and harm fish habitat in streams. Well established buffers protect the banks against erosion, improve habitat for fish by shading and cooling the water and provide protection for birds and other wildlife that feed and rear young near water. A recommended target (from Environment Canada’s Guideline: How Much Habitat is Enough?) is to maintain a minimum 30 metre wide vegetated buffer along at least 75 percent of the length of both sides of rivers, creeks and streams.
Figure 38 shows the extent of the naturally vegetated riparian zone along a 30 metre wide strip of the shoreline of Otter Lake, Otter Creek and its tributaries. This information is derived from a dataset developed by the RVCA’s Land Cover Classification Program through heads-up digitization of 20cm DRAPE ortho-imagery at a 1:4000 scale, which details the catchment landscape using 10 land cover classes.

This analysis shows that the Otter Lake and Creek catchment riparian buffer is comprised of wetland (56 percent), woodland (24 percent), crop and pastureland (10 percent), settlement areas (seven percent) and transportation routes (three percent). Along Otter Creek and its tributaries, the riparian buffer is comprised of woodland (60 percent), roads (17 percent), wetland (15 percent), crop and pastureland (six percent) and settlement areas (two percent). Around Otter Lake itself, the shoreline buffer is dominated by cottages, houses and recreational camps (50 percent) with the remainder composed of woodland (23 percent), wetland (22 percent) and roads (five percent).
Additional statistics for the Otter Lake and Creek catchment and Otter Lake itself are presented in Tables 13 and 14. Of particular interest is the observed increase in the area of “Settlement” along the shoreline of Otter Lake over a six year period.
| Riparian Land Cover | 2008 | 2014 | Change - 2008 to 2014 | |||
|---|---|---|---|---|---|---|
| Area | Area | Area | ||||
| Ha. | Percent | Ha. | Percent | Ha. | Percent | |
| Wetland | 434 | 54 | 450 | 56 | 16 | 2 |
| > Evaluated | (355) | (44) | (355) | (44) | (0) | (0) |
| > Unevaluated | (79) | (10) | (95) | (12) | (16) | (2) |
| Woodland | 214 | 26 | 193 | 24 | -21 | -2 |
| Crop & Pasture | 81 | 10 | 82 | 10 | 1 | |
| Settlement | 57 | 7 | 61 | 7 | 4 | |
| Transportation | 21 | 3 | 21 | 3 | ||
| Riparian Land Cover | 2008 | 2014 | Change - 2008 to 2014 | |||
|---|---|---|---|---|---|---|
| Area | Area | Area | ||||
| Ha. | Percent | Ha. | Percent | Ha. | Percent | |
| Settlement | 27 | 44 | 31 | 50 | 4 | 6 |
| Woodland | 18 | 29 | 14 | 23 | -4 | -6 |
| Wetland | 14 | 22 | 14 | 22 | ||
| > Evaluated | (13) | (21) | (13) | (21) | (0) | (0) |
| > Unevaluated | (1) | (1) | (1) | (1) | (0) | (0) |
| Transportation | 3 | 5 | 3 | 5 | ||
Otter Creek Overbank Zone
Riparian Buffer Width Evaluation
Figure 39 demonstrates the buffer conditions of the left and right banks separately. Otter Creek had a buffer of greater than 30 meters along 86 percent of the right bank and 91 percent of the left bank.

Adjacent Land Use
The RVCA’s Stream Characterization Program identifies seven different land uses beside Otter Creek (Figure 40). Surrounding land use is considered from the beginning to end of the survey section (100 m) and up to 100m on each side of the creek. Land use outside of this area is not considered for the surveys but is nonetheless part of the subwatershed and will influence the creek. Natural areas made up 91 percent of the stream, characterized by wetlands, forest, scrubland and meadow. The remaining land use consisted of infrastructure in the form of residential, recreational and road crossings.

Otter Creek Shoreline Zone
Instream Erosion
Erosion is a normal, important stream process and may not affect actual bank stability; however, excessive erosion and deposition of sediment within a stream can have a detrimental effect on important fish and wildlife habitat. Poor bank stability can greatly contribute to the amount of sediment carried in a waterbody as well as loss of bank vegetation due to bank failure, resulting in trees falling into the stream and the potential to impact instream migration. Figure 41 shows low levels of erosion along Otter Creek.

Undercut Stream Banks
Undercut banks are a normal and natural part of stream function and can provide excellent refuge areas for fish. Figure 42 shows that Otter Creek had low levels of undercut banks.

Stream Shading
Grasses, shrubs and trees all contribute towards shading a stream. Shade is important in moderating stream temperature, contributing to food supply and helping with nutrient reduction within a stream. Figure 43 shows highly variable stream shading conditions ranging from low levels to high levels along Otter Creek.

Instream Woody Debris
Figure 44 shows that the majority of Otter Creek had low to moderate levels of instream woody debris in the form of branches and trees. Instream woody debris is important for fish and benthic invertebrate habitat, by providing refuge and feeding areas.

Overhanging Trees and Branches
Figure 45 shows low levels of overhanging branches and trees along Otter Creek. Overhanging branches and trees provide a food source, nutrients and shade which helps to moderate instream water temperatures.

Anthropogenic Alterations
Figure 46 shows 76 percent of Otter Creek remains “unaltered” with no anthropogenic alterations. Nineteen percent of Otter Creek was classified as natural with minor anthropogenic changes, two percent was classified as altered and three percent of its length was considered highly altered in the form of road crossings.

Otter Creek Instream Aquatic Habitat
Benthic Invertebrates
Freshwater benthic invertebrates are animals without backbones that live on the stream bottom and include crustaceans such as crayfish, molluscs and immature forms of aquatic insects. Benthos represent an extremely diverse group of aquatic animals and exhibit wide ranges of responses to stressors such as organic pollutants, sediments and toxicants, which allows scientists to use them as bioindicators. As part of the Ontario Benthic Biomonitoring Network (OBBN), the RVCA has been collecting benthic invertebrates at the County Road 29 site on Otter Creek since 2003. Monitoring data is analyzed for each sample site and the results are presented using the Family Biotic Index, Family Richness and percent Ephemeroptera, Plecoptera and Trichoptera.
Hilsenhoff Family Biotic Index
The Hilsenhoff Family Biotic Index (FBI) is an indicator of organic and nutrient pollution and provides an estimate of water quality conditions for each site using established pollution tolerance values for benthic invertebrates. FBI results for Otter Creek are separated by reporting period 2003 to 2008 and 2009 to 2014. “Very Poor” to “Fair” water quality conditions being observed at the Otter Creek sample location for the period from 2003 to 2014 (Fig.47) using a grading scheme developed by Conservation Authorities in Ontario for benthic invertebrates.

Family Richness
Family Richness measures the health of the community through its diversity and increases with increasing habitat diversity suitability and healthy water quality conditions. Family Richness is equivalent to the total number of benthic invertebrate families found within a sample. Although the family richness appears to be fair for the Otter Creek sample location the samples are dominated by species that are moderately tolerant and tolerant to poor water quality conditions. Otter Creek is reported to have “Fair” family richness (Fig.48).

EPT
Ephemeroptera (Mayflies), Plecoptera (Stoneflies), and Trichoptera (Caddisflies) are species considered to be very sensitive to poor water quality conditions. High abundance of these organisms is generally an indication of good water quality conditions at a sample location. The community structure is dominated by species that are not sensitive to poor water quality conditions. As a result, the EPT indicates that Otter Creek is reported to have “Poor” water quality (Fig.49) from 2003 to 2014.

Overall Otter Creek has a water quality rating from a benthic invertebrate perspective of “Poor” from 2003 to 2014.
Habitat Complexity
Streams are naturally meandering systems and move over time; there are varying degrees of habitat complexity, depending on the creek. Examples of habitat complexity include variable habitat types such as pools and riffles as well as substrate variability and woody debris structure. A high percentage of habitat complexity (heterogeneity) typically increases the biodiversity of aquatic organisms within a system. Fifty five percent of Otter Creek was considered heterogeneous, as shown in Figure 50.

Instream Substrate
Diverse substrate is important for fish and benthic invertebrate habitat because some species have specific substrate requirements and for example will only reproduce on certain types of substrate. Figure 51 shows that 36 percent of the substrate observed on Otter Creek was dominated by silt. Overall substrate conditions were highly variable along Otter Creek. Figure 52 shows the dominant substrate along Otter Creek.


Cobble and Boulder Habitat
Boulders create instream cover and back eddies for large fish to hide and/or rest out of the current. Cobble provides important spawning habitat for certain fish species like walleye and various shiner species who are an important food source for larger fish. Cobble can also provide habitat conditions for benthic invertebrates that are a key food source for many fish and wildlife species. Figure 53 shows where cobble and boulder substrate are found in Otter Creek.

Instream Morphology
Pools and riffles are important habitat features for fish. Riffles are areas of agitated water and they contribute higher dissolved oxygen to the stream and act as spawning substrate for some species of fish, such as walleye. Pools provide shelter for fish and can be refuge pools in the summer if water levels drop and water temperature in the creek increases. Pools also provide important over wintering areas for fish. Runs are usually moderately shallow, with unagitated surfaces of water and areas where the thalweg (deepest part of the channel) is in the center of the channel.
Figure 54 shows that Otter Creek is variable; 82 percent consists of runs, 11 percent pools and 8 percent riffles. Figure 55 shows where riffle habitat is located along Otter Creek.


Vegetation Type
Instream vegetation provides a variety of functions and is a critical component of the aquatic ecosystem. For example emergent plants along the shoreline can provide shoreline protection from wave action and important rearing habitat for species of waterfowl. Submerged plants provide habitat for fish to find shelter from predator fish while they feed. Floating plants such as water lilies shade the water and can keep temperatures cool while reducing algae growth. Otter Creek had high levels of diversity of instream vegetation. The dominant vegetation type recorded at twenty-five percent consisted of submerged plants. Figure 56 depicts the plant community structure for Otter Creek. Figure 57 shows the dominant vegetation community for each section surveyed along Otter Creek.


Instream Vegetation Abundance
Instream vegetation is an important factor for a healthy stream ecosystem. Vegetation helps to remove contaminants from the water, contributes oxygen to the stream, and provides habitat for fish and wildlife. Too much vegetation can also be detrimental. Figure 58 demonstrates that Otter Creek had common to normal levels of instream vegetation for most of its length.

Invasive Species
Invasive species can have major implications on streams and species diversity. Invasive species are one of the largest threats to ecosystems throughout Ontario and can out compete native species, having negative effects on local wildlife, fish and plant populations. Ninety four percent of the sections surveyed along Otter Creek had invasive species (Fig.59). The invasive species observed in Otter Creek were European frogbit, purple loosestrife, glossy and common buckthorn, Eurasian milfoil, flowering rush, carp, curly leafed pondweed, phragmites, zebra mussels, European/black alder and Manitoba maple. Figure 60 shows the frequency of the invasive species observed along Otter Creek.


Water Chemistry
During the stream characterization survey, a YSI probe is used to collect water chemistry information. Dissolved oxygen, conductivity and pH are measured at the start and end of each section.
Dissolved Oxygen
Dissolved oxygen is a measure of the amount of oxygen dissolved in water. The Canadian Environmental Quality Guidelines of the Canadian Council of Ministers of the Environment (CCME) suggest that for the protection of aquatic life the lowest acceptable dissolved oxygen concentration should be 6 mg/L for warmwater biota and 9.5 mg/L for coldwater biota (CCME, 1999). Figure 61 shows that the dissolved oxygen in the Otter Creek was well below the threshold for warmwater biota in several reaches of the system. The average dissolved oxygen levels observed within the main stem of Otter Creek was 5.90mg/L which is below the 6mg/L minimum that is recommended for warmwater biota.

Conductivity
Conductivity in streams is primarily influenced by the geology of the surrounding environment, but can vary drastically as a function of surface water runoff. Currently there are no CCME guideline standards for stream conductivity, however readings which are outside the normal range observed within the system are often an indication of unmitigated discharge and/or stormwater input. The average conductivity observed within the main stem of Otter Creek was 294 µs/cm. Figure 62 shows that the conductivity readings for Otter Creek.

pH
Based on the PWQO for pH, a range of 6.5 to 8.5 should be maintained for the protection of aquatic life. Average pH values for Otter Creek averaged 7.6 thereby meeting the provincial standard (Fig.63).

Thermal Regime
Many factors can influence fluctuations in stream temperature, including springs, tributaries, precipitation runoff, discharge pipes and stream shading from riparian vegetation. Water temperature is used along with the maximum air temperature (using the Stoneman and Jones method) to classify a watercourse as either warm water, cool water or cold water. Figure 64 shows the location of temperatures loggers at two sampling locations along Otter Creek.

Analysis of the data collected indicates that Otter Creek is classified as a warm water system with cool to warm water reaches (Fig.65). Each point on the graph represents a temperature that meets the following criteria:
- Sampling dates between July 1st and September 7th
- Sampling date is preceded by two consecutive days above 24.5 °C, with no rain
- Water temperatures are collected at 4pm
- Air temperature is recorded as the max temperature for that day

| SITE ID | Y_WATER | X_AIR | CLASSIFICATION | PROGRAM | YEAR |
|---|---|---|---|---|---|
| OT2 - Kellys Rd | 25.2 | 28.4 | WARMWATER | MACRO | 2014 |
| OT3 - Otter Lake Rd | 27.0 | 28.4 | WARMWATER | MACRO | 2014 |
Groundwater
Groundwater discharge areas can influence stream temperature, contribute nutrients, and provide important stream habitat for fish and other biota. During stream surveys, indicators of groundwater discharge are noted when observed. Indicators include: springs/seeps, watercress, iron staining, significant temperature change and rainbow mineral film. Figure 66 shows areas where one or more of the above groundwater indicators were observed during stream surveys and headwater assessments.

Headwaters Drainage Features Assessment
The RVCA Stream Characterization program assessed Headwater Drainage Features for the Middle Rideau subwatershed in 2014. This protocol measures zero, first and second order headwater drainage features (HDF). It is a rapid assessment method characterizing the amount of water, sediment transport, and storage capacity within headwater drainage features (HDF). RVCA is working with other Conservation Authorities and the Ministry of Natural Resources and Forestry to implement the protocol with the goal of providing standard datasets to support science development and monitoring of headwater drainage features. An HDF is a depression in the land that conveys surface flow. Additionally, this module provides a means of characterizing the connectivity, form and unique features associated with each HDF (OSAP Protocol, 2013). In 2014, the program sampled 17 sites in the Otter Creek catchment area. Figure 67 shows the headwater drainage feature sampling location in the catchment.


Headwater Feature Type
The headwater sampling protocol assesses the feature type in order to understand the function of each feature. The evaluation includes the following classifications: defined natural channel, channelized or constrained, multi-thread, no defined feature, tiled, wetland, swale, roadside ditch and pond outlet. By assessing the values associated with the headwater drainage features in the catchment area we can understand the ecosystem services that they provide to the watershed in the form of hydrology, sediment transport, and aquatic and terrestrial functions. The Otter Creek catchment is dominated by natural channel and wetland headwater drainage features. Figure 68 shows the feature type of the primary feature at the sampling locations.

Headwater Feature Flow
The observed flow condition within headwater drainage features can be highly variable depending on timing relative to the spring freshet, recent rainfall, soil moisture, etc. Flow conditions are assessed in the spring and in the summer to determine if features are perennial and flow year round, if they are intermittent and dry up during the summer months or if they are ephemeral systems that do not flow regularly and generally respond to specific rainstorm events or snowmelt. Flow conditions in headwater systems can change from year to year depending on location precipitation patterns. Figure 69 shows the observed flow conditions at the sampling locations in the Otter Creek catchment.

Headwater Feature Channel Modifications
Channel modifications were assessed at each headwater drainage feature sampling location. Modifications include channelization, dredging, hardening and realignments. The sampling locations for the Otter Creek catchment area were classified as having no channel modifications. Figure 70 shows the channel modifications observed at the sampling locations for Otter Creek.

Headwater Feature Vegetation
Headwater feature vegetation evaluates the type of vegetation that is found within the drainage feature. The type of vegetated within the channel influences the aquatic and terrestrial ecosystem values that the feature provides. For some types of headwater features the vegetation within the feature plays a very important role in flow and sediment movement and provides wildlife habitat. The following classifications are evaluated no vegetation, lawn, wetland, meadow, scrubland and forest. Figure 71 depicts the dominant vegetation observed at the sampled headwater sites in the Otter Creek catchment.

Headwater Feature Riparian Vegetation
Headwater riparian vegetation evaluates the type of vegetation that is found along the headwater drainage feature. The type of vegetation within the riparian corridor influences the aquatic and terrestrial ecosystem values that the feature provides to the watershed. The majority of the sample locations in Otter Creek were dominated by natural vegetation in the form of scrubland, forest and wetland vegetation. Figure 72 depicts the type of riparian vegetation observed at the sampled headwater sites in the Otter Creek catchment.

Headwater Feature Sediment Deposition
Assessing the amount of recent sediment deposited in a channel provides an index of the degree to which the feature could be transporting sediment to downstream reaches (OSAP, 2013). Evidence of excessive sediment deposition might indicate the requirement to follow up with more detailed targeted assessments upstream of the site location to identify potential best management practices to be implemented. Conditions ranged from no deposition observed to a site with substantial deposition recorded. Overall most sites had minimal to moderate levels of sediment deposition. Figure 73 depicts the degree of sediment deposition observed at the sampled headwater sites in the Otter Creek catchment.

Headwater Feature Upstream Roughness
Feature roughness will provide a measure of the amount of materials within the bankfull channel that could slow down the velocity of water flowing within the headwater feature (OSAP, 2013). Materials on the channel bottom that provide roughness include vegetation, woody debris and boulders/cobble substrates. Roughness can provide benefits in mitigating downstream erosion on the headwater drainage feature and the receiving watercourse by reducing velocities. Roughness also provides important habitat conditions to aquatic organisms. The majority of the sample locations in the Otter Creek catchment area had extreme to high levels of feature roughness. Figure 74 shows the feature roughness conditions at the sampling locations in the Otter Creek catchment.

Fish Community
The Otter Creek catchment is classified as a mixed community of warm and cool water recreational and baitfish fishery with 25 species observed. Table 15 lists the species observed in the catchment (Source: MNR/RVCA). Figure 75 shows the sampling locations along Rideau Creek.

| Fish Species | Fish code | Fish Species | Fish code |
|---|---|---|---|
| alewife | Alewi | fallfish | Fallf |
| alosa sp. | AloSp | finescale dace | FsDac |
| banded killifish | BaKil | golden shiner | GoShi |
| blackchin shiner | BcShi | iowa darter | loDar |
| blacknose shiner | BnShi | largemouth bass | LmBas |
| bluegill | Blueg | northern pearl dace | PeDac |
| bluntnose minnow | BnMin | northern pike | NoPik |
| brassy minnow | BrMin | northern redbelly dace | NRDac |
| brook stickleback | BrSti | pumpkinseed x bluegill (hybrid) | Hy702 |
| brown bullhead | BrBul | pumpkinseed | Pumpk |
| carps and minnows | CA_MI | rock bass | RoBas |
| central mudminnow | CeMud | smallmouth bass | SmBas |
| cisco | LaHer | splake | Splak |
| common carp | CoCar | white sucker | WhSuc |
| common shiner | CoShi | yellow bullhead | YeBul |
| etheostoma sp. | EthSp | yellow perch | YePer |


Migratory Obstructions
It is important to know locations of migratory obstructions because these can prevent fish from accessing important spawning and rearing habitat. Migratory obstructions can be natural or manmade, and they can be permanent or seasonal. Figure 76 shows that on Otter Creek, the migratory obstructions included seven beaver dams, one debris jam and two perched culverts at the time of the survey in 2014.

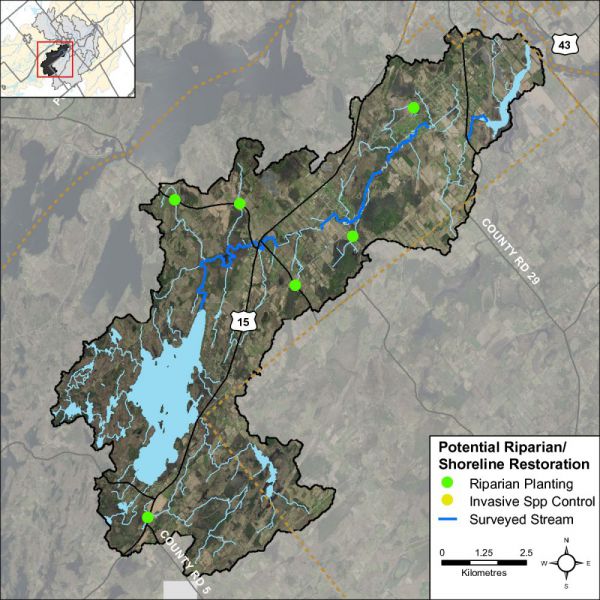
Riparian Restoration
Figure 77 depicts the locations where various riparian restoration activities can be implemented as a result of observations made during the stream survey and headwater drainage feature assessments. Several riparian planting opportunities were identified on surveyed headwater drainage features.