Tay River Subwatershed Report 2017
EAGLE LAKE CATCHMENT
 Figure 1
 Land cover in the Eagle Lake catchment
The RVCA produces individual reports for 14 catchments in the Tay River subwatershed. Using data collected and analyzed by the RVCA through its watershed monitoring and land cover classification programs, surface water quality and in-stream conditions are reported for the Tay River, Tay Watershed lakes and Tay tributaries along with a summary of environmental conditions for the surrounding countryside every six years, which includes analysis of data collected through the programs along with local information provided by stakeholders up to 2017.
This information is used to better understand the effects of human activity on our water resources, allows us to better track environmental change over time and helps focus watershed management actions where they are needed the most to help sustain the ecosystem services (cultural, aesthetic and recreational values; provisioning of food, fuel and clean water; regulation of erosion/natural hazard protection and water purification; supporting nutrient/water cycling and habitat provision) provided by the catchment’s lands and forests and waters (Millennium Ecosystem Assessment 2005).
The following sections of this report are a compilation of that work for the Eagle Lake catchment.
For other Tay River catchments and the Tay River Subwatershed Report, please see Rideau Valley Conservation Authority Subwatershed Reports.
1.0 Eagle Lake Catchment: Facts
1.1 General/Physical Geography
Drainage Area
34 square kilometres; occupies four percent of the Tay River subwatershed; one percent of the Rideau Valley watershed.
Geology/Physiography
Eagle Creek catchment resides within part of the physiographic region known as the Algonquin Highlands. In the Tay River subwatershed, this ancient and hilly geologic region is made up of such Precambrian rocks as marble, conglomerates, and dark or colour banded granite-like rocks. A veneer of glacial drift (glacial till, sand etc.) overlies the bedrock. A geologic fault may run north-south through the eastern section of the catchment.
Municipal Coverage
Central Frontenac Township: (32 km2; 93% of catchment)
South Frontenac Township: (2 km2; 7% of catchment)
Stream Length
All tributaries (including headwater streams): 64 km
1.2 Vulnerable Areas
Aquifer Vulnerability
Mississippi-Rideau Source Water Protection program has mapped a small part of the catchment as a Significant Groundwater Recharge Areas and all of the catchment as a Highly Vulnerable Aquifer. There are no Well-Head Protection Areas in the catchment.
Wetland Hydrology
A watershed model developed by the RVCA in 2009 was used to study the hydrologic function of wetlands in the Rideau Valley Watershed, including those found in the Eagle Lake catchment.
1.3 Conditions at a Glance
Fish Community/Thermal Regime
Warm and cool water recreational and baitfish fishery with 16 species observed in Eagle Creek during 2016.
Headwater Drainage Features
All are natural and wetland features with the majority of them having no anthropogenic modifications.
Instream/Riparian Habitat
Eagle Creek: Low to high habitat complexity with increased habitat complexity observed in the middle and lower reach of the system within the catchment. Dissolved oxygen conditions are somewhat variable along the system with sections in the upper reach below the guideline to support warmwater biota, which can be typical of wetland habitats; however, sections in the middle and lower reaches are acceptable for warm/cool water species.
Land Cover Change (2008 to 2014)
| Catchment |
Woodland |
Settlement |
| Hectares |
-1 |
+1 |
Land Cover Type (2014)
| Catchment |
Woodland |
Water |
Wetland |
Settlement |
Crop-Pasture |
Meadow-Thicket |
Transportation |
| Percent |
52 |
26 |
13 |
3 |
2 |
2 |
2 |
Shoreline Cover Type (30 m. riparian area; 2014)
| Catchment |
% |
Eagle Lake |
% |
Eagle Creek |
% |
Leggat Lake |
% |
Streams* |
% |
| Woodland |
64 |
Woodland |
83 |
Wetland |
75 |
Woodland |
79 |
Woodland |
56 |
| Wetland |
27 |
Settlement |
11 |
Woodland |
20 |
Settlement |
11 |
Wetland |
38 |
| Settlement |
5 |
Wetland |
4 |
Transportation |
4 |
Wetland |
7 |
Transportation |
3 |
| Transportation |
2 |
Transportation |
1 |
Settlement |
1 |
Transportation |
2 |
Crop-Pasture |
1 |
| Meadow-Thicket |
1 |
Meadow-Thicket |
1 |
--- |
--- |
Meadow-Thicket |
1 |
Meadow-Thicket |
1 |
| Crop-Pasture |
1 |
--- |
--- |
--- |
--- |
--- |
--- |
Settlement |
1 |
*Excludes Eagle Creek
Species at Risk (Elemental Occurrence)
| Status |
Species at Risk |
| Threatened |
Blanding's Turtle |
Eastern Whip-poor-will |
--- |
--- |
| Special Concern |
Eastern Milksnake |
Eastern Ribbonsnake |
Northern Map Turtle |
Snapping Turtle |
Water Quality for the Protection of Aquatic Life (2006 to 2017)
| Water Quality Source |
Eagle Lake |
Eagle Creek |
Leggat Lake |
| Surface Chemistry |
Very Good |
Fair to Good |
Fair to Good |
| Instream Biological |
--- |
Poor to Fair |
--- |
Eagle Creek: Benthic invertebrate samples are more tolerant to high organic pollution levels during most years.
Water Wells
Approximately 120 operational private water wells in the Eagle Lake catchment. Groundwater uses are mainly domestic but also include livestock, public and commercial water supplies.
1.4 Catchment Care
Environmental Management
The Eagle Lake Property Owners' Association prepared the State of the Lake Report - Eagle Lake (2011) to provide a summary of what is known about the Eagle Lake catchment along with the community’s vision for the lake and a list of its main concerns and actions to address them. This has been followed up with the State of the Lake Report - Eagle Lake Update 2015.
One Environmental Compliance Approval was sought in the catchment for a camp sewage works.
Environmental Monitoring
Chemical surface (in-stream) water quality collection by the RVCA since 2003 (see Section 2 of this report).
Benthic invertebrate (aquatic insect) surface (in-stream) water quality collection by the RVCA since 2003 (see Section 3.3.1 of this report).
Fish survey and stream characterization survey on Eagle Creek by the RVCA in 2016 included taking measurements and recording observations on instream habitat, bank stability, other attributes and preparing a temperature profile (see Section 3 of this report).
Fourteen headwater drainage feature assessments were conducted by the RVCA in 2016 at road crossings in the catchment. The protocol measures zero, first and second order headwater drainage features and is a rapid assessment method characterizing the amount of water, sediment transport, and storage capacity within headwater drainage features (see Section 3.4 of this report).
Classification of Eagle Lake catchment land cover types derived by the RVCA from colour aerial photography that was acquired during the spring of 2008 and 2014 (see Section 4.1 of this report).
Groundwater chemistry information is available from the Ontario Geological Survey for one well (#13-AG-031) located in the catchment.
Stewardship
Five stewardship projects were completed by landowners with assistance from the RVCA (see Section 5 of this report).
2.0 Eagle Lake Catchment: Water Quality Conditions
Surface water quality conditions in the Eagle Lake catchment are monitored by the Rideau Valley Conservation Authority’s (RVCA) Watershed Watch Program and Baseline Water Quality Monitoring Program. Watershed Watch monitors watershed lakes to assess nutrient concentrations, water clarity, dissolved oxygen availability and pH. The baseline water quality program focuses on streams; data is collected for 22 parameters including nutrients (total phosphorus, total Kjeldahl nitrogen and ammonia), E. coli, metals (like aluminum and copper) and additional chemical/physical parameters (such as alkalinity, chlorides, pH and total suspended solids). Figure 2 shows the locations of monitoring sites in the catchment.
Figure 2 Water quality monitoring sites on Eagle Lake, Leggat Lake and Eagle Creek.
The water quality ratings scored high across this catchment and ranges from "Fair to Very Good" (Table 1). All ratings were determined by the Canadian Council of Ministers of the Environment (CCME) Water Quality Index.
A "Fair" rating indicates that water quality is usually protected but is occasionally threatened or impaired; conditions sometimes depart from natural or desirable levels. A rating of "Good" indicates that only a minor degree of threat or impairment is observed and conditions rarely depart from natural or desirable levels. “Very Good" indicates water quality is protected with a virtual absence of threat or impairment; conditions are very close to natural or pristine levels.
Each parameter is evaluated against established guidelines to determine water quality conditions. Those parameters that frequently exceed guidelines are presented below.
Data has been analyzed over the 2006-2017 period for general trends and conditions. Table 1 shows the overall rating for the monitored surface water quality sites within the catchment and Table 2 outlines the Water Quality Index (WQI) scores and their corresponding ratings.
Table 1 Water Quality Index ratings for the Eagle Lake Catchment
Table 2 Water Quality Index ratings and corresponding index scores (RVCA terminology, original WQI category names in brackets)
2.1 Leggat Lake Water Quality
Surface water quality conditions in Leggat Lake have been monitored by RVCA’s Watershed Watch Program since 2006. Data from the deep point site (DP1) have been used to calculate the WQI rating for Leggat Lake, which averaged “Fair-Good” over the 2006-2017 period (Table 1). Low-moderate nutrient concentrations, generally good oxygen availability and clear water all influenced this rating. The following discussion explains how each of the monitored water quality parameters contributes to the lake’s water quality.
This report also considers data from eight additional shoreline sites that are monitored around the lake. These sites have not been included in the calculation of the CCME WQI rating, as they are not monitored with the same frequency as the deep point site. However, they do provide important information on water quality conditions in the near shore areas. For locations of shoreline sites (A-H) please see Figure 2.
2.1.1. Leggat Lake Nutrients
Total phosphorus (TP) is used as a primary indicator of excessive nutrient loading and contributes to abundant aquatic vegetation growth and depleted dissolved oxygen levels. The Provincial Water Quality Objective (PWQO) is used as the TP Guideline and states that in lakes, concentrations greater than 0.020 mg/l indicate an excessive amount of TP within the water column. Concentrations below 0.010 mg/l are generally considered to be minimal and unlikely to have problems associated with nutrient loading.
Total Kjeldahl nitrogen (TKN) is used as a secondary indicator of nutrient loading. RVCA uses a guideline of 0.500 mg/l to assess TKN[1] within surface waters.
Nutrients at the Leggat Lake Deep Point
TP and TKN sampling results collected by the RVCA are presented in Figures 3 to 6. Some variability has occurred in the sampled TP concentrations at this site though average annual concentrations were fairly consistent (Figure 3 and 4); no significant trend[2] was observed in the 2006-2017 data set. Ninety percent of samples analyzed for TP were less than the TP guideline and the average concentration was 0.012 mg/l (Table 3). TKN concentration also showed variability, as with TP concentrations no significant change was observed (Figures 5 and 6). Ninety-five percent of reported results were below the TKN guideline and the average TKN concentration was 0.342 mg/l (Table 3).
Overall, the data presented indicates that nutrient concentration may be considered low with few exceedances in the mid-lake, deep water site on Leggat Lake.
Figure 3 Total phosphorous sampling results at the deep point site (DP1) on Leggat Lake, 2006-2017
Figure 4 Average total phosphorous results at the deep point site (DP1) on Leggat Lake, 2006-2017
Figure 5 Total Kjeldahl nitrogen sampling results at the deep point site (DP1) on Leggat Lake, 2006-2017
Figure 6 Average total Kjeldahl nitrogen sampling results at deep point site (DP1) on Leggat Lake, 2006-2017
Table 3 Summary of nutrient results at the deep point site (DP1) on Leggat Lake, 2006-2017
Nutrients around Leggat Lake
The average nutrient concentrations at monitored shoreline sites around the lake vary from year to year (Figures 7 and 8). Please note that in the 2006-2017 monitoring period sites A, B and E were monitored yearly; while sites C, D, F, G and H were only sampled in 2009 and 2014.
Average total phosphorous concentrations are below the TP guideline at all of sites, with the exception of site B in 2012 and 2014 (Figure 7). All subsequent results are well below the guideline at this site, and concentrations do not appear to be indicative of persistent problem. Average TKN concentrations were below the guideline at all sites (Figure 8).
Figure 7 Average total phosphorous concentrations at shoreline monitoring sites in Leggat Lake, 2006-2017
Figure 8 Average total Kjeldahl nitrogen concentrations at shoreline monitoring sites in Leggat Lake, 2006-2017
Summary of Leggat Lake Nutrients
Leggat Lake nutrient concentrations are general below the guidelines, with few exceedances. It is possible that occasional problems with nutrient enrichment (i.e. algal blooms or excessive plant growth) may be observed in some shallow, sheltered bays-such as site B.
Efforts such as the diversion of runoff and enhanced shoreline buffers are important to continue to protect and enhance water quality, and reduce future nutrient increases-particularly in developed areas. Nutrient exceedances may be partially attributed to the natural aging of a lake and basin characteristics. All residents can help minimize their impact on the lake by reducing nutrient inputs through practices such as proper maintenance of septic systems, keeping shorelines natural and using phosphate free soaps and detergents. Promotion of sound stewardship and protection around lake is important to maintain and protect water quality conditions into the future.
2.1.2 Leggat Lake Water Clarity
Water clarity is measured using a Secchi disk during each deep point sample. Table 4 summarizes the recorded depths with an average depth of 5.5 m and shows that all readings have exceeded the minimum PWQO of 2 m; indicating that algae in the water column is not at excessive levels (good water clarity). Less than 2 m will indicate overproduction in a lake or significant inputs to the water column that are limiting light availability. Figure 9 shows that no individual reading has been below the guideline and measured depths range from 3.0 m to 9 m. A declining trend was observed in Secchi depths over the 2006-2017 data set, meaning that clairity in the water column has been reduced through this period.
Table 4 Summary of Secchi depths recorded at the deep point site (DP1) on Leggat Lake, 2006-2017
Figure 9 Recorded Secchi depths at the deep point sites on Leggat Lake, 2006-2017
Summary of Leggat Lake Water Quality
Waters in Leggat Lake are generally clear and sufficient sunlight is able to penetrate the water column to support aquatic life and provide sufficient visibility for safe recreational use (boating, swimming).
2.1.3 Leggat Lake Fish Habitat
Two other factors, dissolved oxygen/temperature and pH were also assessed to provide an overall sense of the health of Leggat Lake from a fish habitat perspective.
2.1.3.1 Leggat Lake Dissolved Oxygen and Temperature
The red bars in Figure 10 show the depths where suitable conditions exist for warm water fish species (temperature less than 25°C and dissolved oxygen greater than 4 mg/l) at the deep point site. The vertical axis represents the total lake depth at each site where the profile is taken. Suitable conditions typically were observed over the monitoring periods to about 10 m of the water column. Periods of very limited conditions were observed in the summer of 2013 and 2015, due to very warm water temperatures in the upper portion of the water column and depleted oxygen conditions at the deeper depths. Overall, no significant change was noted in conditions through the 2006-2017 period.
Figure 10 Depths suitable for warm water fish species at the deep point site (DP1) on Leggat Lake, 2006-2017.
2.1.3.2 Leggat Lake pH
The majority of samples (Figure 11) were within guidelines established by the Canadian Council of Minister's of the Environment which state that pH should be between 6.5 and 9 to protect aquatic life (Table 5). Surface water’s that are found to be more alkaline (higher pH) are common in many regions of the Tay River subwatershed and can generally be attributed to the geology rather than anthropogenic activities. Biological activities such as increased photosynthesis from algal blooms and plant growth may also influence pH.
Figure 11 pH concentrations at the deep point site (DP1) on Leggat Lake, 2006-2017
Table 5 Summary of pH results at the deep point site (DP1) on Leggat Lake, 2006-2017.
Summary of Water Quality for Fish Habitat In Leggat Lake
Overall the water chemistry data at the deep point describes suitable habitat conditions for fish species such as bass, walleye and pike. pH conditions are within the range recommended for the protection of aquatic life. Overall, the data indicates a healthy environment for aquatic species.
2.1.4 Leggat Lake E. Coli
E. coli is sampled at monitored shoreline sites twice each sampling season. E. coli data was not used in the calculations of the WQI rating for the lake due to differences in sampling frequency and site locations. E. coli data has been summarized in Table 6.
Throughout the 2006-2017 period 98 percent of samples collected by RVCA were below the E. coli guideline of 100 colony forming units (CFU) per 100 ml set by the PWQO; across the lake the count at the geometric mean was 4 CFU/100ml (Table 6). This provides support that there is little indication of bacterial contamination around the lake. Figure 12 show the distribution of counts across all shoreline sites. All sites fell well below the guideline of 100 CFU/100ml.
Table 6 Summary of E. coli results for Leggat Lake, 2006-2017.
Figure 12 E. coli counts at monitored shoreline sites on Leggat Lake, 2006-2017.
Summary of Leggat Lake Bacterial Contamination
The results presented above indicate that bacterial contamination is not a significant concern in Leggat Lake and the water should be safe for recreational use such as swimming and boating.The results presented above provide evidence that bacterial contamination is not a significant concern in Leggat Lake and the water should be safe for recreational use such as swimming and boating.
2.2 Eagle Lake Water Quality
Surface water quality conditions in Eagle Lake have been monitored by RVCA’s Watershed Watch Program since 2002. Data from the deep point site (DP1) have been used to calculate the WQI rating for Eagle Lake, which averaged “Very Good” over the 2006-2017 period (Table 1). Low nutrient concentrations, good oxygen availability and clear water all influenced this rating. The following discussion explains how each of the monitored water quality parameters contributes to the lake’s water quality.
This report also considers data from eight additional shoreline sites that are monitored around the lake. These sites have not been included in the calculation of the CCME WQI rating, as they are not monitored with the same frequency as the deep point site. However, they do provide important information on water quality conditions in the near shore areas. For locations of shoreline sites (A-K) please see Figure 2.
2.2.1 Eagle Lake Nutrients
Total phosphorus (TP) is used as a primary indicator of excessive nutrient loading and contributes to abundant aquatic vegetation growth and depleted dissolved oxygen levels. The Provincial Water Quality Objective (PWQO) is used as the TP Guideline and states that in lakes, concentrations greater than 0.020 mg/l indicate an excessive amount of TP within the water column. Concentrations below 0.010 mg/l are generally considered to be minimal and unlikely to have problems associated with nutrient loading.
Total Kjeldahl nitrogen (TKN) is used as a secondary indicator of nutrient loading. RVCA uses a guideline of 0.500 mg/l to assess TKN[1] within surface waters.
Nutrients at the Eagle Lake Deep Point
TP and TKN sampling results collected by the RVCA are presented in Figures 13 to 16. Some variability has occurred in the sampled TP concentrations at this site though average annual concentrations were fairly consistent (Figure 13 and 14); no significant trend[2] was observed in the 2006-2017 data set. Ninety-eight percent of samples analyzed for TP were less than the TP guideline and the average concentration was 0.008 mg/l (Table 7). TKN concentration also showed variability, as with TP concentrations no significant change was observed (Figures 15 and 16). All reported results were below the TKN guideline and the average TKN concentration was 0.297 mg/l (Table 7).
Overall, the data presented indicates that nutrient concentration may be considered low with few exceedances in the mid-lake, deep water site on Eagle Lake.
Figure 13 Total phosphorous sampling results at the deep point site (DP1) on Eagle Lake, 2006-2017
Figure 14 Average total phosphorous results at the deep point site (DP1) on Eagle Lake, 2006-2017
Figure 15 Total Kjeldahl nitrogen sampling results at the deep point site (DP1) on Eagle Lake, 2006-2017
Figure 16 Total Kjeldahl nitrogen sampling results at deep point site (DP1) on Eagle Lake, 2006-2017
Table 7 Summary of nutrient results at the deep point site (DP1) on Eagle Lake, 2006-2017
Nutrients around Eagle Lake
The average nutrient concentrations at monitored shoreline sites around the lake vary from year to year (Figures 17 and 18). Please note that in the 2006-2017 monitoring period sites A, B, F and G were monitored yearly; while sites C, D, E, G, H , I and K were only sampled in 2007, 2012 and 2017.
Average total phosphorous concentrations are below the TP guideline at all of sites (Figure 17), and concentrations do not appear to be indicative of a persistent problem. Average TKN concentrations were below the guideline at all sites, with the exception of elevated instances at site F in 2006 and site B in 2008. In both cases neither site has had sustained periods of elevated concentrations (Figure 18).
Figure 17 Average total phosphorous concentrations at shoreline monitoring sites in Eagle Lake, 2006-2017
Figure 18 Average total Kjeldahl nitrogen concentrations at shoreline monitoring sites in Eagle Lake, 2006-2017
Summary of Eagle Lake Nutrients
Eagle Lake nutrient concentrations are general below the guidelines, with few exceedances. It is possible that occasional problems with nutrient enrichment (i.e. algal blooms or excessive plant growth) may be observed in some shallow, sheltered bays.
Efforts such as the diversion of runoff and enhanced shoreline buffers are important to continue to protect and enhance water quality, and reduce future nutrient increases-particularly in developed areas. Nutrient exceedances may be partially attributed to the natural aging of a lake and basin characteristics. All residents can help minimize their impact on the lake by reducing nutrient inputs through practices such as proper maintenance of septic systems, keeping shorelines natural and using phosphate free soaps and detergents. Promotion of sound stewardship and protection around lake is important to maintain and protect water quality conditions into the future.
2.2.2 Eagle Lake Water Clarity
Water clarity is measured using a Secchi disk during each deep point sample. Table 8 summarizes the recorded depths with an average depth of 5.0 m and shows that all readings have exceeded the minimum PWQO of 2 m; indicating that algae in the water column is not at excessive levels (good water clarity). Less than 2 m will indicate overproduction in a lake or significant inputs to the water column that are limiting light availability. Figure 19 shows that no individual reading has been below the guideline and measured depths range from 3.5 m to 9.5 m. No trend was observed in Secchi depths over the 2006-2017 data set.
Table 8 Summary of Secchi depths recorded at the deep point site (DP1) on Eagle Lake, 2006-2017
 on Eagle Lake, 2006-2017")
Figure 19 Recorded Secchi depths at the deep point site (DP1) on Eagle Lake, 2006-2017
Summary of Eagle Lake Water Clarity
Waters in Eagle Lake are generally clear and sufficient sunlight is able to penetrate the water column to support aquatic life and provide sufficient visibility for safe recreational use (boating, swimming).
2.2.3 Eagle Lake Fish Habitat
Two other factors, dissolved oxygen/temperature and pH were also assessed to provide an overall sense of the health of Eagle Lake from a fish habitat perspective.
2.2.3.1 Eagle Lake Dissolved Oxygen and Temperature
Warm-water Fish Community
The red bars in Figure 20 show the depths where suitable conditions exist for warm-water fish species (temperature less than 25°C and dissolved oxygen greater than 4 mg/l) at the deep point site. The vertical axis represents the total lake depth at each site where the profile is taken. Suitable conditions typically were observed throughout the water column in the spring and early summer, declining to about 15 m by late summer. Overall, no significant change was noted in conditions through the 2006-2017 period.
 on Eagle Lake, 2006-2017.")
Figure 20 Depths suitable for warm water fish species at the deep point site (DP1) on Eagle Lake, 2006-2017
Cold-water Fish Community
Optimal habitat for adult Lake Trout has a dissolved oxygen concentration of 6 mg/l, although concentrations as low as 4 mg/l, can be tolerated. However, juvenile Lake Trout have a higher minimum dissolved oxygen requirement of 7 mg/l. Data taken at the deep point site on Eagle Lake from May to late July/early August indicate adequate habitat for both adult and juvenile Lake Trout. For the interval from August 14 to September 30, of the 34 dissolved oxygen/temperature profiles available from 2002 to 2015 at Eagle Lake, 11 are from this time span.
As shown in Figure 21, for each year with data available, the light blue zone represents the portion of the usable lake depth as lake trout habitat, the light red zone as optimal habitat with up to 7 mg/litre of dissolved oxygen. Usable habitat for lake trout is defined as less than 15.5°C and 4 mg/l or more of dissolved oxygen. Optimal habitat is defined as less than 10°C and 7 mg/l or more of dissolved oxygen.

Figure 21 Usable to optimal depths for Lake Trout on Eagle Lake (2002 to 2017)
This data suggests that Lake Trout habitat is inadequate to borderline in some years, e.g., 2002, 2006, and 2009 to 2011. In other years, e.g., 2003, 2007, 2012, 2014 and 2015, habitat conditions in the late summer are acceptable for Lake Trout. Based on such dissolved oxygen/temperature profiles, it seems that every 4 to 5 years there is sufficient dissolved oxygen, i.e., a minimum of 7 mg/l, in portions of the water column to support juvenile Lake Trout.
These findings suggest that it is the late summer dissolved oxygen/temperature profiles that may be a limiting factor affecting the adequacy of the lake environment for Lake Trout, particularly juvenile fish. Nonetheless, there is potential for survival of a proportion of juvenile fish in certain years, so that some degree of recruitment for the adult pool of Lake Trout at Eagle Lake seems probable.
2.2.3.2 Eagle Lake pH
The majority of samples (Figure 22) were within guidelines established by the Canadian Council of Minister's of the Environment which state that pH should be between 6.5 and 9 to protect aquatic life (Table 9). Surface water’s that are found to be more alkaline (higher pH) are common in many regions of the Tay River subwatershed and can generally be attributed to the geology rather than anthropogenic activities. Biological activities such as increased photosynthesis from algal blooms and plant growth may also influence pH.
Figure 22 pH concentrations at the deep point site (DP1) on Eagle Lake, 2006-2017
Table 9 Summary of pH results at the deep point site (DP1) on Eagle Lake, 2006-2017.
Summary of Water Quality for Fish Habitat in Eagle Lake
Overall the water chemistry data at the deep point describes suitable habitat conditions for fish species such as bass, walleye and pike. pH conditions are within the range recommended for the protection of aquatic life. Overall, the data indicates a healthy environment for aquatic species.
2.2.4 Eagle Lake E. Coli
E. coli is sampled at monitored shoreline sites twice each sampling season. E. coli data was not used in the calculations of the WQI rating for the lake due to differences in sampling frequency and site locations. E. coli data has been summarized in Table 10.
Throughout the 2006-2017 period, 100 percent of samples collected by RVCA were below the E. coli guideline of 100 colony forming units (CFU) per 100 ml, set by the PWQO; across the lake the count at the geometric mean was 3 CFU/100ml (Table 10). This provides support that there is little indication of bacterial contamination around the lake. Figure 23 show the distribution of counts across all shoreline sites. All sites fall well below the guideline of 100 CFU/100ml.
Table 10 Summary of E. coli results for Eagle Lake, 2006-2017.
Figure 23 E. coli counts at monitored shoreline sites on Eagle Lake, 2006-2017.
Summary of Bacterial Contamination
The results presented above indicate that bacterial contamination is not a significant concern in Eagle Lake and the water should be safe for recreational use such as swimming and boating.
2.3 Eagle Creek Water Quality
There is one stream site on Eagle Creek monitored in the Eagle Lake-Eagle Creek catchment (EAG-01, Figure 2). Analysis of the data has considered over the 2006-2017 period. Water quality at this site is reported as “Fair-Good” (Table 1) as determined by the Canadian Council of Ministers of the Environment Water Quality Index (CCME WQI). The score at this due to the majority of monitored parameters having results below established guidelines. For more information on the CCME WQI, please see the Tay River Subwatershed Report. Only those parameters with exceedances that influenced the rating will be discussed in the following.
2.3.1 Eagle Creek Nutrients
Total phosphorus (TP) is used as a primary indicator of excessive nutrient loading and may contribute to abundant aquatic vegetation growth and depleted dissolved oxygen levels. The Provincial Water Quality Objective (PWQO) is used as the TP Guideline and states that in streams concentrations greater than 0.030 mg/l indicate an excessive amount of TP.
Total Kjeldahl nitrogen (TKN) is used as a secondary indicator of nutrient loading. RVCA uses a guideline of 0.500 mg/l to assess TKN[1] at the monitored site.
Tables 11 and 12 summarize average nutrient concentrations at the monitored site on Eagle Creek and show the proportion of results that meet the guidelines.
Table 11 Summary of total phosphorous results for Eagle Creek, 2006-2017.
Table 12 Summary of total Kjeldahl nitrogen results for Eagle Creek, 2006-2017 (Highlighted values indicate average concentrations that exceed the guideline).
The majority of TP results (72 percent) were below the guideline with an average concentration of 0.027 mg/l (Table 11). Concentrations tend to increase over the summer (Figure 24). Elevated counts were observed during the 2008 and 2016 sampling periods, this may be due to significant periods of wet weather during these sampling years (Figure 25). Please note that no samples were collected over the winter months. Overall, there was no significant trend in the monitoring data throughout the 2006-2017 period (Figure 25).
Figure 24 Average monthly total phosphorus concentrations in Eagle Creek, 2006-2017.
Figure 25 Distribution of total phosphorus concentrations in Eagle Creek, 2006-2017.
TKN results show that the bulk of results exceeded the guideline (Figure 26); 46 percent of samples were below the guideline and the average concentration was slightly elevated at 0.575 mg/l (Table 12). As with TP results, TKN concentrations appear to increase throughout the summer months (Figure 26). Periods of elevated concentrations were observed in 2008, 2011 and 2016 (Figure 27). Overall there was no significant trend in the monitoring data throughout the 2006-2017 period.
Figure 26 Average monthly total Kjeldahl nitrogen concentration in Eagle Creek, 2006-2017
Figure 27 Distribution of total Kjeldahl nitrogen concentrations in Eagle Creek, 2006-2017
Summary of Eagle Creek Nutrients
The data shows that periods of elevated nutrients occur occasionally in Eagle Creek, particularly in regards in TKN. Elevated nitrogen is likely due to the influence of surrounding wetland areas, wetlands are naturally rich in nitrogen and appear to be contributing to the concentrations in this creek. Though this is likely to be a natural condition it is important to reduce human impacts wherever possible. Strategies to reduce nutrient inputs may include diversion of runoff to the creek from surrounding developed areas (i.e. roadways) and enhanced shoreline buffers.
2.3.2 Eagle Creek E. Coli
E. coli is used as an indicator of bacterial pollution from human or animal waste; in elevated concentrations it can pose a risk to human health. The PWQO of 100 colony forming units/100 milliliters (CFU/100 ml) is used to assess E. coli. Counts greater than this guideline indicate that bacterial contamination may be a problem within a waterbody.
Table 13 summarizes the geometric mean for the monitored site on Eagle Creek and shows the proportion of samples that meet the E. coli guideline of 100 CFU/100 ml. The monthly geometric mean with respect to the guideline for the 2006-2017 period is shown in Figure 28 and distribution of sampled counts is shown in Figure 29.
Table 13 Summary of
E. coli results for Eagle Creek, 2006-2017
E. coli results at site EAG-01 indicate bacterial counts are typically below (79 percent) the E. coli guideline, similarly the count at geometric mean is 42 CFU/100ml (Table 13) and well below the guideline. E. coli counts are slightly higher during the summer months as warmer temperatures are needed for bacteria to survive (Figure 28). Results have varied for each sampled year, but no trend was observed across the 2006-2017 period (Figure 29).
Figure 28 Geometric mean of monthly E. coli counts in Eagle Creek, 2006-2017
Figure 29 Distribution of E. coli counts in Eagle Creek, 2006-2017
Summary of Eagle Creek Bacterial Contamination
Results indicate that bacterial contamination is not a concern in Eagle Creek. The count at the geometric mean is below the guideline and a limited number of counts exceeding the guideline have been observed. The elevated samples that do occur are most likely due to wildlife and can be considered natural variability in the aquatic ecosystem. However good stewardships practices should be maintained throughout the drainage area to protect both Eagle Creek and Bobs Lake downstream; this includes properly maintaining septic systems, enhancing shoreline buffers and restricting livestock access-all actions that can help to protect water quality conditions in Eagle Creek.
2.3.3 Eagle Creek Metals
Of the metals routinely monitored in Eagle Creek, aluminum (Al) and iron (Fe) reported concentrations above their respective PWQOs. In elevated concentrations, these metals can have toxic effects on sensitive aquatic species. The PWQO for Al is 0.075 mg/l and Fe is 0.300 mg/l.
Tables 14 and 15 summarize metal concentrations at the monitored site, as well as show the proportion of samples that meet guidelines. Figures 30 and 32 show the monthly average concentrations with respect to the guidelines; Figures 31 and 33 show the distribution of sample results.
Table 14 Summary of aluminum results for Eagle Creek, 2006-2017
Table 15 Summary of iron results for Eagle Creek, 2006-2017
Results show that Al concentrations often meet the objective with 79 percent of samples below the guideline, no significant trend was observed in the sampled concentrations (Figure 31). The average concentration of Al was below the guideline at 0.044 mg/l (Table 14).
The majority of Fe results were below the guideline; 68 percent of samples were below the guideline in the 2006-2017 period (Figure 33), as with Al results no trend was observed. The average concentration was below the guideline in the reporting period with a concentration of 0.249 mg/l (Table 15).
Figure 30 Average of monthly aluminum concentrations in Eagle Creek, 2006-2017
Figure 31 Distribution of aluminum concentrations in Eagle Creek, 2010-2015
Figure 32 Average of monthly iron concentrations in Eagle Creek, 2006-2017.
Figure 33 Distribution of iron concentrations in Eagle Creek, 2010-2015
Summary of Eagle Creek Metals
Concentrations of both iron and aluminum have not shown any significant change within Eagle Creek, though exceedances have occurred the majority of samples as well as average concentration are below respective guidelines. Efforts should continue to be made to identify if any significant pollution sources do exist and implement best management practices reduce any inputs such as storm water runoff, metal alloys, fungicides and pesticides to improve overall stream health and lessen downstream impacts.
[1] No Ontario guideline for TKN is presently available; however, waters not influenced by excessive organic inputs typically range from 0.100 to 0.500 mg/l, Environment Canada (1979) Water Quality Sourcebook, A Guide to Water Quality Parameters, Inland Waters Directorate, Water Quality Branch, Ottawa, Canada
[2] All trends were determined using the Mann-Kendall trend test and Sens slope estimator
[3] A type of mean or average, which indicates the central tendency or typical value of a set of numbers by using the product of their values (as opposed to the arithmetic mean which uses their sum). It is often used to summarize a variable that varies over several orders of magnitude, such as E. coli counts.
3.0 Eagle Lake Catchment: Riparian Conditions
The Stream Characterization Program evaluated 2.7 km of Eagle Creek in 2016. A total of 27 stream survey assessments were completed in the middle of July.
During the summer and fall of 2016, the Rideau Valley watershed experienced periods of severe drought. Precipitation levels were measured at less than 40% of the long-term average, as the water supply was unable to meet local demand. The lack of rainfall affected the success and function of farm crops, municipal and private wells, lawns and gardens, navigation and ultimately the health of our lakes, rivers and streams.
Low water conditions were readily observed throughout the watershed, as many of the streams were highly fragmented or completely dry. Aquatic species such as amphibians, fish and macroinvertebrates were affected, as suitable habitat may have been limited. Fragmentation of habitat was observed in sections along Eagle Creek during drought conditions in 2016.
Eagle Creek showing fragmentation of aquatic habitat during the drought in the Fall of 2016
3.1 Eagle Creek Overbank Zone
3.1.1 Riparian Buffer Evaluation
The quality of the riparian area increases with the width, complexity and linear extent of its vegetation along a stream or creek. A complex riparian community consists of diverse plant species native to the site, with multiple age-classes providing vertical structural diversity along a watercourse.
Here is a list of watershed benefits from a healthy riparian buffer zone:
- Reduces the amount of pollutants that reach the stream from surface runoff
- Helps reduce and mitigates erosion
- Provides a microclimate that is cooler during the summer months providing cooler water for aquatic organisms
- Provides large wood structure from fallen trees and limbs that form instream cover, create pools, stabilize the streambed, and provide habitat for aquatic organisms
- Provides organic material for stream biota that, among other functions, is the base of the food chain in lower order streams
- Provides habitat for terrestrial insects that drop in the stream and become food for fish and travel corridors for other terrestrial animals
- Dissipates energy during flood events
- Often provides the only refuge areas for fish during out-of-bank flows (behind trees, stumps, and logs)
Figure 34 demonstrates the buffer conditions of the left and right banks separately. Eagle Creek had a buffer of greater than 30 meters along 100 percent of the left bank and 94 percent of the right bank.

Figure 34 Riparian Buffer Evaluation along Eagle Creek
3.1.2 Riparian Buffer Alterations
Alterations within the riparian buffer were assessed within three distinct shoreline zones (0-5m, 5-15m, 15-30m), and evaluated based on the dominant vegetative community and/or land cover type (Figure 35). The riparian buffer zone along Eagle Creek was found to be dominated by forest, wetland and scrubland conditions. There was an area in the middle reach along the right bank that had altered riparian zone conditions.
Figure 35 Riparian buffer alterations along Eagle Creek
3.1.3 Adjacent Land Use
The RVCA’s Stream Characterization Program identifies eight different land uses along Eagle Creek (Figure 36). Surrounding land use is considered from the beginning to end of the survey section (100m) and up to 100m on each side of the river. Land use outside of this area is not considered for the surveys but is nonetheless part of the subwatershed and will influence the creek. Wetland habitat was dominant at 78 percent of sections surveyed; forested habitat was found at 74% of sections, 19 percent scrubland habitat, while seven percent was classified as meadow habitat in the adjacent lands along Eagle Creek. The remaining land use consisted of active agriculture, residential, recreational and infrastructure in the form of road crossings.
Figure 36 Land Use along Eagle Creek
3.2 Eagle Creek Shoreline Zone
3.2.1 Instream Erosion
Stream erosion is the process by which water erodes and transports sediments, resulting in dynamic flows and diverse habitat conditions. Excessive erosion can result in drastic environmental changes, as habitat conditions, water quality and aquatic life are all negatively affected. Bank stability was assessed as the overall extent of each section with “unstable” shoreline conditions. These conditions are defined by the presence of significant exposed soils/roots, minimal bank vegetation, severe undercutting, slumping or scour and potential failed erosion measures. The majority of Eagle Creek had no evidence of erosion observed along the surveyed sections, however there were three locations with low levels of erosion observed (Figure 37).
Figure 37 Erosion levels along Eagle Creek
3.2.2 Undercut Stream Banks
Stream bank undercuts can provide excellent cover habitat for aquatic life, however excessive levels can be an indication of unstable shoreline conditions. Bank undercut was assessed as the overall extent of each surveyed section with overhanging bank cover present. Figure 38 shows that Eagle Creek had no observed undercut banks along the upper and lower reaches of the system, however there were several sections in the middle reaches with low levels of undercut banks.
Figure 38 Undercut stream banks along Eagle Creek
3.2.3 Stream Shading
Grasses, shrubs and trees all contribute towards shading a stream. Shade is important in moderating stream temperature, contributing to food supply and helping with nutrient reduction within a stream. Stream cover is assessed as the total coverage area in each section that is shaded by overhanging trees/grasses and tree canopy, at greater than 1m above the water surface. Figure 39 shows highly variable levels of stream shading along Eagle Creek. There were many sections along the creek where the channel narrows that had high to moderate levels of stream shading along the system.
Figure 39 Stream shading along Eagle Creek
3.2.4 Instream Wood Structure
Forested shorelines provide essential complex habitat through the perpetual process of shoreline trees falling into the water. This continuous recruitment of trees creates a wood-based physical structure in the littoral zone that is common on natural systems. Insects, fish, amphibians, birds, and other animals have also evolved with this abundance of near shore wood and it is essential to their life cycles. With increased development along many waterways, forested lakeshores have been altered and wood-based physical structure in many waterways has been reduced. It is important to restore this essential habitat to aquatic ecosystems.
Shoreline Protection
- Protects shorelines by providing a barrier from wind and wave erosion
- Reduces sedimentation of the water caused by shoreline slumping due to bank erosion
- Allows detritus to collect and settle on the lake or creek bed providing the substrate structure required for native aquatic vegetation to establish and outcompete invasive species
Food Source
- Wood complexes are an important food source for invertebrates
- Small fish feed on the abundance of invertebrates that are found around these structures
- Larger fish, waterfowl and shorebirds all benefit from the abundance of invertebrates and small fish feeding around woody structures in the littoral zone
Cover
- Cover from predators is essential for many fish and animals to successfully complete their life cycle
- The nooks and crannies of wood complexes offer critters safety from predators while at the same time concentrating prey to make predators more efficient
- Wood provides the structure on which many species must lay or attach their eggs, therefore these complexes provide quality spawning and nesting habitat
Diversity
- Wood complexes in the littoral zone provide unique edge habitat along the shoreline
- Edge habitats contain more species diversity and higher concentrations of species than the adjoining habitats themselves will have
Figure 40 shows that the majority of Eagle Creek had high to moderate levels of instream wood structure along the system. Low to moderate levels of in water trees and branches were observed along the majority of the system.

Figure 40 Instream wood structure along Eagle Creek
3.2.5 Overhanging Wood Structure
Trees and branches that are less than one meter from the surface of the water are defined as overhanging. Overhanging wood structure provide a food source, nutrients and shade which helps to moderate instream water temperatures. Figure 41 shows the system is highly variable with no overhanging branches and trees where the system is wide and is dominated by wetland habitat to areas in the middle reaches that have high levels of overhanging wood structure along Eagle Creek.
Figure 41 Overhanging wood structure along Eagle Creek
3.2.6 Anthropogenic Alterations
Stream alterations are classified based on specific functional criteria associated with the flow conditions, the riparian buffer and potential human influences. Figure 42 shows seventy four percent of Eagle Creek remains “unaltered” with no anthropogenic alterations. Nineteen percent of Eagle Creek was classified as natural with minor anthropogenic changes while seven percent was considered altered. The alterations along Eagle Creek were in the form of shoreline modifications and road crossings. There were no sections that were classified as being highly altered.
Figure 42 Anthropogenic alterations along Eagle Creek
3.3 Eagle Creek Instream Aquatic Habitat
3.3.1 Benthic Invertebrates
Freshwater benthic invertebrates are animals without backbones that live on the stream bottom and include crustaceans such as crayfish, molluscs and immature forms of aquatic insects. Benthos represent an extremely diverse group of aquatic animals and exhibit wide ranges of responses to stressors such as organic pollutants, sediments and toxicants, which allows scientists to use them as bioindicators. As part of the Ontario Benthic Biomonitoring Network (OBBN), the RVCA has been collecting benthic invertebrates at the Bobs Lake Road site since 2011. The Eagle Creek sample location was added to the monitoring network as a result of an identified gap during the release of the 2011 Eagle Creek catchment report. Monitoring data is analyzed for each sample site and the results are presented using the Family Biotic Index, Family Richness and percent Ephemeroptera, Plecoptera and Trichoptera.
Hilsenhoff Family Biotic Index
The Hilsenhoff Family Biotic Index (FBI) is an indicator of organic and nutrient pollution and provides an estimate of water quality conditions for each site using established pollution tolerance values for benthic invertebrates. FBI results for the Eagle Creek catchment at the County Road 38 sample location is summarized by year. “Poor” water quality conditions were observed at the Eagle Creek sample location (Figure 43) using a grading scheme developed by Conservation Authorities in Ontario for benthic invertebrates.
Figure 43 Hilsenhoff Family Biotic Index at the Bobs Lake Road sample location
Family Richness
Family Richness measures the health of the community through its diversity and increases with increasing habitat diversity suitability and healthy water quality conditions. Family Richness is equivalent to the total number of benthic invertebrate families found within a sample. The Bobs Lake Road sample location is reported to have “Fair” family richness (Figure 44).
Figure 44 Family Richness on Eagle Creek at the Bobs Lake Road sample location
EPT
Ephemeroptera (Mayflies), Plecoptera (Stoneflies), and Trichoptera (Caddisflies) are species considered to be very sensitive to poor water quality conditions. High abundance of these organisms is generally an indication of good water quality conditions at a sample location. The community structure is somewhat variable with samples that are dominated by species that are tolerant to poorer water quality conditions at the Eagle Creek site location. As a result, the EPT indicates that the Eagle Creek sample location is reported to have conditions that range from “Fair” to “Poor” water quality (Figure 45) during the reporting period.
Figure 45 EPT on Eagle Creek at the Bobs Lake Road sample location
Conclusion
Overall the aquatic habitat conditions for the Eagle Creek sample location at Bobs Lake Road from a benthic invertebrate perspective ranges from “Fair” to “Poor” conditions as the samples have species that are more tolerant to high organic pollution levels during most years.
3.3.2 Habitat Complexity
Habitat complexity is a measure of the overall diversity of habitat types and features within a stream. Streams with high habitat complexity support a greater variety of species niches, and therefore contribute to greater diversity. Factors such as substrate, flow conditions (pools, riffles) and cover material (vegetation, wood structure, etc.) all provide crucial habitat to aquatic life. Habitat complexity is assessed based on the presence of boulder, cobble and gravel substrates, as well as the presence of instream woody material.
Low to high habitat complexity was identified for Eagle Creek (Figure 46). Regions with increased habitat complexity were observed in the middle and lower reaches of the system within the catchment.

Figure 46 Habitat complexity along Eagle Creek
3.3.3 Instream Substrate
Diverse substrate is important for fish and benthic invertebrate habitat because some species have specific substrate requirements and for example will only reproduce on certain types of substrate. The absence of diverse substrate types may limit the overall diversity of species within a stream. Figure 47 shows the overall presence of various substrate types observed along Eagle Creek. Substrate conditions were highly diverse along Eagle Creek with all substrate types being recorded at various locations along the creek. Figure 48 shows the dominant substrate type observed for each section surveyed along Eagle Creek.
Figure 47 Instream substrate along Eagle Creek
Figure 48 shows the dominant substrate type along Eagle Creek
3.3.4 Instream Morphology
Pools and riffles are important habitat features for aquatic life. Riffles are fast flowing areas characterized by agitation and overturn of the water surface. Riffles thereby play a crucial role in contributing to dissolved oxygen conditions and directly support spawning for some fish species. They are also areas that support high benthic invertebrate populations which are an important food source for many aquatic species. Pools are characterized by minimal flows, with relatively deep water and winter/summer refuge habitat for aquatic species. Runs are moderately shallow, with unagitated surfaces of water and areas where the thalweg (deepest part of the channel) is in the center of the channel. Figure 49 shows that Eagle Creek is highly variable; 93 percent of sections recorded runs, 33 percent pools and 30 percent riffles. Figure 50 shows where the riffle habitat areas were observed along Eagle Creek.
Figure 49 Instream morphology along Eagle Creek
Figure 50 Instream riffle habitat along Eagle Creek
3.3.5 Vegetation Type
Instream vegetation provides a variety of functions and is a critical component of the aquatic ecosystem. Aquatic plants promote stream health by:
- Providing direct riparian/instream habitat
- Stabilizing flows reducing shoreline erosion
- Contributing to dissolved oxygen through photosynthesis
- Maintaining temperature conditions through shading
For example emergent plants along the shoreline can provide shoreline protection from wave action and important rearing habitat for species of waterfowl. Submerged plants provide habitat for fish to find shelter from predator fish while they feed. Floating plants such as water lilies shade the water and can keep temperatures cool while reducing algae growth. Algae was observed in 93 percent of sections, submerged plants were present in 81 percent of the survey sections, 74 percent for floating plants, narrow leaved emergents were observed in 59 percent of sections, 26 percent free floating plants, 63 percent broad leaved emergents and robust emergents were observed in 37 percent of sections surveyed. Figure 51 depicts the plant community structure for Eagle Creek. Figure 52 shows the dominant vegetation type observed for each section surveyed along Eagle Creek.
Figure 51 Vegetation type along Eagle Creek
Figure 52 Dominant vegetation type along Eagle Creek
3.3.6 Instream Vegetation Abundance
Instream vegetation is an important factor for a healthy stream ecosystem. Vegetation helps to remove contaminants from the water, contributes oxygen to the stream, and provides habitat for fish and wildlife. Too much vegetation can also be detrimental. Figure 53 demonstrates that Eagle Creek reach had normal to common levels of vegetation recorded at 41 and 48 percent of stream surveys. Extensive levels of vegetation were observed in 63 percent of the surveyed sections, while 19 percent of sections had areas with no vegetation.
Figure 53 Instream vegetation abundance along Eagle Creek
3.3.7 Invasive Species
Invasive species can have major implications on streams and species diversity. Invasive species are one of the largest threats to ecosystems throughout Ontario and can out compete native species, having negative effects on local wildlife, fish and plant populations. Ninety six percent of the sections surveyed along Eagle Creek reach had invasive species. The invasive species observed in Eagle Creek were European frogbit, purple loosestrife, banded mystery snail and common/glossy buckthorn. Invasive species abundance (i.e. the number of observed invasive species per section) was assessed to determine the potential range/vector of many of these species (Figure 54).
Figure 54 Invasive species abundance along Eagle Creek
3.3.8 Water Chemistry
During the stream characterization survey, a YSI probe is used to collect water chemistry information. Dissolved oxygen (DO), specific conductivity (SPC) and pH are measured at the start and end of each section.
3.3.8.1 Dissolved Oxygen
Dissolved oxygen is a measure of the amount of oxygen dissolved in water. The Canadian Environmental Quality Guidelines of the Canadian Council of Ministers of the Environment (CCME) suggest that for the protection of aquatic life the lowest acceptable dissolved oxygen concentration should be 6 mg/L for warmwater biota and 9.5 mg/L for coldwater biota (CCME, 1999). Figure 55 shows that the dissolved oxygen in Eagle Creek supports warmwater and in certain locations coldwater biota along the system. The average dissolved oxygen level observed within Eagle Creek was 5.2mg/L which is below the recommended level for warmwater biota. The lower and middle reaches of Eagle Creek were within the threshold to support warmwater biota. The upper reaches fell below the recommended threshold to support warmwater aquatic biota.
Figure 55 Dissolved oxygen ranges along Eagle Creek
3.3.8.2 Conductivity
Conductivity in streams is primarily influenced by the geology of the surrounding environment, but can vary drastically as a function of surface water runoff. Currently there are no CCME guideline standards for stream conductivity; however readings which are outside the normal range observed within the system are often an indication of unmitigated discharge and/or stormwater input. The average conductivity observed within the main stem of Eagle Creek was 166.8 µs/cm. Figure 56 shows the conductivity readings for Eagle Creek.
Figure 56 Specific conductivity ranges in Eagle Creek
3.3.8.3 pH
Based on the PWQO for pH, a range of 6.5 to 8.5 should be maintained for the protection of aquatic life. Average pH values along Eagle Creek averaged 7.21 thereby meeting the provincial standard (Figure 57).
Figure 57 pH ranges along Eagle Creek
3.3.8.4 Oxygen Saturation (%)
Oxygen saturation is measured as the ratio of dissolved oxygen relative to the maximum amount of oxygen that will dissolve based on the temperature and atmospheric pressure. Well oxygenated water will stabilize at or above 100% saturation, however the presence of decaying matter/pollutants can drastically reduce these levels. Oxygen input through photosynthesis has the potential to increase saturation above 100% to a maximum of 500%, depending on the productivity level of the environment. In order to represent the relationship between concentration and saturation, the measured values have been summarized into 6 classes:
Figure 58 A bivariate assessment of dissolved oxygen concentration (mg/L) and saturation (%) in Eagle Creek
Dissolved oxygen conditions on Eagle Creek were somewhat variable along the system (Figure 58). Sections in the upper reach fell below the guideline to support warmwater biota, however sections in the middle and lower reaches were acceptable for warm/cool water species.
3.3.8.5 Specific Conductivity Assessment
Specific conductivity (SPC) is a standardized measure of electrical conductance, collected at or corrected to a water temperature of 25⁰C. SPC is directly related to the concentration of ions in water, and is commonly influenced by the presence of dissolved salts, alkalis, chlorides, sulfides and carbonate compounds. The higher the concentration of these compounds, the higher the conductivity. Common sources of elevated conductivity include storm water, agricultural inputs and commercial/industrial effluents.
In order to summarize the conditions observed, SPC levels were evaluated as either normal, moderately elevated or highly elevated. These categories correspond directly to the degree of variation (i.e. standard deviation) at each site relative to the average across the system.
Normal levels were maintained along the majority of Eagle Creek; however there was an area in the middle reach and in the extreme lower reach with high and moderate levels of conductivity (Figure 59).
Figure 59 Relative specific conductivity levels along Eagle Creek
3.3.9 Thermal Regime
Many factors can influence fluctuations in stream temperature, including springs, tributaries, precipitation runoff, discharge pipes and stream shading from riparian vegetation. Water temperature is used along with the maximum air temperature (using the Stoneman and Jones method) to classify a watercourse as either warm water, cool water or cold water. Figure 60 shows where the thermal sampling sites were located on Eagle Creek. Analysis of the data collected indicates that Eagle Creek is classified as a warm water system with cool-warm water reaches (Figure 61).
Figure 60 Temperature logger locations along Eagle Creek
Figure 61 Temperature logger data for the sample locations along Eagle Creek
Each point on the graph represents a temperature that meets the following criteria:
- Sampling dates between July 1st and September 7th
- Sampling date is preceded by two consecutive days above 24.5 °C, with no rain
- Water temperatures are collected at 4pm
- Air temperature is recorded as the max temperature for that day
3.3.10 Groundwater
Groundwater discharge areas can influence stream temperature, contribute nutrients, and provide important stream habitat for fish and other biota. During stream surveys, indicators of groundwater discharge are noted when observed. Indicators include: springs/seeps, watercress, iron staining, significant temperature change and rainbow mineral film. Figure 62 shows areas where one or more of the above groundwater indicators were observed during stream surveys and headwater assessments.
Figure 62 Groundwater indicators observed in the Eagle Creek catchment
3.3.11 Fish Community
The Eagle Creek catchment is classified as a mixed community of warm, cool and cold water recreational and baitfish fishery with 16 species observed. The following is a list of species observed in the watershed in 2016 and historically (Figure 63). There was a significant reduction in species richness observed in 2016 likely as a result of drought conditions, which can alter species distribution along the creek.
Figure 63 Fish Community sampling observations for 2016
Table 16 contains a list of species observed in the watershed.
Table 16 Fish species observed in the Eagle Lake catchment
RVCA staff weighing and measuring fish from Eagle Creek before release
Fyke net set on Eagle Creek at Bobs Lake Road
3.3.12 Migratory Obstructions
It is important to know locations of migratory obstructions because these can prevent fish from accessing important spawning and rearing habitat. Migratory obstructions can be natural or manmade, and they can be permanent or seasonal. Figure 64 shows the migration barriers along Eagle Creek at the time of the survey in 2016. There were five perched culverts and one debris dams along Eagle Creek and various headwater drainage features within the catchment.
Figure 64 Migratory obstructions in the Eagle Lake catchment
3.3.13 Beaver Dams
Overall beaver dams create natural changes in the environment. Some of the benefits include providing habitat for wildlife, flood control and silt retention. Additional benefits come from bacterial decomposition of woody material used in the dams which removes excess nutrient and toxins. Beaver dams can also result in flooding of agricultural lands and may be potential barriers to fish migration. Several beaver dams were identified along Eagle Creek in 2016 as well as two on headwater drainage features in the catchment (Figure 65).
Figure 65 Beaver dam type and locations in the Eagle Lake catchment
3.4 Headwater Drainage Feature Assessment
3.4.1 Headwaters Sampling Locations
The RVCA Stream Characterization program assessed Headwater Drainage Features for the Eagle Lake catchment in 2016. This protocol measures zero, first and second order headwater drainage features (HDF). It is a rapid assessment method characterizing the amount of water, sediment transport, and storage capacity within headwater drainage features (HDF). RVCA is working with other Conservation Authorities and the Ministry of Natural Resources and Forestry to implement the protocol with the goal of providing standard datasets to support science development and monitoring of headwater drainage features. An HDF is a depression in the land that conveys surface flow. Additionally, this module provides a means of characterizing the connectivity, form and unique features associated with each HDF (OSAP Protocol, 2013). In 2016 the program sampled 14 sites at road crossings in the Eagle Lake catchment area (Figure 66).
Figure 66 Location of the headwater sampling site in the Eagle Lake catchment
3.4.2 Headwater Feature Type
The headwater sampling protocol assesses the feature type in order to understand the function of each feature. The evaluation includes the following classifications: defined natural channel, channelized or constrained, multi-thread, no defined feature, tiled, wetland, swale, roadside ditch and pond outlet. By assessing the values associated with the headwater drainage features in the catchment area we can understand the ecosystem services that they provide to the watershed in the form of hydrology, sediment transport, and aquatic and terrestrial functions. The headwater drainage features in the Eagle Lake catchment are all classified as natural and wetland features. Figure 67 shows the feature type of the primary feature at the sampling locations.
Figure 67 Headwater feature types in the Eagle Lake catchment
3.4.3 Headwater Feature Flow
The observed flow condition within headwater drainage features can be highly variable depending on timing relative to the spring freshet, recent rainfall, soil moisture, etc. Flow conditions are assessed in the spring and in the summer to determine if features are perennial and flow year round, if they are intermittent and dry up during the summer months or if they are ephemeral systems that do not flow regularly and generally respond to specific rainstorm events or snowmelt. Flow conditions in headwater systems can change from year to year depending on local precipitation patterns. Figure 68 shows the observed flow condition at the sampling locations in the Eagle Lake catchment in 2016.
Figure 68 Headwater feature flow conditions in the Eagle Lake catchment
A spring photo of the headwater sample site in the Eagle Lake catchment located on Sugar Bush Road
A summer photo of the headwater sample site in the Eagle Lake catchment located on Sugar Bush Road
3.4.4 Feature Channel Modifications
Channel modifications were assessed at each headwater drainage feature sampling location. Modifications include channelization, dredging, hardening and realignments. The Eagle Lake catchment area had a majority of features with no channel modifications with the exception of one site having mixed modifications. Figure 69 shows the channel modifications observed at the sampling locations for the Eagle Lake catchment.
Figure 69 Headwater feature channel modifications in the Eagle Lake catchment
3.4.5 Headwater Feature Vegetation
Headwater feature vegetation is classified into the following types: no vegetation, lawn, wetland, meadow, scrubland and forest. The type of vegetation within the channel influences the aquatic and terrestrial ecosystem values that the feature provides. For some types of headwater features, the vegetation within the feature plays a very important role in flow and sediment movement and provides wildlife habitat. Figure 70 depicts the dominant vegetation observed at the sampled headwater sites in the Eagle Lake catchment.
Figure 70 Headwater feature vegetation types in the Eagle Lake catchment
3.4.6 Headwater Feature Riparian Vegetation
Headwater riparian vegetation evaluates the type of vegetation that is found along the adjacent lands of a headwater drainage feature. The type of vegetation within the riparian corridor influences the aquatic and terrestrial ecosystem values that the feature provides to the watershed. Figure 71 depicts the type of riparian vegetation observed at the sampled headwater sites in the Eagle Lake catchment. The majority of the headwater drainage features are classified as having natural riparian vegetation with only one feature having altered vegetation.
Figure 71 Headwater feature riparian vegetation types in the Eagle Lake catchment
3.4.7 Headwater Feature Sediment Deposition
Assessing the amount of recent sediment deposited in a channel provides an index of the degree to which the feature could be transporting sediment to downstream reaches (OSAP, 2013). Evidence of excessive sediment deposition might indicate the requirement to follow up with more detailed targeted assessments upstream of the site location to identify potential best management practices to be implemented. Sediment deposition ranged from none to substantial for the headwater sites sampled in the Eagle Lake catchment area. Figure 72 depicts the degree of sediment deposition observed at the sampled headwater sites in the Eagle Lake catchment. Sediment deposition conditions ranged from no sediment deposition to extensive.
Figure 72 Headwater feature sediment deposition in the Eagle Lake catchment
3.4.8 Headwater Feature Upstream Roughness
Feature roughness will provide a measure of the amount of materials within the bankfull channel that could slow down the velocity of water flowing within the headwater feature (OSAP, 2013). Materials on the channel bottom that provide roughness include vegetation, wood structure and boulders/cobble substrates. Roughness can provide benefits in mitigating downstream erosion on the headwater drainage feature and the receiving watercourse by reducing velocities. Roughness also provides important habitat conditions for aquatic organisms. Figure 73 shows that the feature roughness conditions at the sampling locations in the Eagle Lake catchment were highly variable ranging from minimal to extreme.
Figure 73 Headwater feature roughness in the Eagle Lake catchment
4.0 Eagle Lake Catchment: Land Cover
Land cover and any change in coverage that has occurred over a six year period is summarized for the Eagle Lake catchment using spatially continuous vector data representing the catchment during the spring of 2008 and 2014. This dataset was developed by the RVCA through heads-up digitization of 20cm DRAPE ortho-imagery at a 1:4000 scale and details the surrounding landscape using 10 land cover classes.
4.1 Eagle Lake Catchment Change
As shown in Table 17 and Figure 1, the dominant land cover type in 2014 is woodland.
Table 17 Land cover in the Eagle Lake catchment (2008 vs. 2014)
* Does not include treed swamps ** Includes treed swamps
From 2008 to 2014, there was an overall change of six hectares (from one land cover class to another). Most of the change in the Eagle Lake catchment is a result of woodland reverting to wetland and the conversion of crop and pastureland to settlement (Figure 74).
Figure 74 Land cover change in the Eagle Lake catchment (2008 to 2014)
Table 18 provides a detailed breakdown of all land cover change that has taken place in the Eagle Lake catchment between 2008 and 2014.
Table 18 Land cover change in the Eagle Lake catchment (2008 to 2014)
4.2 Woodland Cover
In the Environment Canada Guideline (Third Edition) entitled “How Much Habitat Is Enough?” (hereafter referred to as the “Guideline”) the opening narrative under the Forest Habitat Guidelines section states that prior to European settlement, forest was the predominant habitat in the Mixedwood Plains ecozone. The remnants of this once vast forest now exist in a fragmented state in many areas (including the Rideau Valley watershed) with woodland patches of various sizes distributed across the settled landscape along with higher levels of forest cover associated with features such as the Frontenac Axis (within the on-Shield areas of the Rideau Lakes and Tay River subwatersheds). The forest legacy, in terms of the many types of wildlife species found, overall species richness, ecological functions provided and ecosystem complexity is still evident in the patches and regional forest matrices (found in the Tay River subwatershed and elsewhere in the Rideau Valley watershed). These ecological features are in addition to other influences which forests have on water quality and stream hydrology including reducing soil erosion, producing oxygen, storing carbon along with many other ecological services that are essential not only for wildlife but for human well-being.
The Guideline also notes that forests provide a great many habitat niches that are in turn occupied by a great diversity of plant and animal species. They provide food, water and shelter for these species - whether they are breeding and resident locally or using forest cover to help them move across the landscape. This diversity of species includes many that are considered to be species at risk. Furthermore, from a wildlife perspective, there is increasing evidence that the total forest cover in a given area is a major predictor of the persistence and size of bird populations, and it is possible or perhaps likely that this pattern extends to other flora and fauna groups. The overall effect of a decrease in forest cover on birds in fragmented landscapes is that certain species disappear and many of the remaining ones become rare, or fail to reproduce, while species adapted to more open and successional habitats, as well as those that are more tolerant to human-induced disturbances in general, are able to persist and in some cases thrive. Species with specialized-habitat requirements are most likely to be adversely affected. The overall pattern of distribution of forest cover, the shape, area and juxtaposition of remaining forest patches and the quality of forest cover also play major roles in determining how valuable forests will be to wildlife and people alike.
The current science generally supports minimum forest habitat requirements between 30 and 50 percent, with some limited evidence that the upper limit may be even higher, depending on the organism/species phenomenon under investigation or land-use/resource management planning regime being considered/used.
As shown in Figure 75, 52 percent of the Eagle Lake catchment contains 1779 hectares of upland forest and four hectares of lowland forest (treed swamps) versus the 47 percent of woodland cover in the Tay River subwatershed. This is greater than the 30 percent of forest cover that is identified as the minimum threshold required to sustain forest birds according to the Guideline and which may only support less than one half of potential species richness and marginally healthy aquatic systems. When forest cover drops below 30 percent, forest birds tend to disappear as breeders across the landscape.
Figure 75 Woodland cover and forest interior in the Eagle Lake catchment (2014)
4.2.1 Woodland (Patch) Size
According to the Ministry of Natural Resources’ Natural Heritage Reference Manual (Second Edition), larger woodlands are more likely to contain a greater diversity of plant and animal species and communities than smaller woodlands and have a greater relative importance for mobile animal species such as forest birds.
Bigger forests often provide a different type of habitat. Many forest birds breed far more successfully in larger forests than they do in smaller woodlots and some rely heavily on forest interior conditions. Populations are often healthier in regions with more forest cover and where forest fragments are grouped closely together or connected by corridors of natural habitat. Small forests support small numbers of wildlife. Some species are “area-sensitive” and tend not to inhabit small woodlands, regardless of forest interior conditions. Fragmented habitat also isolates local populations, especially small mammals, amphibians and reptiles with limited mobility. This reduces the healthy mixing of genetic traits that helps populations survive over the long run (Conserving the Forest Interior. Ontario Extension Notes, 2000).
The Environment Canada Guideline also notes that for forest plants that do not disperse broadly or quickly, preservation of some relatively undisturbed large forest patches is needed to sustain them because of their restricted dispersal abilities and specialized habitat requirements and to ensure continued seed or propagation sources for restored or regenerating areas nearby.
The Natural Heritage Reference Manual continues by stating that a larger size also allows woodlands to support more resilient nutrient cycles and food webs and to be big enough to permit different and important successional stages to co-exist. Small, isolated woodlands are more susceptible to the effects of blowdown, drought, disease, insect infestations, and invasions by predators and non-indigenous plants. It is also known that the viability of woodland wildlife depends not only on the characteristics of the woodland in which they reside, but also on the characteristics of the surrounding landscape where the woodland is situated. Additionally, the percentage of forest cover in the surrounding landscape, the presence of ecological barriers such as roads, the ability of various species to cross the matrix surrounding the woodland and the proximity of adjacent habitats interact with woodland size in influencing the species assemblage within a woodland.
In the Eagle Lake catchment (in 2014), seventy-two (43 percent) of the 168 woodland patches are very small, being less than one hectare in size. Another 78 (46 percent) of the woodland patches ranging from one to less than 20 hectares in size tend to be dominated by edge-tolerant bird species. The remaining 18 (11 percent of) woodland patches range between 20 and 273 hectares in size. Fifteen of these patches contain woodland between 20 and 100 hectares and may support a few area-sensitive species and some edge intolerant species, but will be dominated by edge tolerant species.
Conversely, three (two percent) of the 168 woodland patches in the drainage area exceed the 100 plus hectare size needed to support most forest dependent, area sensitive birds and are large enough to support approximately 60 percent of edge-intolerant species. Two patches top 200 hectares, which according to the Environment Canada Guideline will support 80 percent of edge-intolerant forest bird species (including most area sensitive species) that prefer interior forest habitat conditions.
Table 19 presents a comparison of woodland patch size in 2008 and 2014 along with any changes that have occurred over that time. In the Eagle Lake catchment, there has been neither an increase or decrease observed in the overall woodland patch area between the two reporting periods.
Table 19 Woodland patches in the Eagle Lake catchment (2008 and 2014)
*Includes treed swamps
4.2.2 Woodland (Forest) Interior Habitat
The forest interior is habitat deep within woodlands. It is a sheltered, secluded environment away from the influence of forest edges and open habitats. Some people call it the “core” or the “heart” of a woodland. The presence of forest interior is a good sign of woodland health, and is directly related to the woodland’s size and shape. Large woodlands with round or square outlines have the greatest amount of forest interior. Small, narrow woodlands may have no forest interior conditions at all. Forest interior habitat is a remnant natural environment, reminiscent of the extensive, continuous forests of the past. This increasingly rare forest habitat is now a refuge for certain forest-dependent wildlife; they simply must have it to survive and thrive in a fragmented forest landscape (Conserving the Forest Interior. Ontario Extension Notes, 2000).
The Natural Heritage Reference Manual states that woodland interior habitat is usually defined as habitat more than 100 metres from the edge of the woodland and provides for relative seclusion from outside influences along with a moister, more sheltered and productive forest habitat for certain area sensitive species. Woodlands with interior habitat have centres that are more clearly buffered against the edge effects of agricultural activities or more harmful urban activities than those without.
In the Eagle Creek catchment (in 2014), the 168 woodland patches contain 23 forest interior patches (Figure 75) that occupy five percent (158 ha.) of the catchment land area (which is the same as the five percent of interior forest in the Tay River subwatershed). This is below the ten percent figure referred to in the Environment Canada Guideline that is considered to be the minimum threshold for supporting edge intolerant bird species and other forest dwelling species in the landscape.
Most patches (19) have less than 10 hectares of interior forest, nine of which have small areas of interior forest habitat less than one hectare in size. The remaining four patches contain interior forest between 10 and 127 hectares in area. Between 2008 and 2014, there has been neither an increase or decrease observed in the overall area of interior forest habitat in the Eagle Creek catchment (Table 20).
Table 20 Woodland interior in the Eagle Lake catchment (2008 and 2014)
4.3 Wetland Cover
Wetlands are habitats forming the interface between aquatic and terrestrial systems. They are among the most productive and biologically diverse habitats on the planet. By the 1980s, according to the Natural Heritage Reference Manual, 68 percent of the original wetlands south of the Precambrian Shield in Ontario had been lost through encroachment, land clearance, drainage and filling.
Wetlands perform a number of important ecological and hydrological functions and provide an array of social and economic benefits that society values. Maintaining wetland cover in a watershed provides many ecological, economic, hydrological and social benefits that are listed in the Reference Manual and which may include:
- contributing to the stabilization of shorelines and to the reduction of erosion damage through the mitigation of water flow and soil binding by plant roots
- mitigating surface water flow by storing water during periods of peak flow (such as spring snowmelt and heavy rainfall events) and releasing water during periods of low flow (this mitigation of water flow also contributes to a reduction of flood damage)
- contributing to an improved water quality through the trapping of sediments, the removal and/or retention of excess nutrients, the immobilization and/or degradation of contaminants and the removal of bacteria
- providing renewable harvesting of timber, fuel wood, fish, wildlife and wild rice
- contributing to a stable, long-term water supply in areas of groundwater recharge and discharge
- providing a high diversity of habitats that support a wide variety of plants and animals
- acting as “carbon sinks” making a significant contribution to carbon storage
- providing opportunities for recreation, education, research and tourism
Historically, the overall wetland coverage within the Great Lakes basin exceeded 10 percent, but there was significant variability among watersheds and jurisdictions, as stated in the Environment Canada Guideline. In the Rideau Valley Watershed, it has been estimated that pre-settlement wetland cover averaged 35 percent using information provided by Ducks Unlimited Canada (2010) versus the 21 percent of wetland cover existing in 2014 derived from DRAPE imagery analysis.
Figure 76 Wetland cover in the Eagle Lake catchment (2014)
Reliable, pre-settlement wetland cover data is unavailable for the Eagle Lake catchment; however, data for the years 2008 and 2014 is available and shows that wetland cover remains unchanged at 13 percent in 2014 (as indicated in Table 21 and shown in Figure 76). To maintain critical hydrological, ecological functions along with related recreational and economic benefits provided by these wetland habitats in the catchment, a “no net loss” of currently existing wetlands should be employed to ensure the continued provision of tangible benefits accruing from them to landowners and surrounding communities.
Table 21 Wetland cover in the Eagle Lake catchment (2014)
4.4 Shoreline Cover
The riparian or shoreline zone is that special area where the land meets the water. Well-vegetated shorelines are critically important in protecting water quality and creating healthy aquatic habitats, lakes and rivers. Natural shorelines intercept sediments and contaminants that could impact water quality conditions and harm fish habitat in streams. Well established buffers protect the banks against erosion, improve habitat for fish by shading and cooling the water and provide protection for birds and other wildlife that feed and rear young near water. A recommended target (from the Environment Canada Guideline) is to maintain a minimum 30 metre wide vegetated buffer along at least 75 percent of the length of both sides of rivers, creeks and streams.
Figure 77 shows the extent of the ‘Natural’ vegetated riparian zone (predominantly wetland/woodland features) and ‘Other’ anthropogenic cover (crop/pastureland, roads/railways, settlements) along a 30-metre-wide area of land around Eagle and Leggat Lake, other lakes and along both sides of the shoreline of Eagle Creek and the many unnamed watercourses (including headwater streams) found in the Eagle Lake catchment.
Figure 77 Natural and other riparian land cover in the Eagle Lake catchment (2014)
This analysis shows that the Eagle Lake catchment riparian buffer is composed of woodland (64 percent), wetland (27 percent), settlement (five percent), transportation (two percent), meadow-thicket (one percent) and crop and pastureland (one percent). Along the many watercourses (including headwater streams) flowing into Eagle Lake, the riparian buffer is composed of woodland (56 percent), wetland (38 percent), transportation routes (three percent), crop and pastureland (one percent), meadow-thicket (one percent) and settlement areas (one percent).
Around Eagle Lake itself, the shoreline buffer is dominated by woodland (83 percent) and cottages, houses and camps (11 percent) with the remainder comprised of wetland (four percent), transportation routes (one percent) and meadow-thicket (one percent). Similarly, the shoreline buffer around Leggat Lake is dominated by woodland (79 percent) and cottages and houses (11 percent) with the remainder comprised of wetland (seven percent), roads (two percent) and meadow-thicket (one percent). Along Eagle Creek, the riparian zone is composed of wetland (55 percent), woodland (25 percent), crop and pastureland (11 percent), settlement (five percent), roads (two percent) and aggregates (two percent).
Additional statistics for the Eagle Lake catchment are presented in Tables 22 to 26 and show that there has been little to no change in shoreline cover from 2008 to 2014.
Table 22 Riparian land cover in the Eagle Lake catchment (2008 vs. 2014)
Table 23 Riparian land cover around Eagle Lake (2008 vs. 2014)
Table 24 Riparian land cover around Leggat Lake (2008 vs. 2014)
Table 25 Riparian land cover along Eagle Creek (2008 vs. 2014)
Table 26 Riparian land cover along streams in the Eagle Lake Catchment (2008 vs. 2014)
5.0 Eagle Lake Catchment: Stewardship and Water Resources Protection
The RVCA and its partners are working to protect and enhance environmental conditions in the Tay River Watershed. Figure 78 shows the location of all stewardship projects completed in the Eagle Lake catchment.
Figure 78 Stewardship site locations in the Eagle Lake catchment
5.1 Rural Clean Water
The Rural Clean Water Program provides technical and financial assistance to farmers and other rural landowners, to aid in the implementation of projects that protect water quality. Funding is granted to those projects that support best management practices for application in the protection and improvement of surface and ground water resources. The program also supports climate change adaptation and low impact development projects as well as educating rural landowners about environmental stewardship of private property. Examples of supported projects include livestock exclusion fencing, controlled tile drainage, cover crops, erosion control, well related projects, and many more. For a list of eligible projects and to apply for funding, see Rural Clean Water.
In the Eagle Lake catchment from 2011 to 2016, one erosion control projects was completed; prior to this, one well upgrade had been completed. Total value of the two projects is $30,685 with $4,000 of that amount funded through grant dollars from the RVCA.
5.2 Private Land Forestry
Forest cover and tree planting continues to be one of the most widely supported strategies to improve our environment. The many benefits of forest cover include carbon sequestration, flood mitigation and water quality improvement as well as providing wildlife habitat.
Through the RVCA's Trees for Tomorrow Program (and its predecessors), 2,000 trees were planted at two sites resulting in the reforestation of one hectare. Total project value of the two projects in the Eagle Lake catchment is $1,575 with $1,305 of that amount coming from fundraising sources. For more information about the Program and landowner eligibility, please see the following: Tree Planting in the Rideau Valley Watershed and Trees for Tomorrow.
An additional 34 butternut trees were planted through the RVCA Butternut Recovery Program as part of efforts to introduce healthy seedlings from tolerant butternuts into various locations across Eastern Ontario.
5.3 Shoreline Naturalization
Natural shoreline buffers rich in native plants are critically important to protecting the health of our lakes, rivers and streams. Shoreline vegetation protects water quality and aquatic habitat by intercepting potentially harmful contaminants such as nutrients, pollutants and sediment, regulating water temperatures, slowing runoff and providing important fish and wildlife habitat. Natural shorelines also help improve climate change resiliency by increasing flood storage and providing protection from erosion during extreme weather events.
Though the RVCA’s Shoreline Naturalization Program, landowners (private and public property owners) have naturalized more than 2.3 km of shoreline in the Tay Watershed by planting over 10,563 native trees and shrubs at 96 sites since 2008. In the Eagle Lake catchment, a total of 190 native trees and shrubs have been planted along 106 metres of shoreline at an average buffer width of three metres for a total project value of $1,569.
5.4 Fish and Wetland Habitat
One of the primary sites for Lake Trout spawning at Eagle Lake is the extensive shoals opposite Camp Oconto. With Ontario Ministry of Natural Resources & Forestry (OMNRF) approval, rehabilitation of this shoal was undertaken in 2006. Eagle Lake Property Owners’ Association volunteers, along with stewardship rangers from the Frontenac Stewardship Council, shoveled approximately 50 tons of suitably sized rocks onto three sites of this shoal. Spawning activity at this shoal has been directly observed by OMNRF staff in the fall of 2014 and 2015.
An OMNRF-directed creel survey in the spring and summer of 2010 indicated self-sustaining populations of Smallmouth and Largemouth Bass, as well as Northern Pike.
In 2008, OMNRF initiated a program (referred to as Broad-scale Monitoring) to assess the health of fish populations by conducting netting surveys. At Eagle Lake in 2008, 32 sites were surveyed and 13 different fish species netted, including 5 Lake Trout (4 stocked and 1 natural fish). The second survey in 2014 collected 14 species at 30 sites, but no Lake Trout. Broad-scale monitoring was again done at Eagle Lake in 2018 with 44 sites surveyed that netted 16 different fish species including one natural Lake Trout.
According to OMNRF records, Eagle Lake has been stocked with Lake Trout 49 times since 1917. It was last stocked in 1994.
On two occasions, Eagle Lake has had a netting survey specifically to assess the Lake Trout population. This involves setting nets at multiple locations at the proper depth based on water temperature to ensure optimal net placement. In the spring of 1999, nets at 30 widely distributed sites netted 54 Lake Trout only one of which was a natural fish. Of the 53 stocked Lake Trout, their weight class indicated that about 80 percent likely resulted from the last stocking in 1994. A similarly conducted netting survey in the summer of 2016 netted only one large Lake Trout.
5.5 Valley, Stream, Wetland and Hazard Lands
The Eagle Lake catchment covers 34 square kilometres and contains nine square kilometres of wetland along with 64.3 kilometres of stream. None of these natural features are subject to the regulation limit of Ontario Regulation 174/06 (Figure 79) for the protection of wetland areas and river or stream valleys that are affected by flooding and erosion hazards.
For areas where no regulation limit exists, protection of the catchment’s watercourses is provided through the “alteration to waterways” provision of the regulation.
Figure 79 Regulated natural features and hazards in the Eagle Lake catchment
5.6 Vulnerable Drinking Water Areas
Mississippi-Rideau Source Water Protection program has mapped a small part of the catchment as a Significant Groundwater Recharge Areas and all of the catchment as a Highly Vulnerable Aquifer. This means that the nature of the overburden (thin soils, fractured bedrock) does not provide a high level of protection for the underlying groundwater making the aquifer more vulnerable to contaminants released on the surface. There are no Well-Head Protection Areas in the catchment.
The Mississippi-Rideau Source Protection Plan includes policies that focus on the protection of groundwater region-wide due to the fact that most of the region, which encompasses the Mississippi and Rideau watersheds, is considered Highly Vulnerable Aquifer. For detailed maps and policies that have been developed to protect drinking water sources, visit the Mississippi-Rideau Source Protection Region website.
6.0 Eagle Lake Catchment: Accomplishments
Developed by the Eagle Lake Property Owners' Association and its partners, the State of the Lake Report - Eagle Lake (2010) and State of the Lake Report - Eagle Lake Update 2015 provide information on many aspects of the lake environment, as well as issues of concern and actions to be taken to maintain and improve the long-term health of the lake. The following list includes some of the accomplishments of the Eagle Lake Property Owners' Association and residents that have implications for the well-being of the land and water resources of the lake ecosystem. Specific achievements of the Eagle Lake community are indicated by an asterisk.
Eagle Lake and Catchment Health
Shoreline Planting
190 native trees and shrubs have been planted by the RVCA Shoreline Naturalization Program at an average buffer width of three metres along 106 metres of shoreline.
Shoreline Vegetation Survey
Mapping of the abundance of aquatic plants was carried out along the shoreline of Eagle Lake in September 2015, as part of a Carleton University - RVCA sponsored research project.*
Tree Planting
2000 trees have been planted at two sites in the Eagle Lake catchment by the RVCA Private Land Forestry Program, resulting in the reforestation of one hectare.
As part of the Butternut Tree Recovery Program sponsored by RVCA, six saplings were planted at two locations at the north end of the lake in 2016 and a further 21 at six different sites in 2017.*
Water Levels
Access to the CPR culvert and associated beaver dam on Eagle Creek was obtained from South Frontenac Township in September 2015. A local contractor was subsequently hired to regularly remove the beaver dam located at the opening of the culvert running below the CPR track over Eagle Creek and also to maintain two additional beaver dams along Eagle Creek south of the CPR track. These recent steps and regular trips made by Ministry of Natural Resources & Forestry (MNRF) staff to adjust the outflow through the control dam have gradually stabilized the level of Eagle Lake.*
MNRF staff from Kingston office repaired concrete foundation of the control dam in 2016 and will provide further improvements to the dam and an additional staff gauge in 2019 to enable better control of lake levels. At that time, a HOBO gauge was installed by the province to further enable control of seasonal lake levels, which now allows MNRF staff to see when the creek;s water level has risen, indicating that some action should be considered to restore normal seasonal lake water levels. The gauge provides continuous monitoring of water levels and temperature with data access via a satellite feed available online.*
In 2010, Rideau Valley Conservation Authority installed a water level gauge on a lakeshore property that is regularly monitored by the land owner with data provided to RVCA.*
To better manage water levels, in 2018 a site-visit consultation was arranged with Ducks Unlimited for possible installation of a beaver baffler at the largest beaver dam on Eagle Creek. An equipment/installation quotation was provided by this organization.*
Water Quality
RVCA derived water quality data for Leggat Lake was included in the 2015 State of the Lake Report (it has no lake association but flows into Eagle Lake).*
Microscopic examination, following a filamentous green algal bloom in Curl’s Bay in 2016 on Eagle Lake, reveals many types of green algae as well as 10 species of cyanobacteria, some of which can produce toxins.*
Township of Central Frontenac will implement a septic re-inspection program (mandatory/voluntary) in 2019. The initial phase will involve lake-front properties at Eagle Lake. The service is to be provided by the Mississippi-Rideau Septic System Office.
In the summer of 2014, using a commercially operated barge pump-out service, six water access-only property owners voluntarily had their septic tanks emptied and inspected. RKY Camp completed an extensive septic system treatment replacement in 2018.*
Eagle Lake and Leggat Lake are each sampled yearly by the RVCA for five parameters, four times a year along with one stream sampling site on Eagle Creek being sampled for 22 parameters, six times a year to assess surface chemistry water quality conditions.
One Ontario Benthic Biomonitoring Network site on Eagle Creek is sampled yearly by the RVCA with three replicates to assess instream biological water quality conditions.
One Rural Clean Water Program project has been completed by the RVCA Rural Clean Water Program.
Eagle Lake and Catchment Habitat
Broad-Scale Fish Community Monitoring
Eagle Lake has been designated by MNRF as one of the Ontario lakes to be assessed every five years through their broad-scale monitoring program. At Eagle Lake, fish population census was assessed through multiple site nettings in both 2008 and 2014 with 14 species identified. In 2008, five Lake Trout were netted (one approximately 25 years old), but none in the 2014 netting series.
Dragonfly/Damselfly Identification
A photographic documentation of Eagle Creek Dragonflies and Damselflies has identified 28 species of dragonflies and 13 different damselflies. The variety and numbers indicate favourable water quality as the aquatic stage of their life-cycle is sensitive to pollution.*
Eagle Lake Research
For a number of years, Department of Civil Engineering staff and students at Queen’s University (one staff member with a family cottage at Eagle Lake) collected data from a buoy anchored at the deep point, installed a weather station on a small island, and obtained a lake-bottom sediment core. Information from this type of data, along with RVCA water quality results from Eagle Lake, has resulted in three published scientific papers and two MSc theses.*
Flora Identification
An illustrated catalogue of Wildflowers of the Eagle Lake Region consisting of over 400 wildflowers, shrubs, ferns and grasses in the immediate area of Eagle Lake has been developed. A university student living at Eagle Lake has collected and archived 100 marsh, wetland and shoreline plant species in the local environment. Some of the various trees at Eagle Lake have been documented.*
Habitat Surveillance
Eagle Creek drone videos were taken in September 2017 by staff and students of Granite Ridge Education Centre in Sharbot Lake along with an additional drone survey carried out in March 2018 of an area of the creek with a large beaver dam . These provide better appreciation of the topography of this region as it is not readily accessible and locates beaver lodges and dams. GIS mapping files are also available as part of this project.*
Heronry Monitoring
In 2009, it was noted that a number of Great Blue Herons had established a communal nesting site at the north end of the lake. Herons normally nest in trees, and there have been up to 13 nests at this site. Generally, each nest contains two to three chicks.*
In-stream Habitat
2.7 kilometres of Eagle Creek have been surveyed and 14 headwaters sites were sampled by the RVCA Stream Characterization Program.
Invasive Species Control
For a number of years, Purple Loosestrife was controlled by a combination of manual removal and introduction of the beetle Neogalerucella calmariensis, but has since recurred mainly at one site and requires reintroduction of this beetle species. European Frogbit has been adequately controlled at numerous sites.. From 2010 to 2015, a concerted effort was made to manually cull this species at a number of sites. Volunteers from the Eagle Lake Property Owners’ Association, counsellors from RKY Camp, and high-school students with the Stewardship Rangers Program manually removal large quantities of this plant. As a result, only small numbers of European Frogbit plants remain at one or two locations.*
Lake Partner Program
This sampling of lake water for Total Phosphorus and Secchi disk depth takes place each May in 550 Ontario lakes. It is sponsored by the Ontario Ministry of Environment, Conservation & Parks. Volunteers at Eagle Lake have sampled annually since 1996. Results have been consistently favourable.*
Lake Trout Population Monitoring
A summer protocol of setting gill nets at 30 different locations was carried out by MNRF to assess the status of the Lake trout population in a 2016 survey. No Lake Trout were netted, a result of some concern. A spring-time netting protocol (also with 30 gill nets) performed in 1999 netted 54 Lake Trout (only one natural fish).*
Loon Surveys
Through a Common Loon survey coordinator and volunteers, Eagle Lake has a record of 18 years of Common Loon monitoring data including breeding pair success in raising chicks. During that time frame, there have been 74 pairs observed, resulting in 45 chicks surviving a minimum of 6 weeks; a reasonable success rate. Results are provided annually to the Canadian Lakes Loon Survey, a program of Birds Studies Canada.*
Eagle Lake Property Owners' Association Leadership
Lake Planning
In 2015, a five year review of the State of the Lake Report - Eagle Lake (2010) was undertaken resulting in the publication of the second State of the Lake Report - Eagle Lake Update 2015: Part 1
and State of the Lake Report - Eagle Lake Update 2015: Part 2.*
Liaison with Other Lake Associations
The Eagle Lake Property Owners' Association continues to liaise with other local lake associations through its participation in the Lake Networking Group.*
7.0 Eagle Lake Catchment: Challenges/Issues
Developed by the Eagle Lake Property Owners’ Association and its partners, the second Eagle Lake State of the Lake Report (2015) provides information on many aspects of the lake environment, as well as issues of concern identified by the lake community that could threaten the long-term health of the lake. The following list includes some of those identified issues that have implications for the water and land resources of the lake ecosystem. Specific issues noted by the lake community are indicated by an asterisk.
Development
Waterfront property development is occurring primarily through the transformation of traditional, seasonal cottages into larger year-round dwellings. This transition is taking place either through re-development of an existing cottage lot or incremental alterations (additions, sleeping cabins, gazebos, decks, sheds, boat houses, garages, lawns, shoreline modifications, docks), all of which may put additional stress on the sensitive shoreline zone and the lake along with potential, added septic system loading.
Many waterfront properties contain existing non-conforming dwellings with respect to minimum water frontage and lot area and are often located within 30 metres of the water that require minor variances for expansion and/or reconstruction of dwellings where standard development setbacks from water are difficult to achieve. In these cases, of which there are many, staff at the Township of Central Frontenac and the Conservation Authority often meet with resistance and push back when attempts are made to implement standards for development setbacks, vegetated shorelines and septic systems.
Monitoring implementation of conditions of planning and regulatory approvals is challenging due to a lack of resources.
Headwaters/In-Water Habitat/Shorelines
Maintaining and enhancing Lake Trout populations at Eagle Lake (the number of fishermen trolling for Lake Trout has markedly decreased). Natural recruitment appears limited. Accumulating evidence from specific netting protocols, along with ending periodic stocking of lake trout in 1994, suggests there are decreasing numbers of Lake Trout.*
Relative to its dissolved oxygen level, Eagle Lake (but not Leggat Lake) is classified by MNR and MOE as a highly-sensitive Lake Trout lake. Its metalimnion layer where Dissolved Oxygen is above 7 mg/L (minimum for juvenile trout) has been declining in thickness with global warming, although improving slightly in 2016.*
Manual removal of the invasive European Frogbit at multiple sites has been quite successful and only minimal plants remain at limited sites. But since the 2012/2013 seasons, Purple Loosestrife has extensively recurred at Oconto Creek where it empties into Eagle Lake.*
Littoral zone mapping identifying substrate type, vegetation and habitat features along with opportunities for shoreline enhancement is unavailable for Eagle and Leggat Lake.
Land Cover
Wetlands cover 13 percent (437 ha.) of the catchment (in 2014). One hundred percent (437 ha.) of these wetlands remain unevaluated and unregulated and although they are not under imminent threat from development activity, they do remain vulnerable to drainage and land clearing activities in the absence of any regulatory and planning controls that would otherwise protect them for the many important hydrological, social, biological and ecological functions/services/values they provide to landowners and the surrounding community (see Section 4.3 of this report).
Water Quality
Eagle Creek surface chemistry water quality rating ranges from Fair to Good (see Section 2.3 of this report).
Eagle Lake surface chemistry water quality does not exhibit any sampling concerns (see Section 2.2 of this report).
Leggat Lake surface chemistry water quality rating ranges from Fair to Good (see Section 2.1 of this report).
Eagle Creek instream biological water quality conditions range from Poor to Fair (at the Bobs Lake Road crossing)(see Section 3.3.1 of this report).
No septic system re-inspection program (mandatory or voluntary) is in effect, currently.*
Water Levels
Beaver dam issues continue at the CPR crossing downstream of the MNR control structure on Eagle Creek. Further improvements to lake level control can only be achieved if flow along Eagle Creek can be stabilized by controlling beaver activities.*
The 1:100 year flood elevation is unavailable for Eagle Lake. It can be utilized as an additional factor to be considered when assessing site specific development setbacks.
8.0 Eagle Lake Catchment: Actions/Opportunities
Developed by the Eagle Lake Property Owners’ Association and its partners, the State of the Lake Report - Eagle Lake Update 2015 provides information on many aspects of the lake environment, as well as actions to maintain and improve the long-term health of the lake. The following list includes some of those identified actions that have implications for the land and water resources of the lake ecosystem. Specific actions noted by the Eagle Lake community are indicated by an asterisk.
Eagle Lake and Catchment Health
Development
Work with approval authorities (Central Frontenac Township, Frontenac County, Kingston Frontenac Lennox and Addington Health Unit, Mississippi Rideau Septic System Office, RVCA and South Frontenac Township) and waterfront property owners (including the Eagle Lake Property Owners' Association and Leggat Lake community) to consistently implement current land use planning and development policies for water quality and shoreline protection adjacent to Eagle and Legatt Lake, Eagle Creek and headwater streams in the catchment (i.e., a minimum 30 metre development setback from water).
Explore ways and means to more effectively enforce and implement conditions of land-use planning and development approval to achieve net environmental gains (particularly with respect to rehabilitating or protecting naturally vegetated shorelines and water quality).
Encourage Committee of Adjustment to take advantage of technical and environmental information and recommendations forthcoming from planning and environmental professionals.
Municipalities in the Tay Watershed are encouraged to strengthen natural heritage and water resources official plan policies and zoning provisions (pertaining to water setbacks, frontage and naturalized shorelines and wetland protection) where deemed appropriate.
Work with Central Frontenac Township, Frontenac County, South Frontenac Township and agencies to ensure that development approvals around lakes and along watercourses take into consideration the protection of fish habitat (including the near-shore nursery and spawning habitat).
Municipal and agency planners together with development proponents are to use the 2014 Site Evaluation Guidelines to inform decision-making about the application of development setbacks on lots with shallow soils/bedrock, steep slopes and sparse vegetation cover along with the use of the appropriate, development related, best management practices.
Utilize RVCA subwatershed and catchment reports to help develop/revise official plan policies to protect surface water resources and the natural environment (including woodlands, wetlands and shoreline cover).
Establish RVCA regulation limits around the 100 percent (437 ha.) of wetlands in the catchment that are unevaluated. Doing this will help protect landowners from natural hazards including mitigating surface water flow by storing water during periods of peak flow (such as spring snowmelt and heavy rainfall events) and releasing water during periods of low flow (this mitigation of water flow reduces flood damage), as well as contributing to the stabilization of shorelines and to the reduction of soil erosion damage through water flow mitigation and plant soil binding/retention.
Shorelines
Take advantage of the RVCA Shoreline Naturalization Program to re-naturalize altered creek, lake and stream shoreline identified in this report as “Unnatural Riparian Land Cover". Consider concentrating stewardship efforts on Eagle Lake waterfront properties shown in orange on the Riparian Land Cover map (see Figure 77 in Section 4.4 in this report). Other stewardship opportunities in the catchment may be determined based on septic system inspections and surface water quality monitoring results.
Promote the use of bioengineering methods (using native shrub/tree planting, fascines, live stakes) as a shoreline erosion mitigation measure as well as a cost effective alternative to shoreline hardening (with rip rap, armour stone, gabion baskets, walls)
Educate landowners about the value and importance of natural shorelines and property best management practices with respect to shoreline use and development, septic system installation and maintenance and shoreline vegetation retention and enhancement (Central Frontenac Township, Eagle Lake Property Owners’ Association, Frontenac County, Leggat Lake community, Kingston Frontenac Lennox and Addington Health Unit, Mississippi Rideau Septic System Office, RVCA and South Frontenac Township).
Water Quality
Consider further investigation of the Poor to Fair instream biological water quality conditions in Eagle Creek, as part of a review of RVCA's Watershed Watch, Baseline and Benthic Invertebrate surface water quality monitoring.
Offer funding provided by the RVCA Rural Clean Water Program to landowners with potential projects that could improve water quality on Eagle and Lleggat Lakes and their tributaries (e.g., livestock fencing, septic system repair/replacement and streambank erosion control/stabilisation).
Educate waterfront property owners about septic system care by providing information about sewage system maintenance (i.e., when to pump out septic systems and holding talks) through initiatives such as the Septic Savvy Workshop and services provided by the Mississippi Rideau Septic System Office.
Reduce pollutant loadings to Eagle Lake through education about the application of shoreline, stormwater and agricultural best management practices; also consider using low impact development (LID) methods to improve the quality and reduce the amount of stormwater runoff directly reaching the lake ecosystem. This will be particularly beneficial in areas with extensive impervious surfaces (i.e., asphalt, concrete, buildings, and severely compacted soils) or on sensitive waterfront properties (with steep slopes/banks, shallow/impermeable soils).
Eagle Lake and Catchment Habitat
Aquatic Habitat/Fisheries/Wildlife
Eagle Lake Property Owners’ Association will continue to interact with staff at MNR to see if, following recent investigations, stocking of Lake Trout can be resumed. Rehabilitation of the potential spawning sites identified at the north end of the lake might also be given consideration. MNR will also ensure that Eagle Lake remains on the list of lakes that should be considered for lake trout habitat rehabilitation.*
Resume Purple Loosestrife manual removal and perhaps release of the Neogalerucella species of beetles, particularly at the Oconto Creek site where major regrowth of this plant has occurred. These beetles were released at this site in 2005 with much success*.
Arrange for a second phase of drone mapping of the lower sections of Eagle Creek to assist with fish and wildlife habitat improvement (and other initiatives).*
Educate waterfront property owners about: 1) fish habitat requirements, spawning timing and near-shore and in-water activities that can disturb or destroy fish habitat and spawning sites 2) the causes of excessive algae and aquatic vegetation growth (see the RVCA publication entitled Algae and Aquatic Plant Educational Manual) and 3) healthy lake ecosystems and associated water level fluctuations in a natural environment.
Eagle Lake Property Owners’ Association Leadership
Lake Planning
Eagle Lake Property Owners' Association is leading the coordination of the implementation of the recommendations of the State of the Lake Report - Eagle Lake Update 2015.
Use the information contained in the Tay River Subwatershed Report 2017 and Eagle Lake Catchment Report 2017 to assist with implementation of the State of the Lake Report - Eagle Lake Update 2015.
Water Levels
Possible better control of lake water levels on Eagle Lake by installing beaver bafflers at two additional and extensive beaver dams on Eagle Creek. A meeting has been arranged with a representative of Ducks Unlimited for advice on beaver bafflers. Additional meetings should be arranged to discuss beaver bafflers with board members of the Greater Bobs and Crow Lakes Association, since a rehabilitated walleye spawning bed is located where Eagle Creek empties into Bobs Lake.*
 Figure 1 Land cover in the Eagle Lake catchment
 on Leggat Lake, 2006-2017")
 on Leggat Lake, 2006-2017")
 on Leggat Lake, 2006-2017")
 on Leggat Lake, 2006-2017")


 on Leggat Lake, 2006-2017.")
 on Leggat Lake, 2006-2017")

 on Eagle Lake, 2006-2017")
 on Eagle Lake, 2006-2017")
 on Eagle Lake, 2006-2017")
 on Eagle Lake, 2006-2017")


 on Eagle Lake, 2006-2017")
 on Eagle Lake, 2006-2017.")

 on Eagle Lake, 2006-2017")


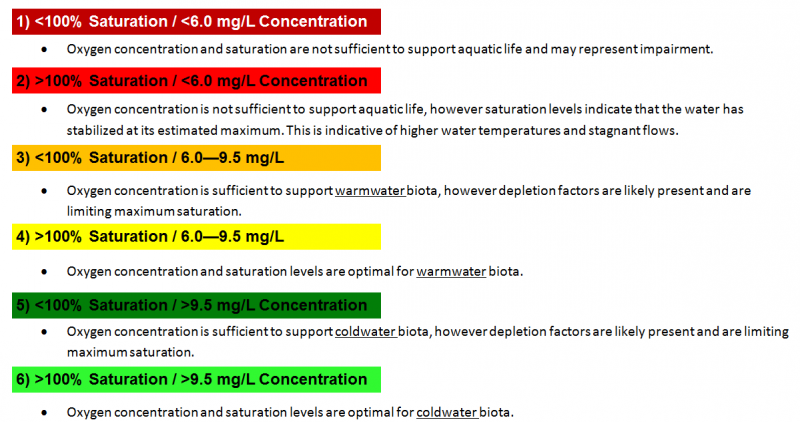
 and saturation (%) in Eagle Creek")


")

")
")

