Open menu

Rudsdale Creek

Rudsdale Creek

rudsdale creek

Tay River Subwatershed Report 2017

RUDSDALE CREEK CATCHMENT

LandCoverTay-RiverRudsdale-001-001Figure 1 Land cover in the Rudsdale Creek catchment

The RVCA produces individual reports for 14 catchments in the Tay River subwatershed. Using data collected and analyzed by the RVCA through its watershed monitoring and land cover classification programs, surface water quality and in-stream conditions are reported for the Tay River, Tay Watershed lakes and Tay tributaries along with a summary of environmental conditions for the surrounding countryside every six years, which includes analysis of data collected through the programs along with local information provided by stakeholders up to 2017.

This information is used to better understand the effects of human activity on our water resources, allows us to better track environmental change over time and helps focus watershed management actions where they are needed the most to help sustain the ecosystem services (cultural, aesthetic and recreational values; provisioning of food, fuel and clean water; regulation of erosion/natural hazard protection and water purification; supporting nutrient/water cycling and habitat provision) provided by the catchment’s lands and forests and waters (Millennium Ecosystem Assessment 2005).

The following sections of this report are a compilation of that work for the Rudsdale Creek catchment.

Table of Contents: Rudsdale Creek Catchment Report
Catchment Facts Section 1.0
Water Quality Conditions Section 2.0
Riparian Conditions Section 3.0
Land Cover Section 4.0
Stewardship and Water Resources Protection Section 5.0
Accomplishments Section 6.0
Challenges/Issues Section 7.0
Actions/Opportunities Section 8.0

For other Tay River catchments and the Tay River Subwatershed Report, please see Rideau Valley Conservation Authority Subwatershed Reports.

1.0 Rudsdale Creek Catchment: Facts

1.1 General/Physical Geography

Tay Valley Township: (62 km2; 100% of catchment)

Geology/Physiography

The Rudsdale Creek Catchment resides within part of the physiographic region known as the Algonquin Highlands.  In the Tay River Subwatershed, this ancient and hilly geologic region is made up of such Precambrian rocks as marble, conglomerates, and dark or colour banded granite-like rocks. An area of younger sandstone is located within the southern section of the catchment. A veneer of glacial drift (glacial till, sand etc.) overlies the bedrock except in the southern part of the catchment where bedrock is overlain by larger expanses of glacial till and clay. A geologic fault may run through the eastern section of the catchment.

Drainage Area

62 square kilometers:occupies 7.8 percent of the Tay River subwatershed and 1.5 percent of the Rideau Valley watershed.

Stream Length

All tributaries (including headwater streams): 132.7 kilometres

1.2 Vulnerable Areas

Aquifer Vulnerability

The Mississippi-Rideau Source Water Protection Program has mapped the southern part of this catchment as a Significant Groundwater Recharge Area (SGRA) and all of the catchment as a Highly Vulnerable Aquifer (HVA). There are no Well-Head Protection Areas in the catchment.

Wetland Hydrology

A watershed model developed by the RVCA in 2009 was used to study the hydrologic function of wetlands in the Rideau Valley Watershed, including those found in the Rudsdale Creek catchment.

1.3 Conditions at a Glance

Aggregates

Four aggregate licenses in the Rudsdale Creek catchment along with some sand and gravel areas of secondary and tertiary significance.

Fish Community/Thermal Regime

Warm and cool water recreational and baitfish fishery with 23 species observed in Rudsdale Creek during 2017.

Headwater Drainage Features

Primary classified as wetland and natural features with minimal modifications.  

Instream/Riparian Habitat

Rudsdale Creek: Low to high habitat complexity was identified for Rudsdale Creek. Regions with increased habitat complexity were observed in the lower reaches of the system within the catchment. Rudsdale Creek has a healthy diversity of plant types and levels throughout most of the surveyed sections; however there were areas with extensive vegetation which can have an impact on oxygen levels. Dissolved oxygen conditions along Rudsdale Creek varied along the system with sections in the lower reaches below levels to support aquatic life as well as areas in its upper reaches that support warm and cool water species .

Land Cover Change - Rudsdale Creek Catchment (2008 to 2014)
Catchment Crop-Pasture Woodland Meadow-Thicket Settlement Aggregate Wetland
Hectares -4 -3 -3 +5 +2 +2
Land Cover Type - Rudsdale Creek Catchment (2014)
Catchment Woodland Crop-Pasture Wetland Settlement Meadow-Thicket Transportation Water Aggregate
Percent 47 26 16 4 3 3 1 <1
Shoreline Cover Type (30 m. riparian area; 2014)
Catchment-Wide Percent Rudsdale Creek Percent Streams* Percent
Wetland 39 Wetland 59 Woodland 40
Woodland 37 Woodland 18 Wetland 35
Crop-Pasture 18 Crop-Pasture 13 Crop-Pasture 20
Transportation 2 Meadow-Thicket 5 Transportation 2
Meadow-Thicket 2 Transportation 3 Settlement 2
Settlement 2 Settlement 2 Meadow-Thicket 1
Aggregate <1 --- --- --- ---
*Excludes Rudsdale Creek

Significant Natural Features

N/A

Species at Risk (Elemental Occurrence)
Status Species at Risk
Threatened Blanding's Turtle Bobolink Eastern Meadowlark Least Bittern
 
Water Quality for the Protection of Aquatic Life
Water Quality Source Rudsdale Creek
Surface Chemistry Fair to Good
Instream Biological Poor


Rudsdale Creek: Benthic invertebrate samples are dominated by species that are tolerant to high organic pollution levels at the Lanark County Road 6 monitoring location.

Water Wells

Approximately 345 operational, private water wells are to be found in the Rudsdale Creek catchment. Groundwater uses are mainly domestic but also include industrial, livestock and public water supplies. 

Wetland Cover

Wetlands are reported to have covered 33 percent of the Rudsdale Creek catchment prior to European settlement, as compared to 16 percent (or 10 square kilometres) of the area in 2014. This represents a 51 percent (or 10 square kilometre) loss of historic wetland cover. All are unevaluated and unregulated.

1.4 Catchment Care

Environmental Management

Rudsdale Creek and its tributaries are protected through the “alteration to waterways” provision of Ontario Regulation 174-06 (entitled “Development, Interference with Wetlands and Alterations to Shorelines and Watercourses”) that protects landowners and their property from natural hazards (flooding, fluctuating water table, unstable soils) associated with them.

Environmental Monitoring

Chemical surface (in-stream/lake) water quality collection by the RVCA since 2003 (see Section 2 of this report).

Benthic invertebrate (aquatic insect) surface (in-stream) water quality collection by the RVCA in Rudsdale Creek since 2003 (see Section 3.3.1 of this report).

Fish survey and stream characterization survey by the RVCA on Rudsdale Creek in 2016 taking measurements and recording observations on instream habitat, bank stability, other attributes and preparing a temperature profile (see Section 3 of this report).

Thirty-two drainage feature assessments were conducted by the RVCA in 2017 at road crossings in the catchment. The protocol measures zero, first and second order headwater drainage features and is a rapid assessment method characterizing the amount of water, sediment transport, and storage capacity within headwater drainage features. (see Section 3.4 of this report).

Classification of Rudsdale Creek catchment land cover classes using data acquired during the spring of 2008 and 2014 from colour aerial photography (see Section 4.1 of this report).

Provincial groundwater level and chemistry, air pressure and precipitation data is available from an MOE Provincial Groundwater Monitoring Network site located near Glen Tay (W083). Provincial groundwater chemistry information is also available from one Ontario Geological Survey well (#13-AG-002) in this catchment.

Stewardship

Twenty-one stewardship projects undertaken (see Section 5 of this report).

2.0 Rudsdale Creek Catchment: Water Quality Conditions

Surface water quality conditions in the Rudsdale Creek catchment are monitored by the Rideau Valley Conservation Authority's (RVCA) Baseline Water Quality Program. The baseline water quality program focuses on streams; data is collected for 22 parameters including nutrients (total phosphorus, total Kjeldahl nitrogen and ammonia), E. coli, metals (like aluminum and copper) and additional chemical/physical parameters (such as alkalinity, chlorides, pH and total suspended solids). Figure 2 shows the locations of monitoring sites in the catchment.

Figure 2 Water quality monitoring sites on the Rudsdale Creek in the Rudsdale Creek Catchment
Figure 2 Water quality monitoring sites on the Rudsdale Creek in the Rudsdale Creek Catchment
 

2.1 Rudsdale Creek: Water Quality Rating

There is one monitored water quality site on Rudsdale Creek in the Rudsdale Creek Catchment (RUD-01). The RVCA's water quality rating for it ranges from “Fair to Good” (Table 1) as determined by the Canadian Council of Ministers of the Environment (CCME) Water Quality Index.

A “Fair” rating indicates that water quality is usually protected but is occasionally threatened or impaired; conditions sometimes depart from natural or desirable levels. A rating of "Good" indicates that only a minor degree of threat or impairment is observed and conditions rarely depart from natural or desirable levels.

Each parameter is evaluated against established guidelines to determine water quality conditions. Those parameters that frequently exceed guidelines are presented below.

Data has been analyzed over the 2006-2017 period for general trends and conditions. Table 1 shows the overall rating for the monitored surface water quality sites within the catchment and Table 2 outlines the Water Quality Index (WQI) scores and their corresponding ratings.

Table 1 Water Quality Index ratings for the Rudsdale Creek Catchment
SiteLocation 2006-20082009-20112012-20142015-2017
Table 2 Water Quality Index ratings and corresponding index scores (RVCA terminology, original WQI category names in brackets)
RatingIndex Score
Very Good (Excellent)95-100
Good80-94
Fair65-79
Poor (Marginal)45-64


2.1.1 Rudsdale Creek: Nutrients

Total phosphorus (TP) is used as a primary indicator of excessive nutrient loading and may contribute to abundant aquatic vegetation growth and depleted dissolved oxygen levels. The Provincial Water Quality Objective (PWQO) is used as the TP Guideline and states that in streams concentrations greater than 0.030 mg/l indicate an excessive amount of TP.

Total Kjeldahl nitrogen (TKN) is used as a secondary indicator of nutrient loading. RVCA uses a guideline of 0.500 mg/l to assess TKN[1]  concentrations in the Jock River.

Tables 3 and 4 summarize average nutrient concentrations at monitored sites within the Rudsdale Creek catchment and show the proportion of results that meet the guidelines.

Table 3 Summary of total phosphorus results for the Rudsdale Creek catchment from 2006-2017 (Highlighted values indicate average concentrations exceed the guideline)
Total Phosphorus 2006-2017
SiteAverage (mg/l)Below GuidelineNo. Samples
Table 4 Summary of total Kjeldahl nitrogen results for the Rudsdale Creek catchment from 2006-2017 (Highlighted values indicate average concentrations exceed the guideline)
Total Kjeldahl nitrogen 2006-2017
SiteAverage (mg/l)Below GuidelineNo. Samples


Monitoring Site RUD-01

Elevated TP results occurred regularly at site RUD-01 throughout the monitoring period; 46% of samples were below the guideline (Figure 4). Average concentrations exceeded the guideline during the summer months, with lower concentrations (below guideline) observed in April and November (Figure 3). The average TP concentration was just above the guideline of 0.030 mg/l at 0.032 mg/l (Table 3). 

The majority of TKN results have also exceeded the guideline (Figure 6); only 10 percent of samples were below the guideline. The average concentration was 0.835 mg/l and exceeded the guideline of 0.500 mg/l (Table 4). Average monthly data showed a similar pattern to TP results, with the highest concentrations observed during the summer months, and lower concentrations in April and November (Figure 5).

There was no significant change[2] in the sampled concentrations of TP or TKN at this site over the 2006-2017 period (Figures 4 and 6).

Figure 3  Average monthly total phosphorus concentrations in Rudsdale Creek, 2006-2017.
Figure 3  Average monthly total phosphorus concentrations in Rudsdale Creek, 2006-2017.
Figure 4  Distribution of total phosphorus concentrations in Stubb Creek, 2006-2017.
Figure 4  Distribution of total phosphorus concentrations in Rudsdale Creek, 2006-2017.
 
Figure 5  Average monthly total Kjeldahl nitrogen concentrations in Rudsdale Creek, 2006-2017.
Figure 5  Average monthly total Kjeldahl nitrogen concentrations in Rudsdale Creek, 2006-2017.
Figure 6  Distribution of total Kjeldahl nitrogen concentrations in Rudsdale Creek, 2006-2017
Figure 6  Distribution of total Kjeldahl nitrogen concentrations in Rudsdale Creek, 2006-2017
Summary of Rudsdale Creek Nutrients

Results of  the monitored site on Rudsdale Creek shows that nutrient enrichment is a feature of this creek.  Elevated nutrients may result in nutrient loading downstream and to the Tay River. High nutrient concentrations can help stimulate the growth of algae blooms and other aquatic vegetation in a waterbody and deplete oxygen levels as the vegetation dies off.  It should be noted that this creek is fed by extensive wetlands; this wetland complex is naturally nutrient rich and is likely a notable contributor to naturally elevated nutrient conditions. Development in this area is also minimal but there is a large portion of agricultural land; best management practices such as minimizing storm water runoff, enhanced shoreline buffers, minimizing/discontinuing the use of fertilizers and restricting livestock access in both surrounding agricultural and developed areas can help to reduce additional nutrient enrichment within this creek.  

2.1.2 Rudsdale Creek E. coli

Escherichia coli (E. coli) is used as an indicator of bacterial pollution from human or animal waste; in elevated concentrations it can pose a risk to human health. The PWQO of 100 colony forming units/100 millilitres (CFU/100 ml) is used as a guideline. E. coli counts greater than this guideline indicate that bacterial contamination may be a problem within a waterbody.

Table 5 summarizes the geometric mean[3] for the monitored site on Rudsdale Creek and shows the proportion of samples that meet the E. coli guideline of 100 CFU/100 ml. The results of the geometric mean with respect to the guideline for the 2006-2017 period are shown in Figures 7 and 8.

Table 5 Summary of E. coli results for Rudsdale Creek from 2006-2017
E. coli 2012-2017
SiteGeometric Mean (CFU/100ml)Below GuidelineNo. Samples
Monitoring Site RUD-01

E. coli counts at site RUD-01 show that there has been no significant trend in bacterial counts (Figure 8). The count at the geometric mean was 56 CFU/100ml (Table 5), and majority of results (68 percent) were below the E. coli guideline.  Figure 7 shows that counts are generally highest in late summer (August); this can likely be attributed to warm weather and reduced flow conditions.

Figure 7  Geometric mean of monthly E. coli counts in Rudsdale Creek, 2006-2017
Figure 7  Geometric mean of monthly E. coli counts in Rudsdale Creek, 2006-2017
Figure 8  Distribution of E. coli counts in Rudsdale Creek, 2006-2017
Figure 8  Distribution of E. coli counts in Rudsdale Creek, 2006-2017
 
Summary of Rudsdale Creek Bacterial Contamination

Bacterial contamination does not appear to be a significant concern in Rudsdale Creek.  As indicated by Figure 8 occasional exceedances above the guideline of 100 CFU/100ml have been observed. Best management practices such as enhancing shoreline buffers, limiting livestock access and minimizing runoff in both rural and developed areas can help to protect Rudsdale Creek into the future.


2.1.3 Rudsdale Creek: Metals

Of the metals routinely monitored in Rudsdale Creek, iron (Fe) occasionally reported concentrations above its respective Provincial Water Quality Objective of 0.300 mg/l.  In elevated concentrations, this metal can have toxic effects on sensitive aquatic species.

Table 6 summarizes Fe concentrations within the creek as well as show the proportion of samples that meet guidelines. Figures 9 and 10 show Fe concentrations with respect to the guidelines for the monitoring period, 2006-2017. 

Table 6 Summary of iron results in Rudsdale Creek from 2006-2017 (Highlighted values indicate average concentrations exceed the guideline)
Iron 2006-2017
SiteAverage (mg/l)Below GuidelineNo. Samples
Monitoring Site RUD-01

The average Fe concentrations in site RUD-01 was 0.503 mg/l and exceeded the guideline (PWQO). Forty-three percent of samples were below the guideline and there was no significant change in Fe concentrations across the monitoring period (Table 6, Figure 10).  Monthly concentrations were elevated through the summer months (Figure 9).

Figure 9  Average monthly iron concentrations in Rudsdale Creek, 2006-2017.
Figure 9  Average monthly iron concentrations in Rudsdale Creek, 2006-2017.
Figure 10  Distribution of iron concentrations in Rudsdale Creek, 2006-2017.
Figure 10  Distribution of iron concentrations in Rudsdale Creek, 2006-2017.
 
Summary of Rudsdale Creek Metals

In Rudsdale Creek there is evidence of increased metal concentration above respective guidelines, it is quite likely that they are naturally occurring from groundwater inputs. Even so, continued efforts should be made to protect against possible pollution sources and implement best management practices to reduce any inputs such as storm water runoff from hardened surfaces to improve overall stream health and lessen downstream impacts. 


1 No Ontario guideline for TKN is presently available; however, waters not influenced by excessive organic inputs typically range from 0.100 to 0.500 mg/l, Environment Canada (1979) Water Quality Sourcebook, A Guide to Water Quality Parameters, Inland Waters Directorate, Water Quality Branch, Ottawa, Canada.

2 Trends in the data were assessed using the Mann-Kendall trend test and Sens slope statistic.

3 A type of mean or average, which indicates the central tendency or typical value of a set of numbers by using the product of their values (as opposed to the arithmetic mean which uses their sum). It is often used to summarize a variable that varies over several orders of magnitude, such as E. coli counts.

 3.0 Rudsdale Creek Catchment: Riparian Conditions

The Stream Characterization Program evaluated 3.3 km of Rudsdale Creek in 2016.  A total of 33 stream survey assessments were completed in the middle of June and July. 

During the summer and fall of 2016, the Rideau Valley watershed experienced periods of severe drought. Precipitation levels were measured at less than 40% of the long-term average, as the water supply was unable to meet local demand. The lack of rainfall affected the success and function of farm crops, municipal and private wells, lawns and gardens, navigation and ultimately the health of our lakes, rivers and streams.

Low water conditions were readily observed throughout the watershed, as many of the streams were highly fragmented or completely dry. Aquatic species such as amphibians, fish and macro invertebrates were affected, as suitable habitat may have been limited. Fragmentation of habitat was observed in certain sections along Rudsdale Creek during the drought conditions in 2016.

Rudsdale Creek at Christie Lake Road during the drought in the Fall of 2016
 

3.1 Rudsdale Creek Overbank Zone

3.1.1 Riparian Buffer Evaluation

The quality of the riparian area increases with the width, complexity and linear extent of its vegetation along a stream or creek. A complex riparian community consists of diverse plant species native to the site, with multiple age-classes providing vertical structural diversity along a watercourse.

Here is a list of watershed benefits from a healthy riparian buffer zone:

  • Reduces the amount of pollutants that reach the stream from surface runoff
  • Helps reduce and mitigates erosion
  • Provides a microclimate that is cooler during the summer months providing cooler water for aquatic organisms
  • Provides large wood structure from fallen trees and limbs that form instream cover, create pools, stabilize the streambed, and provide habitat for aquatic organisms
  • Provides organic material for stream biota that, among other functions, is the base of the food chain in lower order streams
  • Provides habitat for terrestrial insects that drop in the stream and become food for fish and travel corridors for other terrestrial animals
  • Dissipates energy during flood events
  • Often provides the only refuge areas for fish during out-of-bank flows (behind trees, stumps, and logs)

Figure 11 demonstrates the buffer conditions of the left and right banks separately.  Rudsdale Creek had a buffer of greater than 30 meters along 93 percent of the left bank and 89 percent of the right bank.   

Figure 11 Riparian Buffer Evaluation along Rudsdale Creek  
 

3.1.2 Riparian Buffer Alterations

Alterations within the riparian buffer were assessed within three distinct shoreline zones (0-5m, 5-15m, 15-30m), and evaluated based on the dominant vegetative community and/or land cover type (Figure 12). The riparian buffer zone along Rudsdale Creek was found to be dominated by scrubland, forest and wetland conditions.  There were two areas that had altered riparian zone conditions along the watercourse.

Figure 12 Riparian buffer alterations along Rudsdale Creek
 

3.1.3 Adjacent Land Use

The RVCA’s Stream Characterization Program identifies six different land uses along Rudsdale Creek (Figure 13). Surrounding land use is considered from the beginning to end of the survey section (100m) and up to 100m on each side of the river. Land use outside of this area is not considered for the surveys but is nonetheless part of the subwatershed and will influence the creek.  Scrubland habitat was dominant at 88 percent; wetland habitat was observed in the adjacent lands along Rudsdale Creek at 58 percent of the surveyed sections, 45 percent forest and 15 percent meadow habitat.  The remaining land use consisted of industrial/commercial and infrastructure in the form of reduced shoreline buffer areas and road crossings.

Figure 13 Land Use along Rudsdale Creek


3.2 Rudsdale Creek Shoreline Zone

3.2.1 Instream Erosion

Stream erosion is the process by which water erodes and transports sediments, resulting in dynamic flows and diverse habitat conditions.  Excessive erosion can result in drastic environmental changes, as habitat conditions, water quality and aquatic life are all negatively affected.  Bank stability was assessed as the overall extent of each section with “unstable” shoreline conditions.  These conditions are defined by the presence of significant exposed soils/roots, minimal bank vegetation, severe undercutting, slumping or scour and potential failed erosion measures. The majority of Rudsdale Creek had no erosion observed along the surveyed sections with two reaches having low to moderate levels of erosion in the middle to lower reach (Figure 14).

Figure 14 Erosion levels along Rudsdale Creek
 

3.2.2 Undercut Stream Banks

Stream bank undercuts can provide excellent cover habitat for aquatic life, however excessive levels can be an indication of unstable shoreline conditions.  Bank undercut was assessed as the overall extent of each surveyed section with overhanging bank cover present.   Figure 15 shows that Rudsdale Creek had no observed undercut banks along the majority of the system, however there were several sections in the middle to lower reaches with low levels of undercut banks.

Figure 15 Undercut stream banks along Rudsdale Creek
 

3.2.3 Stream Shading

Grasses, shrubs and trees all contribute towards shading a stream. Shade is important in moderating stream temperature, contributing to food supply and helping with nutrient reduction within a stream.  Stream cover is assessed as the total coverage area in each section that is shaded by overhanging trees/grasses and tree canopy, at greater than 1m above the water surface.  Figure 16 shows low levels of stream shading along the majority of Rudsdale Creek in the upper reaches, which is consistent with wide open water wetland habitat conditions.  There were several sections in the lower reaches, where the channel narrows, that had high to moderate levels of stream shading along the creek.  

Figure 16 Stream shading along Rudsdale Creek
 

3.2.4 Instream Wood Structure

Forested shorelines provide essential complex habitat through the perpetual process of shoreline trees falling into the water.  This continuous recruitment of trees creates a wood-based physical structure in the littoral zone that is common on natural systems.  Insects, fish, amphibians, birds, and other animals have also evolved with this abundance of near shore wood and it is essential to their life cycles. With increased development along many waterways, forested lakeshores have been altered and wood-based physical structure in many waterways has been reduced. It is important to restore this essential habitat to aquatic ecosystems.

Shoreline Protection
  • Protects shorelines by providing a barrier from wind and wave erosion
  • Reduces sedimentation of the water caused by shoreline slumping due to bank erosion
  • Allows detritus to collect and settle on the lake or creek bed providing the substrate structure required for native aquatic vegetation to establish and outcompete invasive species
Food Source
  • Wood complexes are an important food source for invertebrates 
  • Small fish feed on the abundance of invertebrates that are found around these structures
  • Larger fish, waterfowl and shorebirds all benefit from the abundance of invertebrates and small fish feeding around woody structures in the littoral zone 
Cover
  • Cover from predators is essential for many fish and animals to successfully complete their life cycle
  • The nooks and crannies of wood complexes offer critters safety from predators while at the same time concentrating prey to make predators more efficient
  • Wood provides the structure on which many species must lay or attach their eggs, therefore these complexes provide quality spawning and nesting habitat
Diversity
  • Wood complexes in the littoral zone provide unique edge habitat along the shoreline
  • Edge habitats contain more species diversity and higher concentrations of species than the adjoining habitats themselves will have

Figure 17 shows that the majority of Rudsdale Creek had low levels along the majority of the system with one location in the upper reaches having high levels of instream wood structure in the form of branches and trees along the system.  

Figure 17 Instream wood structure along Rudsdale Creek
 

3.2.5 Overhanging Wood Structure

Trees and branches that are less than one meter from the surface of the water are defined as overhanging.  Wood structure provides a food source, nutrients and shade which helps to moderate instream water temperatures.  Figure 18 shows the system is highly variable with no overhanging branches and trees where the system is wide and is dominated by wetland habitat to an area in the lower reach that has high levels of overhanging wood structure along Rudsdale Creek.

Figure 18 Overhanging wood structure along Rudsdale Creek
 

3.2.6 Anthropogenic Alterations

Stream alterations are classified based on specific functional criteria associated with the flow conditions, the riparian buffer and potential human influences.  Figure 19 shows nine percent of Rudsdale Creek remains “unaltered” with no anthropogenic alterations.   Seventy three percent of Rudsdale Creek was classified as natural with minor anthropogenic changes while eighteen percent was considered altered.  The alterations along Rudsdale Creek were in the form of buffer/shoreline modifications and road crossings.  There were no sections that were classified as being highly altered.

Figure 19 Anthropogenic alterations along Rudsdale Creek


3.3 Rudsdale Creek Instream Aquatic Habitat

3.3.1 Benthic Invertebrates

Freshwater benthic invertebrates are animals without backbones that live on the stream bottom and include crustaceans such as crayfish, molluscs and immature forms of aquatic insects. Benthos represent an extremely diverse group of aquatic animals and exhibit wide ranges of responses to stressors such as organic pollutants, sediments and toxicants, which allows scientists to use them as bioindicators.  As part of the Ontario Benthic Biomonitoring Network (OBBN), the RVCA has been collecting benthic invertebrates at the County Road 6 site since 2003.  Monitoring data is analyzed for each sample site and the results are presented using the Family Biotic Index, Family Richness and percent Ephemeroptera, Plecoptera and Trichoptera.

Hilsenhoff Family Biotic Index

The Hilsenhoff Family Biotic Index (FBI) is an indicator of organic and nutrient pollution and provides an estimate of water quality conditions for each site using established pollution tolerance values for benthic invertebrates. FBI results for the Rudsdale Creek catchment at the County Road 6 sample location is summarized by year.  “Fair” to “Poor” water quality conditions were observed at the Rudsdale Creek sample location (Figure 20) using a grading scheme developed by Conservation Authorities in Ontario for benthic invertebrates.

Figure 20 Hilsenhoff Family Biotic Index at the County Road 6 sample location
 
Family Richness

Family Richness measures the health of the community through its diversity and increases with increasing habitat diversity suitability and healthy water quality conditions. Family Richness is equivalent to the total number of benthic invertebrate families found within a sample.   The County Road 6 location is reported to have “Fair” family richness (Figure 21).

Figure 21 Family Richness on Rudsdale Creek at the County Road 6 sample location
 
EPT

Ephemeroptera (Mayflies), Plecoptera (Stoneflies), and Trichoptera (Caddisflies) are species considered to be very sensitive to poor water quality conditions. High abundance of these organisms is generally an indication of good water quality conditions at a sample location.  The community structure is typically dominated by species that are tolerant to poorer water quality conditions at the Rudsdale Creek sample location.  As a result, the EPT indicates that the Rudsdale Creek sample location is reported to have “Poor” water quality (Figure 22) during the reporting periods.

Figure 22 EPT on Rudsdale Creek at the County Road 6 sample location
 
Conclusion

Overall the Rudsdale Creek sample location at County Road 6 aquatic habitat conditions from a benthic invertebrate perspective are considered “Poor” as the samples are dominated with species that are tolerant to high organic pollution levels.

3.3.2 Habitat Complexity

Habitat complexity is a measure of the overall diversity of habitat types and features within a stream. Streams with high habitat complexity support a greater variety of species niches, and therefore contribute to greater diversity. Factors such as substrate, flow conditions (pools, riffles) and cover material (vegetation, wood structure, etc.) all provide crucial habitat to aquatic life.  Habitat complexity is assessed based on the presence of boulder, cobble and gravel substrates, as well as the presence of instream woody material.

Low to high habitat complexity was identified for Rudsdale Creek (Figure 23). Regions with increased habitat complexity were observed in the lower reaches of the system within the catchment.  

Figure 23 Habitat complexity along Rudsdale Creek
 

3.3.3 Instream Substrate

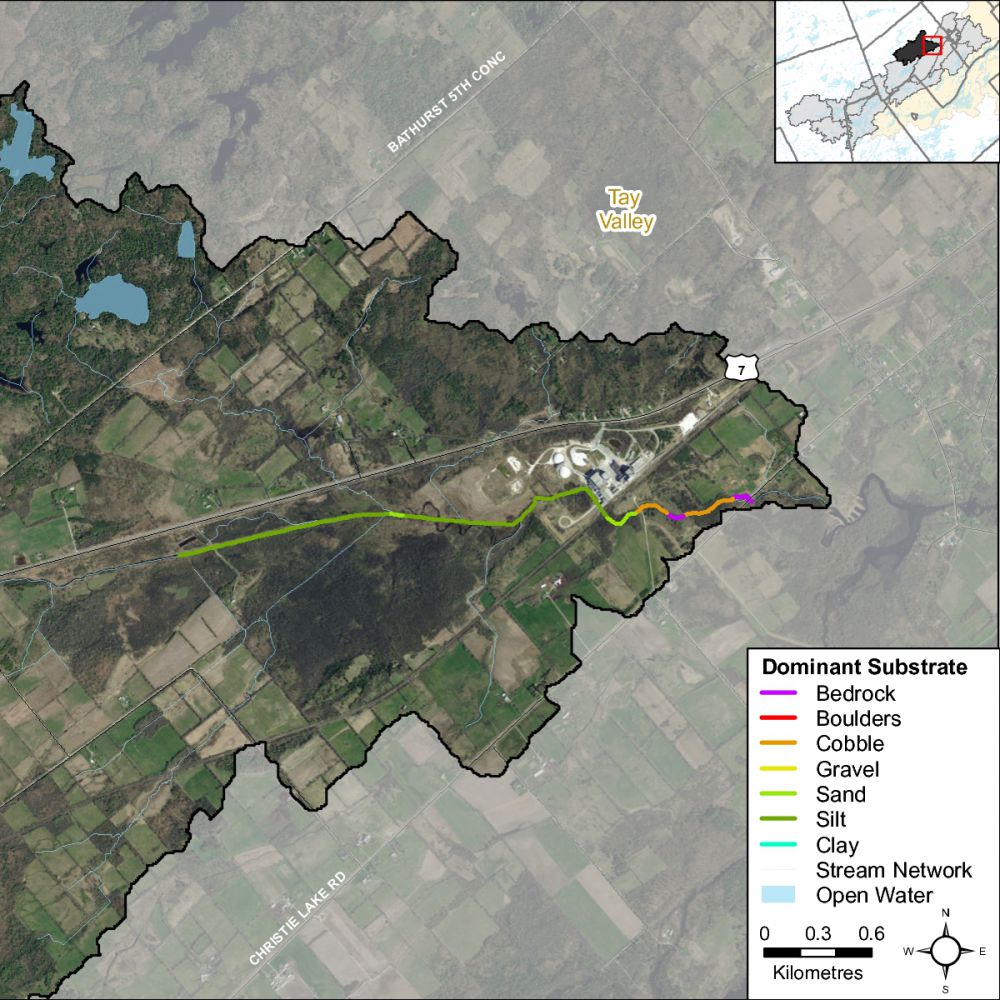
Diverse substrate is important for fish and benthic invertebrate habitat because some species have specific substrate requirements and for example will only reproduce on certain types of substrate.  The absence of diverse substrate types may limit the overall diversity of species within a stream. Figure 24 shows the overall presence of various substrate types observed along Rudsdale Creek.  Substrate conditions were highly diverse along Rudsdale Creek with all substrate types being recorded at various locations along the creek.  Figure 25 shows the dominant substrate type observed for each section surveyed along Rudsdale Creek.

 
Figure 24 Instream substrate along Rudsdale Creek
 
Figure 25 shows the dominant substrate type along Rudsdale Creek
 

3.3.4 Instream Morphology

Pools and riffles are important habitat features for aquatic life.  Riffles are fast flowing areas characterized by agitation and overturn of the water surface. Riffles thereby play a crucial role in contributing to dissolved oxygen conditions and directly support spawning for some fish species.  They are also areas that support high benthic invertebrate populations which are an important food source for many aquatic species.  Pools are characterized by minimal flows, with relatively deep water and winter/summer refuge habitat for aquatic species.  Runs are moderately shallow, with unagitated surfaces of water and areas where the thalweg (deepest part of the channel) is in the center of the channel. Figure 26 shows that Rudsdale Creek is highly variable; 100 percent of sections recorded runs, 58 percent pools and 21 percent riffles. Figure 27 shows where the riffle habitat areas were observed along Rudsdale Creek.

Figure 26 Instream morphology along Rudsdale Creek
 
 Figure 27 Instream riffle habitat along Rudsdale Creek
 

3.3.5 Vegetation Type

Instream vegetation provides a variety of functions and is a critical component of the aquatic ecosystem.  Aquatic plants promote stream health by:

  • Providing direct riparian/instream habitat
  • Stabilizing flows reducing shoreline erosion
  • Contributing to dissolved oxygen through photosynthesis
  • Maintaining temperature conditions through shading

For example emergent plants along the shoreline can provide shoreline protection from wave action and important rearing habitat for species of waterfowl.  Submerged plants provide habitat for fish to find shelter from predator fish while they feed.  Floating plants such as water lilies shade the water and can keep temperatures cool while reducing algae growth.  Submerged and floating plants plants were present in 94 percent of the survey sections, 70 percent of sections contained algae, narrow leaved emergents were observed in 67 percent of sections, 61 percent free floating plants, 15 percent broad leaved emergents and robust emergents were observed in 12 percent of sections surveyed.  Figure 28 depicts the plant community structure for Rudsdale Creek. Figure 29 shows the dominant vegetation type observed for each section surveyed along Rudsdale Creek.

Figure 28 Vegetation type along Rudsdale Creek
 
Figure 29 Dominant vegetation type along Rudsdale Creek


3.3.6 Instream Vegetation Abundance

Instream vegetation is an important factor for a healthy stream ecosystem. Vegetation helps to remove contaminants from the water, contributes oxygen to the stream, and provides habitat for fish and wildlife. Too much vegetation can also be detrimental. Figure 30 demonstrates that Rudsdale Creek reach had normal to common levels of vegetation recorded at 24 and 70 percent of stream surveys.  Extensive levels of vegetation were observed in 82 percent of the surveyed sections and were consistent with areas dominated by the invasive aquatic plant known as European frogbit; while six percent of sections had no vegetation.

Figure 30 Instream vegetation abundance along Rudsdale Creek
 

3.3.7 Invasive Species

Invasive species can have major implications on streams and species diversity. Invasive species are one of the largest threats to ecosystems throughout Ontario and can out compete native species, having negative effects on local wildlife, fish and plant populations. One hundred percent of the sections surveyed along Rudsdale Creek reach had invasive species. The invasive species observed in Rudsdale Creek were European frogbit, Himalayan balsam, purple loosestrife and Manitoba maple.  Invasive species abundance (i.e. the number of observed invasive species per section) was assessed to determine the potential range/vector of many of these species (Figure 31).

Figure 31 Invasive species abundance along Rudsdale Creek
 
A section of Rudsdale Creek with the invasive European Frogbit


3.3.8 Water Chemistry

During the stream characterization survey, a YSI probe is used to collect water chemistry information.  Dissolved oxygen (DO), specific conductivity (SPC) and pH are measured at the start and end of each section. 

3.3.8.1 Dissolved Oxygen

Dissolved oxygen is a measure of the amount of oxygen dissolved in water. The Canadian Environmental Quality Guidelines of the Canadian Council of Ministers of the Environment (CCME) suggest that for the protection of aquatic life the lowest acceptable dissolved oxygen concentration should be 6 mg/L for warmwater biota and 9.5 mg/L for coldwater biota (CCME, 1999).  Figure 32 shows that the dissolved oxygen in Rudsdale Creek supports warmwater and in certain locations coldwater biota along the system.  The average dissolved oxygen level observed within Rudsdale Creek was 4.4mg/L which is below the recommended level for warmwater biota.  The upper reaches of Rudsdale Creek were within the threshold to support warmwater biota.

Figure 32 Dissolved oxygen ranges along Rudsdale Creek
 

3.3.8.2 Conductivity

Conductivity in streams is primarily influenced by the geology of the surrounding environment, but can vary drastically as a function of surface water runoff. Currently there are no CCME guideline standards for stream conductivity; however readings which are outside the normal range observed within the system are often an indication of unmitigated discharge and/or stormwater input. The average conductivity observed within the main stem of Rudsdale Creek was 462.3 µs/cm.  Figure 33 shows the conductivity readings for Rudsdale Creek.

Figure 33 Specific conductivity ranges in Rudsdale Creek
 

3.3.8.3 pH

Based on the PWQO for pH, a range of 6.5 to 8.5 should be maintained for the protection of aquatic life. Average pH values along Rudsdale Creek averaged 7.37 thereby meeting the provincial standard (Figure 34).

Figure 34 pH ranges along Rudsdale Creek
 

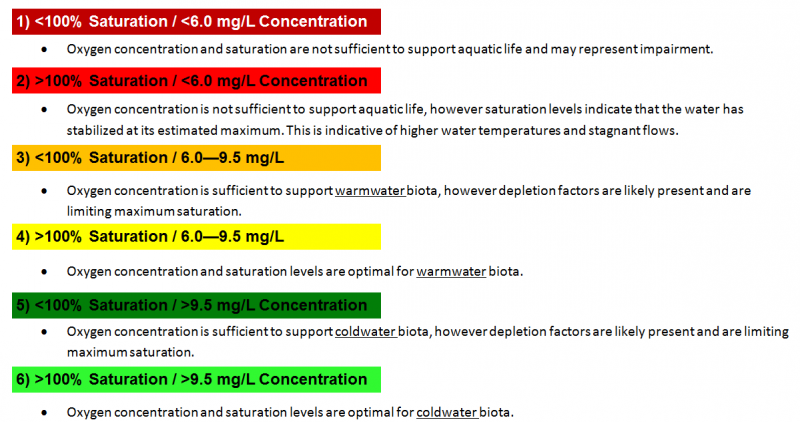
3.3.8.4 Oxygen Saturation (%)

Oxygen saturation is measured as the ratio of dissolved oxygen relative to the maximum amount of oxygen that will dissolve based on the temperature and atmospheric pressure. Well oxygenated water will stabilize at or above 100% saturation, however the presence of decaying matter/pollutants can drastically reduce these levels. Oxygen input through photosynthesis has the potential to increase saturation above 100% to a maximum of 500%, depending on the productivity level of the environment. In order to represent the relationship between concentration and saturation, the measured values have been summarized into 6 classes:


Dissolved oxygen conditions on Rudsdale Creek varied along the system for both warm and coolwater species (upper reach) (Figure 35).  Sections in the lower reaches fell below the guideline to support warmwater biota.

Figure 35 A bivariate assessment of dissolved oxygen concentration (mg/L) and saturation (%) in Rudsdale Creek
 

3.3.8.5 Specific Conductivity Assessment

Specific conductivity (SPC) is a standardized measure of electrical conductance, collected at or corrected to a water temperature of 25⁰C. SPC is directly related to the concentration of ions in water, and is commonly influenced by the presence of dissolved salts, alkalis, chlorides, sulfides and carbonate compounds. The higher the concentration of these compounds, the higher the conductivity. Common sources of elevated conductivity include storm water, agricultural inputs and commercial/industrial effluents.

In order to summarize the conditions observed, SPC levels were evaluated as either normal, moderately elevated or highly elevated. These categories correspond directly to the degree of variation (i.e. standard deviation) at each site relative to the average across the system.

Normal levels were maintained in the upper reaches of Rudsdale Creek, however there were moderately elevated areas in the middle and lower reaches (Figure 36).

Figure 36 Relative specific conductivity levels along Rudsdale Creek
 

3.3.9 Thermal Regime

Many factors can influence fluctuations in stream temperature, including springs, tributaries, precipitation runoff, discharge pipes and stream shading from riparian vegetation. Water temperature is used along with the maximum air temperature (using the Stoneman and Jones method) to classify a watercourse as either warm water, cool water or cold water. Figure 37 shows where the thermal sampling sites were located on Rudsdale Creek.  Analysis of the data collected indicates that Rudsdale Creek is classified as a cool water system with warm water lower reaches (Figure 38). 

Figure 37 Temperature logger locations along Rudsdale Creek
 
Figure 38 Temperature logger data for the sites on Rudsdale Creek 
 

Each point on the graph represents a temperature that meets the following criteria:

  • Sampling dates between July 1st and September 7th

  • Sampling date is preceded by two consecutive days above 24.5 °C, with no rain

  • Water temperatures are collected at 4pm

  • Air temperature is recorded as the max temperature for that day


3.3.10 Groundwater

Groundwater discharge areas can influence stream temperature, contribute nutrients, and provide important stream habitat for fish and other biota. During stream surveys, indicators of groundwater discharge are noted when observed. Indicators include: springs/seeps, watercress, iron staining, significant temperature change and rainbow mineral film.  Figure 39 shows areas where one or more of the above groundwater indicators were observed during stream surveys and headwater assessments. 

Figure 39 Groundwater indicators observed in the Rudsdale Creek catchment


3.3.11 Fish Community

The Rudsdale Creek catchment is classified as a mixed community of warm and cool water recreational and baitfish fishery with 23 species observed in 2016. Figure 40 shows the historical and 2016 fish sampling locations in the catchment.

Figure 40 Fish Community sampling observations for 2016


Table 7 lists the species observed in the watershed historically and during the 2016 sampling effort.

Table 7 Fish species observed in Rudsdale Creek
Fish SpeciesScientific NameFish codeHistorical2016
banded killifishFundulus diaphanusBaKilXX
blackchin shinerNotropis heterodonBcShiXX
blacknose daceRhinichthys atratulusBnDacXX
blacknose shinerNotropis heterolepisBnShiXX
bluntnose minnowPimephales notatusBnMinX
brassy minnowHybognathus hankinsoniBrMinXX
brook sticklebackCulaea inconstansBrStiXX
brown bullheadAmeiurus nebulosusBrBulXX
carps and minnowsCyprinidaeCA_MIXX
central mudminnowUmbra limiCeMudXX
central stonerollerCampostoma anomalumCeStoXX
common shinerLuxilus cornutusCoShiXX
sculpin familyCottus sp.CotSpX
creek chubSemotilus atromaculatusCrChuXX
etheostoma sp.etheostoma sp.EthSpX
fathead minnowPimephales promelasFhMinXX
golden shinerNotemigonus crysoleucasGoShiXX
hornyhead chubNocomis biguttatusHhChuXX
iowa darterEtheostoma exileIoDarX
longnose daceRhinichthys cataractaeLnDacX
northern pearl daceMargariscus nachtriebiPeDacX
northern redbelly daceChrosomus eosNRDacXX
pumpkinseedLepomis gibbosusPumpkXX
rock bassAmbloplites rupestrisRoBasX
smallmouth bassMicropterus dolomieuSmBasX
white suckerCatostomus commersoniiWhSucXX
TOTAL Species2123
RVCA electrosfishing site on Rudsdale Creek 
 
Iowa darter captured during the electrofishing sampling effort


3.3.12 Migratory Obstructions

It is important to know locations of migratory obstructions because these can prevent fish from accessing important spawning and rearing habitat. Migratory obstructions can be natural or manmade, and they can be permanent or seasonal. Figure 41 shows that Rudsdale Creek had no migration barriers at the time of the survey in 2016.  However, there were two perched culverts and one debris dam on headwater drainage features within the catchment.

Figure 41 Migratory obstructions in the Rudsdale Creek catchment
 

3.3.13 Beaver Dam Locations

Overall beaver dams create natural changes in the environment. Some of the benefits include providing habitat for wildlife, flood control, and silt retention. Additional benefits come from bacterial decomposition of woody material used in the dams which removes excess nutrient and toxins. Beaver dams can also result in flooding of agricultural lands and may be potential barriers to fish migration. Six beaver dams were identified along Rudsdale Creek in 2016 (Figure 42).   

Figure 42 Beaver Dam type and locations along Rudsdale Creek
 
Beaver Dam on Rudsdale Creek at the time of the survey in 2016
 

3.4 Headwater Drainage Feature Assessment

3.4.1 Headwaters Sampling Locations

The RVCA Stream Characterization program assessed Headwater Drainage Features for the Rudsdale Creek catchment in 2017. This protocol measures zero, first and second order headwater drainage features (HDF).  It is a rapid assessment method characterizing the amount of water, sediment transport, and storage capacity within headwater drainage features (HDF). RVCA is working with other Conservation Authorities and the Ministry of Natural Resources and Forestry to implement the protocol with the goal of providing standard datasets to support science development and monitoring of headwater drainage features.  An HDF is a depression in the land that conveys surface flow. Additionally, this module provides a means of characterizing the connectivity, form and unique features associated with each HDF (OSAP Protocol, 2013). In 2017 the program sampled 32 sites at road crossings in the Rudsdale Creek catchment area (Figure 43). 

Figure 43 Location of the headwater sampling sites in the Rudsdale Creek catchment


3.4.2 Headwater Feature Type

The headwater sampling protocol assesses the feature type in order to understand the function of each feature.  The evaluation includes the following classifications: defined natural channel, channelized or constrained, multi-thread, no defined feature, tiled, wetland, swale, roadside ditch and pond outlet.  By assessing the values associated with the headwater drainage features in the catchment area we can understand the ecosystem services that they provide to the watershed in the form of hydrology, sediment transport, and aquatic and terrestrial functions.  The headwater drainage features in the Rudsdale Creek catchment are highly variable they include natural, wetland, channelized, road side ditches and a multi thread feature.  Figure 44 shows the feature type of the primary feature at the sampling locations.

Figure 44 Headwater feature types in the Rudsdale Creek catchment
 

3.4.3 Headwater Feature Flow

The observed flow condition within headwater drainage features can be highly variable depending on timing relative to the spring freshet, recent rainfall, soil moisture, etc.  Flow conditions are assessed in the spring and in the summer to determine if features are perennial and flow year round, if they are intermittent and dry up during the summer months or if they are ephemeral systems that do not flow regularly and generally respond to specific rainstorm events or snowmelt.  Flow conditions in headwater systems can change from year to year depending on local precipitation patterns.  Figure 45 shows the observed flow condition at the sampling locations in the Rudsdale Creek catchment in 2017.

Figure 45 Headwater feature flow conditions in the Rudsdale Creek catchment
 
A spring photo of the headwater sample site in the Rudsdale Creek catchment located on Gambles Side Road
 
A summer photo of the headwater sample site in the Rudsdale Creek catchment located on Gambles Side Road
 

3.4.4 Feature Channel Modifications

Channel modifications were assessed at each headwater drainage feature sampling location.  Modifications include channelization, dredging, hardening and realignments.  The Rudsdale Creek catchment area had a majority of features with no channel modifications observed, five sites as having been historically dredged/channelized and one location had mixed modifications.  Figure 46 shows the channel modifications observed at the sampling locations for Rudsdale Creek.

 
Figure 46 Headwater feature channel modifications in the Rudsdale Creek catchment
 

3.4.5 Headwater Feature Vegetation

Headwater feature vegetation evaluates the type of vegetation that is found within the drainage feature.  The type of vegetated within the channel influences the aquatic and terrestrial ecosystem values that the feature provides.  For some types of headwater features the vegetation within the feature plays a very important role in flow and sediment movement and provides wildlife habitat.  The following classifications are evaluated no vegetation, lawn, wetland, meadow, scrubland and forest. Figure 47 depicts the dominant vegetation observed at the sampled headwater sites in the Rudsdale Creek catchment.

Figure 47 Headwater feature vegetation types in the Rudsdale Creek catchment
 

3.4.6 Headwater Feature Riparian Vegetation

Headwater riparian vegetation evaluates the type of vegetation that is found along the adjacent lands of a headwater drainage feature.  The type of vegetation within the riparian corridor influences the aquatic and terrestrial ecosystem values that the feature provides to the watershed.  Figure 48 depicts the type of riparian vegetation observed at the sampled headwater sites in the Rudsdale Creek catchment.

Figure 48 Headwater feature riparian vegetation types in the Rudsdale Creek catchment
 

3.4.7 Headwater Feature Sediment Deposition

Assessing the amount of recent sediment deposited in a channel provides an index of the degree to which the feature could be transporting sediment to downstream reaches (OSAP, 2013).  Evidence of excessive sediment deposition might indicate the requirement to follow up with more detailed targeted assessments upstream of the site location to identify potential best management practices to be implemented.  Sediment deposition ranged from none to substantial for the headwater sites sampled in the Rudsdale Creek catchment area.  Figure 49 depicts the degree of sediment deposition observed at the sampled headwater sites in the Rudsdale Creek catchment.  Sediment deposition conditions ranged from no sediment deposition to substantial.

Figure 49 Headwater feature sediment deposition in the Rudsdale Creek catchment
 

3.4.8 Headwater Feature Upstream Roughness

Feature roughness will provide a measure of the amount of materials within the bankfull channel that could slow down the velocity of water flowing within the headwater feature (OSAP, 2013).  Materials on the channel bottom that provide roughness include vegetation, woody Structure and boulders/cobble substrates.  Roughness can provide benefits in mitigating downstream erosion on the headwater drainage feature and the receiving watercourse by reducing velocities.  Roughness also provides important habitat conditions for aquatic organisms.  Figure 50 shows the feature roughness conditions at the sampling locations in the Rudsdale Creek catchment were highly variable ranging from minimal to extreme.

Figure 50 Headwater feature roughness in the Rudsdale Creek catchment
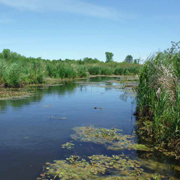
 

4.0 Rudsdale Creek Catchment: Land Cover

Land cover and any change in coverage that has occurred over a six year period is summarized for the Rudsdale Creek catchment using spatially continuous vector data representing the catchment during the spring of 2008 and 2014. This dataset was developed by the RVCA through heads-up digitization of 20cm DRAPE ortho-imagery at a 1:4000 scale and details the surrounding landscape using 10 land cover classes.

4.1 Rudsdale Creek Catchment Land Cover/Change

As shown in Table 8 and Figure 1, the dominant land cover type in 2014 is woodland followed by crop and pastureland.

Table 8 Land cover in the Rudsdale Creek catchment (2008 vs. 2014)
Land Cover20082014Change - 2008 to 2014
AreaAreaArea
HaPercentHaPercentHaPercent
Woodland*291847291547-3
Crop and Pasture164826164426-4
Wetland**99416996162
>Unevaluated(994)(16)(996)(16)(2)(0)
Settlement242424745
Meadow-Thicket17631733-3
Transportation17031703
Water491491
Aggregate6<18<12
* Does not include treed swamps ** Includes treed swamps

From 2008 to 2014, there was an overall change of 13 hectares (from one land cover class to another). Most of the change in the Rudsdale Creek catchment is a result of crop and pastureland reverting to woodland and the conversion of crop and pastureland to settlement along with woodland being transformed into crop and pastureland, aggregate and settlement (Figure 51).

LandCoverChangeNewTay-RiverRudsdale-001-001
Figure 51 Land cover change in the Rudsdale Creek catchment (2014)
 

Table 9 provides a detailed breakdown of all land cover change that has taken place in the Rudsdale Creek catchment between 2008 and 2014.

Table 9 Land cover change in the Rudsdale Creek catchment (2008 to 2014)
Land CoverChange - 2008 to 2014
Area
Ha.Percent
Crop and Pasture to Settlement3.728.2
Crop and Pasture to Woodland2.317.3
Woodland to Crop and Pasture2.216.6
Woodland to Aggregate 1.712.9
Woodland to Settlement1.511.2
Meadow-Thicket to Settlement0.64.8
Settlement to Woodland0.64.3
Crop and Pasture to Water0.53.6

4.2 Woodland Cover

In the Environment Canada Guideline (Third Edition) entitled “How Much Habitat Is Enough?” (hereafter referred to as the “Guideline”) the opening narrative under the Forest Habitat Guidelines section states that prior to European settlement, forest was the predominant habitat in the Mixedwood Plains ecozone. The remnants of this once vast forest now exist in a fragmented state in many areas (including the Rideau Valley watershed) with woodland patches of various sizes distributed across the settled landscape along with higher levels of forest cover associated with features such as the Frontenac Axis (within the on-Shield areas of the Rideau Lakes and Tay River subwatersheds). The forest legacy, in terms of the many types of wildlife species found, overall species richness, ecological functions provided and ecosystem complexity is still evident in the patches and regional forest matrices (found in the Tay River subwatershed and elsewhere in the Rideau Valley watershed). These ecological features are in addition to other influences which forests have on water quality and stream hydrology including reducing soil erosion, producing oxygen, storing carbon along with many other ecological services that are essential not only for wildlife but for human well-being.

The Guideline also notes that forests provide a great many habitat niches that are in turn occupied by a great diversity of plant and animal species. They provide food, water and shelter for these species - whether they are breeding and resident locally or using forest cover to help them move across the landscape. This diversity of species includes many that are considered to be species at risk. Furthermore, from a wildlife perspective, there is increasing evidence that the total forest cover in a given area is a major predictor of the persistence and size of bird populations, and it is possible or perhaps likely that this pattern extends to other flora and fauna groups. The overall effect of a decrease in forest cover on birds in fragmented landscapes is that certain species disappear and many of the remaining ones become rare, or fail to reproduce, while species adapted to more open and successional habitats, as well as those that are more tolerant to human-induced disturbances in general, are able to persist and in some cases thrive. Species with specialized-habitat requirements are most likely to be adversely affected. The overall pattern of distribution of forest cover, the shape, area and juxtaposition of remaining forest patches and the quality of forest cover also play major roles in determining how valuable forests will be to wildlife and people alike.

The current science generally supports minimum forest habitat requirements between 30 and 50 percent, with some limited evidence that the upper limit may be even higher, depending on the organism/species phenomenon under investigation or land-use/resource management planning regime being considered/used.

As shown in Figure 52, 48 percent of the Rudsdale Creek catchment contains 2915 hectares of upland forest and 40 hectares of lowland forest (treed swamps) versus the 47 percent of woodland cover in the Tay River subwatershed. This is greater than the 30 percent of forest cover that is identified as the minimum threshold required to sustain forest birds according to the Guideline and which may only support less than one half of potential species richness and marginally healthy aquatic systems. When forest cover drops below 30 percent, forest birds tend to disappear as breeders across the landscape.

InteriorForestTay-RiverRudsdale-001-001
Figure 52 Woodland cover and forest interior in the Rudsdale Creek catchment (2014)
 

4.2.1 Woodland (Patch) Size

According to the Ministry of Natural Resources’ Natural Heritage Reference Manual (Second Edition), larger woodlands are more likely to contain a greater diversity of plant and animal species and communities than smaller woodlands and have a greater relative importance for mobile animal species such as forest birds.

Bigger forests often provide a different type of habitat. Many forest birds breed far more successfully in larger forests than they do in smaller woodlots and some rely heavily on forest interior conditions. Populations are often healthier in regions with more forest cover and where forest fragments are grouped closely together or connected by corridors of natural habitat. Small forests support small numbers of wildlife. Some species are “area-sensitive” and tend not to inhabit small woodlands, regardless of forest interior conditions. Fragmented habitat also isolates local populations, especially small mammals, amphibians and reptiles with limited mobility. This reduces the healthy mixing of genetic traits that helps populations survive over the long run (Conserving the Forest Interior. Ontario Extension Notes, 2000).

The Environment Canada Guideline also notes that for forest plants that do not disperse broadly or quickly, preservation of some relatively undisturbed large forest patches is needed to sustain them because of their restricted dispersal abilities and specialized habitat requirements and to ensure continued seed or propagation sources for restored or regenerating areas nearby.

The Natural Heritage Reference Manual continues by stating that a larger size also allows woodlands to support more resilient nutrient cycles and food webs and to be big enough to permit different and important successional stages to co-exist. Small, isolated woodlands are more susceptible to the effects of blowdown, drought, disease, insect infestations, and invasions by predators and non-indigenous plants. It is also known that the viability of woodland wildlife depends not only on the characteristics of the woodland in which they reside, but also on the characteristics of the surrounding landscape where the woodland is situated. Additionally, the percentage of forest cover in the surrounding landscape, the presence of ecological barriers such as roads, the ability of various species to cross the matrix surrounding the woodland and the proximity of adjacent habitats interact with woodland size in influencing the species assemblage within a woodland.

In the Rudsdale Creek catchment (in 2014), one hundred and fifty-five (59 percent) of the 265 woodland patches are very small, being less than one hectare in size. Another 86 (32 percent) of the woodland patches ranging from one to less than 20 hectares in size tend to be dominated by edge-tolerant bird species. The remaining 24 (nine percent of) woodland patches range between 22 and 521 hectares in size. Fourteen of these patches contain woodland between 20 and 100 hectares and may support a few area-sensitive species and some edge intolerant species, but will be dominated by edge tolerant species.

Conversely, ten (four percent) of the 265 woodland patches in the drainage area exceed the 100 plus hectare size needed to support most forest dependent, area sensitive birds and are large enough to support approximately 60 percent of edge-intolerant species. Three patches top 200 hectares, which according to the Environment Canada Guideline will support 80 percent of edge-intolerant forest bird species (including most area sensitive species) that prefer interior forest habitat conditions.

Table 10 presents a comparison of woodland patch size in 2008 and 2014 along with any changes that have occurred over that time. A decrease (of four hectares) has been observed in the overall woodland patch area between the two reporting periods.

Table 10 Woodland patches in the Rudsdale Creek catchment (2008 and 2014)
Woodland Patch Size Range (ha)Woodland* PatchesPatch Change
200820142008 to 2014
NumberAreaNumberAreaNumberArea
Count% Ha%Count% Ha%CountHa
Less than 1 149575321555955262
1 to 20873438513863238313-1-2
20 to 507322688322581-1
50 to 10062395136239413-1
100 to 20073887307388630-1
Greater than 2003110123431101134-1
*Includes treed swamps

4.2.2 Woodland (Forest) Interior Habitat

The forest interior is habitat deep within woodlands. It is a sheltered, secluded environment away from the influence of forest edges and open habitats. Some people call it the “core” or the “heart” of a woodland. The presence of forest interior is a good sign of woodland health, and is directly related to the woodland’s size and shape. Large woodlands with round or square outlines have the greatest amount of forest interior. Small, narrow woodlands may have no forest interior conditions at all. Forest interior habitat is a remnant natural environment, reminiscent of the extensive, continuous forests of the past. This increasingly rare forest habitat is now a refuge for certain forest-dependent wildlife; they simply must have it to survive and thrive in a fragmented forest landscape (Conserving the Forest Interior. Ontario Extension Notes, 2000).

The Natural Heritage Reference Manual states that woodland interior habitat is usually defined as habitat more than 100 metres from the edge of the woodland and provides for relative seclusion from outside influences along with a moister, more sheltered and productive forest habitat for certain area sensitive species. Woodlands with interior habitat have centres that are more clearly buffered against the edge effects of agricultural activities or more harmful urban activities than those without.

In the Rudsdale Creek catchment (in 2014), the 265 woodland patches contain 31 forest interior patches (Figure 52) that occupy seven percent (411 ha.) of the catchment land area (which is greater than the five percent of interior forest in the Tay River subwatershed). This is below the ten percent figure referred to in the Environment Canada Guideline that is considered to be the minimum threshold for supporting edge intolerant bird species and other forest dwelling species in the landscape.

Most patches (18) have less than 10 hectares of interior forest, ten of which have small areas of interior forest habitat less than one hectare in size. The remaining 13 patches contain interior forest between 10 and 106 hectares in area. Between 2008 and 2014, the catchment has seen an overall loss of one hectare of interior forest (Table 11).

Table 11 Woodland interior in the Rudsdale Creek catchment (2008 and 2014)
Woodland Interior Habitat Size Range (ha)Woodland InteriorInterior Change
200820142008 to 2014
NumberAreaNumberAreaNumberArea
CountPercentHaPercentCountPercent HaPercentCountHa
Less than 1 10321<110321<1
1 to 10826277826277
10 to 309291543892915337-1
30 to 50276315276315
50 to 100136014136015
Greater than 10013106261310626

4.3 Wetland Cover

Wetlands are habitats forming the interface between aquatic and terrestrial systems. They are among the most productive and biologically diverse habitats on the planet. By the 1980s, according to the Natural Heritage Reference Manual, 68 percent of the original wetlands south of the Precambrian Shield in Ontario had been lost through encroachment, land clearance, drainage and filling.

Wetlands perform a number of important ecological and hydrological functions and provide an array of social and economic benefits that society values. Maintaining wetland cover in a watershed provides many ecological, economic, hydrological and social benefits that are listed in the Reference Manual and which may include:

  • contributing to the stabilization of shorelines and to the reduction of erosion damage through the mitigation of water flow and soil binding by plant roots
  • mitigating surface water flow by storing water during periods of peak flow (such as spring snowmelt and heavy rainfall events) and releasing water during periods of low flow (this mitigation of water flow also contributes to a reduction of flood damage)
  • contributing to an improved water quality through the trapping of sediments, the removal and/or retention of excess nutrients, the immobilization and/or degradation of contaminants and the removal of bacteria
  • providing renewable harvesting of timber, fuel wood, fish, wildlife and wild rice
  • contributing to a stable, long-term water supply in areas of groundwater recharge and discharge
  • providing a high diversity of habitats that support a wide variety of plants and animals
  • acting as “carbon sinks” making a significant contribution to carbon storage
  • providing opportunities for recreation, education, research and tourism

Historically, the overall wetland coverage within the Great Lakes basin exceeded 10 percent, but there was significant variability among watersheds and jurisdictions, as stated in the Environment Canada Guideline. In the Rideau Valley Watershed, it has been estimated that pre-settlement wetland cover averaged 35 percent using information provided by Ducks Unlimited Canada (2010) versus the 21 percent of wetland cover existing in 2014 derived from DRAPE imagery analysis.

WetlandChangeTay-RiverRudsdale-001-001
Figure 53 Wetland cover in the Rudsdale Creek catchment (Historic to 2014)
 

This decline in wetland cover is also evident in the Rudsdale Creek catchment (as seen in Figure 53 above and summarized in Table 12 below), where wetland was reported to cover 33 percent of the area prior to settlement, as compared to 16 percent in 2014. This represents a 51 percent loss of historic wetland cover. To maintain critical hydrological, ecological functions along with related recreational and economic benefits provided by these wetland habitats in the catchment, a “no net loss” of currently existing wetlands should be employed to ensure the continued provision of tangible benefits accruing from them to landowners and surrounding communities.

 
Table 12 Wetland cover in the Rudsdale Creek catchment (Historic to 2014)
Wetland Cover Pre-settlement20082014Change - Historic to 2014
Area  Area  Area  Area  
Ha Percent Ha Percent Ha Percent Ha Percent 
Rudsdale Creek2042339941699616-1046-51
Tay Rivern/an/a15280191533019n/an/a

4.4 Shoreline Cover

The riparian or shoreline zone is that special area where the land meets the water. Well-vegetated shorelines are critically important in protecting water quality and creating healthy aquatic habitats, lakes and rivers. Natural shorelines intercept sediments and contaminants that could impact water quality conditions and harm fish habitat in streams. Well established buffers protect the banks against erosion, improve habitat for fish by shading and cooling the water and provide protection for birds and other wildlife that feed and rear young near water. A recommended target (from the Environment Canada Guideline) is to maintain a minimum 30 metre wide vegetated buffer along at least 75 percent of the length of both sides of rivers, creeks and streams.

Figure 54 shows the extent of the ‘Natural’ vegetated riparian zone (predominantly wetland/woodland features) and ‘Other’ anthropogenic cover (crop/pastureland, roads/railways, settlements) along a 30-metre-wide area of land, both sides of the shoreline of Rudsdale Creek and its tributaries in the Rudsdale Creek catchment.

RiparianLandCoverwWetlandTay-RiverRudsdale-001-001
Figure 54 Natural and other riparian land cover in the Rudsdale Creek catchment (2014)
 

This analysis shows that the riparian zone in the Rudsdale Creek catchment is composed of wetland (39 percent), woodland (37 percent), crop and pastureland (18 percent), roads (two percent), meadow-thicket (two percent) and settlement (two percent). Along the many watercourses (including headwater streams) flowing into Rudsdale Creek, the riparian buffer is composed of woodland (40 percent), wetland (35 percent), crop and pastureland (20 percent), roads (two percent), settlement areas (two percent) and meadow-thicket (one percent). Along Rudsdale Creek itself, the riparian zone is composed of wetland (59 percent), woodland (18 percent), crop and pastureland (13 percent), meadow-thicket (five percent), transportation routes (three percent) and settlement (two percent),.

Additional statistics for the Rudsdale Creek catchment are presented in Tables 13, 14 and 15 and show that there has been very little to no change in shoreline cover from 2008 to 2014.

Table 13 Riparian land cover in the Rudsdale Creek catchment (2008 vs. 2014)
Riparian Land Cover20082014Change - 2008 to 2014
AreaAreaArea
Ha.Percent Ha.PercentHa.Percent
Wetland315.5839.03315.6839.040.100.01
> Unevaluated(315.58)(39.03)(315.68)(39.04)(0.10)(0.01)
Woodland299.9737.10299.8937.09-0.08-0.01
Crop & Pasture142.3517.60141.6517.52-0.70-0.08
Transportation18.502.2918.502.290.000.00
Meadow-Thicket16.312.0216.312.020.000.00
Settlement15.681.9416.372.020.690.08
Table 14 Riparian land cover along Rudsdale Creek (2008 vs. 2014)
Riparian Land Cover20082014Change - 2008 to 2014
AreaAreaArea
Ha.Percent Ha.PercentHa.Percent
Wetland113.359.58113.2959.580.000.00
> Unevaluated113.2959.58113.2959.580.000.00
Woodland34.0317.8934.0317.890.000.00
Crop & Pasture24.913.124.913.10.000.00
Meadow-Thicket9.194.849.194.840.000.00
Transportation5.332.85.332.80.000.00
 
Table 15 Riparian land cover along streams in the Rudsdale Creek catchment (2008 vs. 2014)
Riparian Land Cover20082014Change - 2008 to 2014
AreaAreaArea
Ha.Percent Ha.PercentHa.Percent
Woodland225.8939.53225.8039.51-0.09-0.02
Wetland199.1734.85199.2634.870.090.02
> Unevaluated(199.17)(34.85)(199.26)(34.87)(0.09)(0.02)
Crop & Pasture115.5420.22114.8520.10-0.69-0.12
Transportation13.162.3013.162.300.000.00
Settlement11.241.9711.932.090.690.12
Meadow-Thicket6.241.096.241.090.000.00

5.0 Rudsdale Creek Catchment: Stewardship and Water Resources Protection

The RVCA and its partners are working to protect and enhance environmental conditions in the Tay River Watershed. Figure 55 shows the location of all stewardship projects completed in the Rudsdale Creek catchment.

StewardshipTay-RiverRudsdale-001-001
Figure 55 Stewardship site locations in the Rudsdale Creek catchment
 

5.1 Rural Clean Water

The Rural Clean Water Program provides technical and financial assistance to farmers and other rural landowners, to aid in the implementation of projects that protect water quality. Funding is granted to those projects that support best management practices for application in the protection and improvement of surface and ground water resources.  The program also supports climate change adaptation and low impact development projects as well as educating rural landowners about environmental stewardship of private property. Examples of supported projects include livestock exclusion fencing, controlled tile drainage, cover crops, erosion control, well related projects, and many more. For a list of eligible projects and to apply for funding, see Rural Clean Water.

In the Rudsdale Creek catchment from 2011 to 2016, six well upgrades, two well decommissionings, two septic system repairs and one manure storage facility were completed; prior to this, two well decommissionings, one well replacement and one well upgrade had been completed. Total value of all 15 projects is $44,451 with $15,353 of that amount funded through grant dollars from the RVCA.

5.2 Private Land Forestry

Forest cover and tree planting continues to be one of the most widely supported strategies to improve our environment. The many benefits of forest cover include carbon sequestration, flood mitigation and water quality improvement as well as providing fish and wildlife habitat.

Through the RVCA's Trees for Tomorrow Program (and its predecessors), 77,300 trees were planted at three sites from 2011 to 2016; prior to this, 20,700 trees were planted at three sites. In total, 98,000 trees have been planted resulting in the reforestation of 49 hectares. Total value of all six projects in the Rudsdale Creek catchment is $267,963 with $220,278 of that amount coming from fundraising sources. For more information about the Program and landowner eligibility, please see the following: Tree Planting in the Rideau Valley Watershed and Trees for Tomorrow.

An additional 30 butternut trees were planted through the RVCA Butternut Recovery Program, as part of efforts to introduce healthy seedlings from tolerant butternuts into various locations across Eastern Ontario.

5.3 Shoreline Naturalization

Natural shoreline buffers rich in native plants are critically important to protecting the health of our lakes, rivers and streams. Shoreline vegetation protects water quality and aquatic habitat by intercepting potentially harmful contaminants such as nutrients, pollutants and sediment, regulating water temperatures, slowing runoff and providing important fish and wildlife habitat. Natural shorelines also help improve climate change resiliency by increasing flood storage and providing protection from erosion during extreme weather events.

As of the end of 2016, no shoreline projects had been carried out in the Rudsdale Creek catchment. Landowners may wish to take advantage of the RVCA's Shoreline Naturalization Program to assist them with the naturalization of their shorelines to see the benefits noted above (and more).

5.4 Valley, Stream, Wetland and Hazard Lands

The Rudsdale Creek catchment covers 62 square kilometres with none of the drainage area being within the regulation limit of Ontario Regulation 174/06 (Figure 56). Wetlands occupy 10 square kilometres (or 16 percent) of the catchment. All are unevaluated and unregulated. Similarly, all 132.7 kilometres of stream in the catchment (including Rudsdale Creek) are not subject to the regulation limit, other than the “alteration to waterways” provision of the Regulation, which affords them some protection.

Nonetheless, efforts (have been made and) continue through RVCA planning and regulations input and review to manage the impact of development (and other land management practices) in areas where “natural hazards” are associated with rivers, streams, valley lands and wetlands. This task is significantly harder, if not impossible to achieve in instances where these features have not been identified on map schedules, as is the case in the Rudsdale Creek catchment. Plotting of the regulation limit along the catchment's watercourses requires the identification of flood and erosion hazards and valley systems.

RegulatedFeatureswIPZTay-RiverRudsdale-001-001
Figure 56 Regulated natural features/hazards and Intake Protection Zones in the Rudsdale Creek catchment
 

5.5 Vulnerable Drinking Water Areas

The Town of Perth’s municipal drinking water Intake Protection Zone (IPZ), specifically IPZ-2 with a vulnerability score of 8 is found within the Rudsdale Creek catchment (Figure 56). As per the Mississippi-Rideau Source Protection Plan, policies may affect future development within these areas. Under Section 59 of the Clean Water Act, 2006, future applications under the Building Code and the Planning Act may be screened by the Mississippi-Rideau Risk Management Office. Depending on the proposed activity, additional requirements or restrictions may apply. For more information, please contact the Mississippi-Rideau Risk Management Office at (613) 692-3571.

In addition, the Mississippi-Rideau Source Protection Plan has mapped the southern part of the Rudsdale Creek catchment as within a Significant Groundwater Recharge Area and identified all of the catchment as a Highly Vulnerable Aquifer. This means that the nature of the overburden (thin soils, fractured bedrock) does not provide a high level of protection for the underlying groundwater making the aquifer more vulnerable to contaminants released on the surface. Highly Vulnerable Aquifers characterise 89% of the Region and are considered moderate to low drinking water threats with certain policies that apply; mainly policies regarding waste disposal. All property owners are encouraged to use best management practices to protect sources of municipal drinking water. For more information on source protection best management practices, please visit Protecting Your Drinking Water.

6.0 Rudsdale Creek Catchment: Accomplishments/Activities

Achievements noted by the Friends of the Tay Watershed Association (FoTW) are indicated by an asterisk.

In-stream/Fish Habitat

3.3 kilometres of Rudsdale Creek have been surveyed and 32 headwaters sites are sampled once every six years by the RVCA using the Ontario Stream Assessment Protocol.

The lower channel of this creek near it mouth was substantially altered many years ago by the property owner digging several deep channels into the edge of this small creek, apparently for a planned residential development. Because it is a stream that is seldom travelled, the damage was not observed until years later - which was too late for proper remedial action. It is the FoTW Association's belief that this type of damage would not be missed with the present level of testing and monitoring that is now in place for such catchment areas.*

Tree Planting

98,000 trees have been planted at six sites in the Rudsdale Creek catchment by the RVCA Private Land Forestry Program, resulting in the reforestation of 49 hectares.

Water Quality

One stream monitoring site on Rudsdale Creek is sampled yearly by the RVCA for 22 parameters, six times a year, to assess surface chemistry water quality conditions.

One Ontario Benthic Biomonitoring Network site on Rudsdale Creek is sampled by the RVCA in the spring and fall of each year with three replicates, to assess instream biological water quality conditions.

Fifteen Clean Water projects were completed by the RVCA Rural Clean Water Program.

Water Taking

OMYA corporation reports annually to the public on its water-taking over the past 12 months - a condition of their Permit to Take Water (PTTW) for the withdrawal of water from the Tay River and company-owned wells. The taking of water began in accordance with the conditions outlined in the PTTW (and other permits) obtained in September 2003. At the first public meeting held to fulfil a condition of the water taking permit - to hold one public meeting in a calendar year to present a report on the company's water taking - there was great interest in the results presented by OMYA. Subsequent meetings have kept the community well-informed about its activities and adherence to the permit conditions, thus helping to alleviate public concerns about the water taking.

The Friends of the Tay Watershed Association help promote OMYA's report to the public about its water taking activities over the previous year.*

OMYA has installed a state-of-the-art digital water meter on the Tay River (one of the PTTW conditions). The data collected provides valuable information regarding Tay River water flows and facilitates future environmental and scientific study of the river.

Waterway Planning and Management

The Tay Watershed Management Plan (2002) brought together a diverse group of watershed stakeholders to exchange information and opinions on the challenges facing the watershed. This forum focused the community on the need for managing the Tay Watershed, requiring positive cooperation amongst a range of stakeholders and helped develop a foundation of data and information on the watershed and resources against which later developments and trends are being measured and decisions are being made. 

The Plan also led to the formation of the Friends of the Tay Watershed Association, who have been instrumental in implementing 20 of 24 management plan recommendations. In the opinion of the Association, one of the most significant measures of success for the water protection activities carried out in the Tay watershed is that there has never been a serious environmental pollution incident that threatened the area’s drinking water or its recreational waterbodies. To this day, the Friends of the Tay Watershed remain committed to preserving and enhancing the health of the Tay River watershed through their work.*

7.0 Rudsdale Creek Catchment: Challenges/Issues

Development

The lower channel of Rudsdale Creek near its mouth at the Tay River was substantially altered many years ago by a landowner excavating several deep channels into the edge of this watercourse, apparently for a planned residential development. As Rudsdale Creek is seldom travelled by water, the damage done was not observed until many years later; too late for proper remedial action to be taken. The Friends of the Tay Watershed Association believes that this type of damage would not be missed now with the present level of water qualty testing and stream assessment monitoring that is now in place for Rudsdale Creek and other such catchment areas. 

Headwaters/In-stream Habitat/Shorelines

Distribution of naturally vegetated shorelines is uneven across the Rudsdale Creek catchment, even though its headwater and tributary streams have more than 75 percent naturally vegetated shoreline cover (see Section 4.4 of this report).

Nine of 31 sampled headwater stream sites have been modified (four are ditched, three are channelized and two are ponded)(see Section 3.4.2 of this report).

Land Cover

Land cover has changed across the catchment (2008 to 2014) as a result of an increase in the area of settlement (5 ha.), aggregate extraction (2 ha.) and wetland (2 ha.) and loss of crop and pastureland (4 ha.), woodland (3 ha.) and meadow-thicket (3 ha.)(see Section 4.1 of this report).

Wetlands have declined by fifty-one percent since European pre-settlement and now cover 16 percent (996 ha.) of the catchment (in 2014). One hundred percent (996 ha.) of these wetlands remain unevaluated/unregulated and although they are not under imminent threat from development activity, they do remain vulnerable to drainage and land clearing activities in the absence of any regulatory and planning controls that would otherwise protect them for the many important hydrological, social, biological and ecological functions/services/values they provide to landowners and the surrounding community.

Water Quality

Surface chemistry water quality rating along Rudsdale Creek ranges from Fair to Good at the Christie Lake Road crossing. Results from this monitored site show that nutrient enrichment is a feature of Rudsdale Creek. Elevated nutrients may result in nutrient loading downstream and to the Tay River. Of the metals routinely monitored in Rudsdale Creek, iron (Fe) occasionally reported concentrations above the Provincial Water Quality Objective. In elevated concentrations, this metal can have toxic effects on sensitive aquatic species (see Section 2.1 of this report).

Instream biological water quality condition in Rudsdale Creek is Poor at the Christie Lake Road crossing. Samples are dominated with benthic invertebrate species that are tolerant to high organic pollution levels (see Section 3.3.1 of this report).

8.0 Rudsdale Creek Catchment: Actions/Opportunities

Aquatic Habitat/Fisheries

Educate waterfront property owners about fish habitat requirements, spawning timing and near-shore and in-water activities that can disturb or destroy fish habitat and spawning sites.

Work with various partners, including landowners, the Friends of the Tay Watershed Association and Tay Valley Township on fish habitat enhancement projects in the Tay River watershed, building off of new knowledge and the recommendations as described in the report "Fish Habitat of the Tay River Watershed: Existing Conditions and Opportunities for Enhancement" (2002) prepared by MNR, RVCA, Parks Canada, and DFO.

Development

Work with approval authorities (Lanark County, Leeds Grenville and Lanark District Health Unit, Mississippi Rideau Septic System Office, RVCA and Tay Valley Township) and landowners to consistently implement current land use planning and development policies for water quality and shoreline protection adjacent to Rudsdale Creek and headwater streams in the catchment (i.e., a minimum 30 metre development setback from water).

Explore ways and means to more effectively implement and enforce conditions of land-use planning and development approval to achieve net environmental gains (particularly with respect to rehabilitating or protecting naturally vegetated shorelines and water quality).

Encourage Committees of Adjustment to take advantage of technical and environmental information and recommendations forthcoming from planning and environmental professionals.

Municipalities in the Tay Watershed are encouraged to strengthen natural heritage and water resources official plan policies and zoning provisions (pertaining to water setbacks, frontage and naturalized shorelines and wetland protection) where deemed appropriate.

Work with Lanark County, Tay Valley Township and agencies to ensure that development approvals around lakes and along watercourses take into consideration the protection of fish habitat (including the near-shore nursery and spawning habitat).

Utilize RVCA subwatershed and catchment reports to help develop, revise and implement official plan policies to protect surface water resources and the natural environment (including woodlands, wetlands and shoreline cover).

Land Cover

Establish RVCA regulation limits around the 100 percent (996 ha.) of wetlands in the catchment that are unevaluated. Doing this will help protect landowners from natural hazards including  mitigating surface water flow by storing water during periods of peak flow (such as spring snowmelt and heavy rainfall events) and releasing water during periods of low flow (this mitigation of water flow reduces flood damage), as well as contributing to the stabilization of shorelines and to the reduction of soil erosion damage through water flow mitigation and plant soil binding/retention.


Shorelines

Take advantage of the RVCA Shoreline Naturalization Program to re-naturalize altered creek and stream shoreline identified in this report as “Unnatural Riparian Land Cover". Target shoreline restoration at sites on Rudsdale Creek and along its tributaries, shown in orange on the Riparian Land Cover map (see Figure 54 in Section 4.4 of this report). Other stewardship opportunities in the catchment may be determined based on septic system inspections and surface water quality monitoring results.

Promote the use of bioengineering methods (using native shrub/tree planting, fascines, live stakes) as a shoreline erosion mitigation measure as well as a cost effective alternative to shoreline hardening (with rip rap, armour stone, gabion baskets, walls).

Educate landowners about the value and importance of natural shorelines and property best management practices with respect to shoreline use and development, septic system installation and maintenance and shoreline vegetation retention and enhancement (Leeds Grenville and Lanark District Health Unit, Mississippi Rideau Septic System Office, RVCA and Tay Valley Township).

Water Quality

Consider further investigation of the Fair surface chemistry water quality rating and Poor instream biological water quality rating on Rudsdale Creek as part of a review of RVCA's Baseline and Benthic Invertebrate surface water quality monitoring.

Offer funding provided by the RVCA Rural Clean Water Program to landowners with potential projects that could improve water quality on Rudsdale Creek and its tributaries (e.g., livestock fencing, septic system repair/replacement and streambank erosion control/stabilisation).

Educate waterfront property owners about septic system care by providing information about sewage system maintenance (i.e., when to pump out septic systems and holding talks) through initiatives such as the Septic Savvy Workshop and services provided by the Mississippi Rideau Septic System Office.

Reduce pollutant loading to Rudsdale Creek through education about the application of shoreline, stormwater and agricultural best management practices; also consider using low impact development (LID) methods to improve the quality and reduce the amount of stormwater runoff directly reaching the river ecosystem. This will be particularly beneficial in areas with extensive impervious surfaces (i.e., asphalt, concrete, buildings, and severely compacted soils) or on sensitive shoreline properties (with steep slopes/banks, shallow/impermeable soils).