2.0 Pike Lake Catchment: Water Quality Conditions
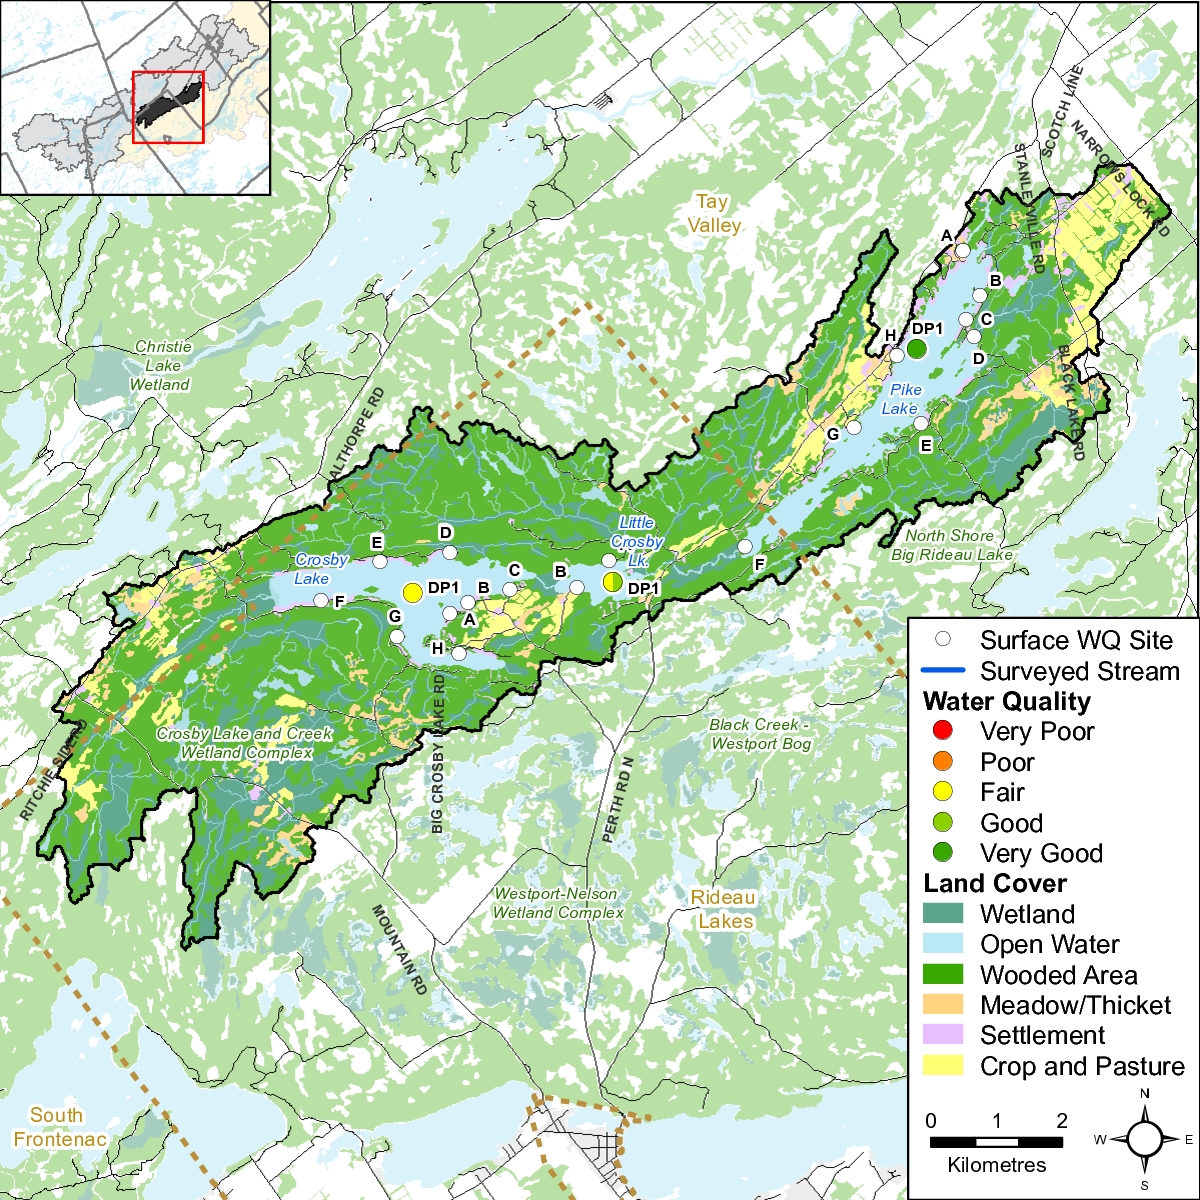
Surface water quality conditions in the Pike Lake catchment are monitored by the Rideau Valley Conservation Authority’s (RVCA) Watershed Watch Program. Watershed Watch monitors watershed lakes to assess nutrient concentrations, water clarity, dissolved oxygen availability and pH. Figure 2 shows the locations of monitoring sites in the catchment.
Water Quality Rating in the Pike Lake Catchment
The water quality ratings across this catchment range from "Fair to Very Good" (Table 1); with a rating of "Fair” in Crosby Lake, "Fair to Good" in Little Crosby Lake and "Very Good" in Pike Lake, as determined by the Canadian Council of Ministers of the Environment (CCME) Water Quality Index.
A "Fair" rating indicates that water quality is usually protected but is occasionally threatened or impaired; conditions sometimes depart from natural or desirable levels. A rating of "Good" indicates that only a minor degree of threat or impairment is observed and conditions rarely depart from natural or desirable levels. “Very Good" indicates water quality is protected with a virtual absence of threat or impairment; conditions are very close to natural or pristine levels.
Each water quality parameter is evaluated against established guidelines to determine water quality conditions. Those parameters that frequently exceed guidelines are presented below. Data has been analyzed over the 2006-2017 period for general trends and conditions. Table 1 shows the overall rating for the monitored surface water quality sites within the catchment and Table 2 outlines the Water Quality Index (WQI) scores and their corresponding ratings.
| Site | Location | 2006-2008 | 2009-2011 | 2012-2014 | 2015-2017 |
|---|---|---|---|---|---|
| DP1 | Crosby Lake | Very Good (100) | Fair (77) | Fair (77) | Fair (77) |
| DP1 | Little Crosby Lake | Good (88) | Fair (76) | Fair (77) | Good (88) |
| DP1 | Pike Lake | Very Good (100) | Fair (77) | Very Good (100) | Very Good (100) |
| Rating | Index Score |
|---|---|
| Very Good (Excellent) | 95-100 |
| Good | 80-94 |
| Fair | 65-79 |
| Poor (Marginal) | 45-64 |
| Very Poor (Poor) | 0-44 |
2.1 Crosby Lake Water Quality
Surface water quality conditions in Crosby Lake have been monitored by RVCA’s Watershed Watch Program since 2006. Data from the deep point site (DP1) has been used to calculate the WQI rating for Crosby Lake, which averaged “Fair” over the 2006-2017 period (Table 1). Moderate nutrient concentrations, good oxygen availability and clear water all influenced this rating. The following discussion explains how each of the monitored water quality parameters contributes to the lake’s water quality.
This report also considers data from eight additional shoreline sites that are monitored around the lake. These sites have not been included in the calculation of the CCME WQI rating, as they are not monitored with the same frequency as the deep point site. However, they do provide important information on water quality conditions in the near shore areas. For locations of shoreline sites (A-H) please see Figure 2.
2.1.1 Nutrients
Total phosphorus (TP) is used as a primary indicator of excessive nutrient loading and contributes to abundant aquatic vegetation growth and depleted dissolved oxygen levels. The Provincial Water Quality Objective (PWQO) is used as the TP Guideline and states that in lakes, concentrations greater than 0.020 mg/l indicate an excessive amount of TP within the water column. Concentrations below 0.010 mg/l are generally considered to be minimal and unlikely to have problems associated with nutrient loading.
Total Kjeldahl nitrogen (TKN) is used as a secondary indicator of nutrient loading. RVCA uses a guideline of 0.500 mg/l to assess TKN[1] within surface waters.
Nutrients at the Crosby Lake Deep Point
TP and TKN sampling results collected by the RVCA are presented in Figures 3 to 6. Some variability has occurred in the sampled TP concentrations at this site (Figure 3 and 4), and a decreasing trend[2] was observed in the 2006-2017 data set. Eighty-nine percent of samples analyzed for TP were less than the TP guideline and the average concentration was 0.012 mg/l (Table 3). TKN concentration also showed variability though no significant change was observed (Figures 5 and 6). Eighty-nine percent of reported results were below the TKN guideline and the average TKN concentration was 0.396 mg/l (Table 3).
 on Crosby Lake, 2006-2017.")
 on Crosby Lake, 2006-2017")
 on Crosby Lake, 2006-2017.")
 on Crosby Lake, 2006-2017.")
| Total Phosphorous 2006-2017 | |||
|---|---|---|---|
| Site | Average (mg/l) | Below Guideline | No. Samples |
| DP1 | 0.011 | 89% | 48 |
| Total Kjeldahl Nitrogen 2006-2017 | |||
| Site | Average (mg/l) | Below Guideline | No. Samples |
| DP1 | 0.371 | 89% | 48 |
Overall, the data presented indicates that nutrient concentration may be considered low with occasional exceedances in the mid-lake, deep water site on Crosby Lake.
Nutrients around Crosby Lake
The average nutrient concentrations at monitored shoreline sites around the lake vary from year to year (Figures 7 and 8). Please note that in the 2006-2017 monitoring period sites C, E and H were monitored yearly; while sites A, B, D, F, and G were only sampled in 2006, 2011 and 2016.
Average total phosphorous concentrations are below the TP guideline at all of sites. Average TKN concentrations were also below the guideline at all sites (Figure 8). Site G did show elevated concentrations in 2016, though results are comparable to other sites in the years when monitored.


Summary of Crosby Lake Nutrients
Crosby Lake nutrient concentrations are generally below the guidelines, with few exceedances. It is possible that occasional problems with nutrient enrichment (i.e. algal blooms or excessive plant growth) may be observed in shallow, sheltered bays.
Efforts such as the diversion of runoff and enhanced shoreline buffers are important to continue to protect and enhance water quality, and reduce future nutrient increases. Nutrient exceedances may be partially attributed to the natural aging of a lake and basin characteristics. All residents can help minimize their impact on the lake by reducing nutrient inputs through practices such as proper maintenance of septic systems, keeping shorelines natural and using phosphate free soaps and detergents. Promotion of sound stewardship and protection around lake is important to maintain and protect water quality conditions into the future.
2.1.2 Crosby Lake Water Clarity
Water clarity is measured using a Secchi disk during each deep point sample. Table 4 summarizes the recorded depths with an average depth of 4.3 m and shows that all readings have exceeded the minimum PWQO of 2 m indicating that algae in the water column is not at excessive levels (good water clarity). Less than 2 m will indicate overproduction in a lake or significant inputs to the water column that are limiting light availability. Figure 9 shows that no individual reading has been below the guideline and measured depths range from 2.5 m to 8.5 m. A decreasing trend was observed within the 2006-2017 data set, indicating that Secchi depths have been reduced over this period.
| Secchi 2006-2017 | |||
|---|---|---|---|
| Site | Average (m) | Above Guideline | No. Samples |
| DP1 | 4.3 | 100% | 35 |
 on Crosby Lake, 2006-2017")
Summary of Crosby Lake Water Clarity
Waters in Crosby Lake are very clear and sufficient sunlight is able to penetrate the water column to support aquatic life and provide sufficient visibility for safe recreational use (boating, swimming).
2.1.3 Crosby Lake Fish Habitat
Two other factors, dissolved oxygen/temperature and pH were also assessed to provide an overall sense of the health of Crosby Lake from a fish habitat perspective.
2.1.3.1 Crosby Lake Dissolved Oxygen and Temperature
The red bars in Figure 10 show the depths where suitable conditions exist for warm water fish species (temperature less than 25°C and dissolved oxygen greater than 4 mg/l) at the deep point site. The vertical axis represents the total lake depth at each site where the profile is taken. Suitable conditions typically decline throughout the summer to about 12 m of the water column. Overall, no significant change was noted in conditions through the 2006-2017 period.
 on Crosby Lake, 2006-2017")
2.1.3.2 Crosby Lake pH
pH is a basic water quality parameter used to assess the acidity of water, an important factor for aquatic life. Figure 11 shows monitored pH values over the 2006-2017 period.
 on Crosby Lake, 2006-2017")
The majority of samples for both time periods were within guidelines established by the Canadian Council of Minister's of the Environment which state that pH should be between 6.5 and 9 to protect aquatic life (Table 5). Surface water’s that are found to be more alkaline (higher pH) are common in many regions of the Tay River subwatershed and can generally be attributed to the geology rather than anthropogenic activities. Biological activities such as increased photosynthesis from algal blooms and plant growth may also influence pH.
| pH 2006-2017 | |||
|---|---|---|---|
| Site | Average (mg/l) | Within Guideline | No. Samples |
| DP1 | 7.9 | 97% | 33 |
Summary of Water Quality for Fish Habitat in Crosby Lake
Overall the water chemistry data at the deep point describes suitable habitat conditions for warm water fish species such as yellow perch, walleye and pike. There is some evidence that the warming of the water column in the late summer/fall may limit the amount of habitat for some sensitive species. pH conditions are typically on the upper end of the range recommended for the protection of aquatic life. Overall, the data indicates a healthy environment for aquatic species.
2.1.4 Crosby Lake E. Coli
E. coli is sampled at monitored shoreline sites twice each sampling season. E. coli data was not used in the calculations of the WQI rating for the lake due to differences in sampling frequency and site locations. E. coli data has been summarized in Table 6. Throughout the 2006-2017 period 100 percent of samples collected by RVCA were below the E. coli guideline of 100 colony forming units (CFU) per 100 ml set by the PWQO; across the lake the count at the geometric mean was 3 CFU/100ml (Table 6). This provides support that there is little indication of bacterial contamination around the lake.
| E. coli 2006-2017 | |||
|---|---|---|---|
| Site | Geometric mean (CFU/100ml) | Below Guideline | No. Samples |
| A-E | 3 | 100% | 112 |

Figure 12 show the distribution of counts across all shoreline sites. All sites fell well below the guideline of 100 CFU/100ml.
Summary of Crosby Lake Bacterial Contamination
The results presented above indicate that bacterial contamination is not a significant concern in Crosby Lake and the water should be safe for recreational use such as swimming and boating.
2.2 Little Crosby Lake Water Quality
Surface water quality conditions in Little Crosby Lake have been monitored by RVCA’s Watershed Watch Program since 2006. Data from the deep point site (DP1) has been used to calculate the WQI rating for Little Crosby Lake, which averaged “Fair-Good” over the 2006-2017 period (Table 1). Moderate nutrient concentrations, good oxygen availability and clear water all influenced this rating. The following discussion explains how each of the monitored water quality parameters contributes to the lake’s water quality.
This report also considers data from two additional shoreline sites that are monitored around the lake. These sites have not been included in the calculation of the CCME WQI rating, as they are not monitored with the same frequency as the deep point site. However, they do provide important information on water quality conditions in the near shore areas. For locations of shoreline sites (A and B) please see Figure 2.
2.2.1 Little Crosby Lake Nutrients
Total phosphorus (TP) is used as a primary indicator of excessive nutrient loading and contributes to abundant aquatic vegetation growth and depleted dissolved oxygen levels. The Provincial Water Quality Objective (PWQO) is used as the TP Guideline and states that in lakes, concentrations greater than 0.020 mg/l indicate an excessive amount of TP within the water column. Concentrations below 0.010 mg/l are generally considered to be minimal and unlikely to have problems associated with nutrient loading.
Total Kjeldahl nitrogen (TKN) is used as a secondary indicator of nutrient loading. RVCA uses a guideline of 0.500 mg/l to assess TKN[1] within surface waters.
Nutrients at the Little Crosby Lake Deep Point
TP and TKN sampling results collected by the RVCA are presented in Figures 13 to 16. Some variability has occurred in the sampled TP concentrations at this site (Figure 13 and 14), and a decreasing trend[2] was observed in the 2006-2017 dataset. Eighty-five percent of samples analyzed for TP were less than the TP guideline and the average concentration was 0.014 mg/l (Table 7). TKN concentrations were more consistent, with no significant trend through the monitoring period (Figures 15 and 16). Eighty-nine percent of reported results were below the TKN guideline and the average TKN concentration was 0.390 mg/l (Table 7).
 on Little Crosby Lake, 2006-2017")
 on Little Crosby Lake, 2006-2017")
 on Little Crosby Lake, 2006-2017.")
 on Little Crosby Lake, 2006-2017.")
| Total Phosphorous 2006-2017 | |||
|---|---|---|---|
| Site | Average (mg/l) | Below Guideline | No. Samples |
| DP1 | 0.014 | 85% | 40 |
| Total Kjeldahl Nitrogen 2006-2017 | |||
| Site | Average (mg/l) | Below Guideline | No. Samples |
| DP1 | 0.390 | 90% | 40 |
Overall, the data presented indicates that nutrient concentration may be considered low with few exceedances in the mid-lake, deep water site on Little Crosby Lake
Nutrients around Little Crosby Lake
The average nutrient concentrations at monitored shoreline sites around the lake vary from year to year (Figures 17 and 18). Please note that in the 2006-2017 monitoring period sites A and B were only sampled in 2006, 2011 and 2016.
Average total phosphorous concentrations varied across the three years of monitoring data. Site B reported very high results in 2016 as well as elevated results in 2011 (Figure 17). This site is influenced by agricultural lands which may influence concentrations; particularly during runoff events. Average TKN concentrations were generally below the guideline, with the exception of site B in 2016 (Figure 18); as noted in the discussion regarding TP results this results may be attributed to the surrounding landscape.


Summary of Little Crosby Lake Nutrients
Little Crosby Lake nutrient concentrations are generally below the guidelines, with few exceedances. It is possible that occasional problems with nutrient enrichment (i.e. algal blooms or excessive plant growth) may be observed in shallow, sheltered bays.
Efforts such as the diversion of runoff and enhanced shoreline buffers are important to continue to protect and enhance water quality, and reduce future nutrient increases. Nutrient exceedances may be partially attributed to the natural aging of a lake and basin characteristics. All residents can help minimize their impact on the lake by reducing nutrient inputs through practices such as proper maintenance of septic systems, keeping shorelines natural and using phosphate free soaps and detergents. Promotion of sound stewardship and protection around lake is important to maintain and protect water quality conditions into the future.
2.2.2 Little Crosby Lake Water Clarity
Water clarity is measured using a Secchi disk during each deep point sample. Table 8 summarizes the recorded depths with an average depth of 4.3 m and shows that all readings have exceeded the minimum PWQO of 2 m indicating that algae in the water column is not at excessive levels (good water clarity). Less than 2 m will indicate overproduction in a lake or significant inputs to the water column that are limiting light availability. Figure 19 shows that no individual reading has been below the guideline and measured depths range from 2 m to 7.5 m. A decreasing trend was observed within the 2006-2017 data set, indicating that Secchi depths have been reduced over this period.
| Secchi 2006-2017 | |||
|---|---|---|---|
| Site | Average (m) | Above Guideline | No. Samples |
| DP1 | 4.3 | 100% | 35 |
 on Little Crosby Lake, 2006-2017.")
Summary of Little Crosby Lake Water Clarity
Waters in Crosby Lake are very clear and sufficient sunlight is able to penetrate the water column to support aquatic life and provide sufficient visibility for safe recreational use (boating, swimming).
2.2.3 Little Crosby Lake Fish Habitat
Two other factors, dissolved oxygen/temperature and pH were also assessed to provide an overall sense of the health of Little Crosby Lake from a fish habitat perspective.
2.2.3.1 Dissolved Oxygen and Temperature
The red bars in Figure 20 show the depths where suitable conditions exist for warm water fish species (temperature less than 25°C and dissolved oxygen greater than 4 mg/l) at the deep point site. The vertical axis represents the total lake depth at each site where the profile is taken. Suitable conditions typically decline throughout the summer to about 7 m of the water column. Overall, no significant change was noted in conditions through the 2006-2017 period.
 on Little Crosby Lake, 2006-2017.")
2.2.3.2 Little Crosby Lake pH
pH is a basic water quality parameter used to assess the acidity of water, an important factor for aquatic life. Figure 21 shows monitored pH values over the 2006-2017 period.
 on Little Crosby Lake, 2006-2017.")
The majority of samples for both time periods were within guidelines established by the Canadian Council of Minister's of the Environment which state that pH should be between 6.5 and 9 to protect aquatic life (Table 9). Surface water’s that are found to be more alkaline (higher pH) are common in many regions of the Tay River subwatershed and can generally be attributed to the geology rather than anthropogenic activities. Biological activities such as increased photosynthesis from algal blooms and plant growth may also influence pH.
| pH 2006-2017 | |||
|---|---|---|---|
| Site | Average (mg/l) | Within Guideline | No. Samples |
| DP1 | 7.85 | 100% | 38 |
Summary of Water Quality for Fish Habitat in Little Crosby Lake
Overall the water chemistry data at the deep point describes suitable habitat conditions for warm water fish species such as yellow perch, walleye and pike. There is some evidence that the warming of the water column in the late summer/fall may limit the amount of habitat for some sensitive species in this shallow lake. pH conditions are typically within the range recommended for the protection of aquatic life. Overall, the data indicates a healthy environment for aquatic species.
2.2.4 Little Crosby Lake E. Coli
E. coli is sampled at monitored shoreline sites twice each sampling season. E. coli data was not used in the calculations of the WQI rating for the lake due to differences in sampling frequency and site locations. E. coli data has been summarized in Table 10. Throughout the 2006-2017 period 100 percent of samples collected by RVCA were below the E. coli guideline of 100 colony forming units (CFU) per 100 ml set by the PWQO; across the lake the count at the geometric mean was 4 CFU/100ml (Table 10). This provides support that there is little indication of bacterial contamination around the lake.
| E. coli 2006-2017 | |||
|---|---|---|---|
| Site | Geometric mean (CFU/100ml) | Below Guideline | No. Samples |
| A-B | 4 | 100% | 14 |

Figure 22 show the distribution of counts across all shoreline sites. All sites fell well below the guideline of 100 CFU/100ml.
Summary of Little Crosby Lake Bacterial Contamination
The results presented above indicate that bacterial contamination is not a significant concern in Little Crosby Lake and the water should be safe for recreational use such as swimming and boating.
2.3 Pike Lake Water Quality
Surface water quality conditions in Pike Lake have been monitored by RVCA’s Watershed Watch Program since 2006. Data from the deep point site (DP1) has been used to calculate the WQI rating for Pike Lake, which averaged “Very Good" over the 2006-2017 period (Table 1). Low nutrient concentrations, good oxygen availability and clear water all influenced this rating. The following discussion explains how each of the monitored water quality parameters contributes to the lake’s water quality.
This report also considers data from eight additional shoreline sites that are monitored around the lake. These sites have not been included in the calculation of the CCME WQI rating, as they are not monitored with the same frequency as the deep point site. However, they do provide important information on water quality conditions in the near shore areas. For locations of shoreline sites (A-H, K) please see Figure 1.
2.3.1 Pike Lake Nutrients
Total phosphorus (TP) is used as a primary indicator of excessive nutrient loading and contributes to abundant aquatic vegetation growth and depleted dissolved oxygen levels. The Provincial Water Quality Objective (PWQO) is used as the TP Guideline and states that in lakes, concentrations greater than 0.020 mg/l indicate an excessive amount of TP within the water column. Concentrations below 0.010 mg/l are generally considered to be minimal and unlikely to have problems associated with nutrient loading.
Total Kjeldahl nitrogen (TKN) is used as a secondary indicator of nutrient loading. RVCA uses a guideline of 0.500 mg/l to assess TKN[1] within surface waters.
Nutrients at the Pike Lake Deep Point
TP and TKN sampling results collected by the RVCA are presented in Figures 23 to 26. Some variability has occurred in the sampled TP concentrations at this site (Figure 23 and 24), with no significant trend[2] was observed in the 2006-2017 data set. Ninety-eight percent of samples analyzed for TP were less than the TP guideline and the average concentration was 0.011 mg/l (Table 11). TKN concentration also showed variability though no significant change was observed (Figures 25 and 26). Ninety-eight percent of reported results were also below the TKN guideline and the average TKN concentration was 0.371 mg/l (Table 11).
 on Pike Lake, 2006-2017")
 on Pike Lake, 2006-2017")
 on Pike Lake, 2006-2017.")
 on Pike Lake, 2006-2017.] Figure 25 Total Kjeldahl nitrogen sampling results at the deep point site (DP1) on Pike Lake, 2006-2017. Figure 26 Average total Kjeldahl nitrogen sampling results at the deep point site (DP1) on Pike Lake, 2006-2017.")
| Total Phosphorous 2006-2017 | |||
|---|---|---|---|
| Site | Average (mg/l) | Below Guideline | No. Samples |
| DP1 | 0.011 | 89% | 48 |
| Total Kjeldahl Nitrogen 2006-2017 | |||
| Site | Average (mg/l) | Below Guideline | No. Samples |
| DP1 | 0.371 | 89% | 48 |
Overall, the data presented indicates that nutrient concentration may be considered low with occasional exceedances in the mid-lake, deep water site on Pike Lake.
Nutrients around Pike Lake
The average nutrient concentrations at monitored shoreline sites around the lake vary from year to year (Figures 27 and 28). Please note that in the 2006-2017 monitoring period sites A, D, F and G were monitored yearly; while sites B, C, E, G, H and K were only sampled in 2006, 2011 and 2016.
Average total phosphorous concentrations are below the TP guideline at all of sites, with the exception of site D. Site D drains a significant wetland area and Stanleyville dump, this location has previously been investigated due to consistently elevated nutrient concentrations at this location. At that time nothing was found to explain the elevated results other than the influence of nutrient attenuation by the wetlands. Similar results were also observed in TKN concentrations, which were also below the guideline at all sites with the exception of site D (Figure 28).


Summary of Pike Lake Nutrients
Pike Lake nutrient concentrations are generally below the guidelines, with few exceedances. It is possible that occasional problems with nutrient enrichment (i.e. algal blooms or excessive plant growth) may be observed in shallow, sheltered bays such as site D.
Efforts such as the diversion of runoff and enhanced shoreline buffers are important to continue to protect and enhance water quality, and reduce future nutrient increases. Nutrient exceedances may be partially attributed to the natural aging of a lake and basin characteristics. All residents can help minimize their impact on the lake by reducing nutrient inputs through practices such as proper maintenance of septic systems, keeping shorelines natural and using phosphate free soaps and detergents. Promotion of sound stewardship and protection around lake is important to maintain and protect water quality conditions into the future.
2.3.2 Pike Lake Water Clarity
Water clarity is measured using a Secchi disk during each deep point sample. Table 12 summarizes the recorded depths with an average depth of 4.5 m and shows that all readings have exceeded the minimum PWQO of 2 m indicating that algae in the water column is not at excessive levels (good water clarity). Less than 2 m will indicate overproduction in a lake or significant inputs to the water column that are limiting light availability. Figure 9 shows that no individual reading has been below the guideline and measured depths range from 2.0 m to 7.0 m. A decreasing trend was observed within the 2006-2017 data set, indicating that Secchi depths have been reduced over this period.
| Secchi 2006-2017 | |||
|---|---|---|---|
| Site | Average (m) | Above Guideline | No. Samples |
| DP1 | 4.5 | 98% | 47 |
 on Pike Lake, 2006-2017.")
Summary of Pike Lake Water Clarity
Waters in Pike Lake are very clear and sufficient sunlight is able to penetrate the water column to support aquatic life and provide sufficient visibility for safe recreational use (boating, swimming).
2.3.3 Pike Lake Fish Habitat
Two other factors, dissolved oxygen/temperature and pH were also assessed to provide an overall sense of the health of Pike Lake from a fish habitat perspective.
2.3.3.1 Pike Lake Dissolved Oxygen and Temperature
The red bars in Figure 30 show the depths where suitable conditions exist for warm water fish species (temperature less than 25°C and dissolved oxygen greater than 4 mg/l) at the deep point site. The vertical axis represents the total lake depth at each site where the profile is taken. Suitable conditions typically decline throughout the summer to about 20 m of the water column. Overall, no significant change was noted in conditions through the 2006-2017 period.
 on Pike Lake, 2006-2017.")
2.3.3.2 Pike Lake pH
pH is a basic water quality parameter used to assess the acidity of water, an important factor for aquatic life. Figure 31 shows monitored pH values over the 2006-2017 period.

The majority of samples for both time periods were within guidelines established by the Canadian Council of Minister's of the Environment which state that pH should be between 6.5 and 9 to protect aquatic life (Table 5). Surface water’s that are found to be more alkaline (higher pH) are common in many regions of the Tay River subwatershed and can generally be attributed to the geology rather than anthropogenic activities. Biological activities such as increased photosynthesis from algal blooms and plant growth may also influence pH.
| pH 2006-2017 | |||
|---|---|---|---|
| Site | Average (mg/l) | Within Guideline | No. Samples |
| DP1 | 8.00 | 100% | 39 |
Summary of Water Quality for Fish Habitat in Pike Lake
Overall the water chemistry data at the deep point describes suitable habitat conditions for warm water fish species such as yellow perch, walleye and pike. There is some evidence that the warming of the water column in the late summer/fall may limit the amount of habitat for some sensitive species. pH conditions are within the range recommended for the protection of aquatic life. Overall, the data indicates a healthy environment for aquatic species.
2.3.4 Pike Lake E. Coli
E. coli is sampled at monitored shoreline sites twice each sampling season. E. coli data was not used in the calculations of the WQI rating for the lake due to differences in sampling frequency and site locations. E. coli data has been summarized in Table 14. Throughout the 2006-2017 period 100 percent of samples collected by RVCA were below the E. coli guideline of 100 colony forming units (CFU) per 100 ml set by the PWQO; across the lake the count at the geometric mean was 4 CFU/100ml (Table 14). This provides support that there is little indication of bacterial contamination around the lake.
| E. coli 2006-2017 | |||
|---|---|---|---|
| Site | Geometric mean (CFU/100ml) | Below Guideline | No. Samples |
| A-K | 4 | 100% | 124 |

Figure 32 shows the distribution of E. coli counts across all shoreline sites. All sites fell well below the guideline of 100 CFU/100ml.
Summary of Pike Lake Bacterial Contamination
The results presented above indicate that bacterial contamination is not a significant concern in Pike Lake and the water should be safe for recreational use such as swimming and boating.
[1] No Ontario guideline for TKN is presently available; however, waters not influenced by excessive organic inputs typically range from 0.100 to 0.500 mg/l, Environment Canada (1979) Water Quality Sourcebook, A Guide to Water Quality Parameters, Inland Waters Directorate, Water Quality Branch, Ottawa, Canada
[2] Trends in the data were assessed using the Mann-Kendall trend test and Sens slope statistic.
[3] A type of mean or average, which indicates the central tendency or typical value of a set of numbers by using the product of their values (as opposed to the arithmetic mean which uses their sum). It is often used to summarize a variable that varies over several orders of magnitude, such as E. coli counts.