The Jock River flows from wetland headwaters in Beckwith and Montague Townships near Franktown, through the rich agricultural lands in the former municipalities of Goulbourn and Nepean, and finally through Barrhaven in Ottawa’s South Urban Community to the Rideau River just north of Manotick.
Drainage Area: 555 square kilometres Length of River: 75 kilometres
Catchments: Flowing Creek, Hobbs Drain,Jenkinson Drain,Jock River Ashton to Dwyer Hill,Jock River Barrhaven,Jock River Franktown,Leamy Creek,Jock River Richmond,Jock River Richmond Fen,Kings Creek,Monahan Drain,Nichols Creek
Catchment Reports
The RVCA produces individual reports on the Rideau watershed’s catchments. These catchment reports are a compilation of data collected through the RVCA’s watershed monitoring and land cover classification programs.
Catchment information is used to develop subwatershed reports that summarize the health of the Rideau’s six main subwatersheds.
Jock River Subwatershed Report 2016
FLOWING CREEK CATCHMENT
The RVCA produces individual reports for 12 catchments in the Jock River subwatershed. Using data collected and analyzed by the RVCA through its watershed monitoring and land cover classification programs, surface water quality and in-stream conditions are reported for the Jock River along with a summary of environmental conditions for the surrounding countryside every six years.
This information is used to better understand the effects of human activity on our water resources, allows us to better track environmental change over time and helps focus watershed management actions where they are needed the most to help sustain the ecosystem services (cultural, aesthetic and recreational values; provisioning of food, fuel and clean water; regulation of erosion/natural hazard protection and water purification; supporting nutrient/water cycling and habitat provision) provided by the catchment’s lands and forests and waters (Millennium Ecosystem Assessment 2005).
The following sections of this report for the Flowing Creek catchment are a compilation of that work.
| Catchment Facts |
Section 1.0 |
| Surface Water Quality Conditions |
Section 2.0 |
| Riparian Conditions |
Section 3.0 |
| Land Cover |
Section 4.0 |
| Land Stewardship and Water Resources Protection |
Section 5.0 |
| Challenges/Issues |
Section 6.0 |
| Actions/Opportunities |
Section 7.0 |
For other Jock River catchments and the Jock River Subwatershed Report, please visit the RVCA website at www.rvca.ca

Figure 1 Land cover in the Flowing Creek catchment
1.0 Flowing Creek Catchment: Facts
1.1 General/Physical Geography
Municipalities
- Ottawa: (50 km2; 100% of catchment)
Geology/Physiography
- The Flowing Creek Catchment resides within a transitionary area between the Ottawa Valley Clay Plain to the east and the Smith Falls Limestone Plain to the West. While Champlain Sea sediment (silt and clay) lie in the eastern part of the catchment at significant depths; esker and beach sands and gravels, sand plains and some glacial till blanket the central part. Bedrock lies at the ground surface throughout the western part of the catchment and is overlain by extensive organic soils
- In this catchment, bedrock includes the interbedded limestone and dolostone, sandstone with shale and limestone, dolostone, and some limestone respectively from the Gull River, Rockcliffe, Oxford and Bobcaygeon Formations. In addition, several geologic faults may pass through the catchment
Karst/Topography
- The ground surface ranges in elevation from approximately 155 masl near Hwy 7 to approximately 92 masl at the catchment’s outlet
- Surficial karst is known to exist in the northern part of the catchment
Drainage Area
- 50 square kilometers; occupies nine percent of the Jock River subwatershed, one percent of the Rideau Valley watershed
Stream Length
- Flowing Creek and tributaries: 106 km
1.2 Vulnerable Areas
Flood/Erosion Hazard
- Flowing Creek is subject to a flooding hazard during the regional storm flood (the 100 year flood). Surveys and studies undertaken in accordance with provincial standards have determined that the 100 year flood elevation in the catchment is 93.6 metres above mean sea level for the mapped extent of the regulation limit extending from Perth Street in Richmond upstream to Garvin Road
Aquifer Vulnerability
- The Mississippi-Rideau Source Protection initiative has mapped the middle of this catchment as a significant groundwater recharge area; and the western extent of the catchment as Highly Vulnerable Aquifer. Parts of Wellhead Protection Areas (WHPA) C and D for the municipal wells in Richmond underlie the southern quarter of this catchment
Wetland Hydrology
- A watershed model developed by the RVCA in 2009 was used to study the hydrologic function of wetlands in the Rideau Valley Watershed, including those found in the Flowing Creek catchment
1.3 Conditions at a Glance
Water Quality
- Surface chemisty water quality rating in the Flowing Creek catchment is “Fair”at the upstream site (CK67-008) and “Poor” at the downstream site (CK67-001). The upstream site is largely influenced by elevated nutrient concentrations and high E. coli counts, while the downstream site reported persistently elevated nutrient concentrations and E. coli counts, as well as high metal concentrations (between 2004 to 2009 and 2010 to 2015). This points to a deterioration of water quality as it flows to the downstream reaches of Flowing Creek
- Instream biological water quality conditions for Flowing Creek are unknown
Instream and Riparian
- Overall instream and riparian condition for Flowing Creek is unknown
Thermal Regime
- Warm/cool water thermal guild supporting the Jock River fishery
Fish Community
- Twenty-four species of recreational and bait fish
Shoreline Cover Type (30 m. riparian area; 2014)
- Crop and Pasture (47%)
- Woodland (20%)
- Wetland (17%)
- Transportation (7%)
- Settlement (6%)
- Meadow-Thicket (3%)
- Aggregate (1%)
Land Cover Type (2014)
- Crop and Pasture (46%)
- Woodland (24%)
- Settlement (11%)
- Wetland (9%)
- Transportation (3%)
- Aggregate (3%)
- Meadow-Thicket (3%)
- Water (<1%)
Land Cover Change (2008 to 2014)
- Woodland (-98 ha)
- Crop and Pasture (-3 ha)
- Transportation (+1 ha)
- Wetland (+1 ha)
- Water (+2 ha)
- Aggregate (+27 ha)
- Settlement (+27 ha)
- Meadow-Thicket (+43 ha)
Significant Natural Features
- Goulbourn Provincially Significant Wetland
Water Wells
- Several hundred (~700) operational private water wells in the Flowing Creek Catchment. Groundwater uses are mainly domestic, but also include significant livestock watering, groundwater monitoring and testing, municipal and other public water supplies and commercial uses
Aggregates
- Parts of 2 bedrock quarry licenses and 4 sand and gravel pit licenses located within the catchment
Species at Risk (Elemental Occurrence)
- Spotted Turtle (Endangered)
- Blanding’s Turtle, Bobolink, Eastern Meadowlark (Threatened)
- Eastern Milksnake, Snapping Turtle, Yellow Rail (Special Concern)
1.4 Catchment Care
Stewardship
- Forty stewardship projects undertaken (see Section 5)
Environmental Monitoring
- Chemical surface (in-stream) water quality collection since 2003 (see Section 2)
- Fourteen headwater drainage feature assessments in 2015 at road crossings in the catchment. The protocol measures zero, first and second order headwater drainage features and is a rapid assessment method characterizing the amount of water, sediment transport, and storage capacity within headwater drainage features (see Section 3.2)
- Groundwater chemistry information is available from the Ontario Geological Survey for a well located in the catchment
Environmental Management
- Development along Flowing Creek and in and adjacent to the Goulbourn Provincially Significant Wetland in the catchment is subject to Ontario Regulation 174-06 (entitled “Development, Interference with Wetlands and Alterations to Shorelines and Watercourses”) that protects the hydrologic function of the wetland and also protects landowners and their property from natural hazards (flooding, fluctuating water table, unstable soils) associated with them
- Nine active Permits To Take Water (PTTW) in the Flowing Creek catchment issued for pit /quarry dewatering, industrial uses, and construction dewatering
- Ten Environmental Compliance Approvals and/or Environmental Activity and Sector Registrations in the Flowing Creek Catchment. These are mainly for municipal or private sewage works and industrial sewage works
2.0 Flowing Creek Catchment: Surface Water Quality Conditions
Surface water quality conditions in the Flowing Creek catchment are monitored by the City of Ottawa Baseline Water Quality Monitoring Program. This program provides information on the condition of Ottawa’s surface water resources; data is collected for multiple parameters including nutrients (total phosphorus, total Kjeldahl nitrogen and ammonia), E. coli, metals (like aluminum and copper) and additional chemical/physical parameters (such as alkalinity, chlorides, pH and total suspended solids). The locations of monitoring sites are shown in Figure 2 and Table 1.
Figure 2 Water quality monitoring sites on Flowing Creek
2.1 Flowing Creek Water Quality Rating
The RVCA's water quality rating for monitored sites on Flowing Creek (CK67-001 and CK67-008) range from “Poor” to “Fair” (Table 1) as determined by the Canadian Council of Ministers of the Environment (CCME) Water Quality Index (WQI)[1]. A “Fair” rating indicates that water quality is usually protected but is occasionally threatened or impaired; conditions sometimes depart from natural or desirable levels. A “Poor” rating indicates that water quality is frequently threatened or impaired; conditions often depart from natural or desirable levels. Parameters are evaluated against established guidelines to determine water quality conditions. Those parameters that frequently exceed guidelines are presented below. Analysis of the data has been broken into two periods; 2004 to 2009 and 2010 to 2015 to examine if conditions have changed between these periods. Table 1 shows the overall rating for the monitored surface water quality sites within the Flowing Creek catchment and Table 2 outlines the Water Quality Index (WQI) scores and their corresponding ratings.
Between the 2004-2009 and 2010-2015 time frames the water quality score at site CK67-001 has declined, but has retained a rating of POOR across both periods (Table 1). There is no data available for the 2004-2009 period at site CK67-008, in the 2010-2015 period the rating was determined to be FAIR with a WQI score of 74. The scores at these sites are largely influenced by frequent high nutrient concentrations. For more information on the CCME WQI, please see the Jock River Subwatershed Report.
Table 1 Water Quality Index ratings for the Flowing Creek Catchment
Table 2 Water Quality Index rations and corresponding index scores (RVCA terminology, original WQI category names in brackets)
2.2 Nutrients
Total phosphorus (TP) is used as a primary indicator of excessive nutrient loading and may contribute to abundant aquatic vegetation growth and depleted dissolved oxygen levels. The Provincial Water Quality Objective (PWQO) is used as the TP Guideline and states that in streams concentrations greater than 0.030 mg/l indicate an excessive amount of TP.
Total Kjeldahl nitrogen (TKN) and ammonia (NH3) are used as secondary indicators of nutrient loading. RVCA uses a guideline of 0.500 mg/l to assess TKN[2] and the PWQO of 0.020 mg/l to assess NH3 concentrations in the Jock River.
Tables 3, 4 and 5 summarize average nutrient concentrations at monitored sites within the Flowing Creek catchment and show the proportion of results that meet the guidelines.
Table 3 Summary of total phosphorus results for the Flowing Creek catchment, 2004-2009 and 2010-2015. Highlighted values indicate average concentrations exceed the guideline
Table 4 Summary of total Kjeldahl nitrogen results for the Flowing Creek catchment from 2004-2009 and 2010-2015. Highlighted values indicate average concentrations exceed the guideline
Table 5 Summary of ammonia results for the Flowing Creek catchment from 2004-2009 and 2010-2015. Highlighted values indicate average concentrations exceed the guideline
Monitoring Site CK67-001
The majority of samples at site CK67-001 were above the TP guideline in both the 2004-2009 and 2010-2015 periods (Figures 3, and 4) . The number of sample results below the TP guideline improved slightly from 11 percent in 2004-2009 to 27 percent in 2010-2015 (Table 3). Though more samples were below the guideline the average TP concentrations increased from 0.057 mg/l (2003–2008) to 0.082 mg/l (2009–2014).
TKN concentrations show that the bulk of results exceeded the guideline (Figures 5 and 6); 17 percent of samples were below the guideline in the 2004-2009 period, this declined to only two percent in the 2010-2015 period. The average concentration was elevated and increased from 0.746 mg/l to 0.785 mg/l (Table 4).
In the 2004-2009 reporting period 37% of NH3 results were below the guideline with an average concentration of 0.054 mg/l (Figure 7, Table 5). The percentage of results below the guideline declined to 22% in the 2010-2015 period, the average concentrations declined slightly to 0.050 mg/l (Figure 8, Table 5).
Monitoring Site CK67-008
TP results were typically below the guideline at site CK67-008; 84 percent of samples were below the guideline in the 2010-2015 period (Figure 4). The average TP concentration during this same time frame was 0.021 mg/l (Table 3).
The bulk of TKN results have exceeded the guideline (Figure 6), with 16 percent of samples below the guideline in the 2010-2015 period. The average concentration was elevated at 0.685 mg/l (Table 3).
The results for NH3 indicate that occasional exceedances occurred. Seventy-five percent of results were below the guideline in the 2010-2015 reporting period (Figure 8). The average NH3 concentration was just above the guideline at 0.022 mg/l (Table 5).
Figure 3 Total phosphorous concentrations in Flowing Creek, 2004-2009
Figure 4 Total phosphorous concentrations in Flowing Creek, 2010-2015
Figure 5 Total Kjeldahl nitrogen concentrations Flowing Creek, 2004-2009
Figure 6 Total Kjeldahl nitrogen concentrations in Flowing Creek, 2010-2015
Figure 7 Ammonia concentrations in Flowing Creek, 2004-2009
Figure 8 Ammonia concentrations in Flowing Creek, 2010-2015
Summary
Nutrient enrichment is a feature of Flowing Creek. Most nutrient parameters (total phosphorus, total Kjeldahl nitrogen and ammonia) are above guidelines at each site, apart from TP concentrations in the upstream site (CK67-008). Elevated nutrients may result in nutrient loading downstream and to the Jock River. High nutrient concentrations stimulate the growth of algae blooms and aquatic vegetation in a waterbody, and deplete oxygen levels as the vegetation dies off and decompose. Average concentrations for TP and TKN are particularly high in April, likely due to spring time runoff conditions. Increased nutrients concentrations also appear to be an issue in the late summer and early fall. Best management practices such as improved storms water management, enhanced shoreline buffers, preventing the use of fertilizers and restricting livestock access in agricultural areas can help to reduce nutrient enrichment.
2.3 Escherichia coli
E. coli is used as an indicator of bacterial pollution from human or animal waste; in elevated concentrations it can pose a risk to human health. The PWQO of 100 colony forming units/100 millilitres (CFU/100 ml) is used. E. coli counts greater than this guideline indicate that bacterial contamination may be a problem within a waterbody.
Table 6 summarizes the geometric mean[3] for the monitored sites within the Flowing Creek catchment and shows the proportion of samples that meet the E. coli guideline of 100 CFU/100 ml. The results of the geometric mean with respect to the guideline for the two periods, 2004-2009 and 2010-2015, are shown in Figures 9 and 10 respectively.
Table 6 Summary of
E. coli results for Flowing Creek, 2004-2009 and 2010-2015
Monitoring Site CK67-001
E. coli counts at site CK67-001 indicate little change with regard to bacterial contamination (Figures 9 and 10). The proportion of samples below the guideline rose marginally from 25 percent to 27 percent. The count at the geometric mean increased from 221 CFU/100ml in 2004-2009 to 262 CFU/100ml in 2010-2015 (Table 6).
Monitoring Site CK67-008
Elevated E. coli counts at site CK67-008 occurred regularly at this site (Figure 10). Forty-three percent of samples were below the guideline in the 2010-2015 period, and the count at the geometric mean was just below the PWQO at 99 CFU/100ml (Table 6).
Figure 9 Geometric mean of E. coli results in Flowing Creek, 2004-2009
Figure 10 Geometric mean of E. coli results in Flowing Creek, 2010-2015
Summary
Bacterial contamination appears to be a significant concern in Flowing Creek; at both sites (CK67-001 and CK67-008) regular exceedances occur andthe geometric mean exceeds or is just below the guideline of 100 CFU/100ml. Best management practices such as enhancing shoreline buffers and limiting livestock access should be employed wherever possible to help to improve water quality conditions on Flowing Creek and its impact on the Jock River.
2.4 Metals
Of the metals routinely monitored in Flowing Creek, aluminum (Al), copper (Cu) and iron (Fe) reported concentrations above their respective PWQOs, particularly at the downstream site (CK67-001). In elevated concentrations, these metals can have toxic effects on sensitive aquatic species. The PWQO for Al is 0.075 mg/l, for Cu it is 0.005 mg/l and Fe is 0.300 mg/l.
Tables 7, 8 and 9 summarize metal concentrations at sites CK67-001 and CK67-008, as well as show the proportion of samples that meet guidelines. Figures 11 to 16 show metal concentrations with respect to the guidelines for the two periods of interest, 2004-2009 and 2010-2015.
Table 7 Summary of aluminum results for Flowing Creek from 2004-2009 and 2010-2015. Highlighted values indicate average concentrations exceed the guideline
Table 8 Summary of copper results for Flowing Creek from 2004-2009 and 2010-2015. Highlighted values indicate average concentrations exceed the guideline
Table 9 Summary of iron results for Flowing Creek from 2004-2009 and 2010-2015. Highlighted values indicate average concentrations exceed the guideline
Monitoring Site CK67-001
The Al concentrations at site CK67-001 far exceeded the guideline. Only two percent of samples were below the guideline from 2004-2009 (Figure 11), this declined to no results reporting below the guideline from 2010-2015 (Figure 12). The average concentration increased from 0.443 mg/l to 0.664 mg/l (Table 7).
Copper concentrations occasionally exceeded the PWQO, with 70 percent of samples below the guideline in 2004-2009 (Figure 13). The Cu concentrations were consistent into the 2010-2015 period, with 71 percent of samples below the guideline in 2010-2015 (Figure 14). The average concentration of copper marginally decreased during the two reporting periods from 0.005 mg/l to 0.004 mg/l (Table 8).
Results from CK67-001 indicated that Fe concentrations exceeded the guideline. The proportion of samples below the guideline was unchanged at 25 percent between the two reporting periods (Figures 15 and 16). During the 2004-2009 reporting period average Fe concentrations were above the guideline with a concentration of 0.579 mg/l this increased to 0.845 mg/l in the 2010-2015 period (Table 9).
Monitoring Site CK67-008
Results from CK67-008 are only available for the 2010-2015 period. Results show that Al concentrations often meet the objective with 77 percent of samples below the guideline (Figure 11). The average concentration of Al was below the guideline at 0.071 mg/l (Table 7).
Copper concentrations have occasionally exceeded the guideline. In the 2010-2015 period 88 percent of samples were below the guideline (Figure 14). The average concentration was below the guideline at 0.0020 mg/l (Table 8).
The majority of Fe results were below the guideline; 88 percent of samples were below the guideline in the 2010-2015 period (Figure 16). The average concentration was below the guideline in the 2010-2015 reporting period with a concentration of 0.180 mg/l (Table 9).
Figure 11 Average aluminum concentrations in Flowing Creek, 2004-2009
Figure 12 Average aluminum concentrations in Flowing Creek, 2010-2015
Figure 13 Average copper concentrations in Flowing Creek, 2004-2009
Figure 14 Average copper concentrations in Flowing Creek, 2010-2015
Figure 15 Average iron concentrations in Flowing Creek, 2004-2009
Figure 16 Average iron concentrations in Flowing Creek, 2010-2015
Summary
Concentrations of both iron and aluminum have increased within this catchment, and average concentrations exceed the guideline at site CK67-001. There has been increased development directly upstream of this site and it is possible that these increases may be due to increased runoff from surfaces and traffic. Efforts should continue to be made to identify pollution sources and implement best management practices in both the urbanized and rural areas to reduce any inputs such as storm water runoff, metal alloys, fungicides and pesticides to improve overall stream health and lessen downstream impacts.
1 The City of Ottawa Baseline Water Quality Monitoring Program has also applied the CCME WQI to monitored sites. The parameters used and time periods differs between the RVCA and City of Ottawa’s application of the WQI, resulting in different ratings at some sites.
2 No Ontario guideline for TKN is presently available; however, waters not influenced by excessive organic inputs typically range from 0.100 to 0.500 mg/l, Environment Canada (1979) Water Quality Sourcebook, A Guide to Water Quality Parameters, Inland Waters Directorate, Water Quality Branch, Ottawa, Canada
3 A type of mean or average, which indicates the central tendency or typical value of a set of numbers by using the product of their values (as opposed to the arithmetic mean which uses their sum). It is often used to summarize a variable that varies over several orders of magnitude, such as E. coli counts
3.0 Flowing Creek Catchment: Riparian Conditions
3.1 Flowing Creek Instream Aquatic Habitat
3.1.1 Benthic Invertebrates
Freshwater benthic invertebrates are animals without backbones that live on the stream bottom and include crustaceans such as crayfish, molluscs and immature forms of aquatic insects. Benthos represent an extremely diverse group of aquatic animals and exhibit wide ranges of responses to stressors such as organic pollutants, sediments and toxicants, which allows scientists to use them as bioindicators. As part of the Ontario Benthic Biomonitoring Network (OBBN), the RVCA has been collecting benthic invertebrates at the Garvin Road site on Flowing Creek since 2004. Monitoring data is analyzed for each sample site and the results are presented using the Family Biotic Index, Family Richness and percent Ephemeroptera, Plecoptera and Trichoptera.
Hilsenhoff Family Biotic Index
The Hilsenhoff Family Biotic Index (FBI) is an indicator of organic and nutrient pollution and provides an estimate of water quality conditions for each site using established pollution tolerance values for benthic invertebrates. FBI results for Flowing Creek catchment sample location at Garvin Road are separated by reporting period 2004 to 2009 and 2010 to 2015. “Fair” to “Poor” water quality conditions were observed at the Flowing Creek sample location for the period from 2004 to 2015 (Fig.17) using a grading scheme developed by Conservation Authorities in Ontario for benthic invertebrates.
Figure 17 Hilsenhoff Family Biotic Index for Flowing Creek at the Garvin Road sample location
Family Richness
Family Richness measures the health of the community through its diversity and increases with increasing habitat diversity suitability and healthy water quality conditions. Family Richness is equivalent to the total number of benthic invertebrate families found within a sample. Flowing Creek site is reported to have “Fair” family richness (Fig.18).
Figure 18 Family Richness for Flowing Creek at the Garvin Road sample location
EPT
Ephemeroptera (Mayflies), Plecoptera (Stoneflies), and Trichoptera (Caddisflies) are species considered to be very sensitive to poor water quality conditions. High abundance of these organisms is generally an indication of good water quality conditions at a sample location. The benthic invertebrate community structure is dominated by species that are tolerant to poor water quality conditions. As a result, the EPT indicates that Flowing Creek sample location is reported to have “Poor” water quality (Fig.19) from 2004 to 2015.
Figure 19 EPT for Flowing Creek at the Garvin Road sample location
Site conditions on Flowing Creek at the Garvin Road OBBN sample location
Conclusion
Overall Flowing Creek sample location aquatic habitat conditions from a benthic invertebrate perspective is considered “Poor” from 2004 to 2015 as the samples are dominated by species that are tolerant to high organic pollution levels.
3.1.2 Thermal Regime
Many factors can influence fluctuations in stream temperature, including springs, tributaries, precipitation runoff, discharge pipes and stream shading from riparian vegetation. Water temperature is used along with the maximum air temperature (using the Stoneman and Jones method) to classify a watercourse as either warm water, cool water or cold water. Figure 20 shows where the thermal sampling sites were located on Flowing Creek. Analysis of the data collected indicates that Flowing Creek is classified as a warm water system with cool to warm water reaches (Figure 21).
Figure 20 Temperature logger locations in the Flowing Creek catchment on Garvin Road
Figure 21 Temperature logger data for the site location on Flowing Creek.
Each point on the graph represents a temperature that meets the following criteria:
- Sampling dates between July 1st and September 7th
- Sampling date is preceded by two consecutive days above 24.5 °C, with no rain
- Water temperatures are collected at 4pm
- Air temperature is recorded as the max temperature for that day
3.1.3 Groundwater
Groundwater discharge areas can influence stream temperature, contribute nutrients, and provide important stream habitat for fish and other biota. During headwater surveys, indicators of groundwater discharge are noted when observed. Indicators include: springs/seeps, watercress, iron staining, significant temperature change and rainbow mineral film. Figure 22 shows areas where one or more of the above groundwater indicators were observed during headwater drainage feature assessments.
Figure 22 Groundwater indicators observed in the Flowing Creek catchment
3.1.4 Fish Community
The Flowing Creek catchment is classified as a mixed community of warm and cool water recreational and baitfish fishery with 24 species observed. Figure 23 shows the RVCA sampling locations in the Flowing Creek catchment.
Figure 23 Flowing Creek catchment fish community
The following table contains a list of species observed in the watershed.
Table 10 Fish species observed in Flowing Creek catchment
3.2 Flowing Creek Headwater Drainage Features Assessment
3.2.1 Headwaters Sampling Locations
The RVCA Stream Characterization program assessed Headwater Drainage Features for the Jock River subwatershed in 2015. This protocol measures zero, first and second order headwater drainage features (HDF). It is a rapid assessment method characterizing the amount of water, sediment transport, and storage capacity within headwater drainage features (HDF). RVCA is working with other Conservation Authorities and the Ministry of Natural Resources and Forestry to implement the protocol with the goal of providing standard datasets to support science development and monitoring of headwater drainage features. An HDF is a depression in the land that conveys surface flow. Additionally, this module provides a means of characterizing the connectivity, form and unique features associated with each HDF (OSAP Protocol, 2013). In 2015 the program sampled 14 sites at road crossings in the Flowing Creek catchment area (Figure 24).

Figure 24 Locations of the headwater sampling sites in the Flowing Creek catchment
3.2.2 Headwater Feature Type
The headwater sampling protocol assesses the feature type in order to understand the function of each feature. The evaluation includes the following classifications: defined natural channel, channelized or constrained, multi-thread, no defined feature, tiled, wetland, swale, roadside ditch and pond outlet. By assessing the values associated with the headwater drainage features in the catchment area we can understand the ecosystem services that they provide to the watershed in the form of hydrology, sediment transport, and aquatic and terrestrial functions. Six features were classified as having been channelized, four features were classified as wetland, two features were road side ditches and two features were identified as natural. Figure 25 shows the feature type of the primary feature at the sampling locations.
Figure 25 Headwater feature types in the Flowing Creek catchment
3.2.3 Headwater Feature Flow
The observed flow condition within headwater drainage features can be highly variable depending on timing relative to the spring freshet, recent rainfall, soil moisture, etc. Flow conditions are assessed in the spring and in the summer to determine if features are perennial and flow year round, if they are intermittent and dry up during the summer months or if they are ephemeral systems that do not flow regularly and generally respond to specific rainstorm events or snowmelt. Flow conditions in headwater systems can change from year to year depending on local precipitation patterns. Figure 26 shows the observed flow conditions at the sampling locations in the Flowing Creek catchment in 2015.
Figure 26 Headwater feature flow conditions in the Flowing Creek catchment
A spring photo of the headwater sample site in the Flowing Creek catchment located on Flewellyn Road
A summer photo of the headwater sample site in the Flowing Creek catchment located on Flewellyn Road
3.2.4 Feature Channel Modifications
Many of the headwater drainage features within the Flowing Creek catchment area are classified as municipal drains. Channel modifications were assessed at each headwater drainage feature sampling location. Modifications include dredging, channel hardening and mixed modifications. The Flowing Creek catchment area had five features with no modifications, one feature was classified as being hardened, seven classified as dredged and one was identified as having mixed modifications. Figure 27 shows the channel modifications observed at the sampling locations for Flowing Creek.
Figure 27 Headwater feature channel modifications in the Flowing Creek catchment
3.2.5 Headwater Feature Vegetation
Headwater feature vegetation evaluates the type of vegetation that is found within the drainage feature. The type of vegetated within the channel influences the aquatic and terrestrial ecosystem values that the feature provides. For some types of headwater features the vegetation within the feature plays a very important role in flow and sediment movement and provides fish and wildlife habitat. The following classifications are evaluated no vegetation, lawn, wetland, meadow, scrubland and forest. The features assessed in the Flowing Creek catchment were classified as being dominated by wetland and meadow vegetation. Two features were classified as having no vegetation and one feature was dominated by recently cut grasses (lawn) within the channel. Figure 28 depicts the dominant vegetation observed at the sampled headwater sites in the Flowing Creek catchment.
Figure 28 Headwater feature vegetation types in the Flowing Creek catchment
3.2.6 Headwater Feature Riparian Vegetation
Headwater riparian vegetation evaluates the type of vegetation that is found along the adjacent lands of a headwater drainage feature. The type of vegetation within the riparian corridor influences the aquatic and terrestrial ecosystem values that the feature provides to the watershed. Five sample locations in Flowing Creek were dominated by natural vegetation in the form of scrubland and meadow vegetation. Nine sample locations were dominated by other forms of vegetation of either crops or ornamental grasses. Figure 29 depicts the type of riparian vegetation observed at the sampled headwater sites in the Flowing Creek catchment.
Figure 29 Headwater feature riparian vegetation types in the Flowing Creek catchment
3.2.7 Headwater Feature Sediment Deposition
Assessing the amount of recent sediment deposited in a channel provides an index of the degree to which the feature could be transporting sediment to downstream reaches (OSAP, 2013). Evidence of excessive sediment deposition might indicate the requirement to follow up with more detailed targeted assessments upstream of the site location to identify potential best management practices to be implemented. Conditions ranged from no deposition observed to extensive deposition recorded. Figure 30 depicts the degree of sediment deposition observed at the sampled headwater sites in the Flowing Creek catchment.
Figure 30 Headwater feature sediment deposition in the Flowing Creek catchment
3.2.8 Headwater Feature Upstream Roughness
Feature roughness will provide a measure of the amount of materials within the bankfull channel that could slow down the velocity of water flowing within the headwater feature (OSAP, 2013). Materials on the channel bottom that provide roughness include vegetation, woody debris and boulders/cobble substrates. Roughness can provide benefits in mitigating downstream erosion on the headwater drainage feature and the receiving watercourse by reducing velocities. Roughness also provides important habitat conditions for aquatic organisms. The sample locations in the Flowing Creek catchment area ranged from minimal to extreme roughness conditions. Figure 31 shows the feature roughness conditions at the sampling locations in the Flowing Creek catchment.
Figure 31 Headwater feature roughness in the Flowing Creek catchment
4.0 Flowing Creek Catchment: Land Cover
Land cover and any change in coverage that has occurred over a six year period is summarized for the Flowing Creek catchment using spatially continuous vector data representing the catchment during the spring of 2008 and 2014. This dataset was developed by the RVCA through heads-up digitization of 20cm DRAPE ortho-imagery at a 1:4000 scale and details the surrounding landscape using 10 land cover classes.
4.1 Flowing Creek Catchment Change
As shown in Table 11 and Figure 1, the dominant land cover type in 2014 was crop and pastureland followed by woodland.
Table 11 Land cover (2008 vs. 2014) in the Flowing Creek catchment
* Does not include treed swamps ** Includes treed swamps
From 2008 to 2014, there was an overall change of 145 hectares (from one land cover class to another). Much of the change in the Flowing Creek catchment is a result of the conversion of woodland to meadow-thicket (shown in Figure 32 as “Other change event”), settlement and aggregates.
Figure 32 Land cover change in the Flowing Creek catchment (2014)
Table 12 provides a detailed breakdown of all land cover change that has taken place in the Flowing Creek catchment between 2008 and 2014.
Table 12 Land cover change in the Flowing Creek catchment (2008 to 2014)
4.2 Woodland Cover
In the Environment Canada Guideline (Third Edition) entitled “How Much Habitat Is Enough?” (hereafter referred to as the “Guideline”) the opening narrative under the Forest Habitat Guidelines section states that prior to European settlement, forest was the predominant habitat in the Mixedwood Plains ecozone. The remnants of this once vast forest now exist in a fragmented state in many areas (including the Rideau Valley watershed) with woodland patches of various sizes distributed across the settled landscape along with higher levels of forest cover associated with features such as the Frontenac Axis (within the on-Shield areas of the Rideau Lakes and Tay River subwatersheds). The forest legacy, in terms of the many types of wildlife species found, overall species richness, ecological functions provided and ecosystem complexity is still evident in the patches and regional forest matrices (found in the Jock River subwatershed and elsewhere in the Rideau Valley watershed). These ecological features are in addition to other influences which forests have on water quality and stream hydrology including reducing soil erosion, producing oxygen, storing carbon along with many other ecological services that are essential not only for wildlife but for human well-being.
The Guideline also notes that forests provide a great many habitat niches that are in turn occupied by a great diversity of plant and animal species. They provide food, water and shelter for these species - whether they are breeding and resident locally or using forest cover to help them move across the landscape. This diversity of species includes many that are considered to be species at risk. Furthermore, from a wildlife perspective, there is increasing evidence that the total forest cover in a given area is a major predictor of the persistence and size of bird populations, and it is possible or perhaps likely that this pattern extends to other flora and fauna groups. The overall effect of a decrease in forest cover on birds in fragmented landscapes is that certain species disappear and many of the remaining ones become rare, or fail to reproduce, while species adapted to more open and successional habitats, as well as those that are more tolerant to human-induced disturbances in general, are able to persist and in some cases thrive. Species with specialized-habitat requirements are most likely to be adversely affected. The overall pattern of distribution of forest cover, the shape, area and juxtaposition of remaining forest patches and the quality of forest cover also play major roles in determining how valuable forests will be to wildlife and people alike.
The current science generally supports minimum forest habitat requirements between 30 and 50 percent, with some limited evidence that the upper limit may be even higher, depending on the organism/species phenomenon under investigation or land-use/resource management planning regime being considered/used.
As shown in Figure 33, 25 percent of the Flowing Creek catchment contains 1242 hectares of upland forest and 44 hectares of lowland forest (treed swamps) versus the 26 percent of woodland cover in the Jock River subwatershed. This is less than the 30 percent of forest cover that is identified as the minimum threshold required to sustain forest birds according to the Guideline and which may only support less than one half of potential species richness and marginally healthy aquatic systems. When forest cover drops below 30 percent, forest birds tend to disappear as breeders across the landscape.
Figure 33 Woodland cover and forest interior (2014)
4.2.1 Woodland (Patch) Size
According to the Ministry of Natural Resources’ Natural Heritage Reference Manual (Second Edition), larger woodlands are more likely to contain a greater diversity of plant and animal species and communities than smaller woodlands and have a greater relative importance for mobile animal species such as forest birds.
Bigger forests often provide a different type of habitat. Many forest birds breed far more successfully in larger forests than they do in smaller woodlots and some rely heavily on forest interior conditions. Populations are often healthier in regions with more forest cover and where forest fragments are grouped closely together or connected by corridors of natural habitat. Small forests support small numbers of wildlife. Some species are “area-sensitive” and tend not to inhabit small woodlands, regardless of forest interior conditions. Fragmented habitat also isolates local populations, especially small mammals, amphibians and reptiles with limited mobility. This reduces the healthy mixing of genetic traits that helps populations survive over the long run (Conserving the Forest Interior. Ontario Extension Notes, 2000).
The Environment Canada Guideline also notes that for forest plants that do not disperse broadly or quickly, preservation of some relatively undisturbed large forest patches is needed to sustain them because of their restricted dispersal abilities and specialized habitat requirements and to ensure continued seed or propagation sources for restored or regenerating areas nearby.
The Natural Heritage Reference Manual continues by stating that a larger size also allows woodlands to support more resilient nutrient cycles and food webs and to be big enough to permit different and important successional stages to co-exist. Small, isolated woodlands are more susceptible to the effects of blowdown, drought, disease, insect infestations, and invasions by predators and non-indigenous plants. It is also known that the viability of woodland wildlife depends not only on the characteristics of the woodland in which they reside, but also on the characteristics of the surrounding landscape where the woodland is situated. Additionally, the percentage of forest cover in the surrounding landscape, the presence of ecological barriers such as roads, the ability of various species to cross the matrix surrounding the woodland and the proximity of adjacent habitats interact with woodland size in influencing the species assemblage within a woodland.
In the Flowing Creek catchment (in 2014), eighty-two (46 percent) of the 179 woodland patches are very small, being less than one hectare in size. Another 82 (46 percent) of the woodland patches ranging from one to less than 20 hectares in size tend to be dominated by edge-tolerant bird species. The remaining 15 (8 percent of) woodland patches range between 26 and 102 hectares in size. Fourteen of these patches contain woodland between 20 and 100 hectares and may support a few area-sensitive species and some edge intolerant species, but will be dominated by edge tolerant species.
Conversely, one (less than one percent) of the 179 woodland patches in the drainage area exceeds the 100 plus hectare size needed to support most forest dependent, area sensitive birds and are large enough to support approximately 60 percent of edge-intolerant species. No patch tops 200 hectares, which according to the Environment Canada Guideline will support 80 percent of edge-intolerant forest bird species (including most area sensitive species) that prefer interior forest habitat conditions.
Table 13 presents a comparison of woodland patch size in 2008 and 2014 along with any changes that have occurred over that time. A decrease (of 96 ha) has been observed in the overall woodland patch area between the two reporting periods with change spread across all woodland patch size class ranges (except the less than one hectare class).
Table 13 Woodland patches in the Flowing Creek catchment (2008 and 2014)
*Includes treed swamps
4.2.2 Woodland (Forest) Interior Habitat
The forest interior is habitat deep within woodlands. It is a sheltered, secluded environment away from the influence of forest edges and open habitats. Some people call it the “core” or the “heart” of a woodland. The presence of forest interior is a good sign of woodland health, and is directly related to the woodland’s size and shape. Large woodlands with round or square outlines have the greatest amount of forest interior. Small, narrow woodlands may have no forest interior conditions at all. Forest interior habitat is a remnant natural environment, reminiscent of the extensive, continuous forests of the past. This increasingly rare forest habitat is now a refuge for certain forest-dependent wildlife; they simply must have it to survive and thrive in a fragmented forest landscape (Conserving the Forest Interior. Ontario Extension Notes, 2000).
The Natural Heritage Reference Manual states that woodland interior habitat is usually defined as habitat more than 100 metres from the edge of the woodland and provides for relative seclusion from outside influences along with a moister, more sheltered and productive forest habitat for certain area sensitive species. Woodlands with interior habitat have centres that are more clearly buffered against the edge effects of agricultural activities or more harmful urban activities than those without.
In the Flowing Creek catchment (in 2014), the 179 woodland patches contain 48 forest interior patches (Figure 33) that occupy two percent (106 ha.) of the catchment land area (which is less than the three percent of interior forest in the Jock River Subwatershed). This is below the ten percent figure referred to in the Environment Canada Guideline that is considered to be the minimum threshold for supporting edge intolerant bird species and other forest dwelling species in the landscape.
Most patches (45) have less than 10 hectares of interior forest, 28 of which have small areas of interior forest habitat less than one hectare in size. The remaining three patches contain interior forest between 16 and 17 hectares in area. Between 2008 and 2014, there has been a change in the number of woodland patches containing smaller areas of interior habitat with an overall loss of 23 hectares in the catchment (Table 14), suggesting an increase in forest fragmentation over the six year period.
Table 14 Woodland Interior in the Flowing Creek catchment (2008 and 2014)
4.3 Wetland Cover
Wetlands are habitats forming the interface between aquatic and terrestrial systems. They are among the most productive and biologically diverse habitats on the planet. By the 1980s, according to the Natural Heritage Reference Manual, 68 percent of the original wetlands south of the Precambrian Shield in Ontario had been lost through encroachment, land clearance, drainage and filling.
Wetlands perform a number of important ecological and hydrological functions and provide an array of social and economic benefits that society values. Maintaining wetland cover in a watershed provides many ecological, economic, hydrological and social benefits that are listed in the Reference Manual and which may include:
- contributing to the stabilization of shorelines and to the reduction of erosion damage through the mitigation of water flow and soil binding by plant roots
- mitigating surface water flow by storing water during periods of peak flow (such as spring snowmelt and heavy rainfall events) and releasing water during periods of low flow (this mitigation of water flow also contributes to a reduction of flood damage)
- contributing to an improved water quality through the trapping of sediments, the removal and/or retention of excess nutrients, the immobilization and/or degradation of contaminants and the removal of bacteria
- providing renewable harvesting of timber, fuel wood, fish, wildlife and wild rice
- contributing to a stable, long-term water supply in areas of groundwater recharge and discharge
- providing a high diversity of habitats that support a wide variety of plants and animals
- acting as “carbon sinks” making a significant contribution to carbon storage
- providing opportunities for recreation, education, research and tourism
Historically, the overall wetland coverage within the Great Lakes basin exceeded 10 percent, but there was significant variability among watersheds and jurisdictions, as stated in the Environment Canada Guideline. In the Rideau Valley Watershed, it has been estimated that pre-settlement wetland cover averaged 35 percent using information provided by Ducks Unlimited Canada (2010) versus the 21 percent of wetland cover existing in 2014 derived from DRAPE imagery analysis.
Using the same dataset, it is estimated that pre-settlement (historic) wetland cover averaged 51 percent in the Jock River subwatershed versus the 24 percent of cover existing in 2014 (as summarized in Table 15).
Table 15 Wetland cover in the Jock River subwatershed and Flowing Creek catchment (Historic to 2014)
This decline in wetland cover is also evident in the Flowing Creek catchment (as seen in Figure 34) where wetland was reported to cover 45 percent of the area prior to settlement, as compared to 10 percent in 2014. This represents a 79 percent loss of historic wetland cover and what remains (in 2014) falls below the 40 percent historic wetland threshold cited in the Environment Canada Guideline for maintaining key ecological and hydrological functions. To maintain critical hydrological, ecological functions along with related recreational and economic benefits provided by these wetland habitats in the catchment, the Guideline recommends a “no net loss” approach for currently existing wetlands combined with efforts to work towards restoring upwards of 40 percent of the historic wetland coverage, where feasible.
Figure 34 Flowing Creek catchment wetland cover
4.4 Shoreline Cover
The riparian or shoreline zone is that special area where the land meets the water. Well-vegetated shorelines are critically important in protecting water quality and creating healthy aquatic habitats, lakes and rivers. Natural shorelines intercept sediments and contaminants that could impact water quality conditions and harm fish habitat in streams. Well established buffers protect the banks against erosion, improve habitat for fish by shading and cooling the water and provide protection for birds and other wildlife that feed and rear young near water. A recommended target (from the Environment Canada Guideline) is to maintain a minimum 30 metre wide vegetated buffer along at least 75 percent of the length of both sides of rivers, creeks and streams.
Figure 35 shows the extent of the ‘Natural’ vegetated riparian zone (predominantly wetland/woodland features) and ‘Other’ anthropogenic cover (crop/pastureland, roads/railways, settlements) along a 30-metre-wide area of land, both sides of the shoreline of the Jock River and its tributaries in the Flowing Creek catchment.
Figure 35 Natural and other riparian land cover in the Flowing Creek catchment
This analysis shows that the riparian zone in the Flowing Creek catchment in 2014 was comprised of crop and pastureland (47 percent), woodland (20 percent), wetland (17 percent), transportation (seven percent), settlement (six percent), meadow-thicket (three percent) and aggregate (one percent). Additional statistics for the Flowing Creek catchment are presented in Table 16. Of particular interest is the observed increase in the area of “Aggregate” and decrease in "Woodland" area along the shoreline of Flowing Creek and tributaries over a six year period.
Table 16 Riparian land cover (2008 vs. 2014) in the Flowing Creek catchment
5.0 Flowing Creek Catchment: Stewardship and Water Resources Protection
The RVCA and its partners are working to protect and enhance environmental conditions in the Jock River Subwatershed. Figure 36 shows the location of all stewardship projects completed in the Flowing Creek catchment along with sites identified for potential shoreline restoration.
5.1 Rural Clean Water Projects
From 2010 to 2015, two well decommissionings, one windbreak buffer and one precision farming project were completed. Between 2004 and 2009, two crop residue projects, two well upgrades, one septic system replacement, one well decommissioning, one livestock fencing and one clean water diversion were completed. Prior to 2004, four livestock fencing projects, one milkhouse wastewater treatment facility, one manure storage/wastewater runoff project and one crop residue project were completed. Six of these projects were completed within the 30 metre riparian zone of Flowing Creek and tributaries. Total value of all 19 projects is $125,040 with $40,796 of that amount funded through grant dollars from the RVCA.
Figure 36 Stewardship site locations
5.2 Private Land Forestry Projects
The location of RVCA tree planting projects is shown in Figure 36. From 2010 to 2015, 1,000 trees were planted at one site. Between 2004 and 2009, 11,700 trees were planted at two sites and prior to 2004, 91,040 trees were planted at 18 sites. In total, 103,740 trees were planted, resulting in the reforestation of 54 hectares. Three of these projects were completed within the 30 metre riparian zone of Flowing Creek and tributaries. Total value of all 21 projects is $353,576 with $119,765 of that amount coming from fundraising sources.
Through the RVCA Butternut Recovery Program, an additional 50 butternut trees were planted in the Rideau Creek catchment (Figure 36) between 2004 and 2015, as part of efforts to introduce healthy seedlings from tolerant butternuts into various locations across Eastern Ontario.
5.3 Valley, Stream, Wetland and Hazard Lands
The Flowing Creek catchment covers 50.4 square kilometres with 4.6 square kilometres (or nine percent) of the drainage area being within the regulation limit of Ontario Regulation 174/06 (Figure 37), giving protection to wetland areas and river or stream valleys that are affected by flooding and erosion hazards.
Wetlands occupy 4.7 sq. km. (or nine percent) of the catchment. Of these wetlands, 3.1 sq. km (or 65 percent) are designated as provincially significant and included within the RVCA regulation limit. This leaves the remaining 1.6 sq. km (or 35 percent) of wetlands in the catchment outside the regulated area limit.
Of the 106.5 kilometres of stream in the catchment, regulation limit mapping has been plotted along 13.7 kilometers of streams (representing 13 percent of all streams in the catchment). Some of these regulated watercourses (9.2 km or nine percent of all streams) flow through regulated wetlands; the remaining 4.6 km (or 33 percent) of regulated streams are located outside of those wetlands. Plotting of the regulation limit on the remaining 92.7 km (or 87 percent) of streams requires identification of flood and erosion hazards and valley systems.
Within those areas of the Flowing Creek catchment subject to the regulation (limit), efforts (have been made and) continue through RVCA planning and regulations input and review to manage the impact of development (and other land management practices) in areas where “natural hazards” are associated with rivers, streams, valley lands and wetlands. For areas beyond the regulation limit, protection of the catchment’s watercourses is only provided through the “alteration to waterways” provision of the regulation.
Figure 37 RVCA regulation limits
5.4 Vulnerable Drinking Water Areas
The Wellhead Protection Area around the Richmond (King’s Park) municipal drinking water source extends into the Flowing Creek drainage catchment. This area is subject to mandatory policies in the Mississippi-Rideau Source Protection Plan developed under the Clean Water Act. These policies specifically regulate land uses and activities that are considered drinking water threats, thereby reducing the risk of contamination of the municipal drinking water source.
The Flowing Creek drainage catchment is also considered to have a Highly Vulnerable Aquifer. This means that the nature of the overburden (thin soils, fractured bedrock) does not provide a high level of protection for the underlying groundwater making the aquifer more vulnerable to contaminants released on the surface. The Mississippi-Rideau Source Protection Plan includes policies that focus on the protection of groundwater region-wide due to the fact that most of the region, which encompasses the Mississippi and Rideau watersheds, is considered Highly Vulnerable Aquifer.
A large portion of the central part of this catchment area is also considered a Significant Groundwater Recharge Area. This means that there is a volume of water moving from the surface into the ground and groundwater serves either as a municipal drinking water source or supplies a coldwater ecosystem such as a brook trout stream. The Plan was not required to include policies to specifically address Significant Groundwater Recharge Areas.
For detailed maps and policies that have been developed to protect drinking water sources, please go to the Mississippi-Rideau Source Protection Region website at www.mrsourcewater.ca to view the Mississippi-Rideau Source Protection Plan.
6.0 Flowing Creek Catchment: Challenges/Issues
Water Quality/Quantity
Surface chemistry water quality on Flowing Creek declines from “Fair” to “Poor” between the upstream ((CK67-008) and downstream sites (CK67-001). The lower site has shown persistently elevated nutrient concentrations and E. coli counts as well as high metal concentrations over a 12 year period.
Instream biological water quality conditions for Flowing Creek are unknown.
Drainage problems have led to establishment of altered wetland conditions and land use conflict (amongst development, quarry, agriculture and wetland conservation interests).
Existing hydrological and geochemical datasets and assessments (academic, RVCA, others) are only recently available and/or are not being considered in the characterization of the numerous hydrologic functions of the Jock River subwatershed. Further, there is a dearth of hydrologic information (hydroperiod, groundwater/surface water interactions, geochemistry) about the wetlands that remain in the Jock River subwatershed.
Natural hazard lands have not been identified.
Headwaters/Instream/Shorelines
‘Natural’ vegetation covers 39 percent of the riparian zone of Flowing Creek and its tributaries (Figure 34) and is below the recommended 30 metre wide, naturally vegetated target along 75 percent of the length of the catchment’s watercourses.
No information available about instream aquatic and riparian conditions along Flowing Creek.
Land Cover
Woodlands cover 25 percent of the catchment and is below the 30 percent of forest cover that is identified as the minimum threshold for sustaining forest birds and other woodland dependent species (Figure 32).
Pre-settlement wetlands have declined by 79 percent and now cover nine percent (483 ha.) of the catchment (Figure 33). Thirty-four percent (167 ha.) of these wetlands remain unevaluated/unregulated and are vulnerable to drainage and land clearing activities in the absence of any regulatory and planning controls that would otherwise protect them for the many important hydrological, social, biological and ecological functions/services/values they provide to landowners and the surrounding community.
7.0 Flowing Creek Catchment: Opportunities/Actions
Water Quality/Quantity
Implement improved storm water and agricultural best management practices to address water quality concerns and retain existing shoreline vegetation. The Rural Clean Water Programs offer grants to landowners interested in implementing projects on their property that will help to protect and improve water quality:
- Homeowners may be interested in projects to repair, replace or upgrade their well or septic system, or addressing erosion through buffer plantings and erosion control
- Farmers can take advantage of a wide range of projects, including livestock fencing, manure storage, tile drainage control structures, cover crops, and many more
Continue to coordinate environmental monitoring and reporting activities with the City of Ottawa
Use wetland restoration as a tool to improve surface water quality and help restore the hydrologic integrity of the Jock River and its tributaries, including Flowing Creek
List, share and when possible, synthesize and use existing hydrological and geochemical datasets and assessment outcomes to facilitate the characterization of subwatershed and catchment hydrological functions. In addition, prepare guidance on best practices for the preparation of water budget assessments to better understand the hydrologic cycle requirements that occur at site specific scales; and share existing catchment and subwatershed scale water budget assessment outcomes
Flewellyn Special Study Area, Cumulative Effects Study has been initiated by the City of Ottawa to better understand the hydrology in the area and associated drainage concerns
Flowing Creek flood risk is being studied as part of ongoing efforts to prepare flood plain mapping for the Jock River subwatershed
Headwaters/Instream/Shorelines
Promote the Rideau Valley Shoreline Naturalization Program to landowners to increase existing 39 percent of natural shoreline cover
Educate landowners about the value of and best management practices used to maintain and enhance natural shorelines and headwater drainage features
Work with the City of Ottawa to consistently implement current land use planning and development policies for water quality and shoreline protection (i.e., adherence to a minimum 30 metre development setback from water) adjacent to the Jock River and other catchment watercourses, including Flowing Creek
Target shoreline restoration at sites identified in this report (shown as “Other riparian land cover” in Figure 35) and explore other restoration and enhancement opportunities along Flowing Creek and its tributaries
Land Cover
Promote the City of Ottawa’s Green Acres Reforestation Program to landowners to increase existing 25 percent of woodland cover
Encourage the City of Ottawa to strengthen natural heritage and water resources policies in official plans and zoning by-laws where shoreline, wetland, woodland cover and watercourse setbacks are determined to be at or below critical ecological thresholds. Information for this purpose is provided in the RVCA’s subwatershed and catchment reports
Explore ways and means to more effectively enforce and implement conditions of land-use planning and development approvals to achieve net environmental gains
Re-consider the RVCA’s approach to wetland regulation where there is an identified hydrologic imperative to do so (i.e., significant loss of historic wetland cover (see Figure 33) and/or seasonal, critically low baseflows in the Jock River and/or areas of seasonal flooding)
Full Catchment Report
Jock River Subwatershed Report 2016
Hobbs Drain Catchment
The RVCA produces individual reports for 12 catchments in the Jock River subwatershed. Using data collected and analyzed by the RVCA through its watershed monitoring and land cover classification programs, surface water quality and in-stream conditions are reported for the Jock River along with a summary of environmental conditions for the surrounding countryside every six years.
This information is used to better understand the effects of human activity on our water resources, allows us to better track environmental change over time and helps focus watershed management actions where they are needed the most to help sustain the ecosystem services (cultural, aesthetic and recreational values; provisioning of food, fuel and clean water; regulation of erosion/natural hazard protection and water purification; supporting nutrient/water cycling and habitat provision) provided by the catchment’s lands and forests and waters (Millennium Ecosystem Assessment 2005).
The following sections of this report for the Hobbs Drain catchment are a compilation of that work.
| Catchment Facts |
Section 1.0 |
| Surface Water Quality Conditions |
Section 2.0 |
| Riparian Conditions |
Section 3.0 |
| Land Cover |
Section 4.0 |
| Land Stewardship and Water Resources Protection |
Section 5.0 |
| Challenges/Issues |
Section 6.0 |
| Actions/Opportunities |
Section 7.0 |
For other Jock River catchments and the Jock River Subwatershed Report, please visit the RVCA website at www.rvca.ca

Figure 1 Land cover in the Hobbs Drain catchment
1.0 Hobbs Drain Catchment: Facts
1.1 General/Physical Geography
Municipalities
- Ottawa: (32 km2; 100% of catchment)
Geology/Physiography
- Hobbs Drain Catchment resides within a transitionary area between the Ottawa Valley Clay Plain to the east and the Smith Falls Limestone Plain to the West. The southern half of the catchment is underlain by beach sands and gravels, sand plains and some areas of glacial till. Bedrock lies at the ground surface throughout the northern part of the catchment and is overlain, in areas by organic soils and localized areas of beach sands and gravels
- In this catchment, bedrock mostly consists of interbedded limestone and dolostone from the Gull River Formation. In addition, a geologic fault may pass through the catchment
Topography
- The ground surface ranges in elevation from approximately 155 masl south of Hwy 7 to approximately 96 masl at the catchment’s outlet
Drainage Area
- 32 square kilometers; occupies six percent of the Jock River subwatershed, one percent of the Rideau Valley watershed
Stream Length
- Hobbs Drain and tributaries: 66 km
1.2 Vulnerable Areas
Aquifer Vulnerability
- The Mississippi-Rideau Source Protection initiative has mapped parts of the southern half of this catchment as a significant groundwater recharge area; and all the catchment as Highly Vulnerable Aquifer. Parts of Wellhead Protection Areas (WHPA) C and D for the municipal wells in Richmond underlie the northern extent of this catchment. In addition, parts of the WHPAs B and C for the municipal wells in Munster Hamlet, underlie part of this catchment near Bleeks Road
Wetland Hydrology
- A watershed model developed by the RVCA in 2009 was used to study the hydrologic function of wetlands in the Rideau Valley Watershed, including those found in the Hobbs Drain catchment
1.3 Conditions at a Glance
- Surface chemistry water quality rating along the Hobbs Drain is “Fair” from 2009 to 2014. The score at this site is largely influenced by occasional high nutrient concentrations, bacterial pollution and metal (aluminum) exceedances (see Figure 2)
- Instream biological water quality conditions at the Hobbs Drain sample location range from “ Poor” to “Excellent” from 2004 to 2015 (using a grading scheme developed by Ontario Conservation Authorities in Ontario for benthic invertebrates) with an overall benthic invertebrate water quality rating of “Good” determined for this period
Instream and Riparian
- Overall instream and riparian condition for the Hobbs Drain is unknown
Thermal Regime
- Warm/cool water thermal guild supporting the Jock River fishery
Fish Community
- Twenty-three species of recreational and bait fish
Shoreline Cover Type (30 m. riparian area; 2014)
- Wetland (39%)
- Crop and Pasture (29%)
- Woodland (15%)
- Transportation (6%)
- Meadow-Thicket (5%)
- Settlement (4%)
- Aggregate (2%)
Land Cover Type (2014)
- Crop and Pasture (31%)
- Woodland (26%)
- Wetland (24%)
- Settlement (8%)
- Meadow-Thicket (6%)
- Transportation (3%)
- Aggregate (2%)
- Water (<1%)
Land Cover Change (2008 to 2014)
- Woodland (-22 ha)
- Aggregate (-6 ha)
- Wetland (-3 ha)
- Meadow-Thicket (0 ha)
- Transportation (0 ha)
- Water (+7 ha)
- Settlement (+8 ha)
- Crop and Pasture (+16 ha)
Significant Natural Features
- Goulbourn Provincially Significant Wetland
- Richmond Fen Provincially Significant Wetland
Water Wells
- Several hundred (~250) operational private water wells in the Hobbs Drain Catchment. Groundwater uses are mainly domestic, but also include public water supplies, livestock watering and commercial uses
Aggregates
- There are parts of 3 bedrock quarry licenses located and 2 sand and gravel pits within the catchment. Sand and gravel resources are mainly of tertiary importance
Species at Risk (Elemental Occurrence)
- Spotted Turtle (Endangered)
- Blanding’s Turtle, Bobolink, Eastern Meadowlark (Threatened)
- Eastern Milksnake, Snapping Turtle, Yellow Rail (Special Concern)
1.4 Catchment Care
Stewardship
- Seventeen stewardship projects undertaken (see Section 5)
Environmental Monitoring
- Chemical surface (in-stream) water quality collection since 2003 (see Section 2)
- Benthic invertebrate (aquatic insect) surface (in-stream) water quality collection since 2003 (see Section 3.1.1)
- Six headwater drainage feature assessments in 2015 at road crossings in the catchment. The protocol measures zero, first and second order headwater drainage features and is a rapid assessment method characterizing the amount of water, sediment transport, and storage capacity within headwater drainage features (see Section 3.2)
- Groundwater level and chemistry data is available from PGMN wells located along Fernbank Road (W175) and in Stapledon (W084)
Environmental Management
- Development along the Hobbs Drain and in and adjacent to the Provincially Significant Wetlands in the catchment (Goulbourn, Richmond Fen) are subject to Ontario Regulation 174-06 (entitled “Development, Interference with Wetlands and Alterations to Shorelines and Watercourses”) that protects the hydrologic function of the wetland and also protects landowners and their property from natural hazards (flooding, fluctuating water table, unstable soils) associated with them
- Two active Permits To Take Water (PTTW) in the Hobbs Drain catchment issued for pit /quarry dewatering
- Five Environmental Compliance Approvals and/or Environmental Activity and Sector Registrations in the Hobbs Drain Catchment. These are for a municipal or private sewage work; industrial sewage works; and a municipal drinking water system
2.0 Hobbs Drain Catchment: Surface Water Quality Conditions
Surface water quality conditions in the Hobbs Drain Catchment are monitored by the City of Ottawa Baseline Water Quality Monitoring Program. This program provides information on the condition of Ottawa’s surface water resources; data is collected for multiple parameters including nutrients (total phosphorus, total Kjeldahl nitrogen and ammonia), E. coli, metals (like aluminum and copper) and additional chemical/physical parameters (such as alkalinity, chlorides, pH and total suspended solids). The locations of monitoring sites are shown in Figure 2 and Table 1.
Figure 2 Water quality monitoring site in the Hobbs Drain Catchment
2.1 Hobbs Drain Water Quality Rating
The RVCA's water quality rating for Hobbs Drain (site JCK-247) is “Fair” (Table 1) as determined by the Canadian Council of Ministers of the Environment (CCME) Water Quality Index. A “Fair” rating indicates that water quality is usually protected but is occasionally threatened or impaired; conditions sometimes depart from natural or desirable levels. Each parameter is evaluated against established guidelines to determine water quality conditions. Those parameters that frequently exceed guidelines are presented below. There is limited data available at this site prior to 2010, therefore only information for the 2010-2015 period will be discussed. Table 1 shows the overall rating for the monitored surface water quality site within the Hobbs Drain Catchment and Table 2 outlines the Water Quality Index (WQI) scores and their corresponding ratings.
There is one monitored water quality site on Hobbs Drain within this catchment (JCK-247, Figure 2). The score at this site is largely influenced by occasional high nutrient concentrations, bacterial pollution and metal (aluminum) exccedances. For more information on the CCME WQI, please see the Jock River Subwatershed Report.
Table 1 Water Quality Index ratings for the Hobbs Drain Catchment
Table 2 Water Quality Index ratings and corresponding index scores (RVCA terminology, original WQI category names in brackets)
2.2 Nutrients
Total phosphorus (TP) is used as a primary indicator of excessive nutrient loading and may contribute to abundant aquatic vegetation growth and depleted dissolved oxygen levels. The Provincial Water Quality Objective (PWQO) is used as the TP Guideline and states that in streams concentrations greater than 0.030 mg/l indicate an excessive amount of TP.
Total Kjeldahl nitrogen (TKN) and ammonia (NH3) are used as secondary indicators of nutrient loading. RVCA uses a guideline of 0.500 mg/l to assess TKN[1] and the PWQO of 0.020 mg/l to assess NH3 concentrations in the Jock River.
Tables 3, 4 and 5 summarize average nutrient concentrations at monitored sites within the Hobbs Drain catchment and show the proportion of results that meet the guidelines.
Table 3 Summary of total phosphorus results for Hobbs Drain catchment, 2010-2015
Table 4 Summary of total Kjeldahl nitrogen results for Hobbs Drain catchment from 2010-2015. Highlighted values indicate average concentrations exceed the guideline
Table 5 Summary of ammonia results for Hobbs Drain catchment from 2010-2015
Monitoring Site JCK-247
TP results rarely exceeded the PWQO at site JCK-247. Eighty-four percent of samples were below the guideline (Figure 3). The average TP concentration was below the objective at 0.020 mg/l as shown in Table 3.
The bulk of TKN results were elevated (Figure 4); only 25 percent of samples were below the guideline in the 2010-2015 period. The average concentrations exceeded the guideline at 0.610 mg/l (Table 4).
The results for NH3 indicate that exceedances occurred occasionally. Sixty-three percent of results were below the guideline in 2010-2015 reporting period (Figure 5). The average NH3 was 0.020 mg/l and just meets the PWQO (Table 5).
Figure 3 Total phosphorous concentrations in Hobbs Drain, 2010-2015
Figure 4 Total Kjeldahl nitrogen concentrations in Hobbs Drain, 2010-2015
Figure 5 Ammonia concentrations in Hobbs Drain, 2010-2015
Summary
Occasional nutrient enrichment is a feature in this reach of Hobbs Drain. The elevated TKN concentrations and moderate NH3 results provide evidence that elevated nutrients may be a natural feature in this part of the drain. Occasional exceedances of both NH3 and TP indicate that some nutrient loading may occur from upstream anthropogenic sources such as fertilizer use, agricultural activities and storm water runoff. Elevated nutrients may result in nutrient loading downstream and to the Jock River. High nutrient concentrations can help stimulate the growth of algae blooms and other aquatic vegetation in a waterbody and deplete oxygen levels as the vegetation dies off. Best management practices (i.e. buffered shorelines, maintianing native shoreline vegetation, restricting livestock access to surface water, etc) should be employed wherever possible to limit nutrient loading to the waterbody.
2.3 Escherichia coli
Escherichia coli (E. coli) is used as an indicator of bacterial pollution from human or animal waste; in elevated concentrations it can pose a risk to human health. The PWQO of 100 colony forming units/100 millilitres (CFU/100 ml) is used. E. coli counts greater than this guideline indicate that bacterial contamination may be a problem within a waterbody.
Table 6 summarizes the geometric mean[2] for the monitored site on the Hobb’s Drain and shows the proportion of samples that meet the E. coli guideline of 100 CFU/100 ml. The results of the geometric mean with respect to the guideline in the 2010-2015 period is shown in Figure 6.
Table 6 Summary of
E. coli results for Hobbs Drain, 2010-2015. Highlighted values indicate the geometric mean exceeds the guideline
Monitoring Site JCK-247
Elevated E. coli counts at site JCK-247 were a common occurrence. The proportion of samples below the guideline was 33 percent (Figure 6). The geometric mean was 130 CFU/100ml (Table 6), and exceed the PWQO of 100 CFU/100ml.
Figure 6 Geometric mean of E. coli results in Hobbs Drain, 2010-2015
Summary
Bacterial pollution appears to be a concern at this site, the count at the geometric mean exceeds the PWQO and the majority of samples exceed the guideline. Best management practices such as enhancing shoreline buffers, minimizing storm water runoff and restricting livestock access to creeks can help to protect this reach of Hobbs Drain into the future.
2.4 Metals
Of the metals routinely monitored in Hobbs Drain Catchment, aluminum (Al) occasionally reported concentrations above the PWQO. In elevated concentrations metals can have toxic effects on sensitive aquatic species.
Table 7 summarizes metal concentrations at sites JCK-247 as well as show the proportion of samples that meet guidelines. Figure 7 shows metal concentrations with respect to the guideline (PWQO) of 0.075 mg/l.
Table 7 Summary of aluminum results in Hobbs Drain from 2010-2015. Highlighted values indicate average concentrations exceed the guideline
Monitoring Site JCK-247
The average Al concentration of 0.100 mg/l at site JCK-247 exceeded the guideline (Table 7). The majority of samples (56 percent) were below the guideline (Figure 7) from 2010-2015.
Figure 7 Average aluminum concentrations in Hobb’s Drain, 2010-2015
Summary
In the Hobbs Drain catchment aluminum concentrations often exceed the PWQO. The most elevated concentrations are observed during the spring likely due to increased runoff amounts from melt conditions, efforts should continue to be made to identify pollution sources and implement best management practices to reduce any inputs (such as storm water runoff, metal alloys, fungicides and pesticides) to improve overall stream health and lessen downstream impacts.
1 No Ontario guideline for TKN is presently available; however, waters not influenced by excessive organic inputs typically range from 0.100 to 0.500 mg/l, Environment Canada (1979) Water Quality Sourcebook, A Guide to Water Quality Parameters, Inland Waters Directorate, Water Quality Branch, Ottawa, Canada
2 A type of mean or average, which indicates the central tendency or typical value of a set of numbers by using the product of their values (as opposed to the arithmetic mean which uses their sum). It is often used to summarize a variable that varies over several orders of magnitude, such as E. coli counts
3.0 Hobbs Drain Catchment: Riparian Conditions
3.1 Hobbs Drain Instream Aquatic Habitat
3.1.1 Benthic Invertebrates
Freshwater benthic invertebrates are animals without backbones that live on the stream bottom and include crustaceans such as crayfish, molluscs and immature forms of aquatic insects. Benthos represent an extremely diverse group of aquatic animals and exhibit wide ranges of responses to stressors such as organic pollutants, sediments and toxicants, which allows scientists to use them as bioindicators. As part of the Ontario Benthic Biomonitoring Network (OBBN), the RVCA has been collecting benthic invertebrates at the Bleeks Road site on Hobbs Drain since 2004. Monitoring data is analyzed for each sample site and the results are presented using the Family Biotic Index, Family Richness and percent Ephemeroptera, Plecoptera and Trichoptera.
Hilsenhoff Family Biotic Index
The Hilsenhoff Family Biotic Index (FBI) is an indicator of organic and nutrient pollution and provides an estimate of water quality conditions for each site using established pollution tolerance values for benthic invertebrates. FBI results for the Hobbs Drain catchment sample location at Bleeks Road are separated by reporting period 2004 to 2009 and 2010 to 2015. A wide ranging “Excellent” to “Poor” water quality conditions were observed at the Hobbs Drain sample location for the period from 2004 to 2015 (Figure 8) using a grading scheme developed by Conservation Authorities in Ontario for benthic invertebrates.
Figure 8 Hilsenhoff Family Biotic Index at the Hobbs Drain Bleeks Road sample location
Family Richness
Family Richness measures the health of the community through its diversity and increases with increasing habitat diversity suitability and healthy water quality conditions. Family Richness is equivalent to the total number of benthic invertebrate families found within a sample. The Hobbs Drain site is reported to have “Fair” to “Good” family richness (Figure 9).
Figure 9 Family Richness at the Hobbs Drain Bleeks Road sample location
EPT
Ephemeroptera (Mayflies), Plecoptera (Stoneflies), and Trichoptera (Caddisflies) are species considered to be very sensitive to poor water quality conditions. High abundance of these organisms is generally an indication of good water quality conditions at a sample location. During more recent sampling years the community structure has been shifting to species that are more sensitive to poor water quality conditions. As a result, the EPT indicates that the Hobbs Drain sample location is reported to have “Fair” to “Good” water quality (Figure 10) from 2004 to 2015.
Figure 10 EPT at the Hobbs Drain Bleeks Road sample location
Site conditions at the Hobbs Drain Bleeks Road OBBN sample location at Bleeks Road
Conclusion
Overall the Hobbs Drain sample location aquatic habitat conditions from a benthic invertebrate perspective is considered “Good” from 2004 to 2015 as the samples are dominated by species that are moderately sensitive and sensitive to high organic pollution levels.
3.1.2 Thermal Regime
Many factors can influence fluctuations in stream temperature, including springs, tributaries, precipitation runoff, discharge pipes and stream shading from riparian vegetation. Water temperature is used along with the maximum air temperature (using the Stoneman and Jones method) to classify a watercourse as either warm water, cool water or cold water. Figure 11 shows where the thermal sampling sites were located along Hobbs Drain. Analysis of the data collected indicates that Hobbs Drain is classified as a cool water system with cool to warm water reaches (Figure 12).
Figure 11 Temperature logger locations in the Hobbs Drain catchment
Figure 12 Temperature logger data for two sites on Hobbs Drain.
Each point on the graph represents a temperature that meets the following criteria:
- Sampling dates between July 1st and September 7th
- Sampling date is preceded by two consecutive days above 24.5 °C, with no rain
- Water temperatures are collected at 4pm
- Air temperature is recorded as the max temperature for that day
3.1.3 Fish Community
The Hobbs Drain catchment is classified as a mixed community of warm and cool water recreational and baitfish fishery with 23 species observed. Figure 13 shows the sampling locations in the Hobbs Drain catchment.
Figure 13 Hobbs Drain catchment fish community
Hobbs Drain fish sampling location
The following table contains a list of species observed in the watershed.
Table 8 Fish species observed in Hobbs Drain catchment
3.2 Headwater Drainage Features Assessment
3.2.1 Headwater Sampling Locations
The RVCA Stream Characterization program assessed Headwater Drainage Features for the Jock River subwatershed in 2015. This protocol measures zero, first and second order headwater drainage features (HDF). It is a rapid assessment method characterizing the amount of water, sediment transport, and storage capacity within headwater drainage features (HDF). RVCA is working with other Conservation Authorities and the Ministry of Natural Resources and Forestry to implement the protocol with the goal of providing standard datasets to support science development and monitoring of headwater drainage features. An HDF is a depression in the land that conveys surface flow. Additionally, this module provides a means of characterizing the connectivity, form and unique features associated with each HDF (OSAP Protocol, 2013). In 2015 the program sampled 6 sites at road crossings in the Hobbs Drain catchment area (Figure 14).

Figure 14 Locations of the headwater sampling sites in the Hobbs Drain catchment
3.2.2 Headwater Feature Type
The headwater sampling protocol assesses the feature type in order to understand the function of each feature. The evaluation includes the following classifications: defined natural channel, channelized or constrained, multi-thread, no defined feature, tiled, wetland, swale, roadside ditch and pond outlet. By assessing the values associated with the headwater drainage features in the catchment area we can understand the ecosystem services that they provide to the watershed in the form of hydrology, sediment transport, and aquatic and terrestrial functions. Five features were classified as having been channelized and one feature was identified as natural. Figure 15 shows the feature type of the primary feature at the sampling locations.
Figure 15 Headwater feature types in the Hobbs Drain catchment
3.2.3 Headwater Feature Flow
The observed flow condition within headwater drainage features can be highly variable depending on timing relative to the spring freshet, recent rainfall, soil moisture, etc. Flow conditions are assessed in the spring and in the summer to determine if features are perennial and flow year round, if they are intermittent and dry up during the summer months or if they are ephemeral systems that do not flow regularly and generally respond to specific rainstorm events or snowmelt. Flow conditions in headwater systems can change from year to year depending on local precipitation patterns. Figure 16 shows the observed flow conditions at the sampling locations in the Hobbs Drain catchment in 2015.
Figure 16 Headwater feature flow conditions in the Hobbs Drain catchment
A summer photo of the headwater sample site in the Hobbs Drain catchment located on Fernbank Road
3.2.4 Feature Channel Modifications
Channel modifications were assessed at each headwater drainage feature sampling location. Modifications include dredging, channel hardening and mixed modifications. The Hobbs Drain catchment area had one site classified as having no channel modifications, two features were classified as being hardened, two had been dredged and one had mixed modifications. Figure 17 shows the channel modifications observed at the sampling locations for Hobbs Drain.
Figure 17 Headwater feature channel modifications in the Hobbs Drain catchment
3.2.5 Headwater Feature Vegetation
Headwater feature vegetation evaluates the type of vegetation that is found within the drainage feature. The type of vegetated within the channel influences the aquatic and terrestrial ecosystem values that the feature provides. For some types of headwater features the vegetation within the feature plays a very important role in flow and sediment movement and provides fish and wildlife habitat. The following classifications are evaluated no vegetation, lawn, wetland, meadow, scrubland and forest. The features assessed in the Hobbs Drain catchment were classified being dominated by wetland and meadow vegetation. Figure 18 depicts the dominant vegetation observed at the sampled headwater sites in the Hobbs Drain catchment.
Figure 18 Headwater feature vegetation types in the Hobbs Drain catchment
3.2.6 Headwater Feature Riparian Vegetation
Headwater riparian vegetation evaluates the type of vegetation that is found along the adjacent lands of a headwater drainage feature. The type of vegetation within the riparian corridor influences the aquatic and terrestrial ecosystem values that the feature provides to the watershed. Three sample locations in Hobbs Drain were dominated by natural vegetation in the form of scrubland, meadow and wetland vegetation. Three sample locations were dominated by other forms of vegetation of either crops or ornamental grasses. Figure 19 depicts the type of riparian vegetation observed at the sampled headwater sites in the Hobbs Drain catchment.
Figure 19 Headwater feature riparian vegetation types in the Hobbs Drain catchment
3.2.7 Headwater Feature Sediment Deposition
Assessing the amount of recent sediment deposited in a channel provides an index of the degree to which the feature could be transporting sediment to downstream reaches (OSAP, 2013). Evidence of excessive sediment deposition might indicate the requirement to follow up with more detailed targeted assessments upstream of the site location to identify potential best management practices to be implemented. Conditions ranged from no deposition observed to extensive deposition recorded. Figure 20 depicts the degree of sediment deposition observed at the sampled headwater sites in the Hobbs Drain catchment.
Figure 20 Headwater feature sediment deposition in the Hobbs Drain catchment
3.2.8 Headwater Feature Upstream Roughness
Feature roughness will provide a measure of the amount of materials within the bankfull channel that could slow down the velocity of water flowing within the headwater feature (OSAP, 2013). Materials on the channel bottom that provide roughness include vegetation, woody debris and boulders/cobble substrates. Roughness can provide benefits in mitigating downstream erosion on the headwater drainage feature and the receiving watercourse by reducing velocities. Roughness also provides important habitat conditions for aquatic organisms. The sample locations in the Hobbs Drain catchment area ranged from minimal to high roughness conditions. Figure 21 shows the feature roughness conditions at the sampling locations in the Hobbs Drain catchment.
Figure 21 Headwater feature roughness in the Hobbs Drain catchment
4.0 Hobbs Drain Catchment: Land Cover
Land cover and any change in coverage that has occurred over a six year period is summarized for the Hobbs Drain catchment using spatially continuous vector data representing the catchment during the spring of 2008 and 2014. This dataset was developed by the RVCA through heads-up digitization of 20cm DRAPE ortho-imagery at a 1:4000 scale and details the surrounding landscape using 10 land cover classes.
4.1 Hobbs Drain Catchment Change
As shown in Table 9, the dominant land cover type in 2014 was crop and pastureland, followed by woodland and wetland.
Table 9 Land cover (2008 vs. 2014) in the Hobbs Drain catchment
* Does not include treed swamps ** Includes treed swamps
From 2008 to 2014, there was an overall change of 44 hectares (from one land cover class to another). Most of the change in the Hobbs Drain catchment is a result of the conversion of woodland to crop and pastureland (Figure 22).
Figure 22 Land cover change in the Hobbs Drain catchment (2014)
Table 10 provides a detailed breakdown of all land cover change that has taken place in the Hobbs Drain catchment between 2008 and 2014.
Table 10 Land cover change in the Hobbs Drain catchment (2008 to 2014)
4.2 Woodland Cover
In the Environment Canada Guideline (Third Edition) entitled “How Much Habitat Is Enough?” (hereafter referred to as the “Guideline”) the opening narrative under the Forest Habitat Guidelines section states that prior to European settlement, forest was the predominant habitat in the Mixedwood Plains ecozone. The remnants of this once vast forest now exist in a fragmented state in many areas (including the Rideau Valley watershed) with woodland patches of various sizes distributed across the settled landscape along with higher levels of forest cover associated with features such as the Frontenac Axis (within the on-Shield areas of the Rideau Lakes and Tay River subwatersheds). The forest legacy, in terms of the many types of wildlife species found, overall species richness, ecological functions provided and ecosystem complexity is still evident in the patches and regional forest matrices (found in the Jock River subwatershed and elsewhere in the Rideau Valley watershed). These ecological features are in addition to other influences which forests have on water quality and stream hydrology including reducing soil erosion, producing oxygen, storing carbon along with many other ecological services that are essential not only for wildlife but for human well-being.
The Guideline also notes that forests provide a great many habitat niches that are in turn occupied by a great diversity of plant and animal species. They provide food, water and shelter for these species - whether they are breeding and resident locally or using forest cover to help them move across the landscape. This diversity of species includes many that are considered to be species at risk. Furthermore, from a wildlife perspective, there is increasing evidence that the total forest cover in a given area is a major predictor of the persistence and size of bird populations, and it is possible or perhaps likely that this pattern extends to other flora and fauna groups. The overall effect of a decrease in forest cover on birds in fragmented landscapes is that certain species disappear and many of the remaining ones become rare, or fail to reproduce, while species adapted to more open and successional habitats, as well as those that are more tolerant to human-induced disturbances in general, are able to persist and in some cases thrive. Species with specialized-habitat requirements are most likely to be adversely affected. The overall pattern of distribution of forest cover, the shape, area and juxtaposition of remaining forest patches and the quality of forest cover also play major roles in determining how valuable forests will be to wildlife and people alike.
The current science generally supports minimum forest habitat requirements between 30 and 50 percent, with some limited evidence that the upper limit may be even higher, depending on the organism/species phenomenon under investigation or land-use/resource management planning regime being considered/used.
As shown in Figure 23, 30 percent of the Hobbs Drain catchment contains 847 hectares of upland forest and 111 hectares of lowland forest (treed swamps) versus the 26 percent of woodland cover in the Jock River subwatershed. This equals the 30 percent of forest cover that is identified as the minimum threshold required to sustain forest birds according to the Guideline and which may only support less than one half of potential species richness and marginally healthy aquatic systems. When forest cover drops below 30 percent, forest birds tend to disappear as breeders across the landscape.
Figure 23 Woodland cover and forest interior (2014)
4.2.1 Woodland (Patch) Size
According to the Ministry of Natural Resources’ Natural Heritage Reference Manual (Second Edition), larger woodlands are more likely to contain a greater diversity of plant and animal species and communities than smaller woodlands and have a greater relative importance for mobile animal species such as forest birds.
Bigger forests often provide a different type of habitat. Many forest birds breed far more successfully in larger forests than they do in smaller woodlots and some rely heavily on forest interior conditions. Populations are often healthier in regions with more forest cover and where forest fragments are grouped closely together or connected by corridors of natural habitat. Small forests support small numbers of wildlife. Some species are “area-sensitive” and tend not to inhabit small woodlands, regardless of forest interior conditions. Fragmented habitat also isolates local populations, especially small mammals, amphibians and reptiles with limited mobility. This reduces the healthy mixing of genetic traits that helps populations survive over the long run (Conserving the Forest Interior. Ontario Extension Notes, 2000).
The Environment Canada Guideline also notes that for forest plants that do not disperse broadly or quickly, preservation of some relatively undisturbed large forest patches is needed to sustain them because of their restricted dispersal abilities and specialized habitat requirements and to ensure continued seed or propagation sources for restored or regenerating areas nearby.
The Natural Heritage Reference Manual continues by stating that a larger size also allows woodlands to support more resilient nutrient cycles and food webs and to be big enough to permit different and important successional stages to co-exist. Small, isolated woodlands are more susceptible to the effects of blowdown, drought, disease, insect infestations, and invasions by predators and non-indigenous plants. It is also known that the viability of woodland wildlife depends not only on the characteristics of the woodland in which they reside, but also on the characteristics of the surrounding landscape where the woodland is situated. Additionally, the percentage of forest cover in the surrounding landscape, the presence of ecological barriers such as roads, the ability of various species to cross the matrix surrounding the woodland and the proximity of adjacent habitats interact with woodland size in influencing the species assemblage within a woodland.
In the Hobbs Drain catchment (in 2014), eighty-two (52 percent) of the 156 woodland patches are very small, being less than one hectare in size. Another 63 (40 percent) of the woodland patches ranging from one to less than 20 hectares in size tend to be dominated by edge-tolerant bird species. The remaining 11 (eight percent of) woodland patches range between 22 and 120 hectares in size. Ten of these patches contain woodland between 20 and 100 hectares and may support a few area-sensitive species and some edge intolerant species, but will be dominated by edge tolerant species.
Conversely, one (one percent) of the 156 woodland patches in the drainage area exceeds the 100 plus hectare size needed to support most forest dependent, area sensitive birds and is large enough to support approximately 60 percent of edge-intolerant species. No patch tops 200 hectares, which according to the Environment Canada Guideline will support 80 percent of edge-intolerant forest bird species (including most area sensitive species) that prefer interior forest habitat conditions.
Table 11 presents a comparison of woodland patch size in 2008 and 2014 along with any changes that have occurred over that time. A decrease (of 23 ha) has been observed in the overall woodland patch area between the two reporting periods with most change occurring in the 50 to 100 hectare woodland patch size class range.
Table 11 Woodland patches in the Hobbs Drain catchment (2008 and 2014)
*Includes treed swamps
4.2.2 Woodland (Forest) Interior Habitat
The forest interior is habitat deep within woodlands. It is a sheltered, secluded environment away from the influence of forest edges and open habitats. Some people call it the “core” or the “heart” of a woodland. The presence of forest interior is a good sign of woodland health, and is directly related to the woodland’s size and shape. Large woodlands with round or square outlines have the greatest amount of forest interior. Small, narrow woodlands may have no forest interior conditions at all. Forest interior habitat is a remnant natural environment, reminiscent of the extensive, continuous forests of the past. This increasingly rare forest habitat is now a refuge for certain forest-dependent wildlife; they simply must have it to survive and thrive in a fragmented forest landscape (Conserving the Forest Interior. Ontario Extension Notes, 2000).
The Natural Heritage Reference Manual states that woodland interior habitat is usually defined as habitat more than 100 metres from the edge of the woodland and provides for relative seclusion from outside influences along with a moister, more sheltered and productive forest habitat for certain area sensitive species. Woodlands with interior habitat have centres that are more clearly buffered against the edge effects of agricultural activities or more harmful urban activities than those without.
In the Hobbs Drain catchment (in 2014), the 156 woodland patches contain 36 forest interior patches (Figure 23) that occupy three percent (89 ha.) of the catchment land area (which is equivalent to the three percent of interior forest in the Jock River Subwatershed). This is below the ten percent figure referred to in the Environment Canada Guideline that is considered to be the minimum threshold for supporting edge intolerant bird species and other forest dwelling species in the landscape.
Most patches (35) have less than 10 hectares of interior forest, 21 of which have small areas of interior forest habitat less than one hectare in size. Between 2008 and 2014, there has been an increase in the number of woodland patches containing smaller areas of interior habitat with an overall gain of three hectares in the catchment (Table 12), suggesting an increase in forest fragmentation over the six year period.
Table 12 Woodland Interior in the Hobbs Drain catchment (2008 and 2014)
4.3 Wetland Cover
Wetlands are habitats forming the interface between aquatic and terrestrial systems. They are among the most productive and biologically diverse habitats on the planet. By the 1980s, according to the Natural Heritage Reference Manual, 68 percent of the original wetlands south of the Precambrian Shield in Ontario had been lost through encroachment, land clearance, drainage and filling.
Wetlands perform a number of important ecological and hydrological functions and provide an array of social and economic benefits that society values. Maintaining wetland cover in a watershed provides many ecological, economic, hydrological and social benefits that are listed in the Reference Manual and which may include:
- contributing to the stabilization of shorelines and to the reduction of erosion damage through the mitigation of water flow and soil binding by plant roots
- mitigating surface water flow by storing water during periods of peak flow (such as spring snowmelt and heavy rainfall events) and releasing water during periods of low flow (this mitigation of water flow also contributes to a reduction of flood damage)
- contributing to an improved water quality through the trapping of sediments, the removal and/or retention of excess nutrients, the immobilization and/or degradation of contaminants and the removal of bacteria
- providing renewable harvesting of timber, fuel wood, fish, wildlife and wild rice
- contributing to a stable, long-term water supply in areas of groundwater recharge and discharge
- providing a high diversity of habitats that support a wide variety of plants and animals
- acting as “carbon sinks” making a significant contribution to carbon storage
- providing opportunities for recreation, education, research and tourism
Historically, the overall wetland coverage within the Great Lakes basin exceeded 10 percent, but there was significant variability among watersheds and jurisdictions, as stated in the Environment Canada Guideline. In the Rideau Valley Watershed, it has been estimated that pre-settlement wetland cover averaged 35 percent using information provided by Ducks Unlimited Canada (2010) versus the 21 percent of wetland cover existing in 2014 derived from DRAPE imagery analysis.
Using the same dataset, it is estimated that pre-settlement (historic) wetland cover averaged 51 percent in the Jock River subwatershed versus the 24 percent of cover existing in 2014 (as summarized in Table 13).
Table 13 Wetland cover in the Jock River subwatershed and Hobbs Drain catchment (Historic to 2014)
This decline in wetland cover is also evident in the Hobbs Drain catchment (as seen in Figure 24) where wetland was reported to cover 28 percent of the area prior to settlement, as compared to 24 percent in 2014. This represents a 17 percent loss of historic wetland cover. To maintain critical hydrological, ecological functions along with related recreational and economic benefits provided by these wetland habitats in the catchment, a “no net loss” of currently existing wetlands should be employed to ensure the continued provision of tangible benefits accruing from them to landowners and surrounding communities.
Figure 24 Hobbs Drain catchment wetland cover
4.4 Shoreline Cover
The riparian or shoreline zone is that special area where the land meets the water. Well-vegetated shorelines are critically important in protecting water quality and creating healthy aquatic habitats, lakes and rivers. Natural shorelines intercept sediments and contaminants that could impact water quality conditions and harm fish habitat in streams. Well established buffers protect the banks against erosion, improve habitat for fish by shading and cooling the water and provide protection for birds and other wildlife that feed and rear young near water. A recommended target (from the Environment Canada Guideline) is to maintain a minimum 30 metre wide vegetated buffer along at least 75 percent of the length of both sides of rivers, creeks and streams.
Figure 25 shows the extent of the ‘Natural’ vegetated riparian zone (predominantly wetland/woodland features) and ‘Other’ anthropogenic cover (crop/pastureland, roads/railways, settlements) along a 30-metre-wide area of land, both sides of the shoreline of the Jock River and its tributaries in the Hobbs Drain catchment.
Figure 25 Natural and other riparian land cover in the Hobbs Drain catchment
This analysis shows that the riparian zone in the Hobbs Drain catchment in 2014 was comprised of wetland (39 percent), crop and pastureland (29 percent), woodland (15 percent), transportation (six percent), meadow-thicket (five percent), settlement (four percent) and aggregates (two percent). Additional statistics for the Hobbs Drain catchment are presented in Table 14 and show that there has been very little change in shoreline cover from 2008 to 2014.
Table 14 Riparian land cover (2008 vs. 2014) in the Hobbs Drain catchment
5.0 Hobbs Drain Catchment: Stewardship and Water Resources Protection
The RVCA and its partners are working to protect and enhance environmental conditions in the Jock River Subwatershed. Figure 26 shows the location of all stewardship projects completed in the Hobbs Drain catchment along with sites identified for potential shoreline restoration.
5.1 Rural Clean Water Projects
From 2010 to 2015, one well decommissioning was completed and between 2004 and 2009, two well upgrades and one septic system replacement were completed. Total value of the four projects is $24,594 with $3,684 of that amount funded through grant dollars from the RVCA.
Figure 26 Stewardship site locations
5.2 Private Land Forestry Projects
The location of RVCA tree planting projects is shown in Figure 26. From 2010 to 2015, 5,000 trees were planted at one site. Between 2004 and 2009, 2,700 trees were planted at two sites and prior to 2004, 16,350 trees were planted at five sites, In total, 24,050 trees were planted resulting in the reforestation of 12 hectares. One of these projects was completed within the 30 metre riparian zone of the Hobbs Drain. Total project value of all eight projects is $82,426 with $30,779 of that amount coming from fundraising sources.
Through the RVCA Butternut Recovery Program, an additional 10 butternut trees were planted in the Hobbs Drain catchment (Figure 26) between 2010 and 2015, as part of efforts to introduce healthy seedlings from tolerant butternuts into various locations across Eastern Ontario.
5.3 Ontario Drinking Water Stewardship Projects
Figure 26 shows the location of all Ontario Drinking Water Stewardship Program (ODWSP) projects in the Hobbs Drain catchment. From 2010 to 2015, five fuel handling and storage facilities were constructed at a total value of $29,108 with $3,569 of that amount funded by the Ontario Ministry of the Environment.
5.4 Valley, Stream, Wetland and Hazard Lands
The Hobbs Drain catchment covers 32 square kilometres with 4.5 square kilometres (or 14 percent) of the drainage area being within the regulation limit of Ontario Regulation 174/06 (Figure 27), giving protection to wetland areas and river or stream valleys that are affected by flooding and erosion hazards.
Wetlands occupy 7.6 sq. km. (or 24 percent) of the catchment. Of these wetlands, 4.2 sq. km (or 56 percent) are designated as provincially significant and included within the RVCA regulation limit. This leaves the remaining 3.3 sq. km (or 44 percent) of wetlands in the catchment outside the regulated area limit.
Of the 65.8 kilometres of stream in the catchment, regulation limit mapping has been plotted along 11.8 kilometers of streams (representing 18 percent of all streams in the catchment). Some of these regulated watercourses (9.7 km or 15 percent of all streams) flow through regulated wetlands; the remaining 2.1 km (or 18 percent) of regulated streams are located outside of those wetlands. Plotting of the regulation limit on the remaining 54 km (or 82 percent) of streams requires identification of flood and erosion hazards and valley systems.
Within those areas of the Hobbs Drain catchment subject to the regulation (limit), efforts (have been made and) continue through RVCA planning and regulations input and review to manage the impact of development (and other land management practices) in areas where “natural hazards” are associated with rivers, streams, valley lands and wetlands. For areas beyond the regulation limit, protection of the catchment’s watercourses is only provided through the “alteration to waterways” provision of the regulation.
Figure 27 RVCA regulation limits
5.5 Vulnerable Drinking Water Areas
A portion of the Wellhead Protection Area around the Munster municipal drinking water source is located within the Hobbs Drain drainage catchment. This area is subject to mandatory policies in the Mississippi-Rideau Source Protection Plan developed under the Clean Water Act. These policies specifically regulate land uses and activities that are considered drinking water threats, thereby reducing the risk of contamination of the municipal drinking water source.
The Hobbs Drain drainage catchment is also considered to have a Highly Vulnerable Aquifer. This means that the nature of the overburden (thin soils, fractured bedrock) does not provide a high level of protection for the underlying groundwater making the aquifer more vulnerable to contaminants released on the surface. The Mississippi-Rideau Source Protection Plan includes policies that focus on the protection of groundwater region-wide due to the fact that most of the region, which encompasses the Mississippi and Rideau watersheds, is considered Highly Vulnerable Aquifer.
The lands immediately to the west and north of Munster Hamlet are also considered a Significant Groundwater Recharge Area. This means that there is a volume of water moving from the surface into the ground and groundwater serves either as a municipal drinking water source or supplies a coldwater ecosystem such as a brook trout stream. The Plan was not required to include policies to specifically address Significant Groundwater Recharge Areas.
For detailed maps and policies that have been developed to protect drinking water sources, please go to the Mississippi-Rideau Source Protection Region website at www.mrsourcewater.ca to view the Mississippi-Rideau Source Protection Plan.
6.0 Hobbs Drain Catchment: Challenges/Issues
Water Quality/Quantity
Surface chemistry water quality rating along the Hobbs Drain is “Fair”. The score at this site is largely influenced by occasional high nutrient concentrations, bacterial pollution and metal (aluminum) exceedances.
Instream biological water quality conditions at the Hobbs Drain sample location range from “ Poor” to “Excellent” from 2004 to 2015 (using a grading scheme developed by Ontario Conservation Authorities in Ontario for benthic invertebrates) with an overall benthic invertebrate water quality rating of “Good” determined for this period.
Natural hazard lands have not been identified.
Drainage problems have led to establishment of altered wetland conditions and land use conflict (amongst development, quarry, agriculture and wetland conservation interests).
Existing hydrological and geochemical datasets and assessments (academic, RVCA, others) are only recently available and/or are not being considered in the characterization of the numerous hydrologic functions of the Jock River subwatershed. Further, there is a dearth of hydrologic information (hydroperiod, groundwater/surface water interactions, geochemistry) about the wetlands that remain in the Jock River subwatershed.
Headwaters/Instream/Shorelines
‘Natural’ vegetation covers 58 percent of the riparian zone of the Hobbs Drain and its tributaries (Figure 25 and is below the recommended 30 metre wide, naturally vegetated target along 75 percent of the length of the catchment’s watercourses
No information available about instream aquatic and riparian conditions along Hobbs Drain
Land Cover
Woodlands cover 30 percent of the catchment and equals the 30 percent of forest cover that is identified as the minimum threshold for sustaining forest birds and other woodland dependent species (Figure 23)
Pre-settlement wetlands have declined by 17 percent and now cover 24 percent (756 ha.) of the catchment (Figure 24). Forty-four percent (334 ha.) of these wetlands remain unevaluated/unregulated and are vulnerable to drainage and land clearing activities in the absence of any regulatory and planning controls that would otherwise protect them for the many important hydrological, social, biological and ecological functions/services/values they provide to landowners and the surrounding community
7.0 Hobbs Drain Catchment: Opportunities/Actions
Water Quality/Quantity
Offer the suite of water quality improvement projects (including the new tile drainage control outlet management funding) provided by the Rideau Valley Rural Clean Water Program to landowners where opportunities exist to manage rural runoff to the Hobbs Drain and tributaries:
- Homeowners may be interested in projects to repair, replace or upgrade their well or septic system, or addressing erosion through buffer plantings and erosion control
- Farmers can take advantage of a wide range of projects, including livestock fencing, manure storage, tile drainage control structures, cover crops, and many more
Continue to coordinate environmental monitoring and reporting activities with the City of Ottawa
Use wetland restoration as a tool to improve surface water quality and help restore the hydrologic integrity of the Jock River and its tributaries, including Hobbs Drain
List, share and when possible, synthesize and use existing hydrological and geochemical datasets and assessment outcomes to facilitate the characterization of subwatershed and catchment hydrological functions. In addition, prepare guidance on best practices for the preparation of water budget assessments to better understand the hydrologic cycle requirements that occur at site specific scales; and share existing catchment and subwatershed scale water budget assessment outcomes
Flewellyn Special Study Area, Cumulative Effects Study has been initiated by the City of Ottawa to better understand the hydrology in the area and associated drainage concerns
Hobbs Drain flood risks are to be studied as part of ongoing efforts to prepare flood plain mapping for the Jock River subwatershed
Headwaters/Instream/Shorelines
Promote the Rideau Valley Shoreline Naturalization Program to landowners to increase existing 39 percent of natural shoreline cover
Educate landowners about the value of and best management practices used to maintain and enhance natural shorelines and headwater drainage features
Work with the City of Ottawa to consistently implement current land use planning and development policies for water quality and shoreline protection (i.e., adherence to a minimum 30 metre development setback from water) adjacent to the Jock River and other catchment watercourses, including the Hobbs Drain
Target shoreline restoration at sites identified in this report (shown as “Other riparian land cover” in Figure 25) and explore other restoration and enhancement opportunities along the Hobbs Drain and its tributaries
Land Cover
Promote the City of Ottawa’s Green Acres Reforestation Program to landowners to increase existing 30 percent of woodland cover
Encourage the City of Ottawa to strengthen natural heritage and water resources policies in official plans and zoning by-laws where shoreline, wetland, woodland cover and watercourse setbacks are determined to be at or below critical ecological thresholds. Information for this purpose is provided in the RVCA’s subwatershed and catchment reports
Explore ways and means to more effectively enforce and implement conditions of land-use planning and development approvals to achieve net environmental gains
Re-consider the RVCA’s approach to wetland regulation where there is an identified hydrologic imperative to do so (i.e., significant loss of historic wetland cover (see Figure 24) and/or seasonal, critically low baseflows in the Jock River and/or areas of seasonal flooding)
Full Catchment Report
Jock River Subwatershed Report 2016
JENKINSON DRAIN CATCHMENT
The RVCA produces individual reports for 12 catchments in the Jock River subwatershed. Using data collected and analyzed by the RVCA through its watershed monitoring and land cover classification programs, surface water quality and in-stream conditions are reported for the Jock River along with a summary of environmental conditions for the surrounding countryside every six years.
This information is used to better understand the effects of human activity on our water resources, allows us to better track environmental change over time and helps focus watershed management actions where they are needed the most to help sustain the ecosystem services (cultural, aesthetic and recreational values; provisioning of food, fuel and clean water; regulation of erosion/natural hazard protection and water purification; supporting nutrient/water cycling and habitat provision) provided by the catchment’s lands and forests and waters (Millennium Ecosystem Assessment 2005).
The following sections of this report for the Jenkinson Drain catchment are a compilation of that work.
| Catchment Facts |
Section 1.0 |
| Riparian Conditions |
Section 2.0 |
| Land Cover |
Section 3.0 |
| Land Stewardship and Water Resources Protection |
Section 4.0 |
| Challenges/Issues |
Section 5.0 |
| Actions/Opportunities |
Section 6.0 |
For other Jock River catchments and the Jock River Subwatershed Report, please visit the RVCA website at www.rvca.ca

Figure 1 Land cover in the Jenkinson Drain catchment
1.0 Jenkinson Drain Catchment: Facts
1.1 General/Physical Geography
Municipalities
- Ottawa: (23 km2; 100% of catchment)
Geology/Physiography
- The Jenkinson Drain Catchment resides with an extensive physiographic region known as the Smith Falls Limestone Plain. In this catchment, the limestone plain is overlain by glacial till in the southern parts and across the northern parts, significant areas of organic soils and some localized areas of beach sands and gravels
- In this catchment, bedrock mostly consists of interbedded limestone and dolostone from the Gull River Formation, some dolostone from the Oxford Formation in the southern parts, and some limestone from the Bobcaygeon Formation in the northern parts. In addition, geologic faults may pass through the catchment
Topography
- The ground surface ranges in elevation from approximately 162 masl north of Hwy 7 to approximately 114 masl at the catchment’s outlet
Drainage Area
- 23 square kilometers; occupies four percent of the Jock River subwatershed, one-half percent of the Rideau Valley watershed
Stream Length
- Jenkinson Drain and tributaries: 58 km
1.2 Vulnerable Areas
Aquifer Vulnerability
- The Mississippi-Rideau Source Protection initiative has mapped scattered parts of this catchment as a significant groundwater recharge areas and all the catchment as Highly Vulnerable Aquifer. Parts of Wellhead Protection Areas (WHPA) B, C and D for the municipal wells in Munster Hamlet underlie most of this catchment
Wetland Hydrology
- A watershed model developed by the RVCA in 2009 was used to study the hydrologic function of wetlands in the Rideau Valley Watershed, including those found in the Jenkinson Drain catchment
1.3 Conditions at a Glance
Water Quality
- Surface chemistry water quality rating for the Jenkinson Drain is unknown
- Instream biological water quality conditions in the Jenkinson Drain are unknown
Instream and Riparian
- Overall instream and riparian condition for the Jenkinson Drain is unknown
Thermal Regime
- Warm/cool water thermal guild supporting the Jock River fishery
Fish Community
- Five species of bait fish
Shoreline Cover Type (30 m. riparian area; 2014)
- Crop and Pasture (32%)
- Wetland (20%)
- Woodland (20%)
- Settlement (19%)
- Transportation (7%)
- Aggregate (1)
- Meadow-Thicket (<1%)
Land Cover Type (2014)
- Crop and Pasture (37%)
- Woodland (25%)
- Wetland (14%)
- Settlement (14%)
- Meadow-Thicket (4%)
- Transportation (3%)
- Aggregate (2%)
- Water (<1%)
Land Cover Change (2008 to 2014)
- Crop and Pasture (-23 ha)
- Woodland (-23 ha)
- Meadow-Thicket (-11 ha)
- Wetland (-3 ha)
- Aggregate (-1 ha)
- Water (+3 ha)
- Transportation (+9 ha)
- Settlement (+51 ha)
Significant Natural Features
- Huntley Provincially Significant Wetland
Water Wells
- Few hundred (~250) operational private water wells. Groundwater uses are mainly domestic, but also include livestock watering and crop irrigation, groundwater monitoring and testing and commercial uses
Aggregates
- Part of one bedrock quarry license located within the catchment
Species at Risk (Elemental Occurrence)
- Spotted Turtle (Endangered)
- Eastern Meadowlark (Threatened)
1.4 Catchment Care
Stewardship
- Twelve stewardship projects undertaken (see Section 4)
Environmental Monitoring
- Nine headwater drainage feature assessments in 2015 at road crossings in the catchment. The protocol measures zero, first and second order headwater drainage features and is a rapid assessment method characterizing the amount of water, sediment transport, and storage capacity within headwater drainage features (see Section 2.2)
- Groundwater level and chemistry data is available from PGMN wells located along Fernbank Road (W175). Additional groundwater chemistry information is available from the Ontario Geological Survey for a well located in this catchment
Environmental Management
- Development along the Jenkinson Drain and in and adjacent to the Huntley Provincially Significant Wetland in the catchment is subject to Ontario Regulation 174-06 (entitled “Development, Interference with Wetlands and Alterations to Shorelines and Watercourses”) that protects the hydrologic function of the wetland and also protects landowners and their property from natural hazards (flooding, fluctuating water table, unstable soils) associated with them
- Twelve active Permits To Take Water (PTTW) in the catchment issued for golf course irrigation, water supply and other commercial water supply
- One Environmental Compliance Approval in this catchment for air emissions
2. Surface Water Quality Conditions
Barbers Creek Water Quality
Water Quality Rating
Nutrients
Summary
E. Coli
Summary
Metals
Summary
[1] - copy this to the where the link to the footnote is in the text, then delete is line
[1] type footnote text here
[2] Lorem ipus
2.0 Jenkinson Drain Catchment: Riparian Conditions
2.1 Jenkinson Drain Instream Aquatic Habitat
2.1.1 Groundwater
Groundwater discharge areas can influence stream temperature, contribute nutrients, and provide important stream habitat for fish and other biota. During headwater surveys, indicators of groundwater discharge are noted when observed. Indicators include: springs/seeps, watercress, iron staining, significant temperature change and rainbow mineral film. Figure 2 shows areas where one or more of the above groundwater indicators were observed during headwater assessments.
Figure 2 Groundwater indicators observed in the Jenkinson Drain catchment
2.1.2 Fish Community
The Jenkinson Drain catchment is classified as a mixed community of warm and cool water baitfish fishery with 5 species observed. Figure 3 shows the sampling locations in the Jenkinson Drain catchment.
Figure 3 Jenkinson Drain catchment fish community
The following table contains a list of species observed in the watershed.
Table 1 Fish species observed in Jenkinson Drain catchment
2.2 Jenkinson Drain Headwater Drainage Features Assessment
2.2.1 Headwater Sampling Locations
The RVCA Stream Characterization program assessed Headwater Drainage Features for the Jock River subwatershed in 2015. This protocol measures zero, first and second order headwater drainage features (HDF). It is a rapid assessment method characterizing the amount of water, sediment transport, and storage capacity within headwater drainage features (HDF). RVCA is working with other Conservation Authorities and the Ministry of Natural Resources and Forestry to implement the protocol with the goal of providing standard datasets to support science development and monitoring of headwater drainage features. An HDF is a depression in the land that conveys surface flow. Additionally, this module provides a means of characterizing the connectivity, form and unique features associated with each HDF (OSAP Protocol, 2013). In 2015 the program sampled 9 sites at road crossings in the Jenkinson Drain catchment area (Figure 4).

Figure 4 Locations of the headwater sampling sites in the Jenkinson Drain catchment
2.2.2 Headwater Feature Type
The headwater sampling protocol assesses the feature type in order to understand the function of each feature. The evaluation includes the following classifications: defined natural channel, channelized or constrained, multi-thread, no defined feature, tiled, wetland, swale, roadside ditch and pond outlet. By assessing the values associated with the headwater drainage features in the catchment area we can understand the ecosystem services that they provide to the watershed in the form of hydrology, sediment transport, and aquatic and terrestrial functions. Four features were classified as having been channelized, one was classified as a road side ditch, two were dominated by wetland, one swale and one feature was identified as natural. Figure 5 shows the feature type of the primary feature at the sampling locations.
Figure 5 Headwater feature types in the Jenkinson Drain catchment
2.2.3 Headwater Feature Flow
The observed flow condition within headwater drainage features can be highly variable depending on timing relative to the spring freshet, recent rainfall, soil moisture, etc. Flow conditions are assessed in the spring and in the summer to determine if features are perennial and flow year round, if they are intermittent and dry up during the summer months or if they are ephemeral systems that do not flow regularly and generally respond to specific rainstorm events or snowmelt. Flow conditions in headwater systems can change from year to year depending on local precipitation patterns. Figure 6 shows the observed flow conditions at the sampling locations in the Jenkinson Drain catchment in 2015.
Figure 6 Headwater feature flow conditions in the Jenkinson Drain catchment
A spring photo of the headwater sample site in the Jenkinson Drain catchment located on Flewellyn Road
A summer photo of the headwater sample site in the Jenkinson Drain catchment located on Flewellyn Road
2.3.4 Headwater Feature Channel Modifications
Channel modifications were assessed at each headwater drainage feature sampling location. Modifications include dredging, channel hardening and mixed modifications. The Jenkinson Drain catchment area had one site classified as having no channel modifications, one features were classified as being hardened, five features had been dredged and two had mixed modifications. Figure 7 shows the channel modifications observed at the sampling locations for Jenkinson Drain.
Figure 7 Headwater feature channel modifications in the Jenkinson Drain catchment
2.3.5 Headwater Feature Vegetation
Headwater feature vegetation evaluates the type of vegetation that is found within the drainage feature. The type of vegetated within the channel influences the aquatic and terrestrial ecosystem values that the feature provides. For some types of headwater features the vegetation within the feature plays a very important role in flow and sediment movement and provides fish and wildlife habitat. The following classifications are evaluated no vegetation, lawn, wetland, meadow, scrubland and forest. The features assessed in the Jenkinson Drain catchment were classified being dominated by wetland and meadow vegetation. Figure 8 depicts the dominant vegetation observed at the sampled headwater sites in the Jenkinson Drain catchment.
Figure 8 Headwater feature vegetation types in the Jenkinson Drain catchment
2.3.6 Headwater Feature Riparian Vegetation
Headwater riparian vegetation evaluates the type of vegetation that is found along the adjacent lands of a headwater drainage feature. The type of vegetation within the riparian corridor influences the aquatic and terrestrial ecosystem values that the feature provides to the watershed. Four sample locations in Jenkinson Drain were dominated by natural vegetation in the form of scrubland, meadow and wetland vegetation. Five sample locations were dominated by other forms of vegetation of either crops or ornamental grasses. Figure 9 depicts the type of riparian vegetation observed at the sampled headwater sites in the Jenkinson Drain catchment.
Figure 9 Headwater feature riparian vegetation types in the Jenkinson Drain catchment
2.3.7 Headwater Feature Sediment Deposition
Assessing the amount of recent sediment deposited in a channel provides an index of the degree to which the feature could be transporting sediment to downstream reaches (OSAP, 2013). Evidence of excessive sediment deposition might indicate the requirement to follow up with more detailed targeted assessments upstream of the site location to identify potential best management practices to be implemented. Conditions ranged from no deposition observed to extensive deposition recorded. Figure 10 depicts the degree of sediment deposition observed at the sampled headwater sites in the Jenkinson Drain catchment.
Figure 10 Headwater feature sediment deposition in the Jenkinson Drain catchment
2.3.8 Headwater Feature Upstream Roughness
Feature roughness will provide a measure of the amount of materials within the bankfull channel that could slow down the velocity of water flowing within the headwater feature (OSAP, 2013). Materials on the channel bottom that provide roughness include vegetation, woody debris and boulders/cobble substrates. Roughness can provide benefits in mitigating downstream erosion on the headwater drainage feature and the receiving watercourse by reducing velocities. Roughness also provides important habitat conditions for aquatic organisms. The sample locations in the Jenkinson Drain catchment area ranged from minimal to extreme roughness conditions. Figure 11 shows the feature roughness conditions at the sampling locations in the Jenkinson Drain catchment.
Figure 11 Headwater feature roughness in the Jenkinson Drain catchment
3.0 Jenkinson Drain Catchment: Land Cover
Land cover and any change in coverage that has occurred over a six year period is summarized for the Jenkinson Drain catchment using spatially continuous vector data representing the catchment during the spring of 2008 and 2014. This dataset was developed by the RVCA through heads-up digitization of 20cm DRAPE ortho-imagery at a 1:4000 scale and details the surrounding landscape using 10 land cover classes.
3.1 Jenkinson Drain Catchment Change
As shown in Table 2 and Figure 1, the dominant land cover type in 2014 was crop and pastureland, followed by woodland, wetland and settlement.
Table 2 Land cover (2008 vs. 2014) in the Jenkinson Drain catchment
* Does not include treed swamps ** Includes treed swamps
From 2008 to 2014, there was an overall change of 85 hectares (from one land cover class to another). Most of the change in the Jenkinson Drain catchment is a result of the conversion of crop and pastureland, meadow-thicket and woodland to settlement (Figure 12).
Figure 12 Land cover change in the Jenkinson Drain catchment (2014)
Table 3 provides a detailed breakdown of all land cover change that has taken place in the Jenkinson Drain catchment between 2008 and 2014.
Table 3 Land cover change in the Jenkinson Drain catchment (2008 to 2014)
3.2 Woodland Cover
In the Environment Canada Guideline (Third Edition) entitled “How Much Habitat Is Enough?” (hereafter referred to as the “Guideline”) the opening narrative under the Forest Habitat Guidelines section states that prior to European settlement, forest was the predominant habitat in the Mixedwood Plains ecozone. The remnants of this once vast forest now exist in a fragmented state in many areas (including the Rideau Valley watershed) with woodland patches of various sizes distributed across the settled landscape along with higher levels of forest cover associated with features such as the Frontenac Axis (within the on-Shield areas of the Rideau Lakes and Tay River subwatersheds). The forest legacy, in terms of the many types of wildlife species found, overall species richness, ecological functions provided and ecosystem complexity is still evident in the patches and regional forest matrices (found in the Jock River subwatershed and elsewhere in the Rideau Valley watershed). These ecological features are in addition to other influences which forests have on water quality and stream hydrology including reducing soil erosion, producing oxygen, storing carbon along with many other ecological services that are essential not only for wildlife but for human well-being.
The Guideline also notes that forests provide a great many habitat niches that are in turn occupied by a great diversity of plant and animal species. They provide food, water and shelter for these species - whether they are breeding and resident locally or using forest cover to help them move across the landscape. This diversity of species includes many that are considered to be species at risk. Furthermore, from a wildlife perspective, there is increasing evidence that the total forest cover in a given area is a major predictor of the persistence and size of bird populations, and it is possible or perhaps likely that this pattern extends to other flora and fauna groups. The overall effect of a decrease in forest cover on birds in fragmented landscapes is that certain species disappear and many of the remaining ones become rare, or fail to reproduce, while species adapted to more open and successional habitats, as well as those that are more tolerant to human-induced disturbances in general, are able to persist and in some cases thrive. Species with specialized-habitat requirements are most likely to be adversely affected. The overall pattern of distribution of forest cover, the shape, area and juxtaposition of remaining forest patches and the quality of forest cover also play major roles in determining how valuable forests will be to wildlife and people alike.
The current science generally supports minimum forest habitat requirements between 30 and 50 percent, with some limited evidence that the upper limit may be even higher, depending on the organism/species phenomenon under investigation or land-use/resource management planning regime being considered/used.
As shown in Figure 13, 27 percent of the Jenkinson Drain catchment contains 590 hectares of upland forest and 316 hectares of lowland forest (treed swamps) versus the 26 percent of woodland cover in the Jock River subwatershed. This is less than the 30 percent of forest cover that is identified as the minimum threshold required to sustain forest birds according to the Guideline and which may only support less than one half of potential species richness and marginally healthy aquatic systems. When forest cover drops below 30 percent, forest birds tend to disappear as breeders across the landscape.
Figure 13 Woodland cover and forest interior (2014)
3.2.1 Woodland (Patch) Size
According to the Ministry of Natural Resources’ Natural Heritage Reference Manual (Second Edition), larger woodlands are more likely to contain a greater diversity of plant and animal species and communities than smaller woodlands and have a greater relative importance for mobile animal species such as forest birds.
Bigger forests often provide a different type of habitat. Many forest birds breed far more successfully in larger forests than they do in smaller woodlots and some rely heavily on forest interior conditions. Populations are often healthier in regions with more forest cover and where forest fragments are grouped closely together or connected by corridors of natural habitat. Small forests support small numbers of wildlife. Some species are “area-sensitive” and tend not to inhabit small woodlands, regardless of forest interior conditions. Fragmented habitat also isolates local populations, especially small mammals, amphibians and reptiles with limited mobility. This reduces the healthy mixing of genetic traits that helps populations survive over the long run (Conserving the Forest Interior. Ontario Extension Notes, 2000).
The Environment Canada Guideline also notes that for forest plants that do not disperse broadly or quickly, preservation of some relatively undisturbed large forest patches is needed to sustain them because of their restricted dispersal abilities and specialized habitat requirements and to ensure continued seed or propagation sources for restored or regenerating areas nearby.
The Natural Heritage Reference Manual continues by stating that a larger size also allows woodlands to support more resilient nutrient cycles and food webs and to be big enough to permit different and important successional stages to co-exist. Small, isolated woodlands are more susceptible to the effects of blowdown, drought, disease, insect infestations, and invasions by predators and non-indigenous plants. It is also known that the viability of woodland wildlife depends not only on the characteristics of the woodland in which they reside, but also on the characteristics of the surrounding landscape where the woodland is situated. Additionally, the percentage of forest cover in the surrounding landscape, the presence of ecological barriers such as roads, the ability of various species to cross the matrix surrounding the woodland and the proximity of adjacent habitats interact with woodland size in influencing the species assemblage within a woodland.
In the Jenkinson Drain catchment (in 2014), fifty-two (45 percent) of the 115 woodland patches are very small, being less than one hectare in size. Another 54 (47 percent) of the woodland patches ranging from one to less than 20 hectares in size tend to be dominated by edge-tolerant bird species. The remaining nine (eight percent of) woodland patches range between 20 and 72 hectares in size and may support a few area-sensitive species and some edge intolerant species, but will be dominated by edge tolerant species.
No patch exceeds the 100 plus hectare size needed to support most forest dependent, area sensitive birds and which are, when present, large enough to support approximately 60 percent of edge-intolerant species. Nor does any patch top 200 hectares, which according to the Environment Canada Guideline will support 80 percent of edge-intolerant forest bird species (including most area sensitive species) that prefer interior forest habitat conditions.
Table 4 presents a comparison of woodland patch size in 2008 and 2014 along with any changes that have occurred over that time. A decrease (of 22 ha) has been observed in the overall woodland patch area between the two reporting periods with most change occurring in the 20 to 50 hectare woodland patch size class range.
Table 4 Woodland patches in the Jenkinson Drain catchment (2008 and 2014)
*Includes treed swamps
3.2.2 Woodland (Forest) Interior Habitat
The forest interior is habitat deep within woodlands. It is a sheltered, secluded environment away from the influence of forest edges and open habitats. Some people call it the “core” or the “heart” of a woodland. The presence of forest interior is a good sign of woodland health, and is directly related to the woodland’s size and shape. Large woodlands with round or square outlines have the greatest amount of forest interior. Small, narrow woodlands may have no forest interior conditions at all. Forest interior habitat is a remnant natural environment, reminiscent of the extensive, continuous forests of the past. This increasingly rare forest habitat is now a refuge for certain forest-dependent wildlife; they simply must have it to survive and thrive in a fragmented forest landscape (Conserving the Forest Interior. Ontario Extension Notes, 2000).
The Natural Heritage Reference Manual states that woodland interior habitat is usually defined as habitat more than 100 metres from the edge of the woodland and provides for relative seclusion from outside influences along with a moister, more sheltered and productive forest habitat for certain area sensitive species. Woodlands with interior habitat have centres that are more clearly buffered against the edge effects of agricultural activities or more harmful urban activities than those without.
In the Jenkinson Drain catchment (in 2014), the 115 woodland patches contain 17 forest interior patches (Figure 13) that occupy two percent (47 ha.) of the catchment land area (which is less than the three percent of interior forest in the Jock River Subwatershed). This is below the ten percent figure referred to in the Environment Canada Guideline that is considered to be the minimum threshold for supporting edge intolerant bird species and other forest dwelling species in the landscape.
Most patches (16) have less than 10 hectares of interior forest, seven of which have small areas of interior forest habitat less than one hectare in size. Between 2008 and 2014, there has been a change in the number of woodland patches containing interior habitat with an overall loss of two hectares in the catchment (Table 5), suggesting an increase in forest fragmentation over the six year period.
Table 5 Woodland interior in the Jenkinson Drain catchment (2008 and 2014)
3.3 Wetland Cover
Wetlands are habitats forming the interface between aquatic and terrestrial systems. They are among the most productive and biologically diverse habitats on the planet. By the 1980s, according to the Natural Heritage Reference Manual, 68 percent of the original wetlands south of the Precambrian Shield in Ontario had been lost through encroachment, land clearance, drainage and filling.
Wetlands perform a number of important ecological and hydrological functions and provide an array of social and economic benefits that society values. Maintaining wetland cover in a watershed provides many ecological, economic, hydrological and social benefits that are listed in the Reference Manual and which may include:
- contributing to the stabilization of shorelines and to the reduction of erosion damage through the mitigation of water flow and soil binding by plant roots
- mitigating surface water flow by storing water during periods of peak flow (such as spring snowmelt and heavy rainfall events) and releasing water during periods of low flow (this mitigation of water flow also contributes to a reduction of flood damage)
- contributing to an improved water quality through the trapping of sediments, the removal and/or retention of excess nutrients, the immobilization and/or degradation of contaminants and the removal of bacteria
- providing renewable harvesting of timber, fuel wood, fish, wildlife and wild rice
- contributing to a stable, long-term water supply in areas of groundwater recharge and discharge
- providing a high diversity of habitats that support a wide variety of plants and animals
- acting as “carbon sinks” making a significant contribution to carbon storage
- providing opportunities for recreation, education, research and tourism
Historically, the overall wetland coverage within the Great Lakes basin exceeded 10 percent, but there was significant variability among watersheds and jurisdictions, as stated in the Environment Canada Guideline. In the Rideau Valley Watershed, it has been estimated that pre-settlement wetland cover averaged 35 percent using information provided by Ducks Unlimited Canada (2010) versus the 21 percent of wetland cover existing in 2014 derived from DRAPE imagery analysis.
Using the same dataset, it is estimated that pre-settlement (historic) wetland cover averaged 51 percent in the Jock River subwatershed versus the 24 percent of cover existing in 2014 (as summarized in Table 6).
Table 6 Wetland cover in the Jock River subwatershed and Jenkinson Drain catchment (Historic to 2014)
This decline in wetland cover is also evident in the Jenkinson Drain catchment (as seen in Figure 14) where wetland was reported to cover 47 percent of the area prior to settlement, as compared to 14 percent in 2014. This represents a 70 percent loss of historic wetland cover and what remains (in 2014) falls below the historic wetland threshold cited in the Environment Canada Guideline for maintaining key ecological and hydrological functions. To maintain critical hydrological, ecological functions along with related recreational and economic benefits provided by these wetland habitats in the catchment, a “no net loss” of currently existing wetlands should be employed to ensure the continued provision of tangible benefits accruing from them to landowners and surrounding communities along with efforts to create/restore wetlands in suitable areas.
Figure 14 Jenkinson Drain catchment wetland cover
3.4 Shoreline Cover
The riparian or shoreline zone is that special area where the land meets the water. Well-vegetated shorelines are critically important in protecting water quality and creating healthy aquatic habitats, lakes and rivers. Natural shorelines intercept sediments and contaminants that could impact water quality conditions and harm fish habitat in streams. Well established buffers protect the banks against erosion, improve habitat for fish by shading and cooling the water and provide protection for birds and other wildlife that feed and rear young near water. A recommended target (from the Environment Canada Guideline) is to maintain a minimum 30 metre wide vegetated buffer along at least 75 percent of the length of both sides of rivers, creeks and streams.
Figure 15 shows the extent of the ‘Natural’ vegetated riparian zone (predominantly wetland/woodland features) and ‘Other’ anthropogenic cover (crop/pastureland, roads/railways, settlements) along a 30-metre-wide area of land, both sides of the shoreline of the Jock River and its tributaries in the Jenkinson Drain catchment.
Figure 15 Natural and other riparian land cover in the Jenkinson Drain catchment
This analysis shows that the riparian zone in the Jenkinson Drain catchment in 2014 was comprised of crop and pastureland (32 percent), wetland (20 percent), woodland (20 percent), settlement (19 percent), transportation (seven percent) and aggregates (one percent). Additional statistics for the Jenkinson Drain catchment are presented in Table 7. Of particular interest is the observed increase in the area of “Settlement” and decrease in "Woodland" area along the shoreline of the Jenkinson Drain and tributaries over a six year period.
Table 7 Riparian land cover (2008 vs. 2014) in the Jenkinson Drain catchment
4.0 Jenkinson Drain Catchment: Stewardship and Water Resources Protection
The RVCA and its partners are working to protect and enhance environmental conditions in the Jock River Subwatershed. Figure 16 shows the location of all stewardship projects completed in the Jenkinson Drain catchment along with sites identified for potential shoreline restoration.
4.1 Rural Clean Water Projects
From 2004 to 2009, one septic system replacement, one well decommissioning, one well upgrade and one well replacement were completed and prior to 2004, one manure storage/wastewater runoff project was finished. No projects were undertaken between 2010 and 2015. Total value of all five projects is $64,530 with $16,782 of that amount funded through grant dollars from the RVCA.
 Figure 16
 Stewardship site locations
4.2 Private Land Forestry Projects
The location of RVCA tree planting projects is shown in Figure 16. From 2004 to 2009, 11,100 trees were planted at one site and prior to 2004, 10,090 trees were planted at 3 sites. In total, 21,190 trees were planted resulting in the reforestation of 12 hectares. No projects were undertaken between 2010 and 2015. Total value of all four projects is $84,653 with $24,319 of that amount coming from fundraising sources.
Through the RVCA Butternut Recovery Program, an additional 110 butternut trees were planted in the Jenkinson Drain catchment (Figure 16) between 2004 and 2015, as part of efforts to introduce healthy seedlings from tolerant butternuts into various locations across Eastern Ontario.
4.3 Ontario Drinking Water Stewardship Projects
Figure 16 shows the location of all Ontario Drinking Water Stewardship Program (ODWSP) projects in the Jenkinson Drain catchment. Between 2010 and 2015, two septic system replacements and one well upgrade were completed. Total project value is $31,543 with $18,709 of that amount funded by the Ontario Ministry of the Environment.
4.4 Valley, Stream, Wetland and Hazard Lands
The Jenkinson Drain catchment covers 23 square kilometres with 1.9 square kilometres (or 8 percent) of the drainage area being within the regulation limit of Ontario Regulation 174/06 (Figure 17), giving protection to wetland areas and river or stream valleys that are affected by flooding and erosion hazards.
Wetlands occupy 3.3 sq. km. (or 14 percent) of the catchment. Of these wetlands, 1.2 sq. km (or 36 percent) are designated as provincially significant and included within the RVCA regulation limit. This leaves the remaining 2.1 sq. km (or 64 percent) of wetlands in the catchment outside the regulated area limit.
Of the 58.6 kilometres of stream in the catchment, regulation limit mapping has been plotted along 6.7 kilometers of streams (representing 11 percent of all streams in the catchment). Some of these regulated watercourses (3.9 km or 7 percent of all streams) flow through regulated wetlands; the remaining 2.9 km (or 42 percent) of regulated streams are located outside of those wetlands. Plotting of the regulation limit on the remaining 51.8 km (or 89 percent) of streams requires identification of flood and erosion hazards and valley systems.
Within those areas of the Jenkinson Drain catchment subject to the regulation (limit), efforts (have been made and) continue through RVCA planning and regulations input and review to manage the impact of development (and other land management practices) in areas where “natural hazards” are associated with rivers, streams, valley lands and wetlands. For areas beyond the regulation limit, protection of the catchment’s watercourses is only provided through the “alteration to waterways” provision of the regulation.
Figure 17 RVCA regulation limits
4.5 Vulnerable Drinking Water Areas
A portion of the Wellhead Protection Area around the Munster municipal drinking water source is located within the Jenkinson Drain drainage catchment. This area is subject to mandatory policies in the Mississippi-Rideau Source Protection Plan developed under the Clean Water Act. These policies specifically regulate land uses and activities that are considered drinking water threats, thereby reducing the risk of contamination of the municipal drinking water source.
The Jenkinson Drain drainage catchment is also considered to have a Highly Vulnerable Aquifer. This means that the nature of the overburden (thin soils, fractured bedrock) does not provide a high level of protection for the underlying groundwater making the aquifer more vulnerable to contaminants released on the surface. The Mississippi-Rideau Source Protection Plan includes policies that focus on the protection of groundwater region-wide due to the fact that most of the region, which encompasses the Mississippi and Rideau watersheds, is considered Highly Vulnerable Aquifer.
For detailed maps and policies that have been developed to protect drinking water sources, please go to the Mississippi-Rideau Source Protection Region website at www.mrsourcewater.ca to view the Mississippi-Rideau Source Protection Plan.
5.0 Jenkinson Drain Catchment: Challenges/Issues
Water Quality/Quantity
No surface chemistry and benthic invertebrate water quality data is available for the Jenkinson Drain
Natural hazard lands have not been identified; however, it is deemed to be a low priority
Existing hydrological and geochemical datasets and assessments (academic, RVCA, others) are only recently available and/or are not being considered in the characterization of the numerous hydrologic functions of the Jock River subwatershed. Further, there is a dearth of hydrologic information (hydroperiod, groundwater/surface water interactions, geochemistry) about the wetlands that remain in the Jock River subwatershed
Headwaters/Instream/Shorelines
‘Natural’ vegetation covers 40 percent of the riparian zone of the Jenkinson Drain and its tributaries (Figure 15) and is below the recommended 30 metre wide, naturally vegetated target along 75 percent of the length of the catchment’s watercourses
No information available about instream aquatic and riparian conditions along Jenkinson Drain
Land Cover
Woodlands cover 27 percent of the catchment and is below the 30 percent of forest cover that is identified as the minimum threshold for sustaining forest birds and other woodland dependent species (Figure 13)
Pre-settlement wetlands have declined by 70 percent and now cover 14 percent (331 ha.) of the catchment (Figure 14). Sixty-four percent (213 ha.) of these wetlands remain unevaluated/unregulated and are vulnerable to drainage and land clearing activities in the absence of any regulatory and planning controls that would otherwise protect them for the many important hydrological, social, biological and ecological functions/services/values they provide to landowners and the surrounding community.
6.0 Jenkinson Drain Catchment: Opportunities/Actions
Water Quality/Quantity
Consider establishing a surface water quality sampling site along Jenkinson Drain
Offer the suite of water quality improvement projects (including the new tile drainage control outlet management funding) provided by the Rideau Valley Rural Clean Water Program to landowners where opportunities exist to manage rural runoff to the Jenkinson Drain and tributaries:
- Homeowners may be interested in projects to repair, replace or upgrade their well or septic system, or addressing erosion through buffer plantings and erosion control
- Farmers can take advantage of a wide range of projects, including livestock fencing, manure storage, tile drainage control structures, cover crops, and many more
Continue to coordinate environmental monitoring and reporting activities with the City of Ottawa
Use wetland restoration as a tool to improve surface water quality and help restore the hydrologic integrity of the Jock River and its tributaries, including Jenkinson Drain
List, share and when possible, synthesize and use existing hydrological and geochemical datasets and assessment outcomes to facilitate the characterization of subwatershed and catchment hydrological functions. In addition, prepare guidance on best practices for the preparation of water budget assessments to better understand the hydrologic cycle requirements that occur at site specific scales; and share existing catchment and subwatershed scale water budget assessment outcomes
Headwaters/Instream/Shorelines
Promote the Rideau Valley Shoreline Naturalization Program to landowners to increase existing 40 percent of natural shoreline cover
Educate landowners about the value of and best management practices used to maintain and enhance natural shorelines and headwater drainage features
Work with the City of Ottawa to consistently implement current land use planning and development policies for water quality and shoreline protection (i.e., adherence to a minimum 30 metre development setback from water) adjacent to the Jock River and other catchment watercourses, including the Jenkinson Drain
Target shoreline restoration at sites identified in this report (shown as “Other riparian land cover” in Figure 15) and explore other restoration and enhancement opportunities along the Jenkinson Drain and its tributaries
Land Cover
Promote the City of Ottawa’s Green Acres Reforestation Program to landowners to increase existing 27 percent of woodland cover
Encourage the City of Ottawa to strengthen natural heritage and water resources policies in official plans and zoning by-laws where shoreline, wetland, woodland cover and watercourse setbacks are determined to be at or below critical ecological thresholds. Information for this purpose is provided in the RVCA’s subwatershed and catchment reports
Explore ways and means to more effectively enforce and implement conditions of land-use planning and development approvals to achieve net environmental gains
Re-consider the RVCA’s approach to wetland regulation where there is an identified hydrologic imperative to do so (i.e., significant loss of historic wetland cover (see Fig. xx) and/or seasonal, critically low baseflows in the Jock River and/or areas of seasonal flooding)
Full Catchment Report
Jock River Subwatershed Report 2016
Ashton-Dwyer Hill Catchment
The RVCA produces individual reports for 12 catchments in the Jock River subwatershed. Using data collected and analyzed by the RVCA through its watershed monitoring and land cover classification programs, surface water quality and in-stream conditions are reported for the Jock River along with a summary of environmental conditions for the surrounding countryside every six years.
This information is used to better understand the effects of human activity on our water resources, allows us to better track environmental change over time and helps focus watershed management actions where they are needed the most to help sustain the ecosystem services (cultural, aesthetic and recreational values; provisioning of food, fuel and clean water; regulation of erosion/natural hazard protection and water purification; supporting nutrient/water cycling and habitat provision) provided by the catchment’s lands and forests and waters (Millennium Ecosystem Assessment 2005).
The following sections of this report for the Ashton-Dwyer Hill catchment are a compilation of that work.
| Catchment Facts |
Section 1.0 |
| Surface Water Quality Conditions |
Section 2.0 |
| Riparian Conditions |
Section 3.0 |
| Land Cover |
Section 4.0 |
| Land Stewardship and Water Resources Protection |
Section 5.0 |
| Challenges/Issues |
Section 6.0 |
| Actions/Opportunities |
Section 7.0 |
For other Jock River catchments and the Jock River Subwatershed Report, please visit the RVCA website at www.rvca.ca

Figure 1 Land cover in the Ashton-Dwyer Hill catchment
1.0 Jock River-Ashton Dwyer Hill: Catchment Facts
1.1 General/Physical Geography
Municipalities
- Beckwith (27 km2; 34% of catchment)
- Ottawa: (53 km2; 66% of catchment)
Geology/Physiography
- The Ashton Catchment resides with an extensive physiographic region known as the Smith Falls Limestone Plain. In this catchment, the limestone plain is generally but discontinuously overlain by glacial till, organic soils, sand and localized areas of beach sands and gravels
- In this catchment, bedrock includes the interbedded limestone and dolostone, sandstone with shale and limestone, dolostone, and some limestone respectively from the Gull River, Rockcliffe, Oxford and Bobcaygeon Formations. In addition, numerous geologic faults may pass through the catchment
Topography
- The ground surface ranges in elevation from approximately 162 masl near Hwy 7 to approximately 100 masl at the catchment’s outlet
Drainage Area
- 81 square kilometers; occupies 14 percent of the Jock River subwatershed, two percent of the Rideau Valley watershed
Stream Length
- Jock River and tributaries: 153 km
1.2 Vulnerable Areas
Flood/Erosion Hazard
- Jock River is subject to a flooding hazard during the regional storm flood (the 100 year flood). Surveys and studies undertaken in accordance with provincial standards have determined that the 100 year flood elevation in the catchment ranges from 124.9 metres above mean sea level at the upper, mapped extent of the regulation limit in Ashton Village to 101.8 metres above mean sea level at the Jock Trail
Aquifer Vulnerability
- The Mississippi-Rideau Source Protection initiative has mapped scattered parts of this catchment as a significant groundwater recharge areas and all the catchment as Highly Vulnerable Aquifer. Wellhead Protection Areas (WHPA) A and parts of WHPAs B, C and D for the municipal wells in Munster Hamlet, underlie a small part of the catchment near Bleeks Road and also Crawford Side Road
Wetland Hydrology
- A watershed model developed by the RVCA in 2009 was used to study the hydrologic function of wetlands in the Rideau Valley Watershed, including those found in the Ashton-Dwyer Hill catchment
1.3 Conditions at a Glance
Water Quality
- Surface chemistry water quality rating on the Jock River in the Ashton-Dwyer Hill catchment declines from “Fair” at the upstream (JR-45) site to “Poor” at the downstream site (JR-20). The scores at both sites are largely influenced by frequent high nutrient concentrations and periods of bacterial pollution (see Figure 2)
- Instream biological water quality conditions at the Jock River Ashton-Dwyer Hill sample location aquatic habitat conditions from a benthic invertebrate perspective is considered “Poor” from 2011 to 2015 as the samples are dominated by species that are moderately sensitive and tolerant to high organic pollution levels
Instream and Riparian
- Overall instream and riparian condition for the Jock River-Ashton Dwyer Hill catchment as assessed by the stream characterization and headwater drainage feature assessment programs show that the Jock River and its tributaries are in generally good condition. The majority of the system has low erosion levels and a healthy forested riparian corridor along the Jock River. Instream diversity of aquatic habitat is fairly complex in the lower to middle reaches of the Jock River, while the upper reach is dominated by low habitat complexity and poor dissolved oxygen conditions
Thermal Regime
- Warm/cool water thermal guild supporting the Jock River/Rideau River fishery
Fish Community
- Thirty-five species of recreational and bait fish
Shoreline Cover Type (30 m. riparian area; 2014)
- Wetland (36%)
- Crop and Pasture (28%)
- Woodland (18%)
- Settlement (8%)
- Transportation (7%)
- Meadow-Thicket (3%)
- Aggregate (<1%)
Land Cover Type (2014)
- Crop and Pasture (39%)
- Woodland (22%)
- Wetland (21%)
- Settlement (9%)
- Meadow-Thicket (4%)
- Transportation (3%)
- Aggregate (<1%)
- Water (<1%)
Land Cover Change (2008 to 2014)
- Wetland (-61 ha)
- Woodland (-34 ha)
- Meadow-Thicket (-20 ha)
- Crop and Pasture (-5 ha)
- Water (0 ha)
- Aggregate (+9 ha)
- Settlement (+55 ha)
- Transportation (+56 ha)
Significant Natural Features
- Goodwood Provincially Significant Wetland
- Goodwood Marsh Area of Natural and Scientific Interest
- Manions Corners Provincially Significant Wetland
- Prospect Bog Provincially Significant Wetland
Water Wells
- Several hundred (~ 630) operational private water wells in the catchment. Groundwater uses are mainly domestic but also include livestock watering, commercial uses, groundwater monitoring and testing and municipal and other public water supplies
Aggregates
- One sand and gravel pit within the catchment. Sand and gravel resources are limited and of tertiary importance
Species at Risk (Elemental Occurrence)
- Loggerhead Shrike, Spotted Turtle (Endangered)
- Bobolink, Eastern Meadowlark (Threatened)
- Eastern Milksnake, Snapping Turtle (Special Concern)
1.4 Catchment Care
Stewardship
- Eighty-three stewardship projects undertaken (see Section 5)
Environmental Monitoring
- Chemical surface (in-stream) water quality collection since 2003 (see Section 2)
- Benthic invertebrate (aquatic insect) surface (in-stream) water quality collection since 2011 (see Section 3.3.1)
- Fish survey along the Jock River (see Section 3.3.11)
- Stream characterization survey on the Jock River in 2015, working upstream to the headwaters from its mouth where it empties into the Rideau River, taking measurements and recording observations on instream habitat, bank stability, other attributes and preparing a temperature profile (see Section 3)
- Twenty headwater drainage feature assessments in 2015 at road crossings in the catchment. The protocol measures zero, first and second order headwater drainage features and is a rapid assessment method characterizing the amount of water, sediment transport, and storage capacity within headwater drainage features (see Section 3.4)
Environmental Management
- Development in and adjacent to the Provincially Significant Wetlands in the catchment (Goodwood Marsh, Manions Corners, Prospect Bog) are subject to Ontario Regulation 174-06 (entitled “Development, Interference with Wetlands and Alterations to Shorelines and Watercourses”) that protects the hydrologic function of the wetland and also protects landowners and their property from natural hazards (flooding, fluctuating water table, unstable soils) associated with them
- Ashton Dam water levels are managed by the RVCA on behalf of the Township of Beckwith and the City of Ottawa
- Three active Permit To Take Water (PTTW) in the catchment issued for municipal water supply and golf course irrigation
- Seven Environmental Compliance Approvals in the catchment. These are for municipal or private sewage works; an industrial sewage work; a waste management system and air emissions
2.0 Jock River-Ashton Dwyer Hill Catchment: Surface Water Quality Conditions
Surface water quality conditions in the Ashton-Dwyer Hill catchment of the Jock River are monitored by the City of Ottawa’s Baseline Water Quality Monitoring Program. This program provides information on the condition of Ottawa’s surface water resources; data is collected for multiple parameters including nutrients (total phosphorus, total Kjeldahl nitrogen and ammonia), E. coli, metals (like aluminum and copper) and additional chemical/physical parameters (such as alkalinity, chlorides, pH and total suspended solids). The locations of monitoring sites are shown in Figure 2 and Table 1.
Figure 2 Water quality monitoring sites on the Jock River in the Ashton-Dwyer Hill Catchment
2.1 Jock River Water Quality Rating
The RVCA's water quality rating for Jock River site JR-20 is “Poor” while upstream site JR-45 is “Fair” (Table 1) as determined by the Canadian Council of Ministers of the Environment (CCME) Water Quality Index[1]. A “Fair” rating indicates that water quality is usually protected but is occasionally threatened or impaired; conditions sometimes depart from natural or desirable levels. A rating of “Poor” indicates water quality is frequently threatened or impaired; conditions often depart from natural or desirable levels. Each parameter is evaluated against established guidelines to determine water quality conditions. Those parameters that frequently exceed guidelines are presented below. Table 1 shows the overall rating for the monitored surface water quality site within the Ashton-Dwyer Hill catchment and Table 2 outlines the Water Quality Index (WQI) scores and their corresponding ratings.
Analysis of the data has been broken into two periods, 2004-2009 and 2010-2015, to examine if conditions have changed within this timeframe. Water quality scores at site JR-20 declined from a rating of “Fair” in the 2004-2009 period to “Poor” in 2010-2015, this can be attributed to more exceedances across a greater number of parameters. Data is only available at site JR-45 for the 2010-2015 period. The scores at both sites are largely influenced by frequent high nutrient concentrations and periods of bacterial pollution. For more information on the CCME WQI, please see the Jock River Subwatershed Report.
Table 1 Water Quality Index ratings for the Ashton-Dwyer Hill Catchment
Table 2 Water Quality Index ratings and corresponding index scores (RVCA terminology, original WQI category names in brackets)
2.2 Nutrients
Total phosphorus (TP) is used as a primary indicator of excessive nutrient loading and may contribute to abundant aquatic vegetation growth and depleted dissolved oxygen levels. The Provincial Water Quality Objective (PWQO) is used as the TP Guideline and states that in streams concentrations greater than 0.030 mg/l indicate an excessive amount of TP.
Total Kjeldahl nitrogen (TKN) and ammonia (NH3) are used as secondary indicators of nutrient loading. RVCA uses a guideline of 0.500 mg/l to assess TKN[2] and the PWQO of 0.020 mg/l to assess NH3 concentrations in the Jock River.
Tables 3, 4 and 5 summarize average nutrient concentrations at the monitored site within the Ashton-Dwyer Hill catchment and show the proportion of results that meet the guidelines.
Table 3 Summary of total phosphorus results for the Ashton-Dwyer Hill catchment, 2004-2009 and 2010-2015. Highlighted values indicate average concentrations exceed the guideline
Table 4 Summary of total Kjeldahl nitrogen results for the Ashton-Dwyer Hill catchment from 2004-2009 and 2010-2015. Highlighted values indicate average concentrations exceed the guideline
Table 5 Summary of ammonia results for the Ashton-Dwyer Hill catchment from 2004-2009 and 2010-2015. Highlighted values indicate average concentrations exceed the guideline
Monitoring Site JR-20
In the 2004-2009 period the majority of samples at site JR-20 were above the TP guideline; the frequency of exceedances decreased marginally in the 2010-2015 monitoring period. The number of samples below the guideline improved from 47 percent in 2004-2009 to 56 percent in 2010-2015 (Figures 3 and 4). The average TP concentrations decreased slightly from 0.037 mg/l (2004–2009) to 0.031 mg/l (2010–2015) as shown in Table 3.
TKN concentrations show that the bulk of results exceeded the guideline (Figures 5 and 6); there were few samples (eight percent) below the guideline in the 2004-2009 period and this declined to zero samples below the guideline in the 2010-2015 period. The average concentration was generally elevated and increased from 0.867 mg/l to 0.874 mg/l (Table 4).
In the 2004-2009 reporting period 75 percent of NH3 results were below the guideline with an average concentration of 0.030 mg/l (Figure 7, Table 5). The percentage of results below the guideline declined to 70 percent in the 2010-2015 period. However, during this timeframe the average concentration also decreased marginally to 0.028 mg/l (Figure 8, Table 5).
Monitoring Site JR-45
Elevated TP results were not a common occurrence at site JR-45. Most samples, 76 percent, were below the PWQO (Figure 4). The average TP concentration was 0.023 mg/l (Table 3) and was also below the guideline (PWQO).
The bulk of TKN results have exceeded the guideline (Figure 6), with seven percent of samples below the guideline in the 2010-2015. The average concentration was elevated at 0.808 mg/l (Table 4).
The results for NH3 indicate that exceedances not common though the average concentration was above the guideline at 0.023 mg/l (Table 5). Seventy-two percent of results were below the guideline in the 2010-2015 reporting period (Figure 8).
Figure 3 Total phosphorus concentration in the Jock River, Ashton-Dwyer Hill catchment, 2004-2009
Figure 4 Total phosphorus concentration in the Jock River, Ashton-Dwyer Hill catchment, 2010-2015
Figure 5 Total Kjeldahl nitrogen concentrations in the Jock River, Ashton-Dwyer Hill catchment, 2004-2009
Figure 6 Total Kjeldahl nitrogen concentration in the Jock River, Ashton-Dwyer Hill catchment, 2010-2015
Figure 7 Ammonia concentration in the Jock River, Ashton-Dwyer Hill catchment, 2004-2009
Figure 8 Ammonia concentrations in the Jock River, Ashton-Dwyer Hill catchment, 2010-2015
Summary
Nutrient enrichment is a feature in this reach of the Jock River. This is likely due to natural inputs from wetland areas and runoff from surrounding agricultural lands. The Jock River was previously identified as having a marginal rating (i.e. exceeded targets occasionally) for phosphorus (City of Ottawa, Water Environment Protection Program, 2006). Overall, average nutrient concentrations have remained consistent through the monitoring periods at site JR-20. All parameters (total phosphorus, total Kjeldahl nitrogen and ammonia) have exceeded guidelines. Elevated nutrients may result in nutrient loading downstream. High nutrient concentrations can help stimulate the growth of algae blooms and other aquatic vegetation in a waterbody and deplete oxygen levels as the vegetation dies off. Consideration should also be given to the potential influence of inflow from the Jenkinson Drain into this reach of the Jock River. Best management practices such as enhanced shoreline buffers, erosion mitigation where applicable, preventing the use of fertilizers and restricting livestock access in agricultural areas can help to reduce nutrient enrichment in Jock River.
2.3 Escherichia coli
Escherichia coli (E. coli) is used as an indicator of bacterial pollution from human or animal waste; in elevated concentrations, it can pose a risk to human health. The PWQO of 100 colony forming units/100 millilitres (CFU/100 ml) is used. E. coli counts greater than this guideline indicate that bacterial contamination may be a problem within a waterbody.
Table 6 summarizes the geometric mean[3] for the monitored sites on the Jock River within the Ashton-Dwyer Hill catchment and shows the proportion of samples that meet the E. coli guideline of 100 CFU/100 ml. The results of the geometric mean with respect to the guideline for the two periods, 2004-2009 and 2010-2015, are shown in Figures 9 and 10 respectively.
Table 6 Summary of
E. coli results for the Jock River, 2004-2009 and 2010-2015
Monitoring Site JR-20
E. coli counts at site JR-20 provide evidence of an increase in bacterial pollution. The proportion of samples below the guideline declined marginally from 48 percent (Figure 9) to 46 percent (Figure 10). The count at the geometric mean increased from 78 CFU/100ml in 2004-2009 to 99 CFU/100ml from 2010-2015 (Table 6), and is just below the PWQO.
Monitoring Site JR-45
Elevated E. coli counts at site JR-45 were also regular occurrence. Most samples were below the guideline (57 percent) in the 2010-2015 period. The geometric mean was below the PWQO of 100 CFU/100ml at 74 CFU/100ml (Table 6).
Figure 9 Geometric mean of E. coli results in the Jock River, Ashton-Dwyer Hill catchment, 2004-2009
Figure 10 Geometric mean of E. coli results in the Jock River, Ashton-Dwyer Hill catchment, 2010-2015
Summary
Given the results, bacterial contamination appear to be an increasing concern in this reach of the Jock River. Exceedances are common and counts at the geometric mean have increased to just below the guideline at site JR-20. As privously noted the potential impact of the Jenkinson Drain on this reach of the Jock River should also be considered. Best management practices such as enhancing shoreline buffers and restricting livestock access can help to protect this reach of the Jock River into the future.
1 The City of Ottawa Baseline Water Quality Monitoring Program has also applied the CCME WQI to monitored sites. The parameters used and time periods differs between the RVCA and City of Ottawa’s application of the WQI, resulting in different ratings at some sites.
2 No Ontario guideline for TKN is presently available; however, waters not influenced by excessive organic inputs typically range from 0.100 to 0.500 mg/l, Environment Canada (1979) Water Quality Sourcebook, A Guide to Water Quality Parameters, Inland Waters Directorate, Water Quality Branch, Ottawa, Canada
3 A type of mean or average, which indicates the central tendency or typical value of a set of numbers by using the product of their values (as opposed to the arithmetic mean which uses their sum). It is often used to summarize a variable that varies over several orders of magnitude, such as E. coli counts
3.0 Jock River-Ashton Dwyer Hill Catchment: Riparian Conditions
3.1 Jock River Overbank Zone
3.1.1 Riparian Buffer Land Cover Evaluation
Figure 11 demonstrates the buffer conditions of the left and right banks separately. The Jock River in the Ashton - Dwyer Hill catchment had a buffer of greater than 30 meters along 71 percent of the right bank and 70 percent of the left bank.
Figure 11 Riparian Buffer Evaluation along the Jock River in the Ashton - Dwyer Hill catchment
3.1.2 Riparian Buffer Alterations
Alterations within the riparian buffer were assessed within three distinct shoreline zones (0-5m, 5-15m, 15-30m), and evaluated based on the dominant vegetative community and/or land cover type (Figure 12). The riparian buffer zone along the Jock River within the Ashton - Dwyer Hill catchment was found to have highly variable conditions along the riparian corridor. These alterations were generally associated with infrastructure in the form of road crossings, recreational and agricultural land uses.
Figure 12 Riparian buffer alterations within the Jock River Ashton - Dwyer Hill catchment
3.1.3 Adjacent Landuse
The RVCA’s Stream Characterization Program identifies ten different land uses beside the Jock River in the Ashton - Dwyer Hill catchment (Figure 13). Surrounding land use is considered from the beginning to end of the survey section (100m) and up to 100m on each side of the river. Land use outside of this area is not considered for the surveys but is nonetheless part of the subwatershed and will influence the creek. Natural areas made up 65 percent of the stream, characterized by forest, scrubland, meadow and wetland. Forest habitat was dominant in the adjacent lands along the Jock River in the Ashton - Dwyer Hill catchment at 35 percent. The remaining land use consisted of active agriculture, pasture, abandoned agriculture, residential, recreational and infrastructure in the form of road crossings.
Figure 13 Land Use along the Jock River in the Ashton - Dwyer Hill catchment
3.2 Jock River Shoreline Zone
3.2.1 Instream Erosion
Stream erosion is the process by which water erodes and transports sediments, resulting in dynamic flows and diverse habitat conditions. Excessive erosion can result in drastic environmental changes, as habitat conditions, water quality and aquatic life are all negatively affected. Bank stability was assessed as the overall extent of each section with “unstable” shoreline conditions. These conditions are defined by the presence of significant exposed soils/roots, minimal bank vegetation, severe undercutting, slumping or scour and potential failed erosion measures. The majority of the Jock River in the Ashton-Dwyer Hill catchment had low levels of erosion with the exception of three areas along the system which had moderate to high levels of erosion. Figure 14 shows erosion levels along the Jock River in the Ashton-Dwyer Hill catchment.
Figure 14 Erosion along the Jock River in the Ashton - Dwyer Hill catchment
3.2.2 Undercut Stream Banks
Stream bank undercuts can provide excellent cover habitat for aquatic life, however excessive levels can be an indication of unstable shoreline conditions. Bank undercut was assessed as the overall extent of each surveyed section with overhanging bank cover present. Figure 15 shows that Jock River in the Ashton - Dwyer Hill catchment had low levels of undercut banks along the majority of the system with a few specific locations having high levels of undercut banks observed.
Figure 15 Undercut stream banks along the Jock River in the Ashton - Dwyer Hill catchment
3.2.3 Stream Shading
Grasses, shrubs and trees all contribute towards shading a stream. Shade is important in moderating stream temperature, contributing to food supply and helping with nutrient reduction within a stream. Stream cover is assessed as the total coverage area in each section that is shaded by overhanging trees/grasses and tree canopy, at greater than 1m above the water surface. Figure 16 shows variable conditions of low to high levels of stream shading along the Jock River in the Ashton - Dwyer Hill catchment.
Figure 16 Stream shading along the Jock River in the Ashton - Dwyer Hill catchment
3.2.4 Instream Woody Debris
Figure 17 shows that the majority of Jock River in the Ashton - Dwyer Hill catchment had predominantly low levels of instream woody debris in the form of branches and trees along the system. Instream woody debris is important for fish and benthic invertebrate habitat, by providing refuge and feeding areas.
Figure 17 Instream woody debris along the Jock River in the Ashton - Dwyer Hill catchment
3.2.5 Overhanging Trees and Branches
Trees and branches that are less than one meter from the surface of the water are defined as overhanging. Overhanging branches and trees provide a food source, nutrients and shade which helps to moderate instream water temperatures. Figure 18 shows the system is highly variable with low to high levels of overhanging branches and trees along Jock River in the Ashton - Dwyer Hill catchment.
Figure 18 Overhanging trees and branches along the Jock River in the Ashton - Dwyer Hill catchment
3.2.6 Anthropogenic Alterations
Stream alterations are classified based on specific functional criteria associated with the flow conditions, the riparian buffer and potential human influences. Figure 19 shows 46 percent of the Jock River in the Ashton - Dwyer Hill catchment remains “unaltered” with no anthropogenic alterations. Forty nine percent of Jock River in the Ashton - Dwyer Hill catchment was classified as natural with minor anthropogenic changes while four percent was considered altered and two percent was classified as highly altered. The alterations along the Jock River in this reach were in the form of shoreline modifications, reduced buffers and road crossings.
Figure 19 Anthropogenic alterations along the Jock River in the Ashton - Dwyer Hill catchment
3.3 Jock River Instream Aquatic Habitat
3.3.1 Benthic Invertebrates
Freshwater benthic invertebrates are animals without backbones that live on the stream bottom and include crustaceans such as crayfish, molluscs and immature forms of aquatic insects. Benthos represent an extremely diverse group of aquatic animals and exhibit wide ranges of responses to stressors such as organic pollutants, sediments and toxicants, which allows scientists to use them as bioindicators. As part of the Ontario Benthic Biomonitoring Network (OBBN), the RVCA has been collecting benthic invertebrates at the Franktown Road site on the Jock River since 2011 (Site Code JO-3). Monitoring data is analyzed for each sample site and the results are presented using the Family Biotic Index, Family Richness and percent Ephemeroptera, Plecoptera and Trichoptera.
Hilsenhoff Family Biotic Index
The Hilsenhoff Family Biotic Index (FBI) is an indicator of organic and nutrient pollution and provides an estimate of water quality conditions for each site using established pollution tolerance values for benthic invertebrates. FBI results for the Jock River Ashton - Dwyer Hill catchment sample location at Franktown Road are summarized by year from 2011 to 2015. “Good” to “Poor” water quality conditions was observed at the Jock River Ashton - Dwyer Hill sample location for the period from 2011 to 2015 (Figure 20) using a grading scheme developed by Conservation Authorities in Ontario for benthic invertebrates.
Figure 20 Hilsenhoff Family Biotic Index at the Jock River Franktown Road sample location
Family Richness
Family Richness measures the health of the community through its diversity and increases with increasing habitat diversity suitability and healthy water quality conditions. Family Richness is equivalent to the total number of benthic invertebrate families found within a sample. The Jock River Ashton - Dwyer Hill site is reported to have “Fair” family richness (Fig.xx).
Figure 21 Family Richness at the Jock River Franktown Road sample location
EPT
Ephemeroptera (Mayflies), Plecoptera (Stoneflies), and Trichoptera (Caddisflies) are species considered to be very sensitive to poor water quality conditions. High abundance of these organisms is generally an indication of good water quality conditions at a sample location. The community structure typically has species that are more tolerant to poorer water quality conditions. As a result, the EPT indicates that the Jock River Ashton - Dwyer Hill sample location is reported to have “Fair” to “Poor” water quality (Figure 22) from 2011 to 2015.
Figure 22 EPT at the Jock River Franktown Road sample location
Conclusion
Overall the Jock River Ashton - Dwyer Hill sample location aquatic habitat conditions from a benthic invertebrate perspective is considered “Poor” from 2011 to 2015 as the samples are dominated by species that are moderately sensitive and tolerant to high organic pollution levels.
3.3.2 Habitat Complexity
Habitat complexity is a measure of the overall diversity of habitat types and features within a stream. Streams with high habitat complexity support a greater variety of species niches, and therefore contribute to greater diversity. Factors such as substrate, flow conditions (pools, riffles) and cover material (vegetation, wood structure, etc.) all provide crucial habitat to aquatic life. Habitat complexity is assessed based on the presence of boulder, cobble and gravel substrates, as well as the presence of instream woody material.
Low to high habitat complexity was identified for the Jock River Ashton - Dwyer Hill catchment (Figure 23). Regions with increased habitat complexity were observed in the lower to middle reaches of the system within the catchment.
Figure 23 Habitat complexity along the Jock River in the Ashton - Dwyer Hill catchment
3.3.3 Instream Substrate
Diverse substrate is important for fish and benthic invertebrate habitat because some species have specific substrate requirements and for example will only reproduce on certain types of substrate. The absence of diverse substrate types may limit the overall diversity of species within a stream. Figure 24 shows that 77 percent of the sections observed in the Jock River in the Ashton - Dwyer Hill catchment had the presence of cobble substrate. Overall substrate conditions were highly diverse along the Jock River Ashton - Dwyer Hill reach with all substrate types being recorded along the reach. Figure 25 shows the dominant substrate type observed for each section surveyed along the Jock River in the Ashton - Dwyer Hill catchment.
Figure 24 Instream substrate along the Jock River in the Ashton - Dwyer Hill catchment
Figure 25 Dominant substrate type along the Jock River Ashton - Dwyer Hill catchment
3.3.4 Instream Morphology
Pools and riffles are important habitat features for aquatic life. Riffles are fast flowing areas characterized by agitation and overturn of the water surface. Riffles thereby play a crucial role in contributing to dissolved oxygen conditions and directly support spawning for some fish species. They are also areas that support high benthic invertebrate populations which are an important food source for many aquatic species. Pools are characterized by minimal flows, with relatively deep water and winter/summer refuge habitat for aquatic species. Runs are moderately shallow, with unagitated surfaces of water and areas where the thalweg (deepest part of the channel) is in the center of the channel. Figure 26 shows that the Jock River in the Ashton - Dwyer Hill catchment is highly variable; 66 percent consists of runs, 12 percent riffles and 21 percent pools. Figure 27 shows where the riffle habitat areas were observed along the Jock River in the Ashton - Dwyer Hill catchment.

Figure 26 Instream morphology along the Jock River in the Ashton - Dwyer Hill catchment
Figure 27 Riffle habitat locations along the Jock River in the Ashton - Dwyer Hill catchment
3.3.5 Vegetation Type
Instream vegetation provides a variety of functions and is a critical component of the aquatic ecosystem. Aquatic plants promote stream health by:
- Providing direct riparian/instream habitat
- Stabilizing flows reducing shoreline erosion
- Contributing to dissolved oxygen through photosynthesis
- Maintaining temperature conditions through shading
For example emergent plants along the shoreline can provide shoreline protection from wave action and important rearing habitat for species of waterfowl. Submerged plants provide habitat for fish to find shelter from predator fish while they feed. Floating plants such as water lilies shade the water and can keep temperatures cool while reducing algae growth. Narrow leaved emergents were present at 89% of the sections surveyed, algae was observed in 74% of sections, while free floating plants were observed in 27% of surveyed sections. Broad leaved emergents were observed in 44% of sections, submerged plants in 81%, floating plants in 27% and robust emergents in 50% of sections surveyed. Figure 28 depicts the plant community structure for the Jock River Ashton - Dwyer Hill catchment. Figure xx shows the dominant vegetation type observed for each section surveyed along the Jock River in the Ashton - Dwyer Hill catchment.

Figure 28 Vegetation type along the Jock River in the Ashton - Dwyer Hill catchment
Figure 29 Dominant vegetation type along the Jock River in the Ashton - Dwyer Hill catchment
3.3.6 Instream Vegetation Abundance
Instream vegetation is an important factor for a healthy stream ecosystem. Vegetation helps to remove contaminants from the water, contributes oxygen to the stream, and provides habitat for fish and wildlife. Too much vegetation can also be detrimental. Figure 30 demonstrates that the Jock River Ashton - Dwyer Hill reach had no vegetation to low levels of instream vegetation for 53 percent of its length. Normal to common levels of vegetation were recorded at 26 percent of stream surveys. Extensive levels of vegetation were observed along 21 percent of the systems length.
Figure 30 Instream vegetation abundance along the Jock River in the Ashton - Dwyer Hill catchment
3.3.7 Invasive Species
Invasive species can have major implications on streams and species diversity. Invasive species are one of the largest threats to ecosystems throughout Ontario and can out compete native species, having negative effects on local wildlife, fish and plant populations. Ninety three percent of the sections surveyed along the Jock River Ashton - Dwyer Hill reach had invasive species. The invasive species observed in the Jock River Ashton - Dwyer Hill reach were European frogbit, poison/wild parsnip, dog strangling vine, yellow iris, purple loosestrife, rusty crayfish, glossy buckthorn, garlic mustard and Manitoba maple. Invasive species abundance (i.e. the number of observed invasive species per section) was assessed to determine the potential range/vector of many of these species (Figure 31).
Figure 31 Invasive species abundance along the Jock River in the Ashton - Dwyer Hill catchment
3.3.8 Water Chemistry
During the stream characterization survey, a YSI probe is used to collect water chemistry information. Dissolved oxygen (DO), specific conductivity (SPC) and pH are measured at the start and end of each section.
3.3.8.1 Dissolved Oxygen
Dissolved oxygen is a measure of the amount of oxygen dissolved in water. The Canadian Environmental Quality Guidelines of the Canadian Council of Ministers of the Environment (CCME) suggest that for the protection of aquatic life the lowest acceptable dissolved oxygen concentration should be 6 mg/L for warmwater biota and 9.5 mg/L for coldwater biota (CCME, 1999). Figure 32 shows that the dissolved oxygen in the Jock River Ashton - Dwyer Hill catchment was within the threshold for warmwater biota in this reach of the system. The average dissolved oxygen levels observed within the main stem of the Jock River Ashton - Dwyer Hill was 6.72mg/L which is within the recommended levels for warmwater biota. The upper sections of the reach fell below the recommended 6.0mg/L for warmwater biota.
Figure 32 Dissolved oxygen ranges in the Jock River for the Ashton - Dwyer Hill catchment
3.3.8.2 Conductivity
Conductivity in streams is primarily influenced by the geology of the surrounding environment, but can vary drastically as a function of surface water runoff. Currently there are no CCME guideline standards for stream conductivity; however readings which are outside the normal range observed within the system are often an indication of unmitigated discharge and/or stormwater input. The average conductivity observed within the main stem of Jock River in the Ashton - Dwyer Hill catchment was 404.36 µs/cm. Figure 33 shows the conductivity readings for the Jock River in the Ashton - Dwyer Hill catchment.
Figure 33 Specific conductivity ranges in the Jock River for the Ashton - Dwyer Hill catchment
3.3.8.3 pH
Based on the PWQO for pH, a range of 6.5 to 8.5 should be maintained for the protection of aquatic life. Average pH values for the Jock River Ashton - Dwyer Hill catchment averaged 7.95 thereby meeting the provincial standard (Figure 34).
Figure 34 pH ranges in the Jock River for the Ashton - Dwyer Hill catchment
3.3.8.4 Oxygen Saturation (%)
Oxygen saturation is measured as the ratio of dissolved oxygen relative to the maximum amount of oxygen that will dissolve based on the temperature and atmospheric pressure. Well oxygenated water will stabilize at or above 100% saturation, however the presence of decaying matter/pollutants can drastically reduce these levels. Oxygen input through photosynthesis has the potential to increase saturation above 100% to a maximum of 500%, depending on the productivity level of the environment. In order to represent the relationship between concentration and saturation, the measured values have been summarized into 6 classes:
- <100% Saturation / <6.0 mg/L Concentration. Oxygen concentration and saturation are not sufficient to support aquatic life and may represent impairment
- >100% Saturation / <6.0 mg/L Concentration. Oxygen concentration is not sufficient to support aquatic life, however saturation levels indicate that the water has stabilized at its estimated maximum. This is indicative of higher water temperatures and stagnant flows.
- <100% Saturation / 6.0—9.5 mg/L Concentration. Oxygen concentration is sufficient to support warmwater biota, however depletion factors are likely present and are limiting maximum saturation.
- >100% Saturation / 6.0—9.5 mg/L Concentration. Oxygen concentration and saturation levels are optimal for warmwater biota.
- <100% Saturation / >9.5 mg/L Concentration. Oxygen concentration is sufficient to support coldwater biota, however depletion factors are likely present and are limiting maximum saturation.
- >100% Saturation / >9.5 mg/L Concentration. Oxygen concentration and saturation levels are optimal for coldwater biota.
 and saturation (%) in the Jock River Ashton - Dwyer Hill reach")
Figure 35 A bivariate assessment of dissolved oxygen concentration (mg/L) and saturation (%) in the Jock River Ashton - Dwyer Hill reach
Dissolved oxygen conditions on the Jock River in the Ashton - Dwyer Hill catchment are generally sufficient for both warm and coolwater species (Figure 35). Dissolved oxygen conditions are higher in the lower reach which is a function of the riffle habitat in those sections of the Jock River. Oxygen levels in wetland habitats are typically lower than they are in areas where the substrate is dominated by cobble and riffle habitat.
3.3.8.5 Specific Conductivity Assessment
Specific conductivity (SPC) is a standardized measure of electrical conductance, collected at or corrected to a water temperature of 25⁰C. SPC is directly related to the concentration of ions in water, and is commonly influenced by the presence of dissolved salts, alkalis, chlorides, sulfides and carbonate compounds. The higher the concentration of these compounds, the higher the conductivity. Common sources of elevated conductivity include storm water, agricultural inputs and commercial/industrial effluents.
In order to summarize the conditions observed, SPC levels were evaluated as either normal, moderately elevated or highly elevated. These categories correspond directly to the degree of variation (i.e. standard deviation) at each site relative to the average across the system.
Normal levels were maintained along the majority of the Jock River in the Ashton - Dwyer Hill catchment, however there were elevated areas immediately downstream of the Riverbend golf course and in two specified locations in the middle and upper reaches within the Ashton - Dwyer Hill catchment area (Figure 36).
Figure 36 Relative specific conductivity levels on the Jock River in the Ashton - Dwyer Hill catchment
3.3.9 Thermal Regime
Many factors can influence fluctuations in stream temperature, including springs, tributaries, precipitation runoff, discharge pipes and stream shading from riparian vegetation. Water temperature is used along with the maximum air temperature (using the Stoneman and Jones method) to classify a watercourse as either warm water, cool water or cold water. Figure 37 shows where the thermal sampling sites were located along Jock River Ashton – Dwyer Hill catchment. Analysis of the data collected indicates that Jock River Ashton - Dwyer Hill catchment is classified as a warm water system with cool to warm water reaches (Figure 38).
Figure 37 Temperature logger locations in the Jock River Ashton – Dwyer Hill catchment
Figure 38 Temperature logger data for the three sites in the Jock River Ashton – Dwyer Hill catchment
Each point on the graph represents a temperature that meets the following criteria:
- Sampling dates between July 1st and September 7th
- Sampling date is preceded by two consecutive days above 24.5 °C, with no rain
- Water temperatures are collected at 4pm
- Air temperature is recorded as the max temperature for that day
3.3.10 Groundwater
Groundwater discharge areas can influence stream temperature, contribute nutrients, and provide important stream habitat for fish and other biota. During stream surveys, indicators of groundwater discharge are noted when observed. Indicators include: springs/seeps, watercress, iron staining, significant temperature change and rainbow mineral film. Figure 39 shows areas where one or more of the above groundwater indicators were observed during stream surveys and headwater assessments.
Figure 39 Groundwater indicators observed in the Jock River Ashton - Dwyer Hill catchment
3.3.11 Fish Community
The Jock River Ashton - Dwyer Hill catchment is classified as a mixed community of warm and cool water recreational and baitfish fishery with 35 species observed. Figure 40 shows the sampling locations along the Jock River in the Barrhaven catchment.
Figure 40 Fish species observed in the Jock River Ashton - Dwyer Hill catchment
Electrofishing sampling location at Franktown Road
Rainbow darter (Etheostoma caeruleum) captured at Franktown Road
The following table contains a list of species observed in the watershed.
Table 7 Fish Community species found within the Jock River Ashton - Dwyer Hill catchment
3.3.12 Migratory Obstructions
It is important to know locations of migratory obstructions because these can prevent fish from accessing important spawning and rearing habitat. Migratory obstructions can be natural or manmade, and they can be permanent or seasonal. Figure 41 shows that Jock River in the Ashton - Dwyer Hill catchment had two weir barriers at the time of the survey in 2015. The Ashton Station Dam along with several natural grade barriers were observed, one debris dam and three beaver dams were identified along the Jock River in the Ashton - Dwyer Hill catchment.
Figure 41 Migratory obstructions along Jock River in the Ashton – Dwyer Hill catchment
3.3.13 Riparian Restoration
Figure 42 depicts the locations of riparian restoration opportunities as a result of observations made during the stream survey.
Figure 42 Riparian restoration opportunities along Jock River in the Ashton - Dwyer Hill catchment
3.3.14 Instream Restoration
Figure 43 depicts the locations of instream restoration opportunities as a result of observations made during the stream survey. Only one small stream garbage cleanup restoration opportunity was observed in the Ashton - Dwyer Hill catchment.
Figure 43 Instream restoration opportunities along Jock River in the Ashton - Dwyer Hill catchment
3.4 Headwater Drainage Features Assessment
3.4.1 Headwater Sampling Locations
The RVCA Stream Characterization program assessed Headwater Drainage Features for the Jock River subwatershed in 2015. This protocol measures zero, first and second order headwater drainage features (HDF). It is a rapid assessment method characterizing the amount of water, sediment transport, and storage capacity within headwater drainage features (HDF). RVCA is working with other Conservation Authorities and the Ministry of Natural Resources and Forestry to implement the protocol with the goal of providing standard datasets to support science development and monitoring of headwater drainage features. An HDF is a depression in the land that conveys surface flow. Additionally, this module provides a means of characterizing the connectivity, form and unique features associated with each HDF (OSAP Protocol, 2013). In 2015 the program sampled 20 sites at road crossings in the Jock River Ashton - Dwyer Hill catchment area (Figure 44).

Figure 44 Location of the headwater sampling site in the Jock River Ashton - Dwyer Hill catchment
3.4.2 Headwater Feature Type
The headwater sampling protocol assesses the feature type in order to understand the function of each feature. The evaluation includes the following classifications: defined natural channel, channelized or constrained, multi-thread, no defined feature, tiled, wetland, swale, roadside ditch and pond outlet. By assessing the values associated with the headwater drainage features in the catchment area we can understand the ecosystem services that they provide to the watershed in the form of hydrology, sediment transport, and aquatic and terrestrial functions. The headwater drainage features in the Ashton - Dwyer Hill catchment are primarily classified as wetland with seven, five features classified as natural, four features classified as a road side ditch, two multi thread and two features as channelized. Figure 45 shows the feature type of the primary feature at the sampling locations.
Figure 45 Headwater feature types in the Jock River Ashton - Dwyer Hill catchment
A spring photo of the headwater sample site in the Jock River Ashton - Dwyer Hill catchment located on Highway 7
A summer photo of the headwater sample site in the Jock River Ashton - Dwyer Hill catchment located on Highway 7
3.4.3 Headwater Feature Flow
The observed flow condition within headwater drainage features can be highly variable depending on timing relative to the spring freshet, recent rainfall, soil moisture, etc. Flow conditions are assessed in the spring and in the summer to determine if features are perennial and flow year round, if they are intermittent and dry up during the summer months or if they are ephemeral systems that do not flow regularly and generally respond to specific rainstorm events or snowmelt. Flow conditions in headwater systems can change from year to year depending on local precipitation patterns. Figure 46 shows the observed flow condition at the sampling locations in the Jock River Ashton - Dwyer Hill catchment in 2015.
Figure 46 Headwater feature flow conditions in the Jock River Ashton - Dwyer Hill catchment
3.4.4 Headwater Feature Channel Modifications
Channel modifications were assessed at each headwater drainage feature sampling location. Modifications include channelization, dredging, hardening and realignments. The Jock River Ashton - Dwyer Hill catchment area had five site as having been recently dredged, four locations had mixed modifications, one had channel had been hardened and ten had no channel modifications observed. Figure 47 shows the channel modifications observed at the sampling locations for Jock River Ashton - Dwyer Hill.
Figure 47 Headwater feature channel modifications in the Jock River Ashton - Dwyer Hill catchment
3.4.5 Headwater Feature Vegetation
Headwater feature vegetation evaluates the type of vegetation that is found within the drainage feature. The type of vegetated within the channel influences the aquatic and terrestrial ecosystem values that the feature provides. For some types of headwater features the vegetation within the feature plays a very important role in flow and sediment movement and provides wildlife habitat. The following classifications are evaluated no vegetation, lawn, wetland, meadow, scrubland and forest. Figure 48 depicts the dominant vegetation observed at the sampled headwater sites in the Jock River Ashton - Dwyer Hill catchment.
Figure 48 Headwater feature vegetation types in the Jock River Ashton - Dwyer Hill catchment
3.4.6 Headwater Feature Riparian Vegetation
Headwater riparian vegetation evaluates the type of vegetation that is found along the adjacent lands of a headwater drainage feature. The type of vegetation within the riparian corridor influences the aquatic and terrestrial ecosystem values that the feature provides to the watershed. Figure 49 depicts the type of riparian vegetation observed at the sampled headwater sites in the Jock River Ashton - Dwyer Hill catchment.
Figure 49 Headwater feature riparian vegetation types in the Jock River Ashton - Dwyer Hill catchment
3.4.7 Headwater Feature Sediment Deposition
Assessing the amount of recent sediment deposited in a channel provides an index of the degree to which the feature could be transporting sediment to downstream reaches (OSAP, 2013). Evidence of excessive sediment deposition might indicate the requirement to follow up with more detailed targeted assessments upstream of the site location to identify potential best management practices to be implemented. Sediment deposition ranged from none to extensive for the headwater sites sampled in the Jock River Ashton - Dwyer Hill catchment area. Figure 50 depicts the degree of sediment deposition observed at the sampled headwater sites in the Jock River Ashton - Dwyer Hill catchment.
Figure 50 Headwater feature sediment deposition in the Jock River Ashton - Dwyer Hill catchment
3.4.8 Headwater Feature Upstream Roughness
Feature roughness will provide a measure of the amount of materials within the bankfull channel that could slow down the velocity of water flowing within the headwater feature (OSAP, 2013). Materials on the channel bottom that provide roughness include vegetation, woody debris and boulders/cobble substrates. Roughness can provide benefits in mitigating downstream erosion on the headwater drainage feature and the receiving watercourse by reducing velocities. Roughness also provides important habitat conditions for aquatic organisms. Figure 51shows the feature roughness conditions at the sampling location in the Jock River Ashton - Dwyer Hill catchment.
Figure 51 Headwater feature roughness in the Jock River Ashton - Dwyer Hill catchment
4.0 Jock River-Ashton Dwyer Hill Catchment: Land Cover
Land cover and any change in coverage that has occurred over a six year period is summarized for the Ashton-Dwyer Hill catchment using spatially continuous vector data representing the catchment during the spring of 2008 and 2014. This dataset was developed by the RVCA through heads-up digitization of 20cm DRAPE ortho-imagery at a 1:4000 scale and details the surrounding landscape using 10 land cover classes.
4.1 Ashton-Dwyer Hill Catchment Land Cover Change
As shown in Table 8 and Figure 1, the dominant land cover type in 2014 was crop and pastureland followed by woodland and wetland.
Table 8 Land cover (2008 vs. 2014) in the Ashton-Dwyer Hill catchment
* Does not include treed swamps ** Includes treed swamps
From 2008 to 2014, there was an overall change of 199 hectares (from one land cover class to another). Most of the change in the Ashton-Dwyer Hill catchment is a result of the conversion of crop and pastureland and wetland to settlement, wetland and settlement to transportation along with the conversion of woodland to crop and pastureland (Figure 52).
Figure 52 Land cover change in the Ashton-Dwyer Hill catchment (2014)
Table 9 provides a detailed breakdown of all land cover change that has taken place in the Ashton-Dwyer Hill catchment between 2008 and 2014.
Table 9 Land cover change in the Ashton-Dwyer Hill catchment (2008 to 2014)
4.2 Woodland Cover
In the Environment Canada Guideline (Third Edition) entitled “How Much Habitat Is Enough?” (hereafter referred to as the “Guideline”) the opening narrative under the Forest Habitat Guidelines section states that prior to European settlement, forest was the predominant habitat in the Mixedwood Plains ecozone. The remnants of this once vast forest now exist in a fragmented state in many areas (including the Rideau Valley watershed) with woodland patches of various sizes distributed across the settled landscape along with higher levels of forest cover associated with features such as the Frontenac Axis (within the on-Shield areas of the Rideau Lakes and Tay River subwatersheds). The forest legacy, in terms of the many types of wildlife species found, overall species richness, ecological functions provided and ecosystem complexity is still evident in the patches and regional forest matrices (found in the Jock River subwatershed and elsewhere in the Rideau Valley watershed). These ecological features are in addition to other influences which forests have on water quality and stream hydrology including reducing soil erosion, producing oxygen, storing carbon along with many other ecological services that are essential not only for wildlife but for human well-being.
The Guideline also notes that forests provide a great many habitat niches that are in turn occupied by a great diversity of plant and animal species. They provide food, water and shelter for these species - whether they are breeding and resident locally or using forest cover to help them move across the landscape. This diversity of species includes many that are considered to be species at risk. Furthermore, from a wildlife perspective, there is increasing evidence that the total forest cover in a given area is a major predictor of the persistence and size of bird populations, and it is possible or perhaps likely that this pattern extends to other flora and fauna groups. The overall effect of a decrease in forest cover on birds in fragmented landscapes is that certain species disappear and many of the remaining ones become rare, or fail to reproduce, while species adapted to more open and successional habitats, as well as those that are more tolerant to human-induced disturbances in general, are able to persist and in some cases thrive. Species with specialized-habitat requirements are most likely to be adversely affected. The overall pattern of distribution of forest cover, the shape, area and juxtaposition of remaining forest patches and the quality of forest cover also play major roles in determining how valuable forests will be to wildlife and people alike.
The current science generally supports minimum forest habitat requirements between 30 and 50 percent, with some limited evidence that the upper limit may be even higher, depending on the organism/species phenomenon under investigation or land-use/resource management planning regime being considered/used.
As shown in Figure 53, 25 percent of the Ashton-Dwyer Hill catchment contains 1795 hectares of upland forest and 224 hectares of lowland forest (treed swamps) versus the 26 percent of woodland cover in the Jock River subwatershed. This is less than the 30 percent of forest cover that is identified as the minimum threshold required to sustain forest birds according to the Guideline and which may only support less than one half of potential species richness and marginally healthy aquatic systems. When forest cover drops below 30 percent, forest birds tend to disappear as breeders across the landscape.
Figure 53 Woodland cover and forest interior (2014)
4.2.1 Woodland (Patch) Size
According to the Ministry of Natural Resources’ Natural Heritage Reference Manual (Second Edition), larger woodlands are more likely to contain a greater diversity of plant and animal species and communities than smaller woodlands and have a greater relative importance for mobile animal species such as forest birds.
Bigger forests often provide a different type of habitat. Many forest birds breed far more successfully in larger forests than they do in smaller woodlots and some rely heavily on forest interior conditions. Populations are often healthier in regions with more forest cover and where forest fragments are grouped closely together or connected by corridors of natural habitat. Small forests support small numbers of wildlife. Some species are “area-sensitive” and tend not to inhabit small woodlands, regardless of forest interior conditions. Fragmented habitat also isolates local populations, especially small mammals, amphibians and reptiles with limited mobility. This reduces the healthy mixing of genetic traits that helps populations survive over the long run (Conserving the Forest Interior. Ontario Extension Notes, 2000).
The Environment Canada Guideline also notes that for forest plants that do not disperse broadly or quickly, preservation of some relatively undisturbed large forest patches is needed to sustain them because of their restricted dispersal abilities and specialized habitat requirements and to ensure continued seed or propagation sources for restored or regenerating areas nearby.
The Natural Heritage Reference Manual continues by stating that a larger size also allows woodlands to support more resilient nutrient cycles and food webs and to be big enough to permit different and important successional stages to co-exist. Small, isolated woodlands are more susceptible to the effects of blowdown, drought, disease, insect infestations, and invasions by predators and non-indigenous plants. It is also known that the viability of woodland wildlife depends not only on the characteristics of the woodland in which they reside, but also on the characteristics of the surrounding landscape where the woodland is situated. Additionally, the percentage of forest cover in the surrounding landscape, the presence of ecological barriers such as roads, the ability of various species to cross the matrix surrounding the woodland and the proximity of adjacent habitats interact with woodland size in influencing the species assemblage within a woodland.
In the Ashton-Dwyer Hill catchment (in 2014), 191 (54 percent) of the 356 woodland patches are very small, being less than one hectare in size. Another 137 (38 percent) of the woodland patches ranging from one to less than 20 hectares in size tend to be dominated by edge-tolerant bird species. The remaining 28 (8 percent of) woodland patches range between 21 and 181 hectares in size. Twenty-seven of these patches contain woodland between 20 and 100 hectares and may support a few area-sensitive species and some edge intolerant species, but will be dominated by edge tolerant species. Conversely, one (less than one percent) of the 356 woodland patches in the drainage area exceeds the 100 plus hectare size needed to support most forest dependent, area sensitive birds and are large enough to support approximately 60 percent of edge-intolerant species. No patch tops 200 hectares, which according to the Environment Canada Guideline will support 80 percent of edge-intolerant forest bird species (including most area sensitive species) that prefer interior forest habitat conditions.
Table 10 presents a comparison of woodland patch size in 2008 and 2014 along with any changes that have occurred over that time. A decrease (of 35 ha) has been observed in the overall woodland patch area between the two reporting periods with most change occurring in the 20 to 50 and 50 to 100 hectare woodland patch size class ranges.
Table 10 Woodland patches in the Ashton-Dwyer Hill catchment (2008 and 2014)
*Includes treed swamps
4.2.2 Woodland (Forest) Interior Habitat
The forest interior is habitat deep within woodlands. It is a sheltered, secluded environment away from the influence of forest edges and open habitats. Some people call it the “core” or the “heart” of a woodland. The presence of forest interior is a good sign of woodland health, and is directly related to the woodland’s size and shape. Large woodlands with round or square outlines have the greatest amount of forest interior. Small, narrow woodlands may have no forest interior conditions at all. Forest interior habitat is a remnant natural environment, reminiscent of the extensive, continuous forests of the past. This increasingly rare forest habitat is now a refuge for certain forest-dependent wildlife; they simply must have it to survive and thrive in a fragmented forest landscape (Conserving the Forest Interior. Ontario Extension Notes, 2000).
The Natural Heritage Reference Manual states that woodland interior habitat is usually defined as habitat more than 100 metres from the edge of the woodland and provides for relative seclusion from outside influences along with a moister, more sheltered and productive forest habitat for certain area sensitive species. Woodlands with interior habitat have centres that are more clearly buffered against the edge effects of agricultural activities or more harmful urban activities than those without.
In the Ashton-Dwyer Hill catchment (in 2014), the 356 woodland patches contain 76 forest interior patches (Figure 53) that occupy two percent (135 ha.) of the catchment land area (which is less than the five percent of interior forest in the Jock River Subwatershed). This is below the ten percent figure referred to in the Environment Canada Guideline that is considered to be the minimum threshold for supporting edge intolerant bird species and other forest dwelling species in the landscape.
Most patches (74) have less than 10 hectares of interior forest, 54 of which have small areas of interior forest habitat less than one hectare in size. Between 2008 and 2014, there has been a large change in the number of woodland patches containing interior habitat with an overall loss of six hectares in the catchment (Table 11), suggesting an increase in forest fragmentation over the six year period.
Table 11 Woodland Interior in the Ashton-Dwyer Hill catchment (2008 and 2014)
4.3 Wetland Cover
Wetlands are habitats forming the interface between aquatic and terrestrial systems. They are among the most productive and biologically diverse habitats on the planet. By the 1980s, according to the Natural Heritage Reference Manual, 68 percent of the original wetlands south of the Precambrian Shield in Ontario had been lost through encroachment, land clearance, drainage and filling.
Wetlands perform a number of important ecological and hydrological functions and provide an array of social and economic benefits that society values. Maintaining wetland cover in a watershed provides many ecological, economic, hydrological and social benefits that are listed in the Reference Manual and which may include:
- contributing to the stabilization of shorelines and to the reduction of erosion damage through the mitigation of water flow and soil binding by plant roots
- mitigating surface water flow by storing water during periods of peak flow (such as spring snowmelt and heavy rainfall events) and releasing water during periods of low flow (this mitigation of water flow also contributes to a reduction of flood damage)
- contributing to an improved water quality through the trapping of sediments, the removal and/or retention of excess nutrients, the immobilization and/or degradation of contaminants and the removal of bacteria
- providing renewable harvesting of timber, fuel wood, fish, wildlife and wild rice
- contributing to a stable, long-term water supply in areas of groundwater recharge and discharge
- providing a high diversity of habitats that support a wide variety of plants and animals
- acting as “carbon sinks” making a significant contribution to carbon storage
- providing opportunities for recreation, education, research and tourism
Historically, the overall wetland coverage within the Great Lakes basin exceeded 10 percent, but there was significant variability among watersheds and jurisdictions, as stated in the Environment Canada Guideline. In the Rideau Valley Watershed, it has been estimated that pre-settlement wetland cover averaged 35 percent using information provided by Ducks Unlimited Canada (2010) versus the 21 percent of wetland cover existing in 2014 derived from DRAPE imagery analysis.
Using the same dataset, it is estimated that pre-settlement (historic) wetland cover averaged 51 percent in the Jock River subwatershed versus the 24 percent of cover existing in 2014 (as summarized in Table 12).
Table 12 Wetland cover in the Jock River subwatershed and Ashton-Dwyer Hill catchment (Historic to 2014)
This decline in wetland cover is also evident in the Ashton-Dwyer Hill catchment (as seen in Figure 54) where wetland was reported to cover 47 percent of the area prior to settlement, as compared to 21 percent in 2014. This represents a 55 percent loss of historic wetland cover. To maintain critical hydrological, ecological functions along with related recreational and economic benefits provided by these wetland habitats in the catchment, a “no net loss” of currently existing wetlands should be employed to ensure the continued provision of tangible benefits accruing from them to landowners and surrounding communities.
Figure 54 Ashton-Dwyer Hill catchment wetland cover
4.4 Shoreline Cover
The riparian or shoreline zone is that special area where the land meets the water. Well-vegetated shorelines are critically important in protecting water quality and creating healthy aquatic habitats, lakes and rivers. Natural shorelines intercept sediments and contaminants that could impact water quality conditions and harm fish habitat in streams. Well established buffers protect the banks against erosion, improve habitat for fish by shading and cooling the water and provide protection for birds and other wildlife that feed and rear young near water. A recommended target (from the Environment Canada Guideline) is to maintain a minimum 30 metre wide vegetated buffer along at least 75 percent of the length of both sides of rivers, creeks and streams.
Figure 55 shows the extent of the ‘Natural’ vegetated riparian zone (predominantly wetland/woodland features) and ‘Other’ anthropogenic cover (crop/pastureland, roads/railways, settlements) along a 30-metre-wide area of land, both sides of the shoreline of the Jock River and its tributaries in the Ashton-Dwyer Hill catchment.
Figure 55 Natural and other riparian land cover in the Ashton-Dwyer Hill catchment
This analysis shows that the riparian zone in the Ashton-Dwyer Hill catchment in 2014 was comprised of wetland (36 percent), crop and pastureland (28 percent), woodland (18 percent), settlement (eight percent), transportation (seven percent), meadow-thicket (three percent) and aggregates (less than one percent). Additional statistics for the Ashton-Dwyer Hill catchment are presented in Table 13. Of particular interest is the observed increase in the area of “Transportation” and "Meadow-Thicket" and decrease in "Woodland", "Wetland" and "Crop and Pastureland" along the shoreline of the Jock River and tributaries over a six year period.
Table 13 Riparian land cover (2008 vs. 2014) in the Ashton-Dwyer Hill catchment
5.0 Jock River-Ashton Dwyer Hill Catchment: Stewardship and Water Resources Protection
The RVCA and its partners are working to protect and enhance environmental conditions in the Jock River Subwatershed. Figure 56 shows the location of all stewardship projects completed in the Jock River-Ashton Dwyer Hill catchment along with sites identified for potential shoreline restoration.
5.1 Rural Clean Water Projects
From 2010 to 2015, three precision farming and two manure storage/wastewater runoff projects were completed along with one well upgrade, one milkhouse wastewater treatment facility, one windbreak planting and one fragile land retirement. Between 2004 and 2009, two livestock fencing and two crop residue projects were finished along with two septic system replacements, one well decommissioning, one well upgrade and one nutrient management plan. Prior to 2004, four crop residue and three livestock fencing projects, three precision farming, two milkhouse wastewater treatment facilities, one septic system replacement and one manure storage/wastewater runoff project were completed. Total value of all 32 projects is $506,613 with $91,900 of that amount funded through grant dollars from the RVCA.
Figure 56 Stewardship site locations
5.2 Private Land Forestry Projects
The location of RVCA tree planting projects is shown in Figure 56. From 2010 to 2015, 24,450 trees were planted at six sites. Between 2004 and 2009, 23,057 trees were planted at 10 sites and prior to 2004, 200,460 trees were planted at 31 sites, In total, 245,967 trees were planted resulting in the reforestation of 123 hectares. Three of these projects were completed within the 30 metre riparian zone of the Jock River and its tributaries. Total project value of all 47 projects is $695,523 with $262,014 of that amount coming from fundraising sources.
Through the RVCA Butternut Recovery Program, an additional 70 butternut trees were planted in the Jock River-Ashton Dwyer Hill catchment (Figure 56) between 2004 and 2015, as part of efforts to introduce healthy seedlings from tolerant butternuts into various locations across Eastern Ontario.
5.3 Shoreline Naturalization Projects
With the assistance of the RVCA’s Shoreline Naturalization Program, 190 trees and shrubs were planted at a total project value of $1,582.
5.4 Ontario Drinking Water Stewardship Projects
Figure 56 shows the location of all Ontario Drinking Water Stewardship Program (ODWSP) projects in the Jock River-Ashton Dwyer Hill catchment. Between 2010 and 2015, two fuel handling and storage facilities and one septic system repair/replacement were completed. Total project value is $28,810 with $9,291 of that amount funded by the Ontario Ministry of the Environment.
5.5 Valley, Stream, Wetland and Hazard Lands
The Ashton-Dwyer Hill catchment covers 81 square kilometres with 17.3 square kilometres (or 21 percent) of the drainage area being within the regulation limit of Ontario Regulation 174/06 (Figure 57), giving protection to wetland areas and river or stream valleys that are affected by flooding and erosion hazards.
Wetlands occupy 17.1 sq. km. (or 21 percent) of the catchment. Of these wetlands, 8.3 sq. km (or 49 percent) are designated as provincially significant and included within the RVCA regulation limit. This leaves the remaining 8.8 sq. km (or 51 percent) of wetlands in the catchment outside the regulated area limit.
Of the 153.3 kilometres of stream in the catchment, regulation limit mapping has been plotted along 56.9 kilometers of streams (representing 37 percent of all streams in the catchment). Some of these regulated watercourses (30.1 km or 20 percent of all streams) flow through regulated wetlands; the remaining 26.8 km (or 47 percent) of regulated streams are located outside of those wetlands. Plotting of the regulation limit on the remaining 96.4 km (or 63 percent) of streams requires identification of flood and erosion hazards and valley systems.
Within those areas of the Ashton-Dwyer Hill catchment subject to the regulation (limit), efforts (have been made and) continue through RVCA planning and regulations input and review to manage the impact of development (and other land management practices) in areas where “natural hazards” are associated with rivers, streams, valley lands and wetlands. For areas beyond the regulation limit, protection of the catchment’s watercourses is only provided through the “alteration to waterways” provision of the regulation.
Figure 57 RVCA regulation limits
5.6 Vulnerable Drinking Water Areas
A portion of the Wellhead Protection Area around the Munster municipal drinking water source is located within the Jock River-Ashton Dwyer Hill drainage catchment. This area is subject to mandatory policies in the Mississippi-Rideau Source Protection Plan developed under the Clean Water Act. These policies specifically regulate land uses and activities that are considered drinking water threats, thereby reducing the risk of contamination of the municipal drinking water source.
The Jock River-Ashton Dwyer Hill drainage catchment is also considered to have a Highly Vulnerable Aquifer. This means that the nature of the overburden (thin soils, fractured bedrock) does not provide a high level of protection for the underlying groundwater making the aquifer more vulnerable to contaminants released on the surface. The Mississippi-Rideau Source Protection Plan includes policies that focus on the protection of groundwater region-wide due to the fact that most of the region, which encompasses the Mississippi and Rideau watersheds, is considered Highly Vulnerable Aquifer.
For detailed maps and policies that have been developed to protect drinking water sources, please go to the Mississippi-Rideau Source Protection Region website at www.mrsourcewater.ca to view the Mississippi-Rideau Source Protection Plan.
6.0 Jock River-Ashton Dwyer Hill Catchment: Challenges/Issues
Water Quality/Quantity
Surface chemistry water quality on the Jock River in the catchment declines from “Fair” to “Poor” between the upstream (JR-45) and downstream sites (JR-20). The scores at both sites are largely influenced by frequent high nutrient concentrations and periods of bacterial pollution
Instream biological water quality conditions at the Jock River Ashton-Dwyer Hill sample location aquatic habitat conditions from a benthic invertebrate perspective is considered “Poor” from 2011 to 2015 as the samples are dominated by species that are moderately sensitive and tolerant to high organic pollution levels
Existing hydrological and geochemical datasets and assessments (academic, RVCA, others) are only recently available and/or are not being considered in the characterization of the numerous hydrologic functions of the Jock River subwatershed. Further, there is a dearth of hydrologic information (hydroperiod, groundwater/surface water interactions, geochemistry) about the wetlands that remain in the Jock River subwatershed
Headwaters/Instream/Shorelines
‘Natural’ vegetation covers 57 percent of the riparian zone of the Jock River and its tributaries (Figure 55) and is below the recommended 30 metre wide, naturally vegetated target along 75 percent of the length of the catchment’s watercourses
Land Cover
Woodlands cover 25 percent of the catchment and is less than the 30 percent of forest cover that is identified as the minimum threshold for sustaining forest birds and other woodland dependent species (Figure 53)
Pre-settlement wetlands have declined by 55 percent and now cover 21 percent (1713 ha.) of the catchment (Figure 54). Fifty-two percent (896 ha.) of these wetlands remain unevaluated/unregulated and are vulnerable to drainage and land clearing activities in the absence of any regulatory and planning controls that would otherwise protect them for the many important hydrological, social, biological and ecological functions/services/values they provide to landowners and the surrounding community
7.0 Jock River-Ashton Dwyer Hill Catchment: Opportunities/Actions
Water Quality/Quantity
Investigate the impact of inflow from the Jenkinson drain to water quality conditions on the Jock River at site (JR-20)
Focus water quality improvements at elevated nutrient and E. coli counts via non-point and point source pollution control using best management practices such as shoreline zone enhancement and protection of natural cover
Landowners should consider taking advantage of the Rural Clean Water Programs which offer grants to landowners interested in implementing projects on their property that will help to protect and improve water quality:
- Homeowners may be interested in projects to repair, replace or upgrade their well or septic system, or addressing erosion through buffer plantings and erosion control
- Farmers can take advantage of a wide range of projects, including livestock fencing, manure storage, tile drainage control structures, cover crops, and many more
Continue to coordinate environmental monitoring and reporting activities with the City of Ottawa
Use wetland restoration as a tool to improve surface water quality and help restore the hydrologic integrity of the Jock River and its tributaries
List, share and when possible, synthesize and use existing hydrological and geochemical datasets and assessment outcomes to facilitate the characterization of subwatershed and catchment hydrological functions. In addition, prepare guidance on best practices for the preparation of water budget assessments to better understand the hydrologic cycle requirements that occur at site specific scales; and share existing catchment and subwatershed scale water budget assessment outcomes
Headwaters/Instream/Shorelines
Promote the Rideau Valley Shoreline Naturalization Program to landowners to increase existing 57 percent of natural shoreline cover
Educate landowners about the value of and best management practices used to maintain and enhance natural shorelines and headwater drainage features
Work with the Township of Beckwith and City of Ottawa to consistently implement current land use planning and development policies for water quality and shoreline protection (i.e., adherence to a minimum 30 metre development setback from water) adjacent to the Jock River and other catchment streams
Target shoreline restoration at sites identified in this report (shown as “Other riparian land cover” in Figure 55 and “Potential Riparian/Instream Restoration” in Figures 42/43) and explore other restoration and enhancement opportunities along the Jock River and its tributaries
Land Cover
Promote the City of Ottawa Green Acres Reforestation Program and the Rideau Valley Trees for Tomorrow Program to landowners to increase existing 25 percent of woodland cover
Encourage the Township of Beckwith and City of Ottawa to strengthen natural heritage policies in official plans and zoning by-laws where shoreline, wetland, woodland cover and watercourse setbacks are determined to be at or below critical ecological thresholds. Information for this purpose is provided in the RVCA’s subwatershed and catchment reports
Explore ways and means to more effectively enforce and implement conditions of land-use planning and development approvals to achieve net environmental gains
Re-consider the RVCA’s approach to wetland regulation where there is an identified hydrologic imperative to do so (i.e., significant loss of historic wetland cover (see Figure 54) and/or seasonal, critically low baseflows in the Jock River and/or areas of seasonal flooding)
Full Catchment Report
Jock River Subwatershed Report 2016
Jock River-Barrhaven Catchment
The RVCA produces individual reports for 12 catchments in the Jock River subwatershed. Using data collected and analyzed by the RVCA through its watershed monitoring and land cover classification programs, surface water quality and in-stream conditions are reported for the Jock River along with a summary of environmental conditions for the surrounding countryside every six years.
This information is used to better understand the effects of human activity on our water resources, allows us to better track environmental change over time and helps focus watershed management actions where they are needed the most to help sustain the ecosystem services (cultural, aesthetic and recreational values; provisioning of food, fuel and clean water; regulation of erosion/natural hazard protection and water purification; supporting nutrient/water cycling and habitat provision) provided by the catchment’s lands and forests and waters (Millennium Ecosystem Assessment 2005).
The following sections of this report for the Jock River-Barrhaven catchment are a compilation of that work.
| Catchment Facts |
Section 1.0 |
| Surface Water Quality Conditions |
Section 2.0 |
| Riparian Conditions |
Section 3.0 |
| Land Cover |
Section 4.0 |
| Land Stewardship and Water Resources Protection |
Section 5.0 |
| Challenges/Issues |
Section 6.0 |
| Actions/Opportunities |
Section 7.0 |
For other Jock River catchments and the Jock River Subwatershed Report, please visit the RVCA website at www.rvca.ca

Figure 1 Land cover in the Barrhaven catchment
1.0 Jock River-Barrhaven Catchment: Facts
1.1 General/Physical Geography
Municipalities
- Ottawa: (31 km2; 100% of catchment)
Geology/Physiography
- The Barrhaven Catchment resides within an extensive physiographic region known as the Ottawa Valley Clay Plain. The sediment was deposited in the Champlain Sea after the last glaciation. This part of the clay plain is approximately 8 to 10 metres deep. It is truncated to the north by Paleozoic bedrock and to the west by a regional geological sand and gravel feature known as the Kars Esker; while glacial till flanks the eastern extent of the catchment
- In this catchment, the clay plain is underlain by dolostone, interbedded sandstone/dolostone and limestone from the Oxford, March and Bobcaygeon Formations, respectively. In addition, several geologic faults may pass through the catchment
Karst/Topography
- The ground surface ranges in elevation from 120 masl along Moodie Drive north of Fallowfield Road to 80 masl at the confluence of the Jock River with the Rideau River
- Surficial karst may be present near Hwy 416 in this catchment
Drainage Area
- 31 square kilometers; occupies five percent of the Jock River subwatershed, one percent of the Rideau Valley watershed
Stream Length
- Jock River and tributaries: 50 km
1.2 Vulnerable Areas
Flood/Erosion Hazard
- Jock River is subject to a flooding hazard during the regional storm flood (the 100 year flood). Surveys and studies undertaken in accordance with provincial standards have determined that the 100 year flood elevation in the catchment ranges from 92.7 metres above mean sea level at the upper, mapped extent of the regulation limit at Moodie Drive to 80.3 metres above mean sea level at its confluence with the Rideau River downstream of Prince of Wales Drive
Aquifer Vulnerability
- The Mississippi-Rideau Source Protection initiative has mapped the southern part of this catchment as a Significant Groundwater Recharge Area and parts of the catchment as Highly Vulnerable Aquifer. There are no Well Head Protection Areas in the catchment
Wetland Hydrology
- A watershed model developed by the RVCA in 2009 was used to study the hydrologic function of wetlands in the Rideau Valley Watershed, including those found in the Barrhaven catchment
1.3 Conditions at a Glance
Water Quality
- Surface chemistry water quality rating in the Barrhaven catchment is “Fair” at both sites over the two reporting periods (2004-2009 and 2010-2015). Frequent high nutrient concentrations and occasional exceedances of copper and aluminium contributed to the rating
- Instream biological water quality conditions at the Jock River Barrhaven sample location range from “ Poor” to “Good” from 2004 to 2015 (using a grading scheme developed by Ontario Conservation Authorities in Ontario for benthic invertebrates) with an overall benthic invertebrate water quality rating of “Good” determined for this period
Instream and Riparian
- Overall instream and riparian condition for the Jock River-Barrhaven catchment as assessed by the stream characterization and headwater drainage feature assessment programs show that the Jock River and its tributaries are in generally good condition. The majority of the system has low erosion levels and a moderately healthy riparian corridor. Instream diversity of aquatic habitat is variable along much of the system
Thermal Regime
- Warm/cool water thermal guild supporting the Jock River/Rideau River fishery
Fish Community
- Thirty-six species of recreational and bait fish
Shoreline Cover Type (30 m. riparian area; 2014)
- Crop and Pasture (36%)
- Settlement (29%)
- Woodland (20%)
- Transportation (11%)
- Aggregate (3%)
- Wetland (1%)
Land Cover Type (2014)
- Settlement (42%)
- Crop and Pasture (20%)
- Transportation (14%)
- Woodland (11%)
- Aggregate (9%)
- Water (2%)
- Meadow-Thicket (1%)
- Wetland (<1%)
Land Cover Change (2008 to 2014)
- Crop and Pasture (-250 ha)
- Woodland (-27 ha)
- Meadow-Thicket (0 ha)
- Aggregate (+2 ha)
- Wetland (+2 ha)
- Water (+4 ha)
- Transportation (+108 ha)
- Settlement (+160 ha)
Significant Natural Features
- Stony Swamp Provincially Significant Wetland
Water Wells
- Several hundred (~350) operational private water wells in the Barrhaven catchment. Groundwater uses are mainly domestic but also include livestock watering, groundwater monitoring and testing and municipal, commercial and other public water supplies
Aggregates
- There are parts of 3 bedrock quarry licenses and 9 sand and gravel pit licenses located within the catchment. Sand and gravel resources are mainly of secondary importance
Species at Risk (Elemental Occurrence)
- Snapping Turtle (Special Concern)
1.4 Catchment Care
Stewardship
- Twenty-one stewardship projects undertaken (see Section 5)
Environmental Monitoring
- Chemical surface (in-stream) water quality collection since 2003 (see Section 2)
- Benthic invertebrate (aquatic insect) surface (in-stream) water quality collection since 2003 (see Section 3.3.1)
- Fish survey along the Jock River (see Section 3.3.11)
- Stream characterization survey on the Jock River in 2015, working upstream to the headwaters from its mouth where it empties into the Rideau River, taking measurements and recording observations on instream habitat, bank stability, other attributes and preparing a temperature profile (see Section 3)
- Five headwater drainage feature assessments in 2015 at road crossings in the catchment. The protocol measures zero, first and second order headwater drainage features and is a rapid assessment method characterizing the amount of water, sediment transport, and storage capacity within headwater drainage features (see Section 3.4)
- Groundwater level and chemistry data is available from a PGMN well located in the Hearts Desire community (W085). Additional groundwater chemistry information is available from the Ontario Geological Survey for two wells located in this catchment
Environmental Management
- Development along the Jock River and in and adjacent to the Stony Swamp Provincially Significant Wetlands in the catchment) is subject to Ontario Regulation 174-06 (entitled “Development, Interference with Wetlands and Alterations to Shorelines and Watercourses”) that protects the hydrologic function of the wetland and also protects landowners and their property from natural hazards (flooding, fluctuating water table, unstable soils) associated with them
- Approximately 30 Environmental Compliance Approvals and/or Environmental Activity and Sector Registrations in this catchment. Most of these approvals/registrations are for municipal and private sewage works, while others are for private water works, waste management systems, a standby power system industrial sewage disposal systems and air emissions. An active municipal landfill is in the southern part of this catchment
- Approximately 28 active Permits To Take Water (PTTW), most of which have been issued for construction dewatering or similar activities; several for golf course irrigation; a couple for quarry dewatering; and one for municipal landfill activities
2.0 Jock River-Barrhaven Catchment: Surface Water Quality Conditions
Surface water quality conditions in the Jock River-Barrhaven catchment are monitored by the City of Ottawa’s Baseline Water Quality Monitoring Program. This program provides information on the condition of Ottawa’s surface water resources; data is collected for multiple parameters including nutrients (total phosphorus, total Kjeldahl nitrogen and ammonia), E. coli, metals (like aluminum and copper) and additional chemical/physical parameters (such as alkalinity, chlorides, pH and total suspended solids). The locations of monitoring sites are shown in Figure 2 and Table 1.
Figure 2 Water quality monitoring sites on the Jock River in the Barrhaven Catchment
2.1 Jock River Water Quality Rating
There are two monitored water quality sites on the Jock River in the Barrhaven Catchment (JR-01 and JR-02), the RVCA's water quality rating for these are “Fair” (Table 1) as determined by the Canadian Council of Ministers of the Environment (CCME) Water Quality Index[1]. A “Fair” rating indicates that water quality is usually protected but is occasionally threatened or impaired; conditions sometimes depart from natural or desirable levels. Each parameter is evaluated against established guidelines to determine water quality conditions. Those parameters that frequently exceed guidelines are presented below. Analysis of the data has been broken into two periods; 2004 to 2009 and 2010 to 2015 to examine if conditions have changed between these periods. Table 1 shows the overall rating for the monitored surface water quality sites within the Jock River-Barrhaven catchment and Table 2 outlines the Water Quality Index (WQI) scores and their corresponding ratings.
Both sites had only small changes between the two reporting periods, with minor improvements in the water quality score. The scores at these sites are largely influenced by frequent high nutrient concentrations and occasional metal exceedances. For more information on the CCME WQI, please see the Jock River Subwatershed Report. For more information on the CCME WQI, please see the Jock River Subwatershed Report.
Table 1 Water Quality Index ratings for the Jock River-Barrhaven Catchment
Table 2 Water Quality Index ratings and corresponding index scores (RVCA terminology, original WQI category names in brackets)
2.2 Nutrients
Total phosphorus (TP) is used as a primary indicator of excessive nutrient loading and may contribute to abundant aquatic vegetation growth and depleted dissolved oxygen levels. The Provincial Water Quality Objective (PWQO) is used as the TP Guideline and states that in streams concentrations greater than 0.030 mg/l indicate an excessive amount of TP.
Total Kjeldahl nitrogen (TKN) and ammonia (NH3) are used as secondary indicators of nutrient loading. RVCA uses a guideline of 0.500 mg/l to assess TKN[2] and the PWQO of 0.020 mg/l to assess NH3 concentrations in the Jock River.
Tables 3, 4 and 5 summarize average nutrient concentrations at monitored sites within the Jock River-Barrhaven catchment and show the proportion of results that meet the guidelines.
Table 3 Summary of total phosphorus results for the Jock River-Barrhaven catchment, 2004-2009 and 2010-2015. Highlighted values indicate average concentrations exceed the guideline
Table 4 Summary of total Kjeldahl nitrogen results for the Jock River-Barrhaven catchment from 2004-2009 and 2010-2015. Highlighted values indicate average concentrations exceed the guideline
Table 5 Summary of ammonia results for Jock River-Barrhaven catchment from 2004-2009 and 2010-2015. Highlighted values indicate average concentrations exceed the guideline
Monitoring Site JR-01
The majority of samples at site JR-01 were above the TP guideline from 2004-2009; however the proportion of exceedances decreased in the 2010-2015 monitoring period (Figures 3 and 4). The number of samples below the guideline improved from 38 percent in 2004-2009 to 48 percent in 2010-2015, and the average TP concentrations decreased slightly from 0.037 mg/l (2004–2009) to 0.033 mg/l (2010–2015) as shown in Table 3.
TKN concentrations show that the bulk of results exceeded the guideline (Figures 5 and 6); there were few samples (eight percent) below the guideline in the 2004-2009 period and this declined to only two percent in the 2010-2015 period. The average concentration was generally elevated and increased from 0.698 mg/l to 0.714 mg/l (Table 4).
In the 2004-2009 reporting period 56% of NH3 results were below the guideline with an average concentration of 0.034 mg/l (Figure 7, Table 5). The percentage of results below the guideline declined to 41% in the 2010-2015 period, though the average concentration decreased to 0.028 mg/l (Figure 8, Table 5). The overall reduction in NH3 concentrations may be influenced by the lack of samples in March during the 2010-2015 period (Figure 8). In the 2004-2009 period samples in March had the greatest concentrations (Figure 7), likely influenced by the impact of meltwater conditions which increases runoff and potential loadings to the river.
Monitoring Site JR-02
Elevated TP results were a common occurrence at site JR-02 and remained consistent between the two monitoring periods; 41 percent of samples were below the guideline in the 2004-2009 period (Figure 3); this remained consistent at 42 percent of samples in the 2010-2015 period (Figure 4). The average TP concentration was largely unchanged decreasing only slightly from 0.038 mg/l (2004-2009) to 0.036 mg/l (2010-2015) as shown in Table 3.
The bulk of TKN results have exceeded the guideline (Figure 5 and 6), with six percent of samples below the guideline in the 2004-2009 period, decreasing to no samples below the guideline in 2010-2015. The average concentration was elevated and increased from 0.706 mg/l to 0.714 mg/l (Table 4).
The results for NH3 indicate that exceedances were common. Fifty-four percent of results were below the guideline in 2004-2009 (Figure 7); this decreased to 35 percent in the 2010-2015 reporting period (Figure 8). The average NH3 concentration decreased marginally from 0.037 mg/l to 0.034 mg/l (Table 5).
Figure 3 Total phosphorous concentrations in the Jock River, 2004-2009
Figure 4 Total phosphorous concentrations in the Jock River, 2010-2015
Figure 5 Total Kjeldahl nitrogen concentrations in the Jock River, 2004-2009
Figure 6 Total Kjeldahl nitrogen concentrations in the Jock River, 2010-2015
Figure 7 Ammonia concentrations in the Jock River, 2004-2009
Figure 8 Ammonia concentrations in the Jock River, 2010-2015
Summary
Nutrient enrichment has previously been identified as a feature in this reach of the Jock River[3]. Overall, average nutrient concentrations have remained consistent through the monitoring periods, with few changes in some sites or parameters. All parameters (total phosphorus, total Kjeldahl nitrogen and ammonia) exceed their respective guidelines reguarly. Elevated nutrients may result in nutrient loading downstream and to the Rideau River. High nutrient concentrations can help stimulate the growth of algae blooms and other aquatic vegetation in a waterbody and deplete oxygen levels as the vegetation dies off. Best management practices such as minimizing storm water runoff, enhanced shoreline buffers, minimizing/discontinuing the use of fertilizers and restricting livestock access in upstream agricultural areas can help to reduce nutrient enrichment in Jock River and subsequent impacts on the Rideau River.
2.3 Escherichia coli
Escherichia coli (E. coli) is used as an indicator of bacterial pollution from human or animal waste; in elevated concentrations it can pose a risk to human health. The PWQO of 100 colony forming units/100 millilitres (CFU/100 ml) is used. E. coli counts greater than this guideline indicate that bacterial contamination may be a problem within a waterbody.
Table 6 summarizes the geometric mean[4] for the monitored sites on the Jock River within the Barrhaven catchment and shows the proportion of samples that meet the E. coli guideline of 100 CFU/100 ml. The results of the geometric mean with respect to the guideline for the two periods, 2004-2009 and 2010-2015, are shown in Figures 9 and 10 respectively.
Table 6 Summary of
E. coli results for the Jock River, 2004-2009 and 2010-2015
Monitoring Site JR-01
E. coli counts at site JR-01 indicate little change with regard to bacterial contamination. The proportion of samples below the guideline rose marginally from 78 percent (Figure 9) to 80 percent (Figure 10). The count at the geometric mean increased from 39 CFU/100ml in 2004-2009 to 46 CFU/100ml from 2010-2015 (Table 6). Although the count at the geometric mean increased, the geometric mean is below the guideline and the majority of samples are below the PWQO for E. coli.
Monitoring Site JR-02
Elevated E. coli counts at site JR-02 occurred occasionally. The proportion of samples below the guideline decreased from 83 percent (Figure 9) from 2004-2009 to 73 percent (Figure 10) from 2010-2015. The count at the geometric mean also increased slightly between the two monitoring periods from 43 CFU/100ml to 47 CFU/100ml (Table 6). Although E. coli counts did increase marginally the geometric mean is well below the E. coli PWQO.
Figure 9 Geometric mean of E. coli results in the Jock River, 2004-2009
Figure 10 Geometric mean of E. coli results in the Jock River, 2010-2015
Summary
Bacterial contamination does not appear to be a significant concern in this reach of the Jock River. Both sites (JR-01 and JR-02) have occasional exceedances and counts at the geometric mean below the guideline of 100 CFU/100ml. Best management practices such as enhancing shoreline buffers, limiting livestock access and minimizing runoff in both rural and urban areas can help to protect this reach of the Jock River into the future.
2.4 Metals
Of the metals routinely monitored in the Jock River (Barrhaven Catchment) aluminum (Al) and copper (Cu) occasionally reported concentrations above their respective PWQOs. For Al, the PWQO is 0.075 mg/l and for Cu it is 0.005 mg/l. In elevated concentrations, these metals can have toxic effects on sensitive aquatic species.
Tables 7 and 8 summarize metal concentrations at sites JR-01 and JR-02 as well as show the proportion of samples that meet guidelines. Figures 11 to 14 show metal concentrations with respect to the guidelines for the two periods of interest, 2004–2009 and 2010–2015.
Table 7 Summary of aluminum results in the Jock River from 2004-2009 and 2010-2015. Highlighted values indicate average concentrations exceed the guideline
Table 8 Summary of copper results for the Jock River from 2004-2009 and 2010-2015
Monitoring Site JR-01
The average Al concentrations in site JR-01 exceeded the guideline. Most samples (66 percent) were below the guideline (Figure 11) from 2004-2009, this declined marginally to 64 percent (Figure 12) of results reporting below the guideline from 2010-2015. The average concentration increased from 0.085 mg/l to 0.094 mg/l (Table 7).
Copper concentrations occasionally exceeded the PWQO, with 75 percent of samples below the guideline in 2004-2009 (Figure 12). The Cu concentrations increased to 84 percent of samples being below the guideline in 2010-2015 (Figure 14). The average concentration of copper marginally decreased during the two reporting periods from 0.0036 mg/l to 0.0026 mg/l (Table 8). The lack of sampling in March for the 2010-2015 period (Figure 14) may account for this apparent decrease, as elevated results were observed in March during the 2004-2009 period (Figure 13).
Monitoring Site JR-02
Results from JR-02 provide evidence of increasing Al concentrations between the two reporting periods. Seventy-one percent of samples were below the guideline in the 2004-2009 period (Figure 11). This decreased to 59 percent of samples in the 2010-2015 period (Figure 12). The average concentration of Al was 0.075 mg/l from 2004-2009 and increased to 0.099 mg/l from 2010-2015 (Table 7).
Copper concentrations have occasionally exceeded the guidelines but did not show marked change between the two reporting periods. In the 2004-2009 period 76 percent of samples were below the guideline (Figure 13) and rose slightly to 78 percent of samples in the 2010-2015 period (Figure 14). The average concentrations (Table 8) increased marginally from 0.0034 mg/l (2004-2009) to 0.0037 mg/l (2010-2015).
Figure 11 Average aluminum concentrations in the Jock River, 2004-2009
Figure 12 Average aluminum concentrations in the Jock River, 2010-2015
Figure 13 Average copper concentrations in the Jock River, 2004-2009
Figure 14 Average copper concentrations in the Jock River, 2010-2015
Summary
In the Barrhaven catchment aluminum concentrations have increased at both sites JR-01 and JR-02 while copper concentrations have remained consistent. Most increases in concentrations are observed during the spring likely due to increased runoff amounts from melt conditions; runoff picks up pollutants from farms, yards, roads and parking lots[5]. As there has been increased urbanization in this area it is likely that runoff from hardened surfaces (roadways, parking lots, etc.) is influencing metal concentrations. Continued efforts should be made to identify pollution sources and implement best management practices to reduce any inputs such as storm water runoff to improve overall stream health and lessen downstream impacts.
1 The City of Ottawa Baseline Water Quality Monitoring Program has also applied the CCME WQI to monitored sites. The parameters used and time periods differs between the RVCA and City of Ottawa’s application of the WQI, thus has resulted in different ratings at some sites.
2 No Ontario guideline for TKN is presently available; however, waters not influenced by excessive organic inputs typically range from 0.100 to 0.500 mg/l, Environment Canada (1979) Water Quality Sourcebook, A Guide to Water Quality Parameters, Inland Waters Directorate, Water Quality Branch, Ottawa, Canada
3 Rideau Valley Conservation Authroity. (2010). Jock River Subwatershed Report.
4 A type of mean or average, which indicates the central tendency or typical value of a set of numbers by using the product of their values (as opposed to the arithmetic mean which uses their sum). It is often used to summarize a variable that varies over several orders of magnitude, such as E. coli counts.
5 City of Ottawa Water Environment Protection Program. (2006). Water Quality in Ottawa's Rivers and Streams.
3.0 Jock River-Barrhaven Catchment: Riparian Conditions
3.1 Jock River Overbank Zone
3.1.1 Riparian Buffer Land Cover Evaluation
Figure 15 demonstrates the buffer conditions of the left and right banks separately. The Jock River in the Barrhaven catchment had a buffer of greater than 30 meters along 52 percent of the right bank and 57 percent of the left bank. A five meter or less buffer was present along 29 percent of the right bank and 18 percent of the left bank.
Figure 15 Riparian Buffer Evaluation along the Jock River in the Barrhaven catchment
3.1.2 Riparian Buffer Alterations
Alterations within the riparian buffer area were assessed within three distinct shoreline zones (0-5m, 5-15m, 15-30m), and evaluated based on the dominant vegetative community and/or land cover type (Figure 16). The riparian buffer zone along the Jock River within the Barrhaven catchment was found to have highly variable conditions along the riparian corridor. These alterations were generally associated with road crossings, shoreline hardening and residential/infrastructure/agricultural land uses.
Figure 16 Riparian buffer alterations within the Jock River Barrhaven catchment
3.1.3 Adjacent Land Use
The RVCA’s Stream Characterization Program identifies seven different land uses beside the Jock River in the Barrhaven catchment (Figure 17). Surrounding land use is considered from the beginning to end of the survey section (100m) and up to 100m on each side of the river. Land use outside of this area is not considered for the surveys but is nonetheless part of the subwatershed and will influence the creek. Natural areas made up 65 percent of the stream, characterized by forest, scrubland and meadow. Forest habitat was dominant in the adjacent lands along the Jock River in the Barrhaven catchment at 42 percent. The remaining land use consisted of active agriculture, residential, recreational and infrastructure in the form of road crossings.
Figure 17 Land Use along the Jock River in the Barrhaven catchment
3.2 Jock River Shoreline Zone
3.2.1 Instream Erosion
Stream erosion is the process by which water erodes and transports sediments, resulting in dynamic flows and diverse habitat conditions. Excessive erosion can result in drastic environmental changes, as habitat conditions, water quality and aquatic life are all negatively affected. Bank stability was assessed as the overall extent of each section with “unstable” shoreline conditions. These conditions are defined by the presence of significant exposed soils/roots, minimal bank vegetation, severe undercutting, slumping or scour and potential failed erosion measures. High levels of erosion were observed along the left bank immediately upstream of the Hearts Desire weir as well as at various locations downstream of the 416 crossing. Figure 18 shows low to high levels of erosion along the Jock River in the Barrhaven catchment.
Figure 18 Erosion along the Jock River in the Barrhaven catchment
3.2.2 Undercut Stream Banks
Stream bank undercuts can provide excellent cover habitat for aquatic life, however excessive levels can be an indication of unstable shoreline conditions. Bank undercut was assessed as the overall extent of each surveyed section with overhanging bank cover present. Figure 19 shows that the Jock River in the Barrhaven catchment had low to high levels of undercut banks along the system. High levels of undercut banks were present in the upper reaches of the Barrhaven catchment at various locations upstream and downstream of the 416 highway crossing.
Figure 19 Undercut stream banks along the Jock River in the Barrhaven catchment
3.2.3 Stream Shading
Grasses, shrubs and trees all contribute towards shading a stream. Shade is important in moderating stream temperature, contributing to food supply and helping with nutrient reduction within a stream. Stream cover is assessed as the total coverage area in each section that is shaded by overhanging trees/grasses and tree canopy, at greater than 1m above the water surface. Figure 20 shows low to moderate levels of stream shading dominate conditions in most reaches of the Jock River in the Barrhaven catchment.
Figure 20 Stream shading along the Jock River in the Barrhaven catchment
3.2.4 Instream Woody Debris
Figure 21 shows that the majority of the Jock River in the Barrhaven catchment had low to moderate levels of instream woody debris in the form of branches and trees. Instream woody debris is important for fish and benthic invertebrate habitat, by providing refuge and feeding areas.
Figure 21 Instream woody debris along the Jock River in the Barrhaven catchment
3.2.5 Overhanging Trees and Branches
Trees and branches that are less than one meter from the surface of the water are defined as overhanging. Overhanging branches and trees provide a food source, nutrients and shade which helps to moderate instream water temperatures. Figure 22 shows the system is highly variable with low to high levels of overhanging branches and trees along the Jock River in the Barrhaven catchment.
Figure 22 Overhanging trees and branches along the Jock River in the Barrhaven catchment
3.2.6 Anthropogenic Alterations
Stream alterations are classified based on specific functional criteria associated with the flow conditions, the riparian buffer and potential human influences. Figure 23 shows 31 percent of the Jock River in the Barrhaven catchment remains “unaltered” with no anthropogenic alterations. Fifty three percent of the Jock River in the Barrhaven catchment was classified as natural with minor anthropogenic changes, 14 percent was classified as altered and one percent was considered highly altered. The alterations along the Jock River in this reach were in the form of reduced buffers, shoreline modifications and road crossings.
Figure 23 Anthropogenic alterations along the Jock River in the Barrhaven catchment
3.3 Jock River Instream Aquatic Habitat
3.3.1 Benthic Invertebrates
Freshwater benthic invertebrates are animals without backbones that live on the stream bottom and include crustaceans such as crayfish, molluscs and immature forms of aquatic insects. Benthos represent an extremely diverse group of aquatic animals and exhibit wide ranges of responses to stressors such as organic pollutants, sediments and toxicants, which allows scientists to use them as bioindicators. As part of the Ontario Benthic Biomonitoring Network (OBBN), the RVCA has been collecting benthic invertebrates at the Prince of Wales site on the Jock River since 2004. Monitoring data is analyzed for each sample site and the results are presented using the Family Biotic Index, Family Richness and percent Ephemeroptera, Plecoptera and Trichoptera.
Hilsenhoff Family Biotic Index
The Hilsenhoff Family Biotic Index (FBI) is an indicator of organic and nutrient pollution and provides an estimate of water quality conditions for each site using established pollution tolerance values for benthic invertebrates. FBI results for the Jock River Barrhaven catchment sample location at Prince of Wales are separated by reporting period 2004 to 2009 and 2010 to 2015. “Good” to “Poor” water quality conditions being observed at the Jock River Barrhaven sample location for the period from 2004 to 2015 (Fig.24) using a grading scheme developed by Conservation Authorities in Ontario for benthic invertebrates.
Figure 24 Hilsenhoff Family Biotic Index at the Jock River Prince of Wales sample location
Family Richness
Family Richness measures the health of the community through its diversity and increases with increasing habitat diversity suitability and healthy water quality conditions. Family Richness is equivalent to the total number of benthic invertebrate families found within a sample. The Jock River Barrhaven site is reported to have “Fair” to “Good” family richness (Fig.25).
Figure 25 Family Richness at the Jock River Prince of Wales sample location
EPT
Ephemeroptera (Mayflies), Plecoptera (Stoneflies), and Trichoptera (Caddisflies) are species considered to be very sensitive to poor water quality conditions. High abundance of these organisms is generally an indication of good water quality conditions at a sample location. As a result, the EPT indicates that the Jock River Barrhaven sample location is reported to have “Fair” to “Good” water quality (Fig.26) from 2004 to 2015.
Figure 26 EPT at the Jock River Prince of Wales sample location
Conclusion
Overall the Jock River Barrhaven sample location aquatic habitat conditions from a benthic invertebrate perspective is considered “Good” from 2004 to 2015 as the samples are dominated by species that are moderately sensitive and sensitive to high organic pollution levels.
3.3.2 Habitat Complexity
Habitat complexity is a measure of the overall diversity of habitat types and features within a stream. Streams with high habitat complexity support a greater variety of species niches, and therefore contribute to greater diversity. Factors such as substrate, flow conditions (pools, riffles) and cover material (vegetation, wood structure, etc) all provide crucial habitat to aquatic life. Habitat complexity is assessed based on the presence of boulder, cobble and gravel substrates, as well as the presence of instream woody material.
Diverse habitat cover was identified throughout the Jock River Barrhaven reach, with considerable coverage across the surveyed stream (Figure 27). Many of these sections represent potentially crucial habitat for resident species. Regions with reduced habitat complexity were observed in the middle reaches within the catchment.
Figure 27 Habitat complexity along the Jock River in the Barrhaven catchment
3.3.3 Instream Substrate
Diverse substrate is important for fish and benthic invertebrate habitat because some species have specific substrate requirements and for example will only reproduce on certain types of substrate. The absence of diverse substrate types may limit the overall diversity of species within a stream. Figure 28 shows that 78 percent of the sections observed on the Jock River Barrhaven had the presence of clay substrate and 71% of the sections contained silt. Cobble was present within 70% of the sections, while boulders were present in 55% of surveyed sections. Overall substrate conditions were diverse along the Jock River Barrhaven reach. Figure 29 shows the dominant substrate type observed for each section surveyed along the Jock River in the Barrhaven catchment.
Figure 28 Instream substrate along the Jock River in the Barrhaven catchment
Figure 29 Dominant substrate type along the Jock River in the Barrhaven catchment
3.3.4 Instream Morphology
Pools and riffles are important habitat features for aquatic life. Riffles are fast flowing areas characterized by agitation and overturn of the water surface. Riffles thereby play a crucial role in contributing to dissolved oxygen conditions and directly support spawning for some fish species. They are also areas that support high benthic invertebrate populations which are an important food source for many aquatic species. Pools are characterized by minimal flows, with relatively deep water and winter and summer refuge habitat for aquatic species. Runs are moderately shallow, with unagitated surfaces of water and areas where the thalweg (deepest part of the channel) is in the center of the channel. Figure 30 shows that the Jock River Barrhaven catchment is fairly diverse; 61 percent consists of runs, 18 percent riffles and 21 percent pools. Figure 31 shows where the riffle habitat areas were observed along the Jock River in the Barrhaven catchment.

Figure 30 Instream morphology along the Jock River in the Barrhaven catchment
Figure 31 Riffle habitat locations along the Jock River in the Barrhaven catchment
3.3.5 Vegetation Type
Instream vegetation provides a variety of functions and is a critical component of the aquatic ecosystem. Aquatic plants promote stream health by:
- Providing direct riparian/instream habitat
- Stabilizing flows reducing shoreline erosion
- Contributing to dissolved oxygen through photosynthesis
- Maintaining temperature conditions through shading
For example emergent plants along the shoreline can provide shoreline protection from wave action and important rearing habitat for species of waterfowl. Submerged plants provide habitat for fish to find shelter from predator fish while they feed. Floating plants such as water lilies shade the water and can keep temperatures cool while reducing algae growth. Narrow leaved emergents were present at 96% of the sections surveyed, algae was observed in 86% of sections, while free floating plants were observed in 67% of surveyed sections. Broad leaved emergents were observed in 58% of sections, submerged plants in 57%, floating plants in 53% and robust emergents in only 33% of sections surveyed. Figure 32 depicts the plant community structure for the Jock River Barrhaven catchment. Figure 33 shows the dominant vegetation type observed for each section surveyed along the Jock River in the Barrhaven catchment.
Figure 32 Vegetation type along the Jock River in the Barrhaven catchment
Figure 33 Dominant vegetation type along the Jock River in the Barrhaven catchment
3.3.6 Instream Vegetation Abundance
Instream vegetation is an important factor for a healthy stream ecosystem. Vegetation helps to remove contaminants from the water, contributes oxygen to the stream, and provides habitat for fish and wildlife. Too much vegetation can also be detrimental. Figure 34 demonstrates that the Jock River Barrhaven reach had no vegetation to low levels of instream vegetation for 76 percent of its length. Clay and bedrock substrate conditions can limit the amount of instream vegetation which is the likely factor for low vegetation levels along this reach of the Jock River. Normal to common levels of vegetation were recorded at only 22 percent of stream surveys.
Figure 34 Instream vegetation abundance along the Jock River in the Barrhaven catchment
3.3.7 Invasive Species
Invasive species can have major implications on streams and species diversity. Invasive species are one of the largest threats to ecosystems throughout Ontario and can out compete native species, having negative effects on local wildlife, fish and plant populations. Sixty nine percent of the sections surveyed along the Jock River Barrhaven reach had invasive species (Figure 35). The invasive species observed in the Jock River Barrhaven reach were European frogbit, purple loosestrife, poison/wild parsnip, carp, banded mystery snail, dog strangling vine, yellow iris, bull thistle, Eurasian milfoil and Manitoba maple. Invasive species abundance (i.e. the number of observed invasive species per section) was assessed to determine the potential range/vector of many of these species (Figure 36).
Figure 35 Invasive species abundance along the Jock River in the Barrhaven catchment
3.3.8 Water Chemistry
During the stream characterization survey, a YSI probe is used to collect water chemistry information. Dissolved oxygen (DO), specific conductivity (SPC) and pH are measured at the start and end of each section.
3.3.8.1 Dissolved Oxygen
Dissolved oxygen is a measure of the amount of oxygen dissolved in water. The Canadian Environmental Quality Guidelines of the Canadian Council of Ministers of the Environment (CCME) suggest that for the protection of aquatic life the lowest acceptable dissolved oxygen concentration should be 6 mg/L for warmwater biota and 9.5 mg/L for coldwater biota (CCME, 1999). Figure 37 shows that the dissolved oxygen in the Jock River Barrhaven catchment was within the threshold for warmwater biota in this reach of the system. The average dissolved oxygen levels observed within the main stem of the Jock River Barrhaven catchment was 8.67 mg/L.
Figure 37 Dissolved oxygen ranges in the Jock River Barrhaven catchment
3.3.8.2 Conductivity
Conductivity in streams is primarily influenced by the geology of the surrounding environment, but can vary drastically as a function of surface water runoff. Currently there are no CCME guideline standards for stream conductivity; however readings which are outside the normal range observed within the system are often an indication of unmitigated discharge and/or stormwater input. The average conductivity observed within the main stem of Jock River in the Barrhaven catchment was 662 µs/cm. Figure 38 shows the conductivity readings for the Jock River Barrhaven catchment.
Figure 38 Specific conductivity ranges in the Jock River Barrhaven catchment
3.3.8.3 pH
Based on the PWQO for pH, a range of 6.5 to 8.5 should be maintained for the protection of aquatic life. Average pH values for the Jock River Barrhaven catchment averaged 7.94 thereby meeting the provincial standard (Figure 39).
Figure 39 pH ranges in the Jock River Barrhaven catchment
3.3.8.4 Oxygen Saturation (%)
Oxygen saturation is measured as the ratio of dissolved oxygen relative to the maximum amount of oxygen that will dissolve based on the temperature and atmospheric pressure. Well oxygenated water will stabilize at or above 100% saturation, however the presence of decaying matter/pollutants can drastically reduce these levels. Oxygen input through photosynthesis has the potential to increase saturation above 100% to a maximum of 500%, depending on the productivity level of the environment. In order to represent the relationship between concentration and saturation, the measured values have been summarized into 6 classes:
- <100% Saturation / <6.0 mg/L Concentration. Oxygen concentration and saturation are not sufficient to support aquatic life and may represent impairment
- >100% Saturation / <6.0 mg/L Concentration. Oxygen concentration is not sufficient to support aquatic life, however saturation levels indicate that the water has stabilized at its estimated maximum. This is indicative of higher water temperatures and stagnant flows.
- <100% Saturation / 6.0-9.5 mg/L Concentration. Oxygen concentration is sufficient to support warm water biota, however depletion factors are likely present and are limiting maximum saturation.
- >100% Saturation / 6.0-9.5 mg/L Concentration. Oxygen concentration and saturation levels are optimal for warm water biota.
- <100% Saturation / >9.5 mg/L Concentration. Oxygen concentration is sufficient to support cold water biota, however depletion factors are likely present and are limiting maximum saturation.
- >100% Saturation / >9.5 mg/L Concentration. Oxygen concentration and saturation levels are optimal for coldwater biota.
 and saturation (%) on the Jock River Barrhaven reach")
Figure 40 A bivariate assessment of dissolved oxygen concentration (mg/L) and saturation (%) on the Jock River Barrhaven reach
Dissolved oxygen conditions on the Jock River in the Barrhaven catchment are generally sufficient for both warm and coldwater species (Figure 40).
3.3.8.5 Specific Conductivity Assessment
Specific conductivity (SPC) is a standardized measure of electrical conductance, collected at or corrected to a water temperature of 25⁰C. SPC is directly related to the concentration of ions in water, and is commonly influenced by the presence of dissolved salts, alkalis, chlorides, sulfides and carbonate compounds. The higher the concentration of these compounds, the higher the conductivity. Common sources of elevated conductivity include storm water, agricultural inputs and commercial/industrial effluents.
In order to summarize the conditions observed, SPC levels were evaluated as either normal, moderately elevated or highly elevated. These categories correspond directly to the degree of variation (i.e. standard deviation) at each site relative to the average across the system.
Normal levels were maintained of the Jock River Barrhaven catchment, with moderately elevated levels observed in the lower reaches (Figure 41). Highly elevated conditions were identified in the lower reach of the system, and generally correspond with proximity to the Hearts Desire weir and storm water inputs.
Figure 41 Relative specific conductivity levels on the Jock River in the Barrhaven catchment
3.3.9 Thermal Regime
Many factors can influence fluctuations in stream temperature, including springs, tributaries, precipitation runoff, discharge pipes and stream shading from riparian vegetation. Water temperature is used along with the maximum air temperature (using the Stoneman and Jones method) to classify a watercourse as either warm water, cool water or cold water. Figure 42 shows where the thermal sampling sites were located along the Jock River Barrhaven catchment. Analysis of the data collected indicates that the Jock River Barrhaven catchment is classified as a warm water system with cool to warm water reaches (Figure 43).
Figure 42 Temperature logger locations on the Jock River in the Barrhaven catchment
Figure 43 Temperature logger data for three sites on the Jock River in the Barrhaven catchment
Each point on the graph represents a temperature that meets the following criteria:
- Sampling dates between July 1st and September 7th
- Sampling date is preceded by two consecutive days above 24.5 °C, with no rain
- Water temperatures are collected at 4pm
- Air temperature is recorded as the max temperature for that day
3.3.10 Groundwater
Groundwater discharge areas can influence stream temperature, contribute nutrients, and provide important stream habitat for fish and other biota. During stream surveys, indicators of groundwater discharge are noted when observed. Indicators include: springs/seeps, watercress, iron staining, significant temperature change and rainbow mineral film. Figure 44 shows areas where one or more of the above groundwater indicators were observed during stream surveys and headwater assessments.
Figure 44 Groundwater indicators observed in the Jock River Barrhaven catchment
3.3.11 Fish Community
The Jock River Barrhaven catchment is classified as a mixed community of warm and cool water recreational and baitfish fishery with 36 species observed. Figure 45 shows the sampling locations along the Jock River in the Barrhaven catchment.
Figure 45 Jock River Barrhaven catchment fish community
The following table contains a list of species observed in the watershed.
Table 9 Fish species observed in Jock River Barrhaven catchment
RVCA electrosfishing site at Prince of Wales in the Jock River Barrhaven catchment
Smallmouth bass captured during the electrofishing sampling effort at Prince of Wales Drive in the Jock River - Barrhaven catchment
3.3.12 Migratory Obstructions
Migratory obstructions represent limitations to fish dispersal within a system and may restrict access to important spawning and rearing habitat. Migratory obstructions can be natural or manmade, and they can be permanent or seasonal. Figure 46 shows that Jock River in the Barrhaven catchment had two weir barriers at the time of the survey in 2015. One is the seasonal barrier known as the Hearts Desire weir and the other is a low level crossing upstream of Highway 416. A debris dam was observed on a headwater system within the catchment.
Figure 46 Migratory obstructions along Jock River in the Barrhaven catchment
3.3.13 Riparian Restoration
Figure 47 depicts the locations of various riparian restoration opportunities as a result of observations made during the stream surveys.
Figure 47 Riparian restoration opportunities along the Jock River in the Barrhaven catchment
3.3.14 Instream Restoration
Figure 48 depicts the locations of instream restoration opportunities as a result of observations made during the stream surveys.
Figure 48 Instream restoration opportunities along the Jock River in the Barrhaven catchment
3.4 Headwater Drainage Feature Assessment
3.4.1 Headwaters Sampling Locations
The RVCA Stream Characterization program assessed Headwater Drainage Features for the Jock River subwatershed in 2015. This protocol measures zero, first and second order headwater drainage features (HDF). It is a rapid assessment method characterizing the amount of water, sediment transport, and storage capacity within headwater drainage features (HDF). RVCA is working with other Conservation Authorities and the Ministry of Natural Resources and Forestry to implement the protocol with the goal of providing standard datasets to support science development and monitoring of headwater drainage features. An HDF is a depression in the land that conveys surface flow. Additionally, this module provides a means of characterizing the connectivity, form and unique features associated with each HDF (OSAP Protocol, 2013). In 2015 the program sampled 5 sites at road crossings in the Jock River Barrhaven catchment area (Figure 49).

Figure 49 Locations of the headwater sampling sites in the Jock River Barrhaven catchment
3.4.2 Headwater Feature Type
The headwater sampling protocol assesses the feature type in order to understand the function of each feature. The evaluation includes the following classifications: defined natural channel, channelized or constrained, multi-thread, no defined feature, tiled, wetland, swale, roadside ditch and pond outlet. By assessing the values associated with the headwater drainage features in the catchment area we can understand the ecosystem services that they provide to the watershed in the form of hydrology, sediment transport, and aquatic and terrestrial functions. Three features were classified as having been channelized, one feature was identified as a roadside drainage features and one feature was classified as natural. Figure 50 shows the feature type of the primary feature at the sampling locations.
Figure 50 Headwater feature types in the Jock River Barrhaven catchment
3.4.3 Headwater Feature Flow
The observed flow condition within headwater drainage features can be highly variable depending on timing relative to the spring freshet, recent rainfall, soil moisture, etc. Flow conditions are assessed in the spring and in the summer to determine if features are perennial and flow year round, if they are intermittent and dry up during the summer months or if they are ephemeral systems that do not flow regularly and generally respond to specific rainstorm events or snowmelt. Flow conditions in headwater systems can change from year to year depending on local precipitation patterns. Figure 51 shows the observed flow conditions at the sampling locations in the Jock River Barrhaven catchment in 2015.
Figure 51 Headwater feature flow conditions in the Jock River Barrhaven catchment
A spring photo of the headwater sample site in the Jock River Barrhaven catchment located on Okeefe Court
3.4.4 Feature Channel Modifications
Channel modifications were assessed at each headwater drainage feature sampling location. Modifications include channelization, dredging, hardening and realignments. The Jock River Barrhaven catchment area had one site classified as having no channel modifications, one feature was classified as being hardened and two had mixed modifications. Figure 52 shows the channel modifications observed at the sampling locations for Jock River Barrhaven.
Figure 52 Headwater feature channel modifications in the Jock River Barrhaven catchment
3.4.5 Headwater Feature Vegetation
Headwater feature vegetation evaluates the type of vegetation that is found within the drainage feature. The type of vegetated within the channel influences the aquatic and terrestrial ecosystem values that the feature provides. For some types of headwater features the vegetation within the feature plays a very important role in flow and sediment movement and provides fish and wildlife habitat. The following classifications are evaluated no vegetation, lawn, wetland, meadow, scrubland and forest. The features assessed in the Jock River Barrhaven catchment were classified being dominated by wetland and meadow. Figure 53 depicts the dominant vegetation observed at the sampled headwater sites in the Jock River Barrhaven catchment.
Figure 53 Headwater feature vegetation types in the Jock River Barrhaven catchment
3.4.6 Headwater Feature Riparian Vegetation
Headwater riparian vegetation evaluates the type of vegetation that is found along the adjacent lands of a headwater drainage feature. The type of vegetation within the riparian corridor influences the aquatic and terrestrial ecosystem values that the feature provides to the watershed. The sample locations in Jock River Barrhaven were dominated by natural vegetation in the form of meadow and wetland vegetation. Figure 54 depicts the type of riparian vegetation observed at the sampled headwater sites in the Jock River Barrhaven catchment.
Figure 54 Headwater feature riparian vegetation types in the Jock River Barrhaven catchment
3.4.7 Headwater Feature Sediment Deposition
Assessing the amount of recent sediment deposited in a channel provides an index of the degree to which the feature could be transporting sediment to downstream reaches (OSAP, 2013). Evidence of excessive sediment deposition might indicate the requirement to follow up with more detailed targeted assessments upstream of the site location to identify potential best management practices to be implemented. Conditions ranged from no deposition observed to extensive deposition recorded. Figure 55 depicts the degree of sediment deposition observed at the sampled headwater sites in the Jock River Barrhaven catchment.
Figure 55 Headwater feature sediment deposition in the Jock River Barrhaven catchment
3.4.8 Headwater Feature Upstream Roughness
Feature roughness will provide a measure of the amount of materials within the bankfull channel that could slow down the velocity of water flowing within the headwater feature (OSAP, 2013). Materials on the channel bottom that provide roughness include vegetation, woody debris and boulders/cobble substrates. Roughness can provide benefits in mitigating downstream erosion on the headwater drainage feature and the receiving watercourse by reducing velocities. Roughness also provides important habitat conditions to aquatic organisms. The sample locations in the Jock River Barrhaven catchment area ranged from moderate to extreme roughness conditions. Figure 56 shows the feature roughness conditions at the sampling locations in the Jock River Barrhaven catchment.
Figure 56 Headwater feature roughness in the Jock River Barrhaven catchment
4.0 Jock River-Barrhaven Catchment: Land Cover
Land cover and any change in coverage that has occurred over a six-year period is summarized for the Jock River-Barrhaven catchment using spatially continuous vector data representing the catchment during the spring of 2008 and 2014. This dataset was developed by the RVCA through heads-up digitization of 20cm DRAPE ortho-imagery at a 1:4000 scale and details the surrounding landscape using 10 land cover classes.
4.1 Barrhaven Catchment Change
As shown in Table 10 and Figure 1, the dominant land cover type across the Barrhaven catchment in 2014 was settlement, followed by crop and pastureland, transportation, aggregates and woodland.
Table 10 Land cover (2008 vs. 2014) in the Barrhaven catchment
* Does not include treed swamps ** Includes treed swamps
From 2008 to 2014, there was an overall change of 446 hectares (from one land cover class to another). Most of the change in the Barrhaven catchment is a result of the conversion of crop and pastureland to settlement and transportation (Figure 57).
Figure 57 Land cover change in the Barrhaven catchment (2014)
Table 11 provides a detailed breakdown of all land cover change that has taken place in the Barrhaven catchment between 2008 and 2014.
Table 11 Land cover change in the Barrhaven catchment (2008 to 2014)
4.1.1 Barrhaven Catchment Change - Urban Area
As shown in Table 12, the dominant land cover type in the Urban Area of the Barrhaven catchment in 2014 was settlement, followed by crop and pastureland, transportation and woodland.
Table 12 Land cover (2008 vs. 2014) in the Urban Area of Barrhaven catchment
* Does not include treed swamps ** Includes treed swamps
From 2008 to 2014, there was an overall change of 398 hectares from one land cover class to another, the majority of which can be attributed to the conversion of crop and pasture to settlement along with areas previously subjected to pre-development, site preparation activity being converted to commercial and residential development. Table 13 provides a detailed breakdown of all land cover change that has taken place in the Urban Area of the Barrhaven catchment between 2008 and 2014.
Table 13 Land cover change in the Urban Area of Barrhaven catchment (2008 vs. 2014)
4.1.2 Barrhaven Catchment Change - Rural Area
As shown in Table 14, the dominant land cover type in the Rural Area of the Barrhaven catchment in 2014 was aggregate, followed by settlement, woodland, crop and pastureland and transportation.
Table 14 Land cover in the Rural Area of Barrhaven catchment (2008 vs. 2014)
* Does not include treed swamps ** Includes treed swamps
From 2008 to 2014, there was an overall change of 48 hectares from one land cover class to another, the majority of which can be attributed to the conversion of crop and pasture to settlement. Table 15 provides a detailed breakdown of all land cover change that has taken place in the Rural Area of the Barrhaven catchment between 2008 and 2014.
Table 15 Land cover change in the Rural Area of Barrhaven catchment (2008 vs. 2014)
4.2 Woodland Cover
In the Environment Canada Guideline (Third Edition) entitled “How Much Habitat Is Enough?” the opening narrative under the Forest Habitat Guidelines section states that prior to European settlement, forest was the predominant habitat in the Mixedwood Plains ecozone. The remnants of this once vast forest now exist in a fragmented state in many areas (including the Rideau Valley watershed) with woodland patches of various sizes distributed across the settled landscape along with higher levels of forest cover associated with features such as the Frontenac Axis (within the on-Shield areas of the Rideau Lakes and Tay River subwatersheds). The forest legacy, in terms of the many types of wildlife species found, overall species richness, ecological functions provided and ecosystem complexity is still evident in the patches and regional forest matrices (found in the Jock Rideau subwatershed and elsewhere in the Rideau Valley watershed). These ecological features are in addition to other influences which forests have on water quality and stream hydrology including reducing soil erosion, producing oxygen, storing carbon along with many other ecological services that are essential not only for wildlife but for human well-being.
The Guideline also notes that forests provide a great many habitat niches that are in turn occupied by a great diversity of plant and animal species. They provide food, water and shelter for these species - whether they are breeding and resident locally or using forest cover to help them move across the landscape. This diversity of species includes many that are considered to be species at risk. Furthermore, from a wildlife perspective, there is increasing evidence that the total forest cover in a given area is a major predictor of the persistence and size of bird populations, and it is possible or perhaps likely that this pattern extends to other flora and fauna groups. The overall effect of a decrease in forest cover on birds in fragmented landscapes is that certain species disappear and many of the remaining ones become rare, or fail to reproduce, while species adapted to more open and successional habitats, as well as those that are more tolerant to human-induced disturbances in general, are able to persist and in some cases thrive. Species with specialized-habitat requirements are most likely to be adversely affected. The overall pattern of distribution of forest cover, the shape, area and juxtaposition of remaining forest patches and the quality of forest cover also play major roles in determining how valuable forests will be to wildlife and people alike.
The current science generally supports minimum forest habitat requirements between 30 and 50 percent, with some limited evidence that the upper limit may be even higher, depending on the organism/species phenomenon under investigation or land-use/resource management planning regime being considered/used.
As shown in Figure 58, eleven percent of the Barrhaven catchment contains 344 hectares of upland forest versus the 26 percent of woodland cover in the Jock River subwatershed. This is less than the 30 percent of forest cover that is identified as the minimum threshold required to sustain forest birds according to the Guideline and which may only support less than one half of potential species richness and marginally healthy aquatic systems. When forest cover drops below 30 percent, forest birds tend to disappear as breeders across the landscape.
Figure 58 Woodland cover and interior forest (2014)
4.2.1 Woodland (Patch) Size
According to the Ministry of Natural Resources’ Natural Heritage Reference Manual (Second Edition), larger woodlands are more likely to contain a greater diversity of plant and animal species and communities than smaller woodlands and have a greater relative importance for mobile animal species such as forest birds.
Bigger forests often provide a different type of habitat. Many forest birds breed far more successfully in larger forests than they do in smaller woodlots and some rely heavily on forest interior conditions. Populations are often healthier in regions with more forest cover and where forest fragments are grouped closely together or connected by corridors of natural habitat. Small forests support small numbers of wildlife. Some species are “area-sensitive” and tend not to inhabit small woodlands, regardless of forest interior conditions. Fragmented habitat also isolates local populations, especially small mammals, amphibians and reptiles with limited mobility. This reduces the healthy mixing of genetic traits that helps populations survive over the long run (Conserving the Forest Interior. Ontario Extension Notes, 2000).
The Environment Canada Guideline also notes that for forest plants that do not disperse broadly or quickly, preservation of some relatively undisturbed large forest patches is needed to sustain them because of their restricted dispersal abilities and specialized habitat requirements and to ensure continued seed or propagation sources for restored or regenerating areas nearby.
The Natural Heritage Reference Manual continues by stating that a larger size also allows woodlands to support more resilient nutrient cycles and food webs and to be big enough to permit different and important successional stages to co-exist. Small, isolated woodlands are more susceptible to the effects of blowdown, drought, disease, insect infestations, and invasions by predators and non-indigenous plants. It is also known that the viability of woodland wildlife depends not only on the characteristics of the woodland in which they reside, but also on the characteristics of the surrounding landscape where the woodland is situated. Additionally, the percentage of forest cover in the surrounding landscape, the presence of ecological barriers such as roads, the ability of various species to cross the matrix surrounding the woodland and the proximity of adjacent habitats interact with woodland size in influencing the species assemblage within a woodland.
In the Barrhaven catchment (in 2014), forty-five (46 percent) of the 97 woodland patches are very small, being less than one hectare in size. Another 47 (49 percent) of the woodland patches ranging from one to less than 20 hectares in size tend to be dominated by edge-tolerant bird species. The remaining five (five percent of) woodland patches range between 20 and 100 hectares in size and may support a few area-sensitive species along with some edge intolerant species, but will be dominated by edge tolerant species.
No patch exceeds the 100 plus hectare size needed to support most forest dependent, area sensitive birds and which are large enough to support approximately 60 percent of edge-intolerant species. No patch tops 200 hectares, which according to the Environment Canada Guideline will support 80 percent of edge-intolerant forest bird species (including most area sensitive species) that prefer interior forest habitat conditions.
Table 16 presents a comparison of woodland patch size in 2008 and 2014 along with any changes that have occurred over that time. A decrease (of 27 ha) has been observed in the overall woodland patch area between the two reporting periods with most change occurring in the 1 to 20 and 20 to 50 hectare woodland patch size class ranges.
Table 16 Woodland patches in the Barrhaven catchment (2008 and 2014)
*Includes treed swamps
4.2.2 Woodland (Forest) Interior Habitat
The forest interior is habitat deep within woodlands. It is a sheltered, secluded environment away from the influence of forest edges and open habitats. Some people call it the “core” or the “heart” of a woodland. The presence of forest interior is a good sign of woodland health, and is directly related to the woodland’s size and shape. Large woodlands with round or square outlines have the greatest amount of forest interior. Small, narrow woodlands may have no forest interior conditions at all. Forest interior habitat is a remnant natural environment, reminiscent of the extensive, continuous forests of the past. This increasingly rare forest habitat is now a refuge for certain forest-dependent wildlife; they simply must have it to survive and thrive in a fragmented forest landscape (Conserving the Forest Interior. Ontario Extension Notes, 2000).
The Natural Heritage Reference Manual states that woodland interior habitat is usually defined as habitat more than 100 metres from the edge of the woodland and provides for relative seclusion from outside influences along with a moister, more sheltered and productive forest habitat for certain area sensitive species. Woodlands with interior habitat have centres that are more clearly buffered against the edge effects of agricultural activities or more harmful urban activities than those without.
In the Barrhaven catchment (in 2014), the 97 woodland patches contain 11 forest interior patches (Figure 58) that occupy less than one percent (22 ha.) of the catchment land area (which is less than the three percent of interior forest in the Jock River Subwatershed). This is below the ten percent figure referred to in the Environment Canada Guideline that is considered to be the minimum threshold for supporting edge intolerant bird species and other forest dwelling species in the landscape.
All 11 patches have less than 10 hectares of interior forest, four of which have small areas of interior forest habitat less than one hectare in size. Between 2008 and 2014, there was an overall loss of one hectare of interior forest habitat in the catchment (Table 17).
Table 17 Woodland interior in the Barrhaven catchment (2008 and 2014)
4.3 Wetland Cover
Wetlands are habitats forming the interface between aquatic and terrestrial systems. They are among the most productive and biologically diverse habitats on the planet. By the 1980s, according to the Natural Heritage Reference Manual, 68 percent of the original wetlands south of the Precambrian Shield in Ontario had been lost through encroachment, land clearance, drainage and filling.
Wetlands perform a number of important ecological and hydrological functions and provide an array of social and economic benefits that society values. Maintaining wetland cover in a watershed provides many ecological, economic, hydrological and social benefits that are listed in the Reference Manual and which may include:
- contributing to the stabilization of shorelines and to the reduction of erosion damage through the mitigation of water flow and soil binding by plant roots
- mitigating surface water flow by storing water during periods of peak flow (such as spring snowmelt and heavy rainfall events) and releasing water during periods of low flow (this mitigation of water flow also contributes to a reduction of flood damage)
- contributing to an improved water quality through the trapping of sediments, the removal and/or retention of excess nutrients, the immobilization and/or degradation of contaminants and the removal of bacteria
- providing renewable harvesting of timber, fuel wood, fish, wildlife and wild rice
- contributing to a stable, long-term water supply in areas of groundwater recharge and discharge
- providing a high diversity of habitats that support a wide variety of plants and animals
- acting as “carbon sinks” making a significant contribution to carbon storage
- providing opportunities for recreation, education, research and tourism
Historically, the overall wetland coverage within the Great Lakes basin exceeded 10 percent, but there was significant variability among watersheds and jurisdictions, as stated in the Environment Canada Guideline. In the Rideau Valley Watershed, it has been estimated that pre-settlement wetland cover averaged 35 percent using information provided by Ducks Unlimited Canada (2010) versus the 21 percent of wetland cover existing in 2014 derived from DRAPE imagery analysis.
Using the same dataset, it is estimated that pre-settlement (historic) wetland cover averaged 51 percent in the Jock River subwatershed versus the 24 percent of cover existing in 2014 (as summarized in Table 18).
Table 18 Wetland cover in the Jock River subwatershed and Barrhaven catchment (Historic to 2014)
This decline in wetland cover is also evident in the Barrhaven catchment (as seen in Figure 59) where wetland was reported to cover 45 percent of the area prior to settlement, as compared to less than one percent in 2014. This represents a 99 percent loss of historic wetland cover and what remains (in 2014) falls far below the 40 percent historic wetland threshold cited in the Environment Canada Guideline for maintaining key ecological and hydrological functions. To maintain critical hydrological, ecological functions along with related recreational and economic benefits provided by these wetland habitats in the catchment, the Guideline recommends a “no net loss” approach for currently existing wetlands combined with efforts to work towards restoring upwards of 40 percent of the historic wetland coverage, where feasible.
Figure 59 Barrhaven catchment wetland cover
4.4 Shoreline Cover
The riparian or shoreline zone is that special area where the land meets the water. Well-vegetated shorelines are critically important in protecting water quality and creating healthy aquatic habitats, lakes and rivers. Natural shorelines intercept sediments and contaminants that could impact water quality conditions and harm fish habitat in streams. Well established buffers protect the banks against erosion, improve habitat for fish by shading and cooling the water and provide protection for birds and other wildlife that feed and rear young near water. A recommended target (from the Environment Canada Guideline) is to maintain a minimum 30 metre wide vegetated buffer along at least 75 percent of the length of both sides of rivers, creeks and streams.
Figure 60 shows the extent of the ‘Natural’ vegetated riparian zone (predominantly wetland/woodland features) and ‘Other’ anthropogenic cover (crop/pastureland, roads/railways, settlements) along a 30-metre-wide area of land, both sides of the shoreline of the Jock River and its tributaries in the Barrhaven catchment.
Figure 60 Natural and other riparian land cover in the Barrhaven catchment
This analysis shows that the riparian zone in the Barrhaven catchment in 2014 was comprised of crop and pastureland (36 percent), settlement (29 percent), woodland (20 percent), transportation (11 percent), aggregate (three percent) and wetland (one percent). Additional statistics for the Barrhaven catchment are presented in Table 19. Of particular interest is the observed increase in the area of "Settlement" and decrease in “Crop and Pastureland" along the shoreline of the Jock River and tributaries over a six year period.
Table 19 Riparian land cover (2008 vs. 2014) in the Barrhaven catchment
5.0 Jock River-Barrhaven Catchment: Stewardship and Water Resources Protection
The RVCA and its partners are working to protect and enhance environmental conditions in the Jock River Subwatershed. Figure 61 shows the location of all stewardship projects completed in the Jock River-Barrhaven catchment along with sites identified for potential shoreline restoration.
5.1 Rural Clean Water Projects
From 2010 to 2015, two septic system replacements were constructed. Between 2004 and 2009, two septic system replacements, two livestock fencing projects, one well upgrade and one well decommissioning were finished and prior to 2004, five septic system replacements and three livestock fencing projects were completed, Four of these projects were completed within the 30 metre riparian zone of the Jock River. Total value of all 16 projects is $156,866 with $28,227 of that amount funded through grant dollars from the RVCA.
Figure 61 Stewardship site locations
5.2 Private Land Forestry Projects
The location of RVCA tree planting projects is shown in Figure 61. From 2010 to 2015, 300 trees were planted at one site and prior to 2004, 9,800 trees were planted at three sites. In total, 10,100 trees were planted resulting in the reforestation of six hectares. One of these projects was completed within the 30 metre riparian zone of the Jock River. No trees were planted in the catchment between 2004 and 2009. Total project value of all four projects is $50,135 with $23,421 of that amount coming from fundraising sources.
5.3 Shoreline Naturalization Projects
With the assistance of the RVCA’s Shoreline Naturalization Program, 475 trees and shrubs were planted to create an overall six metre long shoreline buffer at a total project value of $14,234.
5.4 Fish Habitat Restoration
Fish habitat compensation was required for the Barrhaven South development as a number of tributary watercourses were eliminated or modified to allow for development. A bypass pond was constructed off the main stem of the Jock River in 2008 to provide spawning and nursery habitat for northern pike and muskellunge in the spring and nursery and refugia habitat in the summer and fall. Under normal high water mark conditions, it provides approximately 9,000 meters square of habitat along with several small finger channels that extend from the larger pond to provide spawning habitat for northern pike. Post effectiveness monitoring work in 2010 revealed that thirteen species of fish were utilizing the habitat for spawning, nursery, rearing and feeding purposes, including northern pike. Subsequent fish sampling in 2015 confirmed that several species of fish continue to utilize the restored habitat within the pond feature.
Barrhaven South Fish Habitat Compensation location
5.5 Valley, Stream, Wetland and Hazard Lands
The Barrhaven catchment covers 31 square kilometres with 4.8 square kilometres (or 16 percent) of the drainage area being within the regulation limit of Ontario Regulation 174/06 (Figure 62), giving protection to wetland areas and river or stream valleys that are affected by flooding and erosion hazards.
Wetlands occupy 14.5 hectares (or less than one percent) of the catchment. Of these wetlands, 12.5 hectares (or 86 percent) are designated as provincially significant and included within the RVCA regulation limit. This leaves the remaining two hectares (or 14 percent) of wetlands in the catchment outside the regulated area limit.
Of the 50.3 kilometres of stream in the catchment, regulation limit mapping has been plotted along 22.1 kilometers of streams (representing 44 percent of all streams in the catchment). Some of these regulated watercourses (0.5 km or 1.0 percent of all streams) flow through regulated wetlands; the remaining 21.6 km (or 98 percent) of regulated streams are located outside of those wetlands. Plotting of the regulation limit on the remaining 28.2 km (or 56 percent) of streams requires identification of flood and erosion hazards and valley systems.
Within those areas of the Barrhaven catchment subject to the RVCA regulation (limit), efforts (have been made and) continue through RVCA planning and regulations input and review to manage the impact of development (and other land management practices) in areas where “natural hazards” are associated with rivers, streams, valley lands and wetlands. Additionally, in the rapidly urbanizing areas of the Barrhaven catchment, significant effort is made through land use planning and development control processes and carefully planned stormwater management systems, initially guided by master drainage planning and integrated subwatershed planning, to meet the natural heritage and natural hazards policies presented in the City of Ottawa Official Plan. Also, within areas beyond the regulation limit, protection of the catchment’s watercourses is provided through the “alteration to waterways” provision of the regulation.
Figure 62 RVCA regulation limits
5.6 Vulnerable Drinking Water Areas
The Jock River-Barrhaven drainage catchment is considered to have a Highly Vulnerable Aquifer. This means that the nature of the overburden (thin soils, fractured bedrock) does not provide a high level of protection for the underlying groundwater making the aquifer more vulnerable to contaminants released on the surface. The Mississippi-Rideau Source Protection Plan includes policies that focus on the protection of groundwater region-wide due to the fact that most of the region, which encompasses the Mississippi and Rideau watersheds, is considered Highly Vulnerable Aquifer.
For detailed maps and policies that have been developed to protect drinking water sources, please go to the Mississippi-Rideau Source Protection Region website at www.mrsourcewater.ca to view the Mississippi-Rideau Source Protection Plan.
6.0 Jock River-Barrhaven Catchment: Challenges/Issues
Water Quality/Quantity
Surface chemistry water quality rating in the Jock River is “Fair” over two reporting periods (2004-2009 and 2010-2015). Frequent high nutrient concentrations and occasional exceedances of copper and aluminium contributed to the rating
Instream biological water quality conditions at the Jock River Barrhaven sample location range from “ Poor” to “Good” from 2004 to 2015 (using a grading scheme developed by Ontario Conservation Authorities in Ontario for benthic invertebrates) with an overall benthic invertebrate water quality rating of “Good” determined for this period
Effect of climate change on the hydrologic function (water budget) of the Jock River subwatershed and associated natural hazards (flood risk) posed to the built/urban areas of the catchment are not understood
Existing hydrological and geochemical datasets and assessments (academic, RVCA, others) are only recently available and/or are not being considered in the characterization of the numerous hydrologic functions of the Jock River subwatershed. Further, there is a dearth of hydrologic information (hydroperiod, groundwater/surface water interactions, geochemistry) about the wetlands that remain in the Jock River subwatershed
Headwaters/Instream/Shorelines
‘Natural’ vegetation covers 21percent of the riparian zone of the Jock River and its tributaries (Figure 60) and is below the recommended 30 metre wide, naturally vegetated target along 75 percent of the length of the catchment’s watercourses
Hearts Desire weir is a seasonal impediment to fish movement along the Jock River and can fragment/isolate fish populations
Land Cover
Woodlands cover 11 percent of the catchment and is below the 30 percent of forest cover that is identified as the minimum threshold for sustaining forest birds and other woodland dependent species (Figure 58)
Pre-settlement wetlands have declined by 99 percent and now cover less than one percent (14 ha.) of the catchment (Figure 59)
7.0 Jock River-Barrhaven Catchment: Opportunities/Actions
Water Quality/Quantity
Investigate the source of possible pollutants along the Jock River in the catchment and consider implementing measures to reduce nutrient and metal loadings, such as improved storm water management in developed areas along with the incorporation of low impact development features to assist with storm water management
In rural areas, private landowners should consider taking advantage of The Rural Clean Water Programs which offer grants to landowners interested in implementing projects on their property that will help to protect and improve water quality:
- Homeowners may be interested in projects to repair, replace or upgrade their well or septic system, or addressing erosion through buffer plantings and erosion control
- Farmers can take advantage of a wide range of projects, including livestock fencing, manure storage, tile drainage control structures, cover crops, and many more.
Continue to coordinate environmental monitoring and reporting activities with the City of Ottawa
Use wetland restoration as a tool to improve surface water quality and help restore the hydrologic integrity of the Jock River and its tributaries
List, share and when possible, synthesize and use existing hydrological and geochemical datasets and assessment outcomes to facilitate the characterization of subwatershed and catchment hydrological functions. In addition, prepare guidance on best practices for the preparation of water budget assessments to better understand the hydrologic cycle requirements that occur at site specific scales; and share existing catchment and subwatershed scale water budget assessment outcomes
Headwaters/Instream/Shorelines
Promote the Rideau Valley Shoreline Naturalization Program to landowners to increase existing 21 percent of natural shoreline cover
Educate landowners about the value of and best management practices used to maintain and enhance natural shorelines and headwater drainage features
Work with the City of Ottawa to consistently implement current land use planning and development policies for water quality and shoreline protection (i.e., adherence to a minimum 30 metre development setback from water) adjacent to the Jock River and other catchment streams
Target shoreline restoration at sites identified in this report (shown as “Other riparian land cover” in Figure 60 and “Potential Riparian/Instream Restoration” in Figures 47/48) and explore other restoration and enhancement opportunities along the Jock River and its tributaries
Remove the fish migration barrier along the Jock River at Hearts Desire and improve riparian and instream conditions upstream of the structure
Land Cover
Promote the City of Ottawa’s Green Acres Reforestation Program to landowners to increase existing 11 percent of woodland cover
Encourage the City of Ottawa to strengthen natural heritage and water resources policies in official plans and zoning by-laws where shoreline, wetland, woodland cover and watercourse setbacks are determined to be at or below critical ecological thresholds. Information for this purpose is provided in the RVCA’s subwatershed and catchment reports
Explore ways and means to more effectively implement conditions of land-use planning and development approvals to achieve net environmental gains
Re-consider the RVCA’s approach to wetland regulation where there is an identified hydrologic imperative to do so (i.e., significant loss of historic wetland cover (see Figure 59) and/or seasonal, critically low baseflows in the Jock River and/or areas of seasonal flooding)
Full Catchment Report
Jock River Subwatershed Report 2016
JOCK RIVER-FRANKTOWN CATCHMENT
The RVCA produces individual reports for 12 catchments in the Jock River subwatershed. Using data collected and analyzed by the RVCA through its watershed monitoring and land cover classification programs, surface water quality and in-stream conditions are reported for the Jock River along with a summary of environmental conditions for the surrounding countryside every six years.
This information is used to better understand the effects of human activity on our water resources, allows us to better track environmental change over time and helps focus watershed management actions where they are needed the most to help sustain the ecosystem services (cultural, aesthetic and recreational values; provisioning of food, fuel and clean water; regulation of erosion/natural hazard protection and water purification; supporting nutrient/water cycling and habitat provision) provided by the catchment’s lands and forests and waters (Millennium Ecosystem Assessment 2005).
The following sections of this report for the Jock River - Franktown catchment are a compilation of that work.
| Catchment Facts |
Section 1.0 |
| Riparian Conditions |
Section 2.0 |
| Land Cover |
Section 3.0 |
| Land Stewardship and Water Resources Protection |
Section 4.0 |
| Challenges/Issues |
Section 5.0 |
| Actions/Opportunities |
Section 6.0 |
For other Jock River catchments and the Jock River Subwatershed Report, please visit the RVCA website at www.rvca.ca

Figure 1 Land cover in the Jock River - Franktown catchment
1.0 Jock River-Franktown Catchment: Facts
1.1 General/Physical Geography
Municipalities
- Beckwith (70 km2; 89% of catchment)
- Montague (9 km2; 11% of catchment)
Geology/Physiography
- The Franktown Catchment resides with an extensive physiographic region known as the Smith Falls Limestone Plain. In this catchment, the limestone plain is generally overlain by organic soils. In this catchment, bedrock mostly consists of interbedded sandstone and dolostone of the March Formation and some dolostone of the Oxford Formation in the northern parts
Topography
- The ground surface ranges in elevation from greater than 145 masl east of Franktown Road to approximately 130 masl at the catchment’s outlet
Drainage Area
- 91 square kilometers; occupies 14 percent of the Jock River subwatershed, two percent of the Rideau Valley watershed
Stream Length
- Jock River and tributaries: 88 km
1.2 Vulnerable Areas
Aquifer Vulnerability
- The Mississippi-Rideau Source Protection initiative has mapped scattered parts of this catchment as significant groundwater recharge areas and all the catchment as Highly Vulnerable Aquifer. There are no Well Head Protection Areas in this catchment
Wetland Hydrology
- A watershed model developed by the RVCA in 2009 was used to study the hydrologic function of wetlands in the Rideau Valley Watershed, including those found in the Franktown catchment
1.3 Conditions at a Glance
Water Quality
- Instream biological water quality conditions at the Jock River Franktown sample location range from “Poor” to “Very Poor” from 2011 to 2015 (using a grading scheme developed by Ontario Conservation Authorities in Ontario for benthic invertebrates) with an overall benthic invertebrate water quality rating of “Poor” determined for this period
- Surface chemistry water quality rating is unknown for the Jock River in the Franktown catchment
Instream and Riparian
- Overall instream and riparian condition for the Franktown catchment is unknown
Thermal Regime
- Warm/cool water thermal guild supporting the Jock River fishery
Fish Community
- Ten species of recreational and bait fish
Shoreline Cover Type (30 m. riparian area; 2014)
- Wetland (81%)
- Woodland (6%)
- Crop and Pasture (6%)
- Transportation (4%)
- Settlement (1%)
- Aggregate (1%)
- Meadow-Thicket (<1%)
Land Cover Type (2014)
- Wetland (48%)
- Woodland (25%)
- Crop and Pasture (16%)
- Settlement (5%)
- Meadow-Thicket (3%)
- Transportation (2%)
- Aggregate (1%)
- Water (<1%)
Land Cover Change (2008 to 2014)
- Woodland (-12 ha)
- Crop and Pasture (-7 ha)
- Meadow-Thicket (-6 ha)
- Aggregate (-2 ha)
- Transportation (0 ha)
- Wetland (+2 ha)
- Water (+5 ha)
- Settlement (+20 ha)
Significant Natural Features
- Franktown Swamp Provincially Significant Wetland
- Goodwood Marsh Area of Natural and Scientific Interest
- Goodwood Marsh Provincially Significant Wetland
Water Wells
- Several hundred (~ 480) operational private water wells in the catchment. Groundwater uses are mainly domestic but also include livestock watering and public and commercial water supplies
Aggregates
- Part of one bedrock quarry license located within the catchment
Species at Risk (Elemental Occurrence)
- Loggerhead Shrike (Endangered)
- Blanding’s Turtle, Bobolink, Eastern Meadowlark, Gray Ratsnake (Threatened)
- Snapping Turtle (Special Concern)
1.4 Catchment Care
Stewardship
- Eleven stewardship projects undertaken (see Section 4)
Environmental Monitoring
- Benthic invertebrate (aquatic insect) surface (in-stream) water quality collection since 2011 (see Section 2.1.1)
- Fish survey along the Jock River (see Section 2.1.3)
- Ten headwater drainage feature assessments in 2015 at road crossings in the catchment. The protocol measures zero, first and second order headwater drainage features and is a rapid assessment method characterizing the amount of water, sediment transport, and storage capacity within headwater drainage features (see Section 2.2)
- Groundwater chemistry information is available from the Ontario Geological Survey for two wells located in this catchment
Environmental Management
- Development along the Jock River and in and adjacent to the Provincially Significant Wetlands in the catchment (Franktown Swamp, Goodwood Marsh) are subject to Ontario Regulation 174-06 (entitled “Development, Interference with Wetlands and Alterations to Shorelines and Watercourses”) that protects the hydrologic function of the wetland and also protects landowners and their property from natural hazards (flooding, fluctuating water table, unstable soils) associated with them
- One active Permit To Take Water (PTTW) in the catchment that was issued for construction dewatering
- Three Environmental Compliance Approvals and/or Environmental Activity and Sector Registrations in the catchment. These are for a municipal or private sewage work; a standby power system and air emissions
2. Surface Water Quality Conditions
Barbers Creek Water Quality
Water Quality Rating
Nutrients
Summary
E. Coli
Summary
Metals
Summary
[1] - copy this to the where the link to the footnote is in the text, then delete is line
[1] type footnote text here
[2] Lorem ipus
3.0 Jock River-Franktown Catchment: Riparian Conditions
3.1 Jock River Instream Aquatic Habitat
3.1.1 Benthic Invertebrates
Freshwater benthic invertebrates are animals without backbones that live on the stream bottom and include crustaceans such as crayfish, molluscs and immature forms of aquatic insects. Benthos represent an extremely diverse group of aquatic animals and exhibit wide ranges of responses to stressors such as organic pollutants, sediments and toxicants, which allows scientists to use them as bioindicators. As part of the Ontario Benthic Biomonitoring Network (OBBN), the RVCA has been collecting benthic invertebrates at the Highway 15 site on the Jock River since 2011. Monitoring data is analyzed for each sample site and the results are presented using the Family Biotic Index, Family Richness and percent Ephemeroptera, Plecoptera and Trichoptera.
Highway 15 sample location conditions in the Franktown catchment
Hilsenhoff Family Biotic Index
The Hilsenhoff Family Biotic Index (FBI) is an indicator of organic and nutrient pollution and provides an estimate of water quality conditions for each site using established pollution tolerance values for benthic invertebrates. Figure 11 displays the FBI results for the Jock River Franktown catchment sample location at Highway 15 for reporting period 2011 to 2015. “Poor” to “Very Poor” water quality conditions being observed at the Jock River Franktown sample location using a grading scheme developed by Conservation Authorities in Ontario for benthic invertebrates.
Figure 11 Hilsenhoff Family Biotic Index at the Jock River Highway 15 sample location
Family Richness
Family Richness measures the health of the community through its diversity and increases with increasing habitat diversity suitability and healthy water quality conditions. Family Richness is equivalent to the total number of benthic invertebrate families found within a sample. The Jock River Franktown site is reported to have “Fair” family richness (Figure 12).
Figure 12 Family Richness at the Jock River Highway 15 sample location
EPT
Ephemeroptera (Mayflies), Plecoptera (Stoneflies), and Trichoptera (Caddisflies) are species considered to be very sensitive to poor water quality conditions. High abundance of these organisms is generally an indication of good water quality conditions at a sample location. The species community structure at the Highway 15 site are highly and moderately tolerant to poor water quality conditions. As a result, the EPT indicates that the Jock River Franktown sample location is reported to have “Poor” aquatic habitat conditions (Figure 13) from 2011 to 2015.
Figure 13 EPT at the Jock River Highway 15 sample location
Conclusion
Overall the Jock River Franktown sample location aquatic habitat conditions from a benthic invertebrate perspective is considered “poor” from 2011 to 2015 as the samples are dominated by species that are moderately sensitive and sensitive to high organic pollution levels.Overall the Jock River Franktown catchment sample location aquatic habitat conditions from a benthic invertebrate perspective is considered “poor” from 2011 to 2015 as the samples are dominated by species that are moderately sensitive and sensitive to high organic pollution levels.
3.1.2 Thermal Regime
Many factors can influence fluctuations in stream temperature, including springs, tributaries, precipitation runoff, discharge pipes and stream shading from riparian vegetation. Water temperature is used along with the maximum air temperature (using the Stoneman and Jones method) to classify a watercourse as either warm water, cool water or cold water. Figure 14 shows where the thermal sampling sites were located along Jock River Franktown. Sample location identified as number one on the map was missing and could not be retrieved. Analysis of the data collected indicates that Jock River Franktown catchment is classified as a cool to warm water system with cool water reaches (Figure 15).
Figure 14 Temperature logger locations in the Jock River Franktown catchment
Figure 15 Temperature logger data for the Highway 15 site on the Jock River in the Franktown catchment.
Each point on the graph represents a temperature that meets the following criteria:
- Sampling dates between July 1st and September 7th
- Sampling date is preceded by two consecutive days above 24.5 °C, with no rain
- Water temperatures are collected at 4pm
- Air temperature is recorded as the max temperature for that day
3.1.3 Fish Community
The Jock River Franktown catchment is classified as a mixed community of warm and cool water recreational and baitfish fishery with 10 species observed. Figure 16 shows the sampling locations in the Hobbs Drain catchment.
Figure 16 Fish community observations in the Franktown catchment
The following table contains a list of species observed in the watershed.
Table 1 Fish species observed in the Jock River Franktown catchment
3.2 Headwater Drainage Feature Assessment
3.2.1 Headwater Sampling Locations
The RVCA Stream Characterization program assessed Headwater Drainage Features for the Jock River subwatershed in 2015. This protocol measures zero, first and second order headwater drainage features (HDF). It is a rapid assessment method characterizing the amount of water, sediment transport, and storage capacity within headwater drainage features (HDF). RVCA is working with other Conservation Authorities and the Ministry of Natural Resources and Forestry to implement the protocol with the goal of providing standard datasets to support science development and monitoring of headwater drainage features. An HDF is a depression in the land that conveys surface flow. Additionally, this module provides a means of characterizing the connectivity, form and unique features associated with each HDF (OSAP Protocol, 2013). In 2015 the program sampled 10 sites at road crossings in the Jock River Franktown catchment area (Figure 17).

Figure 17 Location of the headwater sampling site in the Jock River Franktown catchment
3.2.2 Headwater Feature Type
The headwater sampling protocol assesses the feature type in order to understand the function of each feature. The evaluation includes the following classifications: defined natural channel, channelized or constrained, multi-thread, no defined feature, tiled, wetland, swale, roadside ditch and pond outlet. By assessing the values associated with the headwater drainage features in the catchment area we can understand the ecosystem services that they provide to the watershed in the form of hydrology, sediment transport, and aquatic and terrestrial functions. The headwater drainage features in the Franktown catchment are primarily classified as wetland with one feature classified as natural and another one as a road side ditch. Figure 18 shows the feature type of the primary feature at the sampling locations.
Figure 18 Headwater feature types in the Jock River Franktown catchment
A spring photo of the headwater sample site in the Jock River Franktown catchment located on Beckwith 6th Line
A summer photo of the headwater sample site in the Jock River Franktown catchment located on Beckwith 6th Line
3.2.3 Headwater Feature Flow
The observed flow condition within headwater drainage features can be highly variable depending on timing relative to the spring freshet, recent rainfall, soil moisture, etc. Flow conditions are assessed in the spring and in the summer to determine if features are perennial and flow year round, if they are intermittent and dry up during the summer months or if they are ephemeral systems that do not flow regularly and generally respond to specific rainstorm events or snowmelt. Flow conditions in headwater systems can change from year to year depending on local precipitation patterns. Figure 19 shows the observed flow condition at the sampling locations in the Jock River Franktown catchment in 2015.
Figure 19 Headwater feature flow conditions in the Jock River Franktown catchment
3.2.4 Feature Channel Modifications
Channel modifications were assessed at each headwater drainage feature sampling location. Modifications include channelization, dredging, hardening and realignments. The Jock River Franktown catchment area had one site as having been dredged, while the remaining locations had no channel modifications observed. Figure 20 shows the channel modifications observed at the sampling locations for Jock River Franktown.
Figure 20 Headwater feature channel modifications in the Jock River Franktown catchment
3.2.5 Headwater Feature Vegetation
Headwater feature vegetation evaluates the type of vegetation that is found within the drainage feature. The type of vegetated within the channel influences the aquatic and terrestrial ecosystem values that the feature provides. For many types of headwater features the vegetation within the feature plays a very important role in flow and sediment movement and provides wildlife habitat. The following classifications are evaluated no vegetation, lawn, wetland, meadow, scrubland and forest. Figure 21 depicts the dominant vegetation observed at the sampled headwater sites in the Jock River Franktown catchment.
Figure 21 Headwater feature vegetation types in the Jock River Franktown catchment
3.2.6 Headwater Feature Riparian Vegetation
Headwater riparian vegetation evaluates the type of vegetation that is found along the adjacent lands of a headwater drainage feature. The type of vegetation within the riparian corridor influences the aquatic and terrestrial ecosystem values that the feature provides to the watershed. Figure 22 depicts the type of riparian vegetation observed at the sampled headwater sites in the Jock River Franktown catchment.
Figure 22 Headwater feature riparian vegetation types in the Jock River Franktown catchment
3.2.7 Headwater Feature Sediment Deposition
Assessing the amount of recent sediment deposited in a channel provides an index of the degree to which the feature could be transporting sediment to downstream reaches (OSAP, 2013). Evidence of excessive sediment deposition might indicate the requirement to follow up with more detailed targeted assessments upstream of the site location to identify potential best management practices to be implemented. Sediment deposition ranged from none to extensive for the headwater sites sampled in the Jock River Franktown catchment area. Figure 23 depicts the degree of sediment deposition observed at the sampled headwater sites in the Jock River Franktown catchment.
Figure 23 Headwater feature sediment deposition in the Jock River Franktown catchment
3.2.8 Headwater Feature Upstream Roughness
Feature roughness will provide a measure of the amount of materials within the bankfull channel that could slow down the velocity of water flowing within the headwater feature (OSAP, 2013). Materials on the channel bottom that provide roughness include vegetation, woody debris and boulders/cobble substrates. Roughness can provide benefits in mitigating downstream erosion on the headwater drainage feature and the receiving watercourse by reducing velocities. Roughness also provides important habitat conditions for aquatic organisms. Figure 24 shows the feature roughness conditions at the sampling locations in the Jock River Franktown catchment.
Figure 24 Headwater feature roughness in the Jock River Franktown catchment
4.0 Jock River-Franktown Catchment: Land Cover
Land cover and any change in coverage that has occurred over a six year period is summarized for the Franktown catchment using spatially continuous vector data representing the catchment during the spring of 2008 and 2014. This dataset was developed by the RVCA through heads-up digitization of 20cm DRAPE ortho-imagery at a 1:4000 scale and details the surrounding landscape using 10 land cover classes.
4.1 Franktown Catchment Change
As shown in Table 2, the dominant land cover type in 2014 was wetland followed by woodland and crop and pastureland.
Table 2 Land cover (2008 vs. 2014) in the Franktown catchment
* Does not include treed swamps ** Includes treed swamps
From 2008 to 2014, there was an overall change of 33 hectares (from one land cover class to another). Most of the change in the Franktown catchment is a result of the conversion of crop and pastureland, meadow-thicket and woodland to settlement along with former aggregate extraction sites becoming open waterbodies (Figure 25).
Figure 25 Dominant land cover change in the Franktown catchment (2014)
Table 3 provides a detailed breakdown of all land cover change that has taken place in the Franktown catchment between 2008 and 2014.
Table 3 Land cover change in the Franktown catchment (2008 to 2014)
4.2 Woodland Cover
In the Environment Canada Guideline (Third Edition) entitled “How Much Habitat Is Enough?” (hereafter referred to as the “Guideline”) the opening narrative under the Forest Habitat Guidelines section states that prior to European settlement, forest was the predominant habitat in the Mixedwood Plains ecozone. The remnants of this once vast forest now exist in a fragmented state in many areas (including the Rideau Valley watershed) with woodland patches of various sizes distributed across the settled landscape along with higher levels of forest cover associated with features such as the Frontenac Axis (within the on-Shield areas of the Rideau Lakes and Tay River subwatersheds). The forest legacy, in terms of the many types of wildlife species found, overall species richness, ecological functions provided and ecosystem complexity is still evident in the patches and regional forest matrices (found in the Jock River subwatershed and elsewhere in the Rideau Valley watershed). These ecological features are in addition to other influences which forests have on water quality and stream hydrology including reducing soil erosion, producing oxygen, storing carbon along with many other ecological services that are essential not only for wildlife but for human well-being.
The Guideline also notes that forests provide a great many habitat niches that are in turn occupied by a great diversity of plant and animal species. They provide food, water and shelter for these species - whether they are breeding and resident locally or using forest cover to help them move across the landscape. This diversity of species includes many that are considered to be species at risk. Furthermore, from a wildlife perspective, there is increasing evidence that the total forest cover in a given area is a major predictor of the persistence and size of bird populations, and it is possible or perhaps likely that this pattern extends to other flora and fauna groups. The overall effect of a decrease in forest cover on birds in fragmented landscapes is that certain species disappear and many of the remaining ones become rare, or fail to reproduce, while species adapted to more open and successional habitats, as well as those that are more tolerant to human-induced disturbances in general, are able to persist and in some cases thrive. Species with specialized-habitat requirements are most likely to be adversely affected. The overall pattern of distribution of forest cover, the shape, area and juxtaposition of remaining forest patches and the quality of forest cover also play major roles in determining how valuable forests will be to wildlife and people alike.
The current science generally supports minimum forest habitat requirements between 30 and 50 percent, with some limited evidence that the upper limit may be even higher, depending on the organism/species phenomenon under investigation or land-use/resource management planning regime being considered/used.
As shown in Figure 26, 29 percent of the Franktown catchment contains 1988 hectares of upland forest and 288 hectares of lowland forest (treed swamps) versus the 26 percent of woodland cover in the Jock River subwatershed. This is below the 30 percent of forest cover that is identified as the minimum threshold required to sustain forest birds according to the Guideline and which may only support less than one half of potential species richness and marginally healthy aquatic systems. When forest cover drops below 30 percent, forest birds tend to disappear as breeders across the landscape.
Figure 26 Woodland cover and forest interior (2014)
4.2.1 Woodland (Patch) Size
According to the Ministry of Natural Resources’ Natural Heritage Reference Manual (Second Edition), larger woodlands are more likely to contain a greater diversity of plant and animal species and communities than smaller woodlands and have a greater relative importance for mobile animal species such as forest birds.
Bigger forests often provide a different type of habitat. Many forest birds breed far more successfully in larger forests than they do in smaller woodlots and some rely heavily on forest interior conditions. Populations are often healthier in regions with more forest cover and where forest fragments are grouped closely together or connected by corridors of natural habitat. Small forests support small numbers of wildlife. Some species are “area-sensitive” and tend not to inhabit small woodlands, regardless of forest interior conditions. Fragmented habitat also isolates local populations, especially small mammals, amphibians and reptiles with limited mobility. This reduces the healthy mixing of genetic traits that helps populations survive over the long run (Conserving the Forest Interior. Ontario Extension Notes, 2000).
The Environment Canada Guideline also notes that for forest plants that do not disperse broadly or quickly, preservation of some relatively undisturbed large forest patches is needed to sustain them because of their restricted dispersal abilities and specialized habitat requirements and to ensure continued seed or propagation sources for restored or regenerating areas nearby.
The Natural Heritage Reference Manual continues by stating that a larger size also allows woodlands to support more resilient nutrient cycles and food webs and to be big enough to permit different and important successional stages to co-exist. Small, isolated woodlands are more susceptible to the effects of blowdown, drought, disease, insect infestations, and invasions by predators and non-indigenous plants. It is also known that the viability of woodland wildlife depends not only on the characteristics of the woodland in which they reside, but also on the characteristics of the surrounding landscape where the woodland is situated. Additionally, the percentage of forest cover in the surrounding landscape, the presence of ecological barriers such as roads, the ability of various species to cross the matrix surrounding the woodland and the proximity of adjacent habitats interact with woodland size in influencing the species assemblage within a woodland.
In the Franktown catchment (in 2014), one hundred and seventeen (44 percent) of the 268 woodland patches are very small, being less than one hectare in size. Another 123 (46 percent) of the woodland patches ranging from one to less than 20 hectares in size tend to be dominated by edge-tolerant bird species. The remaining 28 (10 percent of) woodland patches range between 20 and 271 hectares in size. Twenty-three of these patches contain woodland between 20 and 100 hectares and may support a few area-sensitive species and some edge intolerant species, but will be dominated by edge tolerant species.
Conversely, five (two percent) of the 268 woodland patches in the drainage area exceed the 100 plus hectare size needed to support most forest dependent, area sensitive birds and are large enough to support approximately 60 percent of edge-intolerant species. One patch tops 200 hectares, which according to the Environment Canada Guideline will support 80 percent of edge-intolerant forest bird species (including most area sensitive species) that prefer interior forest habitat conditions.
Table 4 presents a comparison of woodland patch size in 2008 and 2014 along with any changes that have occurred over that time. A decrease (of 12 ha) has been observed in the overall woodland patch area between the two reporting periods with most change occurring in the 20 to 50 hectare woodland patch size class range.
Table 4 Woodland patches in the Franktown catchment (2008 and 2014)
*Includes treed swamps
4.2.2 Woodland (Forest) Interior Habitat
The forest interior is habitat deep within woodlands. It is a sheltered, secluded environment away from the influence of forest edges and open habitats. Some people call it the “core” or the “heart” of a woodland. The presence of forest interior is a good sign of woodland health, and is directly related to the woodland’s size and shape. Large woodlands with round or square outlines have the greatest amount of forest interior. Small, narrow woodlands may have no forest interior conditions at all. Forest interior habitat is a remnant natural environment, reminiscent of the extensive, continuous forests of the past. This increasingly rare forest habitat is now a refuge for certain forest-dependent wildlife; they simply must have it to survive and thrive in a fragmented forest landscape (Conserving the Forest Interior. Ontario Extension Notes, 2000).
The Natural Heritage Reference Manual states that woodland interior habitat is usually defined as habitat more than 100 metres from the edge of the woodland and provides for relative seclusion from outside influences along with a moister, more sheltered and productive forest habitat for certain area sensitive species. Woodlands with interior habitat have centres that are more clearly buffered against the edge effects of agricultural activities or more harmful urban activities than those without.
In the Franktown catchment (in 2014), the 268 woodland patches contain 78 forest interior patches (Figure 26) that occupy three percent (228 ha.) of the catchment land area (which is equivalent to the three percent of interior forest in the Jock River Subwatershed). This is below the ten percent figure referred to in the Environment Canada Guideline that is considered to be the minimum threshold for supporting edge intolerant bird species and other forest dwelling species in the landscape.
Most patches (71) have less than 10 hectares of interior forest, 49 of which have small areas of interior forest habitat less than one hectare in size. The remaining seven patches contain interior forest between 11 and 32 hectares in area. Between 2008 and 2014, there has been a large change in the number of woodland patches containing smaller areas (below 10 hectares) of interior habitat with an overall loss of two hectares in the catchment (Table 5), suggesting an increase in forest fragmentation over the six year period.
Table 5 Woodland interior in the Franktown catchment (2008 and 2014)
4.3 Wetland Cover
Wetlands are habitats forming the interface between aquatic and terrestrial systems. They are among the most productive and biologically diverse habitats on the planet. By the 1980s, according to the Natural Heritage Reference Manual, 68 percent of the original wetlands south of the Precambrian Shield in Ontario had been lost through encroachment, land clearance, drainage and filling.
Wetlands perform a number of important ecological and hydrological functions and provide an array of social and economic benefits that society values. Maintaining wetland cover in a watershed provides many ecological, economic, hydrological and social benefits that are listed in the Reference Manual and which may include:
- contributing to the stabilization of shorelines and to the reduction of erosion damage through the mitigation of water flow and soil binding by plant roots
- mitigating surface water flow by storing water during periods of peak flow (such as spring snowmelt and heavy rainfall events) and releasing water during periods of low flow (this mitigation of water flow also contributes to a reduction of flood damage)
- contributing to an improved water quality through the trapping of sediments, the removal and/or retention of excess nutrients, the immobilization and/or degradation of contaminants and the removal of bacteria
- providing renewable harvesting of timber, fuel wood, fish, wildlife and wild rice
- contributing to a stable, long-term water supply in areas of groundwater recharge and discharge
- providing a high diversity of habitats that support a wide variety of plants and animals
- acting as “carbon sinks” making a significant contribution to carbon storage
- providing opportunities for recreation, education, research and tourism
Historically, the overall wetland coverage within the Great Lakes basin exceeded 10 percent, but there was significant variability among watersheds and jurisdictions, as stated in the Environment Canada Guideline. In the Rideau Valley Watershed, it has been estimated that pre-settlement wetland cover averaged 35 percent using information provided by Ducks Unlimited Canada (2010) versus the 21 percent of wetland cover existing in 2014 derived from DRAPE imagery analysis.
Using the same dataset, it is estimated that pre-settlement (historic) wetland cover averaged 51 percent in the Jock River subwatershed versus the 24 percent of cover existing in 2014 (as summarized in Table 6).
Table 6 Wetland cover in the Jock River subwatershed and Franktown catchment (Historic to 2014)
This decline in wetland cover is also evident in the Franktown catchment (as seen in Figure 27) where wetland was reported to cover 59 percent of the area prior to settlement, as compared to 48 percent in 2014. This represents a 19 percent loss of historic wetland cover. To maintain critical hydrological, ecological functions along with related recreational and economic benefits provided by these wetland habitats in the catchment, a “no net loss” of currently existing wetlands should be employed to ensure the continued provision of tangible benefits accruing from them to landowners and surrounding communities.
Figure 27 Franktown catchment wetland cover
4.4 Shoreline Cover
The riparian or shoreline zone is that special area where the land meets the water. Well-vegetated shorelines are critically important in protecting water quality and creating healthy aquatic habitats, lakes and rivers. Natural shorelines intercept sediments and contaminants that could impact water quality conditions and harm fish habitat in streams. Well established buffers protect the banks against erosion, improve habitat for fish by shading and cooling the water and provide protection for birds and other wildlife that feed and rear young near water. A recommended target (from the Environment Canada Guideline) is to maintain a minimum 30 metre wide vegetated buffer along at least 75 percent of the length of both sides of rivers, creeks and streams.
Figure 28 shows the extent of the ‘Natural’ vegetated riparian zone (predominantly wetland/woodland features) and ‘Other’ anthropogenic cover (crop/pastureland, roads/railways, settlements) along a 30-metre-wide area of land, both sides of the shoreline of the Jock River and its tributaries in the Franktown catchment.
Figure 28 Natural and other riparian land cover in the Franktown catchment
This analysis shows that the riparian zone in the Franktown catchment in 2014 was comprised of wetland (81 percent), woodland (six percent), crop and pastureland (six percent), transportation (four percent), settlement (one percent), aggregate (one percent) and meadow-thicket (less than one percent). Additional statistics for the Franktown catchment are presented in Table 7 and show that there has been no change in shoreline cover from 2008 to 2014.
Table 7 Riparian land cover (2008 vs. 2014) in the Franktown Creek catchment
5.0 Jock River-Franktown Catchment: Stewardship and Water Resources Protection
The RVCA and its partners are working to protect and enhance environmental conditions in the Jock River Subwatershed. Figure 29 shows the location of all stewardship projects completed in the Jock River-Franktown catchment along with sites identified for potential shoreline restoration.
5.1 Rural Clean Water Projects
From 2010 to 2015, one septic system repair was completed. Between 2004 and 2009, one well upgrade and one livestock fencing project were finished and prior to 2004, one well upgrade and one fuel storage and handling facility were completed. One of these projects was completed within the 30 metre riparian zone of the Jock River. Total value of all five projects is $9,234 with $6,071 of that amount funded through grant dollars from the RVCA.
Figure 29 Stewardship site locations
5.2 Private Land Forestry Projects
The location of RVCA tree planting projects is shown in Figure 29. From 2010 to 2015, 2,000 trees were planted at one site. Between 2004 and 2009, 2,200 trees were planted at two sites and prior to 2004, 64,710 trees were planted at 3 sites. In total, 68,910 trees were planted resulting in the reforestation of 34 hectares. Total project value of all six projects is $171,765 with $40,033 of that amount coming from fundraising sources.
5.3 Valley, Stream, Wetland and Hazard Lands
The Franktown catchment covers 79 square kilometres with 30.9 square kilometres (or 39 percent) of the drainage area being within the regulation limit of Ontario Regulation 174/06 (Figure 30), giving protection to wetland areas and river or stream valleys that are affected by flooding and erosion hazards.
Wetlands occupy 38 sq. km. (or 48 percent) of the catchment. Of these wetlands, 22.5 sq. km (or 59 percent) are designated as provincially significant and included within the RVCA regulation limit. This leaves the remaining 15.5 sq. km (or 41 percent) of wetlands in the catchment outside the regulated area limit.
Of the 88 kilometres of stream in the catchment, regulation limit mapping has been plotted along 50.2 kilometers of streams (representing 57 percent of all streams in the catchment). Some of these regulated watercourses (42.2 km or 48 percent of all streams) flow through regulated wetlands; the remaining 7.9 km (or 16 percent) of regulated streams are located outside of those wetlands. Plotting of the regulation limit on the remaining 37.8 km (or 43 percent) of streams requires identification of flood and erosion hazards and valley systems.
Within those areas of the Franktown catchment subject to the regulation (limit), efforts (have been made and) continue through RVCA planning and regulations input and review to manage the impact of development (and other land management practices) in areas where “natural hazards” are associated with rivers, streams, valley lands and wetlands. For areas beyond the regulation limit, protection of the catchment’s watercourses is only provided through the “alteration to waterways” provision of the regulation.
Figure 30 RVCA regulation limits
5.4 Vulnerable Drinking Water Areas
The Jock River-Franktown drainage catchment is considered to have a Highly Vulnerable Aquifer. This means that the nature of the overburden (thin soils, fractured bedrock) does not provide a high level of protection for the underlying groundwater making the aquifer more vulnerable to contaminants released on the surface. The Mississippi-Rideau Source Protection Plan includes policies that focus on the protection of groundwater region-wide due to the fact that most of the region, which encompasses the Mississippi and Rideau watersheds, is considered Highly Vulnerable Aquifer.
For detailed maps and policies that have been developed to protect drinking water sources, please go to the Mississippi-Rideau Source Protection Region website at www.mrsourcewater.ca to view the Mississippi-Rideau Source Protection Plan.
6.0 Jock River-Franktown Catchment: Challenges/Issues
Water Quality/Quantity
No surface chemistry and benthic invertebrate water quality data is available for the Jock River in the catchment
Natural hazard lands have not been identified; however, it is deemed to be a low priority
Existing hydrological and geochemical datasets and assessments (academic, RVCA, others) are only recently available and/or are not being considered in the characterization of the numerous hydrologic functions of the Jock River subwatershed. Further, there is a dearth of hydrologic information (hydroperiod, groundwater/surface water interactions, geochemistry) about the wetlands that remain in the Jock River subwatershed
Headwaters/Instream/Shorelines
No information available about instream aquatic and riparian conditions along the Jock River in the catchment
Land Cover
Woodlands cover 29 percent of the catchment and is less than the 30 percent of forest cover that is identified as the minimum threshold for sustaining forest birds and other woodland dependent species (Figure 26)
Pre-settlement wetlands have declined by 19 percent and now cover 48 percent (3798 ha.) of the catchment (Figure 27). Forty-one percent (1556 ha.) of these wetlands remain unevaluated/unregulated and are vulnerable to drainage and land clearing activities in the absence of any regulatory and planning controls that would otherwise protect them for the many important hydrological, social, biological and ecological functions/services/values they provide to landowners and the surrounding community
7.0 Jock River-Franktown Catchment: Opportunities/Actions
Water Quality/Quantity
Landowners should consider taking advantage of the Rural Clean Water Programs which offer grants to landowners interested in implementing projects on their property that will help to protect and improve water quality:
- Homeowners may be interested in projects to repair, replace or upgrade their well or septic system, or addressing erosion through buffer plantings and erosion control
- Farmers can take advantage of a wide range of projects, including livestock fencing, manure storage, tile drainage control structures, cover crops, and many more
List, share and when possible, synthesize and use existing hydrological and geochemical datasets and assessment outcomes to facilitate the characterization of subwatershed and catchment hydrological functions. In addition, prepare guidance on best practices for the preparation of water budget assessments to better understand the hydrologic cycle requirements that occur at site specific scales; and share existing catchment and subwatershed scale water budget assessment outcomes
Headwaters/Instream/Shorelines
Promote the Rideau Valley Shoreline Naturalization Program to landowners to increase existing shoreline cover
Educate landowners about the value of and best management practices used to maintain and enhance natural shorelines and headwater drainage features
Work with approval authorities (Townships of Beckwith and Montague) to consistently implement current land use planning and development policies for water quality and shoreline protection (i.e., adherence to a minimum 30 metre development setback from water) adjacent to the Jock River and other catchment streams
Land Cover
Promote the RVCA’s Trees for Tomorrow Program to landowners to increase existing 29 percent of woodland cover
Encourage the Townships of Beckwith and Montague to strengthen natural heritage policies in official plans and zoning by-laws where shoreline, wetland, woodland cover and watercourse setbacks are determined to be at or below critical ecological thresholds. Information for this purpose is provided in the RVCA’s subwatershed and catchment reports
Explore ways and means to more effectively enforce and implement conditions of land-use planning and development approvals to achieve net environmental gains
Re-consider the RVCA’s approach to wetland regulation where there is an identified hydrologic imperative to do so (i.e., significant loss of historic wetland cover (see Figure 27) and/or seasonal, critically low baseflows in the Jock River and/or areas of seasonal flooding)
Full Catchment Report
Jock River Subwatershed Report 2016
LEAMY CREEK CATCHMENT
The RVCA produces individual reports for 12 catchments in the Jock River subwatershed. Using data collected and analyzed by the RVCA through its watershed monitoring and land cover classification programs, surface water quality and in-stream conditions are reported for the Jock River along with a summary of environmental conditions for the surrounding countryside every six years.
This information is used to better understand the effects of human activity on our water resources, allows us to better track environmental change over time and helps focus watershed management actions where they are needed the most to help sustain the ecosystem services (cultural, aesthetic and recreational values; provisioning of food, fuel and clean water; regulation of erosion/natural hazard protection and water purification; supporting nutrient/water cycling and habitat provision) provided by the catchment’s lands and forests and waters (Millennium Ecosystem Assessment 2005).
The following sections of this report for the Leamy Creek catchment are a compilation of that work.
| Catchment Facts |
Section 1.0 |
| Surface Water Quality Conditions |
Section 2.0 |
| Riparian Conditions |
Section 3.0 |
| Land Cover |
Section 4.0 |
| Land Stewardship and Water Resources Protection |
Section 5.0 |
| Challenges/Issues |
Section 6.0 |
| Actions/Opportunities |
Section 7.0 |
For other Jock River catchments and the Jock River Subwatershed Report, please visit the RVCA website at www.rvca.ca

Figure 1 Land cover in the Leamy Creek catchment
1.0 Jock River-Leamy Creek Catchment: Facts
1.1 General/Physical Geography
Municipalities
- Ottawa: (20 km2; 100% of catchment)
Geology/Physiography
- The Leamy Catchment resides within an extensive physiographic region known as the Ottawa Valley Clay Plain, which, in this catchment, can be greater than 15 metres deep. This sediment was deposited in the Champlain Sea after the last glaciation. In this catchment, the Kars Esker, a regional sand and gravel feature, lies along the eastern catchment boundary
- In this catchment, the clay plain and esker are underlain mostly by dolostone from the Oxford Formation
Topography
- The ground surface ranges in elevation from approximately 120 masl near Moodie Drive and Fallowfield Road to approximately 91 masl at the catchment’s outlet
Drainage Area
- 20 square kilometers; occupies four percent of the Jock River subwatershed, less than one percent of the Rideau Valley watershed
Stream Length
- Jock River and tributaries: 32 km
1.2 Vulnerable Areas
Flood/Erosion Hazard
- Jock River is subject to a flooding hazard during the regional storm flood (the 100 year flood). Surveys and studies undertaken in accordance with provincial standards have determined that the 100 year flood elevation in the catchment ranges from 93.6 metres above mean sea level at the upper, mapped extent of the regulation limit at Eagleson Road to 92.7 metres above mean sea level at Moodie Drive
Aquifer Vulnerability
- The Mississippi-Rideau Source Protection initiative has mapped the northern boundary of this catchment as a significant groundwater recharge area. There is little Highly Vulnerable Aquifer and there are no Well Head Protection Areas in the catchment
Wetland Hydrology
- A watershed model developed by the RVCA in 2009 was used to study the hydrologic function of wetlands in the Rideau Valley Watershed, including those found in the Leamy Creek catchment
1.3 Conditions at a Glance
Water Quality
- Surface chemistry water quality rating on the Jock River in the Leamy Creek catchment is “Fair” over two reporting periods (2004-2009 and 2010-2015), as determined by surface water chemistry data. Frequent high nutrient concentrations and occasional metal exceedances largely contributed to the rating
- Instream biological water quality conditions in Leamy Creek and the Jock River within the catchment are unknown
Instream and Riparian
- Overall instream and riparian condition for the Jock River-Leamy Creek catchment as assessed by the stream characterization and headwater drainage feature assessment programs show that the Jock River and its tributaries are in generally “Fair” condition. The majority of the system has low erosion levels and a moderately healthy riparian corridor along the Jock River. Instream diversity of aquatic habitat is fairly uniform in the Jock River
Thermal Regime
- Warm/cool water thermal guild supporting the Jock River/Rideau River fishery
Fish Community
- Thirty-six species of recreational and bait fish
Shoreline Cover Type (30 m. riparian area; 2014)
- Crop and Pasture (62%)
- Woodland (16%)
- Transportation (9%)
- Meadow-Thicket (7%)
- Settlement (4%)
- Aggregate (2%)
Land Cover Type (2014)
- Crop and Pasture (68%)
- Woodland (8%)
- Aggregate (8%)
- Settlement (6%)
- Water (5%)
- Transportation (3%)
- Meadow-Thicket (2%)
Land Cover Change (2008 to 2014)
- Woodland (-19 ha)
- Meadow-Thicket (-7 ha)
- Aggregate (0 ha)
- Transportation (0 ha)
- Settlement (+5 ha)
- Water (+6 ha)
- Crop and Pasture (+15 ha)
Significant Natural Features
Water Wells
- One hundred (approximately) operational private water wells in the Leamy Creek Catchment. Groundwater uses are mainly domestic, but also include groundwater monitoring and testing, livestock watering and crop irrigation, and commercial and industrial uses
Aggregates
- Six sand and gravel pit licenses located within the catchment. Sand and gravel resources are mainly of secondary importance
Species at Risk (Elemental Occurrence)
- Henslow's Sparrow (Endangered)
- Bobolink, Eastern Meadowlark (Threatened)
- Snapping Turtle (Special Concern)
1.4 Catchment Care
Stewardship
- Seventeen stewardship projects undertaken (see Section 5)
Environmental Monitoring
- Chemical surface (in-stream) water quality collection since 2003 (see Section 2)
- Fish survey along the Jock River (see Section 3.3.9)
- Stream characterization survey on the Jock River in 2015, working upstream to the headwaters from its mouth where it empties into the Rideau River, taking measurements and recording observations on instream habitat, bank stability, other attributes and preparing a temperature profile (see Section 3)
- One headwater drainage feature assessment in 2015 at a road crossing in the catchment. The protocol measures zero, first and second order headwater drainage features and is a rapid assessment method characterizing the amount of water, sediment transport, and storage capacity within headwater drainage features (see Section 3.4)
- Groundwater level and chemistry data is available from a PGMN well located near the Twin Elm Bridge (W156). Additional groundwater chemistry information is available from the Ontario Geological Survey for a well located in this catchment
Environmental Management
- Development along Leamy Creek and the Jock River in the catchment is subject to Ontario Regulation 174-06 (entitled “Development, Interference with Wetlands and Alterations to Shorelines and Watercourses”) that protects landowners and their property from natural hazards (flooding, fluctuating water table, unstable slopes/soils)
- Seven active Permits To Take Water (PTTW) issued for ongoing municipal remediation purposes and aggregate washing
- Two Environmental Compliance Approvals in the catchment for a municipal or private sewage work and an industrial sewage work
2.0 Jock River-Leamy Creek Catchment: Surface Water Quality Conditions
Surface water quality conditions in the Leamy Creek catchment of the Jock River are monitored by the City of Ottawa Baseline Water Quality Monitoring Program. This program provides information on the condition of Ottawa’s surface water resources; data is collected for multiple parameters including nutrients (total phosphorus, total Kjeldahl nitrogen and ammonia), E. coli, metals (like aluminum and copper) and additional chemical/physical parameters (such as alkalinity, chlorides, pH and total suspended solids). The locations of monitoring sites are shown in Figure 2 and Table 1.
Figure 2 Water quality monitoring site in the Leamy Creek catchment
2.1 Jock River Water Quality Rating
The RVCA's water quality rating for Jock River site JR-05 is “Fair” (Table 1) as determined by the Canadian Council of Ministers of the Environment (CCME) Water Quality Index[1]. A “Fair” rating indicates that water quality is usually protected but is occasionally threatened or impaired; conditions sometimes depart from natural or desirable levels. Each parameter is evaluated against established guidelines to determine water quality conditions. Those parameters that frequently exceed guidelines are presented below. Analysis of the data has been broken into two periods; 2004 to 2009 and 2010 to 2015 to examine if conditions have changed between these periods. Table 1 shows the overall rating for the monitored surface water quality site within the Leamy Creek catchment and Table 2 outlines the Water Quality Index (WQI) scores and their corresponding ratings.
There is one monitored water quality site on the Jock River in the Leamy Creek catchment (JR-05, Figure 2). The water quality score at this site had only a minor decline in the water quality score when compared between periods; reporting as “Fair” in each time frame (Table 1). The score at this site is largely influenced by frequent high nutrient concentrations and occasional metal exceedances. For more information on the CCME WQI, please see the Jock River Subwatershed Report.
Table 1 Water Quality Index ratings for the Leamy Creek Catchment
Table 2 Water Quality Index ratings and corresponding index scores (RVCA terminology, original WQI category names in brackets)
2.2 Nutrients
Total phosphorus (TP) is used as a primary indicator of excessive nutrient loading and may contribute to abundant aquatic vegetation growth and depleted dissolved oxygen levels. The Provincial Water Quality Objective (PWQO) is used as the TP Guideline and states that in streams concentrations greater than 0.030 mg/l indicate an excessive amount of TP.
Total Kjeldahl nitrogen (TKN) and ammonia (NH3) are used as secondary indicators of nutrient loading. RVCA uses a guideline of 0.500 mg/l to assess TKN[2] and the PWQO of 0.020 mg/l to assess NH3 concentrations in the Jock River.
Tables 3, 4 and 5 summarize average nutrient concentrations at the monitored site within the Leamy Creek catchment and show the proportion of results that meet the guidelines.
Table 3 Summary of total phosphorus results for the Leamy Creek catchment, 2004-2009 and 2010-2015. Highlighted values indicate average concentrations exceed the guideline
Table 4 Summary of total Kjeldahl nitrogen results for the Leamy Creek catchment from 2004-2009 and 2010-2015. Highlighted values indicate average concentrations exceed the guideline
Table 5 Summary of ammonia results for Leamy Creek catchment from 2004-2009 and 2010-2015. Highlighted values indicate average concentrations exceed the guideline
Monitoring Site JR-05
Site JR-05 had elevated TP concentrations in both monitoring periods and remained consistent between the two time frames, 2004-2009 and 2010-2015 (Figures 3 and 4). In both time periods only 32 percent of samples were below the guideline and average TP concentrations exceeded the PWQO at 0.042 mg/l (Table 3).
Total Kjeldahl nitrogen concentrations were consistently high with only a few samples below the guideline of 0.500 mg/l. The proportion of samples below the guideline dropped from 10 percent in the 2004-2009 monitoring period to zero samples in the 2010-2015 period (Figures 5 and 6), the average concentrations increased from 0.759 mg/l to 0.796 mg/l during this timeframe (Table 4).
Ammonia results also showed evidence of increased concentrations at site JR-05. The proportion of samples below the guideline dropped from 50 percent to only 13 percent between the two monitoring periods 2004-2009 and 2010-2015, (Figures 7 and 8). This also mirrors a slight increase in the NH3 concentration from 0.038 mg/l to 0.044 mg/l (Table 5).
Figure 3 Total phosphorus concentration in the Jock River, 2004-2009
Figure 4 Total phosphorus concentration in the Jock River, 2010-2015
Figure 5 Total Kjeldahl nitrogen concentrations in the Jock River, 2004-2009
Figure 6 Total Kjeldahl nitrogen concentration in the Jock River, 2010-2015
Figure 7 Ammonia concentration in the Jock River, 2004-2009
Figure 8 Ammonia concentration in the Jock River, 2010-2015
Summary
Nutrient enrichment is a feature in this reach of the Jock River. Overall, average nutrient concentrations have remained consistent through the monitoring periods. All parameters (total phosphorus, total Kjeldahl nitrogen and ammonia) are above guidelines. Elevated nutrients may result in nutrient loading downstream and to the Rideau River. High nutrient concentrations can help stimulate the growth of algae blooms and other aquatic vegetation in a waterbody and deplete oxygen levels as the vegetation dies off. Best management practices such as enhanced shoreline buffers, limiting the use of fertilizers and restricting livestock access in upstream agricultural areas can help to reduce nutrient enrichment in Jock River.
2.3 Escherichia coli
Escherichia coli (E. coli) is used as an indicator of bacterial pollution from human or animal waste; in elevated concentrations it can pose a risk to human health. The PWQO of 100 colony forming units/100 millilitres (CFU/100 ml) is used. E. coli counts greater than this guideline indicate that bacterial contamination may be a problem within a waterbody.
Table 6 summarizes the geometric mean[3] for the monitored site on the Jock River within the Leamy Creek catchment and shows the proportion of samples that meet the E. coli guideline of 100 CFU/100 ml. The results of the geometric mean with respect to the guideline for the two periods, 2004-2009 and 2010-2015, are shown in Figures 9 and 10 respectively.
Table 6 Summary of
E. coli results for the Jock River, 2004-2009 and 2010-2015
Monitoring Site JR-05
E. coli counts at site JR-05 are comparable to downstream sites (JR-01 and JR-02) in the Jock River-Barrhaven catchment. The majority of samples were below the PWQO guideline and only increased slightly in the monitoring period from 74 percent (2004-2009, Figure 9) to 79 percent (2010-2015, Figure 10). Though more samples were below the PWQO there was a small increase in the count at the geometric mean (Table 6) from 43 CFU/100 ml (2004-2009) to 47 CFU/100 ml (2010-2015).
Figure 9 Figure 8 Geometric mean of E. coli results in the Jock River, 2004-2009
Figure 10 Figure 9 Geometric mean of E. coli results in the Jock River, 2010-2015
Summary
Bacterial contamination does not appear to be a significant concern in this reach of the Jock River, this is comparable to findings by the City of Ottawa’s Water Environment Protection Program (2006). There are occasional exceedances and counts at the geometric mean were below the guideline of 100 CFU/100ml. Best management practices such as enhancing shoreline buffers and restricting livestock access, and improved storm water management can help to protect this reach of the Jock River into the future.
2.4 Metals
Of the metals routinely monitored in the Jock River (Leamy Creek Catchment) aluminum (Al) and copper (Cu) occasionally reported concentrations above their respective PWQOs. For Al, the PWQO is 0.075 mg/l and for Cu it is 0.005 mg/l. In elevated concentrations, these metals can have toxic effects on sensitive aquatic species.
Tables 7 and 8 summarize metal concentrations at site JR-05 as well as show the proportion of samples that meet guidelines. Figures 11 to 14 show metal concentrations with respect to the guidelines for the two periods of interest, 2003–2008 and 2009–2014.
Table 7 Summary of aluminum results in the Jock River from 2004-2009 and 2010-2015. Highlighted values indicate average concentrations exceed the guideline
Table 8 Summary of copper results for the Jock River from 2004-2009 and 2010-2015
Monitoring Site JR-05
The average Al concentrations at site JR-05 exceeded the guideline. The majority of samples (68 percent) were below the guideline (Figure 11) from 2004-2009, this declined marginally to 62 percent (Figure 12) of results reporting below the guideline from 2010-2015. The average concentration increased from 0.085 mg/l to 0.105 mg/l (Table 7). It should be noted that a few but very high results are influencing the data set at this site.
Copper concentrations occasionally exceeded the PWQO, with 77 percent of samples below the guideline in 2004-2009 (Figure 13), this improved to 81 percent of samples below the guideline in 2010-2015 (Figure 14). The average concentration of copper also decreased slightly during the two reporting periods from 0.0032 mg/l to 0.0028 mg/l (Table 8).
Figure 11 Average aluminum concentrations in the Jock River, 2004-2009
Figure 12 Average aluminum concentrations in the Jock River, 2010-2015
Figure 13 Average copper concentrations in the Jock River, 2004-2009
Figure 14 Average copper concentrations in the Jock River, 2010-2015
Summary
In the Leamy Creek catchment aluminum concentrations have increased at site JR-05 while copper concentrations have remained consistent with slight improvements. Most increases in concentrations are observed during the spring likely due to increased runoff from melt conditions, efforts should continue to be made to identify pollution sources and implement best management practices to reduce any inputs such as storm water runoff, metal alloys, fungicides and pesticides to improve overall stream health and lessen downstream impacts.
1 The City of Ottawa Baseline Water Quality Monitoring Program has also applied the CCME WQI to monitored sites. The parameters used and time periods differs between the RVCA and City of Ottawa’s application of the WQI, resulting in different ratings at some sites.
2 No Ontario guideline for TKN is presently available; however, waters not influenced by excessive organic inputs typically range from 0.100 to 0.500 mg/l, Environment Canada (1979) Water Quality Sourcebook, A Guide to Water Quality Parameters, Inland Waters Directorate, Water Quality Branch, Ottawa, Canada
3A type of mean or average, which indicates the central tendency or typical value of a set of numbers by using the product of their values (as opposed to the arithmetic mean which uses their sum). It is often used to summarize a variable that varies over several orders of magnitude, such as E. coli counts
3.0 Jock River-Leamy Creek Catchment Riparian Conditions
3.1 Jock River Overbank Zone
3.1.1 Riparian Buffer Width Evaluation
Figure 15 demonstrates the buffer conditions of the left and right banks separately. The Jock River in the Leamy Creek catchment had a buffer of greater than 30 meters along 54 percent of the right bank and 76 percent of the left bank. A 15 meter or less buffer was present along 36 percent of the right bank and 18 percent of the left bank.
Figure 15 Riparian Buffer Evaluation along the Jock River in the Leamy Creek catchment
3.1.2 Riparian Buffer Alterations
Alterations within the riparian buffer were assessed within three distinct shoreline zones (0-5m, 5-15m, 15-30m), and evaluated based on the dominant vegetative community and/or land cover type (Figure 16). The riparian buffer zone along the Jock River within the Leamy Creek catchment was found to have highly variable conditions along the riparian corridor. These alterations were generally associated with infrastructure in the form of roads and agricultural land use.
Figure 16 Riparian buffer alterations within the Jock River Leamy Creek catchment
3.1.3 Adjacent Land Use
The RVCA’s Stream Characterization Program identifies eight different land uses beside the Jock River in the Leamy Creek catchment (Figure XX). Surrounding land use is considered from the beginning to end of the survey section (100m) and up to 100m on each side of the river. Land use outside of this area is not considered for the surveys but is nonetheless part of the subwatershed and will influence the creek. Natural areas made up 59 percent of the stream, characterized by forest, scrubland, meadow and wetland. Forest habitat was dominant in the adjacent lands along the Jock River in the Leamy Creek catchment at 31 percent. The remaining land use consisted of active agriculture, pasture, residential and infrastructure in the form of roads and road crossings.
Figure 17 Land Use along the Jock River in the Leamy Creek catchment
3.2 Jock River Shoreline Zone
3.2.1 Instream Erosion
Stream erosion is the process by which water erodes and transports sediments, resulting in dynamic flows and diverse habitat conditions. Excessive erosion can result in drastic environmental changes, as habitat conditions, water quality and aquatic life are all negatively affected. Bank stability was assessed as the overall extent of each section with “unstable” shoreline conditions. These conditions are defined by the presence of significant exposed soils/roots, minimal bank vegetation, severe undercutting, slumping or scour and potential failed erosion measures. Figure 18 shows low levels of erosion along the Jock River in the Leamy Creek catchment.
Figure 18 Erosion along the Jock River in the Leamy Creek catchment
3.2.2 Undercut Stream Banks
Stream bank undercuts can provide excellent cover habitat for aquatic life, however excessive levels can be an indication of unstable shoreline conditions. Bank undercut was assessed as the overall extent of each surveyed section with overhanging bank cover present. Figure 19 shows that Jock River in the Leamy Creek catchment had minimal levels of undercut banks along the system.
Figure 19 Undercut stream banks along the Jock River in the Leamy Creek catchment
3.2.3 Stream Shading
Grasses, shrubs and trees all contribute towards shading a stream. Shade is important in moderating stream temperature, contributing to food supply and helping with nutrient reduction within a stream. Stream cover is assessed as the total coverage area in each section that is shaded by overhanging trees/grasses and tree canopy, at greater than 1m above the water surface. Figure 20 shows low to moderate levels of stream shading dominate conditions in most sections of the Jock River in the Leamy Creek catchment.
Figure 20 Stream shading along the Jock River in the Leamy Creek catchment
3.2.4 Instream Woody Debris
Figure 21 shows that the majority of Jock River in the Leamy Creek catchment had low to moderate levels of instream woody debris in the form of branches and trees. Instream woody debris is important for fish and benthic invertebrate habitat, by providing refuge and feeding areas.
Figure 21 Instream woody debris along the Jock River in the Leamy Creek catchment
3.2.5 Overhanging Trees and Branches
Trees and branches that are less than one meter from the surface of the water are defined as overhanging. Overhanging branches and trees provide a food source, nutrients and shade which helps to moderate instream water temperatures. Figure 22 shows the system is highly variable with low to high levels of overhanging branches and trees along Jock River in the Leamy Creek catchment.
Figure 22 Overhanging trees and branches along the Jock River Leamy Creek catchment
3.2.6 Anthropogenic Alterations
Stream alterations are classified based on specific functional criteria associated with the flow conditions, the riparian buffer and potential human influences. Figure 23 shows 38 percent of the Jock River in the Leamy Creek catchment remains “unaltered” with no anthropogenic alterations. Fifty seven percent of Jock River in the Leamy Creek catchment was classified as natural with minor anthropogenic changes and four percent was considered slightly altered. The alterations along the Jock River in this reach were in the form of reduced buffers, roads and road crossings.
Figure 23 Anthropogenic alterations along the Jock River in the Leamy Creek catchment
3.3 Jock River Instream Aquatic Habitat
3.3.1 Habitat Complexity
Habitat complexity is a measure of the overall diversity of habitat types and features within a stream. Streams with high habitat complexity support a greater variety of species niches, and therefore contribute to greater diversity. Factors such as substrate, flow conditions (pools, riffles) and cover material (vegetation, wood structure, etc.) all provide crucial habitat to aquatic life. Habitat complexity is assessed based on the presence of boulder, cobble and gravel substrates, as well as the presence of instream woody material.
Low to moderate habitat complexity was identified for the Jock River Leamy Creek reach (Figure 24). Regions with increased habitat complexity were observed in a few locations along the system within the catchment.
Figure 24 Habitat complexity along the Jock River Leamy Creek catchment
3.3.2 Instream Substrate
Diverse substrate is important for fish and benthic invertebrate habitat because some species have specific substrate requirements and for example will only reproduce on certain types of substrate. The absence of diverse substrate types may limit the overall diversity of species within a stream. Figure 25 shows that 90 percent of the sections observed in the Jock River in the Leamy Creek catchment had the presence of clay and silt substrate. Overall substrate conditions were not diverse along the Jock River Leamy Creek reach with clay and silt being the dominate substrate types recorded. Figure 26 shows the dominant substrate type observed for each section surveyed along the Jock River in the Leamy Creek catchment.
Figure 25 Instream substrate along the Jock River in the Leamy Creek catchment
Figure 26 Dominant substrate type along the Jock River Leamy Creek catchment
3.3.3 Instream Morphology
Pools and riffles are important habitat features for aquatic life. Riffles are fast flowing areas characterized by agitation and overturn of the water surface. Riffles thereby play a crucial role in contributing to dissolved oxygen conditions and directly support spawning for some fish species. They are also areas that support high benthic invertebrate populations which are an important food source for many aquatic species. Pools are characterized by minimal flows, with relatively deep water and winter/summer refuge habitat for aquatic species. Runs are moderately shallow, with unagitated surfaces of water and areas where the thalweg (deepest part of the channel) is in the center of the channel. Figure 27 shows that the Jock River in the Leamy Creek catchment is highly uniform; 97 percent consists of runs, 1 percent riffles and 2 percent pools. Figure 28 shows where the riffle habitat areas were observed along the Jock River in the Leamy Creek catchment.

Figure 27 Instream morphology along the Jock River in the Leamy Creek catchment
Figure 28 Riffle habitat locations along the Jock River in the Leamy Creek catchment
3.3.4 Vegetation Type
Instream vegetation provides a variety of functions and is a critical component of the aquatic ecosystem. Aquatic plants promote stream health by:
- Providing direct riparian/instream habitat
- Stabilizing flows reducing shoreline erosion
- Contributing to dissolved oxygen through photosynthesis
- Maintaining temperature conditions through shading
For example emergent plants along the shoreline can provide shoreline protection from wave action and important rearing habitat for species of waterfowl. Submerged plants provide habitat for fish to find shelter from predator fish while they feed. Floating plants such as water lilies shade the water and can keep temperatures cool while reducing algae growth. Narrow leaved emergents were present at 94% of the sections surveyed, algae was observed in 100% of sections, while free floating plants were observed in 100% of surveyed sections. Broad leaved emergents were observed in 88% of sections, submerged plants in 90%, floating plants in 93% and robust emergents in only 25% of sections surveyed. Figure 29 depicts the plant community structure for the Jock River Leamy Creek catchment. Figure 30 shows the dominant vegetation type observed for each section surveyed along the Jock River in the Leamy Creek catchment.
Figure 29 Vegetation type along the Jock River in the Leamy Creek catchment
Figure 30 Dominant vegetation type along the Jock River in the Leamy Creek catchment
3.3.5 Instream Vegetation Abundance
Instream vegetation is an important factor for a healthy stream ecosystem. Vegetation helps to remove contaminants from the water, contributes oxygen to the stream, and provides habitat for fish and wildlife. Too much vegetation can also be detrimental. Figure 31 demonstrates that the Jock River Leamy Creek reach had no vegetation to low levels of instream vegetation for 38 percent of its length. Normal to common levels of vegetation were recorded at 52 percent of stream surveys. Extensive levels were observed at 11 percent along the system.
Figure 31 Instream vegetation abundance along the Jock River in the Leamy Creek catchment
3.3.6 Invasive Species
Invasive species can have major implications on streams and species diversity. Invasive species are one of the largest threats to ecosystems throughout Ontario and can out compete native species, having negative effects on local wildlife, fish and plant populations. Ninety three percent of the sections surveyed along the Jock River Leamy Creek reach had invasive species. The invasive species observed in the Jock River Leamy Creek reach were European frogbit, poison/wild parsnip, carp, banded mystery snail, yellow iris, bull thistle, Eurasian milfoil, Chinese mystery snail, and Manitoba maple. Invasive species abundance (i.e. the number of observed invasive species per section) was assessed to determine the potential range/vector of many of these species (Figure 32).
Figure 32 Invasive species abundance along the Jock River in the Leamy Creek catchment
3.3.7 Water Chemistry
During the stream characterization survey, a YSI probe is used to collect water chemistry information. Dissolved oxygen (DO), specific conductivity (SPC) and pH are measured at the start and end of each section.
3.3.7.1 Dissolved Oxygen
Dissolved oxygen is a measure of the amount of oxygen dissolved in water. The Canadian Environmental Quality Guidelines of the Canadian Council of Ministers of the Environment (CCME) suggest that for the protection of aquatic life the lowest acceptable dissolved oxygen concentration should be 6 mg/L for warmwater biota and 9.5 mg/L for coldwater biota (CCME, 1999). Figure 33 shows that the dissolved oxygen in the Jock River Leamy Creek catchment was within the threshold for warmwater biota in this reach of the system. The average dissolved oxygen levels observed within the main stem of Jock River in the Leamy Creek catchment was 7.96 mg/L which is within the recommended levels for warmwater biota.
Figure 33 Dissolved oxygen ranges in the Jock River for the Leamy Creek catchment
3.3.7.2 Conductivity
Conductivity in streams is primarily influenced by the geology of the surrounding environment, but can vary drastically as a function of surface water runoff. Currently there are no CCME guideline standards for stream conductivity; however readings which are outside the normal range observed within the system are often an indication of unmitigated discharge and/or stormwater input. The average conductivity observed within the main stem of Jock River in the Leamy Creek catchment was 556.8 µs/cm. Figure 34 shows the conductivity readings for the Jock River in the Leamy Creek catchment.
Figure 34 Specific conductivity ranges in the Jock River for the Leamy Creek catchment
3.3.7.3 pH
Based on the PWQO for pH, a range of 6.5 to 8.5 should be maintained for the protection of aquatic life. Average pH values for the Jock River Leamy Creek catchment averaged 7.93 thereby meeting the provincial standard (Figure 35).
Figure 35 pH ranges in the Jock River for the Leamy Creek catchment
3.3.7.4 Oxygen Saturation (%)
Oxygen saturation is measured as the ratio of dissolved oxygen relative to the maximum amount of oxygen that will dissolve based on the temperature and atmospheric pressure. Well oxygenated water will stabilize at or above 100% saturation, however the presence of decaying matter/pollutants can drastically reduce these levels. Oxygen input through photosynthesis has the potential to increase saturation above 100% to a maximum of 500%, depending on the productivity level of the environment. In order to represent the relationship between concentration and saturation, the measured values have been summarized into 6 classes:
- <100% Saturation / <6.0 mg/L Concentration. Oxygen concentration and saturation are not sufficient to support aquatic life and may represent impairment
- >100% Saturation / <6.0 mg/L Concentration. Oxygen concentration is not sufficient to support aquatic life, however saturation levels indicate that the water has stabilized at its estimated maximum. This is indicative of higher water temperatures and stagnant flows.
- <100% Saturation / 6.0—9.5 mg/L Concentration. Oxygen concentration is sufficient to support warm water biota, however depletion factors are likely present and are limiting maximum saturation.
- >100% Saturation / 6.0—9.5 mg/L Concentration. Oxygen concentration and saturation levels are optimal for warm water biota.
- <100% Saturation / >9.5 mg/L Concentration. Oxygen concentration is sufficient to support cold water biota, however depletion factors are likely present and are limiting maximum saturation.
- >100% Saturation / >9.5 mg/L Concentration. Oxygen concentration and saturation levels are optimal for cold water biota.
 and saturation (%) on the Jock River Leamy Creek reach")
Figure 36 A bivariate assessment of dissolved oxygen concentration (mg/L) and saturation (%) in the Jock River Leamy Creek reach
Dissolved oxygen conditions on the Jock River in the Leamy Creek catchment are generally sufficient for both warm and coolwater species (Figure 36).
3.3.7.5 Specific Conductivity Assessment
Specific conductivity (SPC) is a standardized measure of electrical conductance, collected at or corrected to a water temperature of 25⁰C. SPC is directly related to the concentration of ions in water, and is commonly influenced by the presence of dissolved salts, alkalis, chlorides, sulfides and carbonate compounds. The higher the concentration of these compounds, the higher the conductivity. Common sources of elevated conductivity include storm water, agricultural inputs and commercial/industrial effluents.
In order to summarize the conditions observed, SPC levels were evaluated as either normal, moderately elevated or highly elevated. These categories correspond directly to the degree of variation (i.e. standard deviation) at each site relative to the average across the system.
Normal levels were maintained along the majority of the Jock River in the Leamy Creek catchment, with moderately elevated levels observed in a short section in the lower reach and longer section in the middle reach (Figure 37).
Figure 37 Relative specific conductivity levels on the Jock River in the Leamy Creek catchment
3.3.8 Groundwater
Groundwater discharge areas can influence stream temperature, contribute nutrients, and provide important stream habitat for fish and other biota. During stream surveys, indicators of groundwater discharge are noted when observed. Indicators include: springs/seeps, watercress, iron staining, significant temperature change and rainbow mineral film. Figure 38 shows areas where one or more of the above groundwater indicators were observed during stream surveys and headwater assessments.
Figure 38 Groundwater indicators observed in the Jock River Leamy Creek catchment
3.3.9 Fish Community
The Jock River Leamy Creek catchment is classified as a mixed community of warm and cool water recreational and baitfish fishery with 36 species observed. The following table contains a list of species observed in the watershed.
Table 9 Fish species observed in the Jock River Leamy Creek catchment
3.3.10 Riparian Restoration
Figure 39 depicts the locations of various riparian restoration opportunities as a result of observations made during the stream survey.
Figure 39 Riparian restoration opportunities along the Jock River in the Leamy Creek catchment
3.3.11 Instream Restoration
Figure 40 depicts the locations of various instream restoration opportunities as a result of observations made during the stream survey.
Figure 40 Instream restoration opportunities along the Jock River in the Leamy Creek catchment
3.4 Headwater Drainage Feature Assessment
3.4.1 Headwater Sampling Locations
The RVCA Stream Characterization program assessed Headwater Drainage Features for the Jock River subwatershed in 2015. This protocol measures zero, first and second order headwater drainage features (HDF). It is a rapid assessment method characterizing the amount of water, sediment transport, and storage capacity within headwater drainage features (HDF). RVCA is working with other Conservation Authorities and the Ministry of Natural Resources and Forestry to implement the protocol with the goal of providing standard datasets to support science development and monitoring of headwater drainage features. An HDF is a depression in the land that conveys surface flow. Additionally, this module provides a means of characterizing the connectivity, form and unique features associated with each HDF (OSAP Protocol, 2013). In 2015 the program sampled one site at a road crossing in the Jock River Leamy Creek catchment area (Figure 41).

Figure 41 Location of the headwater sampling site in the Jock River Leamy Creek catchment
3.4.2 Headwater Feature Type
The headwater sampling protocol assesses the feature type in order to understand the function of each feature. The evaluation includes the following classifications: defined natural channel, channelized or constrained, multi-thread, no defined feature, tiled, wetland, swale, roadside ditch and pond outlet. By assessing the values associated with the headwater drainage features in the catchment area we can understand the ecosystem services that they provide to the watershed in the form of hydrology, sediment transport, and aquatic and terrestrial functions. The headwater drainage features that remain in the Leamy Creek catchment are primarily classified as municipal drains and the feature that was assessed was classified as having been channelized. Figure 42 shows the feature type of the primary feature at the sampling location.
Figure 42 Headwater feature types in the Jock River Leamy Creek catchment
A spring photo of the headwater sample site in the Jock River Leamy Creek catchment located on Barnsdale Road
A summer photo of the headwater sample site in the Jock River Leamy Creek catchment located on Barnsdale Road
3.4.3 Headwater Feature Flow
The observed flow condition within headwater drainage features can be highly variable depending on timing relative to the spring freshet, recent rainfall, soil moisture, etc. Flow conditions are assessed in the spring and in the summer to determine if features are perennial and flow year round, if they are intermittent and dry up during the summer months or if they are ephemeral systems that do not flow regularly and generally respond to specific rainstorm events or snowmelt. Flow conditions in headwater systems can change from year to year depending on local precipitation patterns. Figure 43 shows the observed flow condition at the sampling location in the Jock River Leamy Creek catchment in 2015.
Figure 43 Headwater feature flow conditions in the Jock River Leamy Creek catchment
3.4.4 Headwater Feature Channel Moficiations
Channel modifications were assessed at each headwater drainage feature sampling location. Modifications include channelization, dredging, hardening and realignments. The Jock River Leamy Creek catchment area site was classified as having been recently dredged. Figure 44 shows the channel modifications observed at the sampling location for Jock River Leamy Creek.
Figure 44 Headwater feature channel modifications in the Jock River Leamy Creek catchment
3.4.5 Headwater Feature Vegetation
Headwater feature vegetation evaluates the type of vegetation that is found within the drainage feature. The type of vegetated within the channel influences the aquatic and terrestrial ecosystem values that the feature provides. For some types of headwater features the vegetation within the feature plays a very important role in flow and sediment movement and provides wildlife habitat. The following classifications are evaluated no vegetation, lawn, wetland, meadow, scrubland and forest. Figure 45 depicts the dominant vegetation observed at the sampled headwater site in the Jock River Leamy Creek catchment.
Figure 45 Headwater feature vegetation types in the Jock River Leamy Creek catchment
3.4.6 Headwater Feature Riparian Vegetation
Headwater riparian vegetation evaluates the type of vegetation that is found along the adjacent lands of a headwater drainage feature. The type of vegetation within the riparian corridor influences the aquatic and terrestrial ecosystem values that the feature provides to the watershed. Figure 46 depicts the type of riparian vegetation observed at the sampled headwater site in the Jock River Leamy Creek catchment.
Figure 46 Headwater feature riparian vegetation types in the Jock River Leamy Creek catchment
3.4.7 Headwater Feature Sediment Deposition
Assessing the amount of recent sediment deposited in a channel provides an index of the degree to which the feature could be transporting sediment to downstream reaches (OSAP, 2013). Evidence of excessive sediment deposition might indicate the requirement to follow up with more detailed targeted assessments upstream of the site location to identify potential best management practices to be implemented. Figure 47 depicts the degree of sediment deposition observed at the sampled headwater site in the Jock River Leamy Creek catchment.
Figure 47 Headwater feature sediment deposition in the Jock River Leamy Creek catchment
3.4.8 Headwater Feature Upstream Roughness
Feature roughness will provide a measure of the amount of materials within the bankfull channel that could slow down the velocity of water flowing within the headwater feature (OSAP, 2013). Materials on the channel bottom that provide roughness include vegetation, woody debris and boulders/cobble substrates. Roughness can provide benefits in mitigating downstream erosion on the headwater drainage feature and the receiving watercourse by reducing velocities. Roughness also provides important habitat conditions to aquatic organisms. Figure 48 shows the feature roughness conditions at the sampling location in the Jock River Leamy Creek catchment.
Figure 48 Headwater feature roughness in the Jock River Leamy Creek catchment
4.0 Jock River-Leamy Creek Catchment: Land Cover
Land cover and any change in coverage that has occurred over a six-year period is summarized for the Jock River-Leamy catchment using spatially continuous vector data representing the catchment during the spring of 2008 and 2014. This dataset was developed by the RVCA through heads-up digitization of 20cm DRAPE ortho-imagery at a 1:4000 scale and details the surrounding landscape using 10 land cover classes.
4.1 Leamy Creek Catchment Land Cover Change
As shown in Table 10 and Figure 1, the dominant land cover type across the Leamy catchment in 2014 was crop and pastureland.
Table 10 Land cover (2008 vs. 2014) in the Leamy catchment
* Does not include treed swamps
From 2008 to 2014, there was an overall change of 44 hectares (from one land cover class to another). Most of the change in the Leamy Creek catchment is a result of the conversion of woodland and areas of meadow-thicket to crop and pastureland (Figure 49).
Figure 49 Land cover change in the Leamy catchment (2014)
Table 11 provides a detailed breakdown of all land cover change that has taken place in the Leamy catchment between 2008 and 2014.
Table 11 Land cover change in the Leamy catchment (2008 to 2014)
4.2 Woodland Cover
In the Environment Canada Guideline (Third Edition) entitled “How Much Habitat Is Enough?” the opening narrative under the Forest Habitat Guidelines section states that prior to European settlement, forest was the predominant habitat in the Mixedwood Plains ecozone. The remnants of this once vast forest now exist in a fragmented state in many areas (including the Rideau Valley watershed) with woodland patches of various sizes distributed across the settled landscape along with higher levels of forest cover associated with features such as the Frontenac Axis (within the on-Shield areas of the Rideau Lakes and Tay River subwatersheds). The forest legacy, in terms of the many types of wildlife species found, overall species richness, ecological functions provided and ecosystem complexity is still evident in the patches and regional forest matrices (found in the Jock Rideau subwatershed and elsewhere in the Rideau Valley watershed). These ecological features are in addition to other influences which forests have on water quality and stream hydrology including reducing soil erosion, producing oxygen, storing carbon along with many other ecological services that are essential not only for wildlife but for human well-being.
The Guideline also notes that forests provide a great many habitat niches that are in turn occupied by a great diversity of plant and animal species. They provide food, water and shelter for these species - whether they are breeding and resident locally or using forest cover to help them move across the landscape. This diversity of species includes many that are considered to be species at risk. Furthermore, from a wildlife perspective, there is increasing evidence that the total forest cover in a given area is a major predictor of the persistence and size of bird populations, and it is possible or perhaps likely that this pattern extends to other flora and fauna groups. The overall effect of a decrease in forest cover on birds in fragmented landscapes is that certain species disappear and many of the remaining ones become rare, or fail to reproduce, while species adapted to more open and successional habitats, as well as those that are more tolerant to human-induced disturbances in general, are able to persist and in some cases thrive. Species with specialized-habitat requirements are most likely to be adversely affected. The overall pattern of distribution of forest cover, the shape, area and juxtaposition of remaining forest patches and the quality of forest cover also play major roles in determining how valuable forests will be to wildlife and people alike.
The current science generally supports minimum forest habitat requirements between 30 and 50 percent, with some limited evidence that the upper limit may be even higher, depending on the organism/species phenomenon under investigation or land-use/resource management planning regime being considered/used.
As shown in Figure 50, eight percent of the Leamy Creek catchment contains 164 hectares of upland forest versus the 26 percent of woodland cover in the Jock River subwatershed. This is less than the 30 percent of forest cover that is identified as the minimum threshold required to sustain forest birds according to the Guideline and which may only support less than one half of potential species richness and marginally healthy aquatic systems. When forest cover drops below 30 percent, forest birds tend to disappear as breeders across the landscape.
Figure 50 Woodland cover and interior forest (2014)
4.2.1 Woodland (Patch) Size
According to the Ministry of Natural Resources’ Natural Heritage Reference Manual (Second Edition), larger woodlands are more likely to contain a greater diversity of plant and animal species and communities than smaller woodlands and have a greater relative importance for mobile animal species such as forest birds.
Bigger forests often provide a different type of habitat. Many forest birds breed far more successfully in larger forests than they do in smaller woodlots and some rely heavily on forest interior conditions. Populations are often healthier in regions with more forest cover and where forest fragments are grouped closely together or connected by corridors of natural habitat. Small forests support small numbers of wildlife. Some species are “area-sensitive” and tend not to inhabit small woodlands, regardless of forest interior conditions. Fragmented habitat also isolates local populations, especially small mammals, amphibians and reptiles with limited mobility. This reduces the healthy mixing of genetic traits that helps populations survive over the long run (Conserving the Forest Interior. Ontario Extension Notes, 2000).
The Environment Canada Guideline also notes that for forest plants that do not disperse broadly or quickly, preservation of some relatively undisturbed large forest patches is needed to sustain them because of their restricted dispersal abilities and specialized habitat requirements and to ensure continued seed or propagation sources for restored or regenerating areas nearby.
The Natural Heritage Reference Manual continues by stating that a larger size also allows woodlands to support more resilient nutrient cycles and food webs and to be big enough to permit different and important successional stages to co-exist. Small, isolated woodlands are more susceptible to the effects of blowdown, drought, disease, insect infestations, and invasions by predators and non-indigenous plants. It is also known that the viability of woodland wildlife depends not only on the characteristics of the woodland in which they reside, but also on the characteristics of the surrounding landscape where the woodland is situated. Additionally, the percentage of forest cover in the surrounding landscape, the presence of ecological barriers such as roads, the ability of various species to cross the matrix surrounding the woodland and the proximity of adjacent habitats interact with woodland size in influencing the species assemblage within a woodland.
In the Leamy Creek catchment (in 2014), thirty-seven (57 percent) of the 65 woodland patches are very small, being less than one hectare in size. Another 28 (43 percent) of the woodland patches ranging from one to less than 20 hectares in size tend to be dominated by edge-tolerant bird species.
No patch exceeds the 100 plus hectare size needed to support most forest dependent, area sensitive birds and which are large enough to support approximately 60 percent of edge-intolerant species. No patch tops 200 hectares, which according to the Environment Canada Guideline will support 80 percent of edge-intolerant forest bird species (including most area sensitive species) that prefer interior forest habitat conditions.
Table 12 presents a comparison of woodland patch size in 2008 and 2014 along with any changes that have occurred over that time. A decrease (of 19 ha) has been observed in the overall woodland patch area between the two reporting periods with all change occurring in the one to 20-hectare woodland patch size class range.
Table 12 Woodland patches in the Leamy Creek catchment (2008 and 2014)
*Includes treed swamps
4.2.2 Woodland (Forest) Interior Habitat
The forest interior is habitat deep within woodlands. It is a sheltered, secluded environment away from the influence of forest edges and open habitats. Some people call it the “core” or the “heart” of a woodland. The presence of forest interior is a good sign of woodland health, and is directly related to the woodland’s size and shape. Large woodlands with round or square outlines have the greatest amount of forest interior. Small, narrow woodlands may have no forest interior conditions at all. Forest interior habitat is a remnant natural environment, reminiscent of the extensive, continuous forests of the past. This increasingly rare forest habitat is now a refuge for certain forest-dependent wildlife; they simply must have it to survive and thrive in a fragmented forest landscape (Conserving the Forest Interior. Ontario Extension Notes, 2000).
The Natural Heritage Reference Manual states that woodland interior habitat is usually defined as habitat more than 100 metres from the edge of the woodland and provides for relative seclusion from outside influences along with a moister, more sheltered and productive forest habitat for certain area sensitive species. Woodlands with interior habitat have centres that are more clearly buffered against the edge effects of agricultural activities or more harmful urban activities than those without.
In the Leamy catchment (in 2014), the 65 woodland patches contain seven forest interior patches (Figure 50) that occupy less than one percent (5 ha.) of the catchment land area (which is less than the three percent of interior forest in the Jock River subwatershed). This is below the ten percent figure referred to in the Environment Canada Guideline that is considered to be the minimum threshold for supporting edge intolerant bird species and other forest dwelling species in the landscape.
All seven patches have less than 10 hectares of interior forest, five of which have small areas of interior forest habitat less than one hectare in size. Between 2008 and 2014, there was an overall loss of less than one hectare of interior forest habitat in the catchment (Table 13).
Table 13 Woodland interior in the Leamy Creek catchment (2008 and 2014)
4.3 Wetland Cover
Wetlands are habitats forming the interface between aquatic and terrestrial systems. They are among the most productive and biologically diverse habitats on the planet. By the 1980s, according to the Natural Heritage Reference Manual, 68 percent of the original wetlands south of the Precambrian Shield in Ontario had been lost through encroachment, land clearance, drainage and filling.
Wetlands perform a number of important ecological and hydrological functions and provide an array of social and economic benefits that society values. Maintaining wetland cover in a watershed provides many ecological, economic, hydrological and social benefits that are listed in the Reference Manual and which may include:
- contributing to the stabilization of shorelines and to the reduction of erosion damage through the mitigation of water flow and soil binding by plant roots
- mitigating surface water flow by storing water during periods of peak flow (such as spring snowmelt and heavy rainfall events) and releasing water during periods of low flow (this mitigation of water flow also contributes to a reduction of flood damage)
- contributing to an improved water quality through the trapping of sediments, the removal and/or retention of excess nutrients, the immobilization and/or degradation of contaminants and the removal of bacteria
- providing renewable harvesting of timber, fuel wood, fish, wildlife and wild rice
- contributing to a stable, long-term water supply in areas of groundwater recharge and discharge
- providing a high diversity of habitats that support a wide variety of plants and animals
- acting as “carbon sinks” making a significant contribution to carbon storage
- providing opportunities for recreation, education, research and tourism
Historically, the overall wetland coverage within the Great Lakes basin exceeded 10 percent, but there was significant variability among watersheds and jurisdictions, as stated in the Environment Canada Guideline. In the Rideau Valley Watershed, it has been estimated that pre-settlement wetland cover averaged 35 percent using information provided by Ducks Unlimited Canada (2010) versus the 21 percent of wetland cover existing in 2014 derived from DRAPE imagery analysis.
Using the same dataset, it is estimated that pre-settlement (historic) wetland cover averaged 51 percent in the Jock River subwatershed versus the 24 percent of cover existing in 2014 (as summarized in Table 14).
Table 14 Wetland cover in the Jock River subwatershed and Leamy Creek catchment (Historic to 2014)
This decline in wetland cover is also evident in the Leamy Creek catchment (as seen in Figure 51) where wetland was reported to cover 58 percent of the area prior to settlement, as compared to less than one percent in 2014. This represents an almost 100 percent loss of historic wetland cover and what remains (in 2014) falls far below the 40 percent historic wetland threshold cited in the Environment Canada Guideline for maintaining key ecological and hydrological functions. To maintain critical hydrological, ecological functions along with related recreational and economic benefits provided by these wetland habitats in the catchment, the Guideline recommends a “no net loss” approach for currently existing wetlands combined with efforts to work towards restoring upwards of 40 percent of the historic wetland coverage, where feasible.
Figure 51 Leamy Creek catchment wetland cover
4.4 Shoreline Cover
The riparian or shoreline zone is that special area where the land meets the water. Well-vegetated shorelines are critically important in protecting water quality and creating healthy aquatic habitats, lakes and rivers. Natural shorelines intercept sediments and contaminants that could impact water quality conditions and harm fish habitat in streams. Well established buffers protect the banks against erosion, improve habitat for fish by shading and cooling the water and provide protection for birds and other wildlife that feed and rear young near water. A recommended target (from the Environment Canada Guideline) is to maintain a minimum 30 metre wide vegetated buffer along at least 75 percent of the length of both sides of rivers, creeks and streams.
Figure 52 shows the extent of the ‘Natural’ vegetated riparian zone (predominantly wetland/woodland features) and ‘Other’ anthropogenic cover (crop/pastureland, roads/railways, settlements) along a 30-metre-wide area of land, both sides of the shoreline of the Jock River and its tributaries in the Leamy Creek catchment.
Figure 52 Natural and other riparian land cover in the Leamy Creek catchment
This analysis shows that the riparian buffer in the Leamy Creek catchment in 2014 was comprised of crop and pastureland (62 percent), woodland (16 percent), transportation (nine percent), meadow-thicket (seven percent), settlement (four percent) and aggregate (two percent). Additional statistics for the Leamy Creek catchment are presented in Table 15 and show that there has been very little change in shoreline cover from 2008 to 2014.
Table 15 Riparian land cover (2008 vs. 2014) in the Leamy Creek catchment
5.0 Jock River-Leamy Creek Catchment: Stewardship and Water Resources Protection
The RVCA and its partners are working to protect and enhance environmental conditions in the Jock River Subwatershed. Figure 53 shows the location of all stewardship projects completed in the Leamy Creek catchment along with sites identified for potential shoreline restoration.
5.1 Rural Clean Water Projects
From 2010 to 2015, one precision farming project was completed. Between 2004 and 2009, two septic system replacements, one windbreak buffer and one well upgrade were completed. Prior to 2004, four crop residue projects, two manure storage/wastewater runoff projects, one septic system replacement and one milkhouse wastewater treatment facility. Total value of all 13 projects is $106,974 with $25,982 of that amount funded through grant dollars from the RVCA.
 Figure 53
 Stewardship site locations
5.2 Private Land Forestry Projects
The location of RVCA tree planting projects is shown in Figure 53. No trees were planted in the catchment between 2004 and 2015. Prior to 2004, 1,950 trees were planted at two sites for a total value of $9,065 with $3,795 of that amount coming from various fundraising sources.
5.3 Shoreline Naturalization Projects
With the assistance of the RVCA’s Shoreline Naturalization Program, 715 trees and shrubs were planted at a total project value of $12,158.
5.4 Valley, Stream, Wetland and Hazard Lands
The Leamy Creek catchment covers 20 square kilometres with 6.7 square kilometres (or 33 percent) of the drainage area being within the regulation limit of Ontario Regulation 174/06 (Figure 54), giving protection to wetland areas and river or stream valleys that are affected by flooding and erosion hazards.
Wetlands occupy 1.2 ha (or less than one percent) of the catchment and are located outside the regulated area limit.
Of the 32.2 kilometres of stream in the catchment, regulation limit mapping has been plotted along 23.9 kilometers of streams (representing 74 percent of all streams in the catchment). Plotting of the regulation limit on the remaining 8.4 km (or 26 percent) of streams requires identification of flood and erosion hazards and valley systems.
Within those areas of the Leamy Creek catchment subject to the regulation (limit), efforts (have been made and) continue through RVCA planning and regulations input and review to manage the impact of development (and other land management practices) in areas where “natural hazards” are associated with rivers, streams, valley lands and wetlands. For areas beyond the regulation limit, protection of the catchment’s watercourses is only provided through the “alteration to waterways” provision of the regulation.
Figure 54 RVCA regulation limits
6.0 Jock River-Leamy Catchment: Creek Challenges/Issues
Water Quality/Quantity
Surface chemistry water quality on the Jock River in the Leamy Creek catchment is “Fair” over the two reporting periods (2004-2009 and 2010-2015). Frequent high nutrient concentrations and occasional metal exceedances largely contributed to the rating
Instream biological water quality conditions in the Jock River within the catchment are unknown
Existing hydrological and geochemical datasets and assessments (academic, RVCA, others) are only recently available and/or are not being considered in the characterization of the numerous hydrologic functions of the Jock River subwatershed. Further, there is a dearth of hydrologic information (hydroperiod, groundwater/surface water interactions, geochemistry) about the wetlands that remain in the Jock River subwatershed
Headwaters/Instream/Shorelines
‘Natural’ vegetation covers 23 percent of the riparian zone of Leamy Creek, the Jock River and its tributaries (Figure 52) and is below the recommended 30 metre wide, naturally vegetated target along 75 percent of the length of the catchment’s watercourses
Water crossing (stone causeway) along the Jock River acts as a barrier to fish migration (located immediately downstream of the Monahan Drain confluence)
Land Cover
Woodlands cover eight percent of the catchment and is less than the 30 percent of forest cover that is identified as the minimum threshold for sustaining forest birds and other woodland dependent species (Figure 50)
Pre-settlement wetlands have declined by 100 percent and are now absent in the catchment (Figure 51)
7.0 Jock River-Leamy Creek Catchment: Opportunities/Actions
Water Quality/Quantity
Focus on nutrient reductions via non-point and point source pollution control though best management practices such as riparian zone enhancement, tile drainage controls, erosion mitigation, reforestation and protection of natural cover
Private landowners should consider taking advantage of The Rural Clean Water Programs which offer grants to landowners interested in implementing projects on their property that will help to protect and improve water quality:
- Homeowners may be interested in projects to repair, replace or upgrade their well or septic system, or addressing erosion through buffer plantings and erosion control
- Farmers can take advantage of a wide range of projects, including livestock fencing, manure storage, tile drainage control structures, cover crops, and many more
Continue to coordinate environmental monitoring and reporting activities with the City of Ottawa
Use wetland restoration as a tool to improve surface water quality and help restore the hydrologic integrity of the Jock River and its tributaries, including Leamy Creek
List, share and when possible, synthesize and use existing hydrological and geochemical datasets and assessment outcomes to facilitate the characterization of subwatershed and catchment hydrological functions. In addition, prepare guidance on best practices for the preparation of water budget assessments to better understand the hydrologic cycle requirements that occur at site specific scales; and share existing catchment and subwatershed scale water budget assessment outcomes
Headwaters/Instream/Shorelines
Promote the Rideau Valley Shoreline Naturalization Program to landowners to increase existing 23 percent of natural shoreline cover
Educate landowners about the value of and best management practices used to maintain and enhance natural shorelines and headwater drainage features
Work with the City of Ottawa to consistently implement current land use planning and development policies for water quality and shoreline protection (i.e., adherence to a minimum 30 metre development setback from water) adjacent to the Jock River and other catchment streams, including Leamy Creek
Target shoreline restoration at sites identified in this report (shown as “Other riparian land cover” in Figure 52 and “Potential Riparian/Instream Restoration” in Figures 39/40) and explore other restoration and enhancement opportunities along the Jock River, its tributaries and Leamy Creek
Land Cover
Promote the City of Ottawa’s Green Acres Reforestation Program to landowners to increase existing eight percent of woodland cover
Encourage the City of Ottawa to strengthen natural heritage and water resources policies in official plans and zoning by-laws where shoreline, wetland, woodland cover and watercourse setbacks are determined to be at or below critical ecological thresholds. Information for this purpose is provided in the RVCA’s subwatershed and catchment reports
Explore ways and means to more effectively enforce and implement conditions of land-use planning and development approvals to achieve net environmental gains
Re-consider the RVCA’s approach to wetland regulation where there is an identified hydrologic imperative to do so (i.e., significant loss of historic wetland cover (see Figure 51) and/or seasonal, critically low baseflows in the Jock River and/or areas of seasonal flooding)
Full Catchment Report
Jock River Subwatershed Report 2016
JOCK RIVER-RICHMOND CATCHMENT
The RVCA produces individual reports for 12 catchments in the Jock River subwatershed. Using data collected and analyzed by the RVCA through its watershed monitoring and land cover classification programs, surface water quality and in-stream conditions are reported for the Jock River along with a summary of environmental conditions for the surrounding countryside every six years.
This information is used to better understand the effects of human activity on our water resources, allows us to better track environmental change over time and helps focus watershed management actions where they are needed the most to help sustain the ecosystem services (cultural, aesthetic and recreational values; provisioning of food, fuel and clean water; regulation of erosion/natural hazard protection and water purification; supporting nutrient/water cycling and habitat provision) provided by the catchment’s lands and forests and waters (Millennium Ecosystem Assessment 2005).
The following sections of this report for the Jock River - Richmond catchment are a compilation of that work.
| Catchment Facts |
Section 1.0 |
| Surface Water Quality Conditions |
Section 2.0 |
| Riparian Conditions |
Section 3.0 |
| Land Cover |
Section 4.0 |
| Land Stewardship and Water Resources Protection |
Section 5.0 |
| Challenges/Issues |
Section 6.0 |
| Actions/Opportunities |
Section 7.0 |
For other Jock River catchments and the Jock River Subwatershed Report, please visit the RVCA website at www.rvca.ca

Figure 1 Land cover in the Jock River - Richmond catchment
1.0 Jock River-Richmond Catchment: Facts
1.1 General/Physical Geography
Municipalities
- Ottawa: (31 km2; 100% of catchment)
Geology/Physiography
- The Richmond Catchment resides within an extensive physiographic region known as the Ottawa Valley Clay Plain. This part of the clay plain ranges from being very thin to approximately 8 to 10 metres deep. In the western part of this catchment, the clay plain transitions to an extensive and deep sand plain. There is also some areas of glacial till along the southern boundary of the catchment
- In this catchment, the clay and sand plains are underlain by dolostone of the Oxford Formation and sandstone with shale and limestone from the Rockcliffe Formation. In addition, a geologic fault may pass through the catchment
Topography
- The ground surface ranges in elevation from approximately 106 masl near Conley Road to approximately 92 masl at the catchment’s outlet
Drainage Area
- 31 square kilometers; occupies five percent of the Jock River subwatershed, less than one percent of the Rideau Valley watershed
Stream Length
- Jock River and tributaries: 60 km
1.2 Vulnerable Areas
Flood/Erosion Hazard
- Jock River is subject to a flooding hazard during the regional storm flood (the 100 year flood). Surveys and studies undertaken in accordance with provincial standards have determined that the 100 year flood elevation in the catchment ranges from 97.5 metres above mean sea level at the upper, mapped extent of the regulation limit adjacent to the Richmond Fen provincially significant wetland to 93.5 metres above mean sea level at Eagleson Road
Aquifer Vulnerability
- The Mississippi-Rideau Source Protection initiative has mapped the western part of this catchment as a significant groundwater recharge area; and the southern extent of the catchment as Highly Vulnerable Aquifer. Wellhead Protection Areas (WHPA) A and B, and part of WHPA C and D for the municipal wells in Richmond, underlie the southern half of this catchment
Wetland Hydrology
- A watershed model developed by the RVCA in 2009 was used to study the hydrologic function of wetlands in the Rideau Valley Watershed, including those found in the Richmond catchment
1.3 Conditions at a Glance
Water Quality
- Surface chemistry water quality rating on the Jock River in the Jock River-Richmond catchment is “Fair” over the two reporting periods (2004-2009 and 2010-2015). The score at this site reflects few exceedances across measured parameters with occasional instances of elevated nutrients and bacterial counts
- Instream biological water quality conditions at the Jock River Richmond sample location range from “ Poor” to “Fair” from 2004 to 2015 (using a grading scheme developed by Ontario Conservation Authorities in Ontario for benthic invertebrates) with an overall benthic invertebrate water quality rating of “Fairly Poor” determined for this period
Instream and Riparian
- Overall instream and riparian condition for the Jock River-Richmond catchment as assessed by the stream characterization and headwater drainage feature assessment programs show that the Jock River and its tributaries are in generally good condition. The majority of the system has low erosion levels and a healthy forested riparian corridor along the Jock River and wetland along Marlborough Creek. Instream diversity of aquatic habitat is fairly complex along most of the Jock River, while the lower reach of Marlborough Creek is dominated by low complex habitat values
Thermal Regime
- Warm/cool water thermal guild supporting the Jock River/Rideau River fishery
Fish Community
- Thirty-nine species of recreational and bait fish
Shoreline Cover Type (30 m. riparian area; 2014)
- Crop and Pasture (39%)
- Wetland (20%)
- Woodland (20%)
- Settlement (9%)
- Transportation (7%)
- Meadow-Thicket (5%)
Land Cover Type (2014)
- Crop and Pasture (47%)
- Woodland (16%)
- Wetland (15%)
- Settlement (14%)
- Transportation (5%)
- Meadow-Thicket (2%)
- Water (1%)
Land Cover Change (2008 to 2014)
- Woodland (-42 ha)
- Meadow-Thicket (-42 ha)
- Wetland (-12 ha)
- Water (0 ha)
- Transportation (+8 ha)
- Settlement (+24 ha)
- Crop and Pasture (+63 ha)
Significant Natural Features
- Richmond Fen Provincially Significant Wetland
Water Wells
- 1400 (approximately) operational private water wells in the Richmond Catchment. Groundwater uses are mainly domestic, but also include groundwater monitoring and testing, municipal and other public water supplies, livestock watering, and commercial and industrial uses
Aggregates
- No sand and gravel pit licenses or open or closed bedrock quarries and no primary sand and gravel aggregate resource
Species at Risk (Elemental Occurrence)
- Henslow's Sparrow (Endangered)
- Bobolink, Eastern Meadowlark (Threatened)
- Snapping Turtle, Yellow Rail (Special Concern)
1.4 Catchment Care
Stewardship
- Seventy-five stewardship projects undertaken (see Section 5)
Environmental Monitoring
- Chemical surface (in-stream) water quality collection since 2003 (see Section 2)
- Benthic invertebrate (aquatic insect) surface (in-stream) water quality collection since 2003 (see Section 3.3.1)
- Fish survey along the Jock River (see Section 3.3.11)
- Stream characterization survey on the Jock River in 2015, working upstream to the headwaters from its mouth where it empties into the Rideau River, taking measurements and recording observations on instream habitat, bank stability, other attributes and preparing a temperature profile (see Section 3)
- Nine headwater drainage feature assessments in 2015 at road crossings in the catchment. The protocol measures zero, first and second order headwater drainage features and is a rapid assessment method characterizing the amount of water, sediment transport, and storage capacity within headwater drainage features (see Section 3.4)
- Additional groundwater chemistry information is available from the Ontario Geological Survey for a well located in this catchment
Environmental Management
- Development along the Jock River, Marlborough Creek and Van Gaal Drain and in and adjacent to the Richmond Fen provincially significant wetland in the catchment is subject to Ontario Regulation 174-06 (entitled “Development, Interference with Wetlands and Alterations to Shorelines and Watercourses”) that protects the hydrologic function of the wetland and also protects landowners and their property from natural hazards (flooding, fluctuating water table, unstable slopes/ soils) associated with them
- Richmond Weir is operated by the RVCA in the Village of Richmond
- Twelve active Permits To Take Water (PTTW) in the Richmond Catchment issued for construction dewatering, municipal water supply and wildlife conservation
- Eleven Environmental Compliance Approvals in the Richmond Catchment. Most are for municipal or private sewage works. One is for an industrial sewage work
2.0 Jock River-Richmond Catchment: Surface Water Quality Conditions
Surface water quality conditions in the Jock River-Richmond catchment are monitored by the City of Ottawa Baseline Water Quality Monitoring Program. This program provides information on the condition of Ottawa’s surface water resources; data is collected for multiple parameters including nutrients (total phosphorus, total Kjeldahl nitrogen and ammonia), E. coli, metals (like aluminum and copper) and additional chemical/physical parameters (such as alkalinity, chlorides, pH and total suspended solids). The locations of monitoring sites are shown in Figure 2 and Table 1.
Figure 2 Water quality monitoring site on the Jock River in the Jock River-Richmond Catchment
2.1 Jock River Water Quality Rating
The RVCA's water quality rating for this site (JR-12) is “Fair” (Table 1) as determined by the Canadian Council of Ministers of the Environment (CCME) Water Quality Index. A “Fair” rating indicates that water quality is usually protected but occasionally threatened or impaired; conditions sometime depart from natural or desirable levels. Each parameter is evaluated against established guidelines to determine water quality conditions. Those parameters that are more likely to exceed guidelines are presented below. Analysis of the data has been broken into two periods; 2004 to 2009 and 2010 to 2015 to examine if conditions have changed between these periods. Table 1 shows the overall rating for the monitored surface water quality site within the Jock River-Richmond catchment and Table 2 outlines the Water Quality Index (WQI) scores and their corresponding ratings.
There is one monitored water quality site on the Jock River within the Jock River-Richmond Catchment (JR-12, Figure 2). The water quality score at this site reflects few exceedances across measured parameters with occasional instances of elevated nutrients and bacterial counts. For more information on the CCME WQI, please see the Jock River Subwatershed Report.
Table 1 Water Quality Index rating for the Jock River-Richmond catchment
Table 2 Water Quality Index ratings and corresponding index scores (RVCA terminology, original WQI category names in brackets)
2.2 Nutrients
Total phosphorus (TP) is used as a primary indicator of excessive nutrient loading and may contribute to abundant aquatic vegetation growth and depleted dissolved oxygen levels. The Provincial Water Quality Objective (PWQO) is used as the TP Guideline and states that in streams concentrations greater than 0.030 mg/l indicate an excessive amount of TP.
Total Kjeldahl nitrogen (TKN) and ammonia (NH3) are used as secondary indicators of nutrient loading. RVCA uses a guideline of 0.500 mg/l to assess TKN[1] and the PWQO of 0.020 mg/l to assess NH3 concentrations in the Jock River.
Tables 3, 4 and 5 summarize average nutrient concentrations at monitored sites within the Jock River-Richmond catchment and show the proportion of results that meet the guidelines.
Table 3 Summary of total phosphorus results for the Jock River-Richmond catchment, 2004-2009 and 2010-2015. Highlighted values indicate average concentrations exceed the guideline
Table 4 Summary of total Kjeldahl nitrogen results for the Jock River-Richmond catchment from 2004-2009 and 2010-2015. Highlighted values indicate average concentrations exceed the guideline
Table 5 Summary of ammonia results for Jock River-Richmond catchment from 2004-2009 and 2010-2015
Monitoring Site JR-12
Elevated TP results were a common occurrence at site JR-12 and stayed fairly consistent between the two monitoring periods. Fifty-eight percent of samples were below the guideline in the 2004-2009 period (Figure 3); this improved slightly to 64 percent of samples in the 2010-2015 period (Figure 4). The average TP concentration increased marginally from 0.029 mg/l (2004-2009) to 0.032 mg/l (2010-2015) as shown in Table 3.
The bulk of TKN results have exceeded the guideline (Figure 5 and 6), with 13 percent of samples below the guideline in the 2004-2009 period, decreasing to only two samples below the guideline in 2010-2015. The average concentration was elevated and increased from 0.756 mg/l to 0.830 mg/l (Table 4).
The results for NH3 showed few exceedances occurred. Ninety-six percent of results were below the guideline in 2004-2009 (Figure 7); this decreased to 89 percent in the 2010-2015 reporting period (Figure 8). The average NH3 concentration increased marginally from 0.009 mg/l to 0.010 mg/l (Table 5).
Figure 3 Total phosphorous concentrations in the Jock River, 2004-2009
Figure 4 Total phosphorous concentrations in the Jock River, 2010-2015
Figure 5 Total Kjeldahl nitrogen concentrations in the Jock River, 2004-2009
Figure 6 Total Kjeldahl nitrogen concentrations in the Jock River, 2010-2015
Figure 7 Ammonia concentrations in the Jock River, 2004-2009
Figure 8 Ammonia concentrations in the Jock River, 2010-2015
Summary
Nutrient enrichment is a feature in this reach of the Jock River. The Jock River was previously identified as having a marginal rating (i.e. exceeded targets occasionally) for phosphorus (City of Ottawa, Water Environment Protection Program , 2006). Overall, average nutrient concentrations have remained consistent through the monitoring periods. The elevated TKN concentrations and low NH3 results provide evidence that nutrient enrichment may be a natural feature in this part of the river. Upstream of JR-12 there is little development and large wetland areas which likely contribute to high levels of organic nutrients, such as TKN. Elevated nutrients may contribute to nutrient loading downstream and to the Rideau River.
High nutrient concentrations can help stimulate the growth of algae blooms and other aquatic vegetation in a waterbody and deplete oxygen levels as the vegetation dies off. Best management practices such as minimizing storm water runoff, enhanced shoreline buffers, preventing the use of fertilizers and restricting livestock access should all be employed to prevent unnecessary nutrient loading to downstream reaches.
2.3 Escherichia coli
Escherichia coli (E. coli) is used as an indicator of bacterial pollution from human or animal waste; in elevated concentrations it can pose a risk to human health. The PWQO of 100 colony forming units/100 millilitres (CFU/100 ml) is used. E. coli counts greater than this guideline indicate that bacterial contamination may be a problem within a waterbody.
Table 6 summarizes the geometric mean[2] for the monitored site on the Jock River within the Richmond catchment and shows the proportion of samples that meet the E. coli guideline of 100 CFU/100 ml. The results of the geometric mean with respect to the guideline for the two periods, 2004-2009 and 2010-2015, are shown in Figures 9 and 10.
Table 6 Summary of E. coli results for the Jock River, 2004-2009 and 2010-2015
Monitoring Site JR-12
E. coli counts at site JR-12 were occasionally elevated. The proportion of samples below the guideline decreased from 69 percent (Figure 9) from 2004-2009 to 52 percent (Figure 10) from 2010-2015. The geometric mean also increased between the two monitoring periods from 61 CFU/100ml to 91 CFU/100ml (Table 6).
Figure 9 Geometric mean of E. coli results in the Jock River, 2004-2009
Figure 10 Geometric mean of E. coli results in the Jock River, 2010-2015
Summary
Bacterial contamination does not appear to be a significant problem in this reach of the Jock River, however due to the apparent increase in counts between the two time periods it should be given greater concern. Best management practices such as enhancing shoreline buffers, restricting livestock access and minimizing storm water runoff can help to protect this reach of the Jock River into the future.
1 No Ontario guideline for TKN is presently available; however, waters not influenced by excessive organic inputs typically range from 0.100 to 0.500 mg/l, Environment Canada (1979) Water Quality Sourcebook, A Guide to Water Quality Parameters, Inland Waters Directorate, Water Quality Branch, Ottawa, Canada
2A type of mean or average, which indicates the central tendency or typical value of a set of numbers by using the product of their values (as opposed to the arithmetic mean which uses their sum). It is often used to summarize a variable that varies over several orders of magnitude, such as E. coli counts
3.0 Jock River-Richmond Catchment: Riparian Conditions
The stream characterization program surveyed the Jock River and Marlborough Creek in the Richmond catchment area. Marlborough Creek is a tributary of the Jock River that enters the Jock River from the south immediately downstream of Eagleson Road. Results for both systems have been summarized separately for each indicator.
3.1 Jock River Overbank Zone
3.1.1 Riparian Buffer Width Evaluation
Figures 11 and 12 demonstrate the buffer conditions along the left and right banks of the Jock River and Marlborough Creek. The Jock River in the Richmond catchment had a buffer of greater than 30 meters along 88 percent of the right bank and 87 percent of the left bank. A five meter or less buffer was present along only three percent of its right and left banks. Marlborough Creek had a buffer of greater than 30 meters along 99 percent of both the right and left banks. A five meter or less buffer was present along one percent of its right and left banks.
Figure 11 Riparian Buffer Evaluation along the Jock River in the Richmond catchment
Figure 12 Riparian Buffer Evaluation along Marlborough Creek in the Richmond catchment
3.1.2 Riparian Buffer Alterations
Alterations within the riparian buffer were assessed within three distinct shoreline zones (0-5m, 5-15m, 15-30m), and evaluated based on the dominant vegetative community and/or land cover type (Figure 13). The riparian buffer zone along the Jock River within the Richmond catchment was found to have variable conditions along the corridor. These alterations were generally associated with reduced shoreline buffers and residential/agricultural land use. Marlborough Creek is fairly uniform with conditions being predominantly natural.
Figure 13 Riparian buffer alterations along the Jock River and Marlborough Creek in the Richmond catchment
3.1.3 Adjacent Land Use
The RVCA’s Stream Characterization Program identifies eight different land uses beside the Jock River in the Richmond catchment (Figure 14). Surrounding land use is considered from the beginning to end of the survey section (100m) and up to 100m on each side of the river. Land use outside of this area is not considered for the surveys but is nonetheless part of the subwatershed and will influence the creek. Natural areas made up 74 percent of the stream, characterized by forest, scrubland, meadow and wetland. Forest habitat was dominant in the adjacent lands along the Jock River in the Richmond catchment at 51 percent. The remaining land use consisted of active agriculture, abandoned agriculture, residential and recreational.
Figure 14 Land Use along Jock River in the Richmond catchment
Natural areas made up 93 percent of Marlborough Creek characterized by forest, scrubland, meadow and wetland. Wetland habitat was dominant in the adjacent lands along Marlborough Creek at 44 percent. The remaining land use consisted of active agriculture, residential, infrastructure and industrial/commercial (Figure 15).
Figure 15 Land Use along Marlborough Creek in the Richmond catchment
3.2 Jock River Shoreline Zone
3.2.1 Instream Erosion
Stream erosion is the process by which water erodes and transports sediments, resulting in dynamic flows and diverse habitat conditions. Excessive erosion can result in drastic environmental changes, as habitat conditions, water quality and aquatic life are all negatively affected. Bank stability was assessed as the overall extent of each section with “unstable” shoreline conditions. These conditions are defined by the presence of significant exposed soils/roots, minimal bank vegetation, severe undercutting, slumping or scour and potential failed erosion measures. Figure 16 shows low levels of erosion along the Jock River and Marlborough Creek in the Richmond catchment.
Figure 16 Erosion along the Jock River and Marlborough Creek in the Richmond catchment
3.2.2 Undercut Stream Banks
Stream bank undercuts can provide excellent cover habitat for aquatic life, however excessive levels can be an indication of unstable shoreline conditions. Bank undercut was assessed as the overall extent of each surveyed section with overhanging bank cover present. Figure 17 shows that Jock River in the Richmond catchment had low to high levels of undercut banks along the system. Marlborough Creek had no undercut banks along most of the system with the exception of a few sections in the upper reach with low to moderate levels of undercut banks.
Figure 17 Undercut stream banks along the Jock River and Marlborough Creek in the Richmond catchment
3.2.3 Stream Shading
Grasses, shrubs and trees all contribute towards shading a stream. Shade is important in moderating stream temperature, contributing to food supply and helping with nutrient reduction within a stream. Stream cover is assessed as the total coverage area in each section that is shaded by overhanging trees/grasses and tree canopy, at greater than 1m above the water surface. Figure 18 shows low to moderate levels of stream shading dominate conditions in most reaches of the Jock River in the Richmond catchment. Marlborough Creek had high levels of stream shading along much of the system.
Figure 18 Stream shading along Jock River and Marlborough Creek in the Richmond catchment
3.2.4 Instream Woody Debris
Figure 19 shows that the majority of the Jock River and Marlborough Creek in the Richmond catchment had low levels of instream woody debris in the form of branches and trees. Instream woody debris is important for fish and benthic invertebrate habitat, by providing refuge and feeding areas.
Figure 19 Instream woody debris along the Jock River and Marlborough Creek in the Richmond catchment
3.2.5 Overhanging Trees and Branches
Trees and branches that are less than one meter from the surface of the water are defined as overhanging. Overhanging branches and trees provide a food source, nutrients and shade which helps to moderate instream water temperatures. Figure 20 shows that both systems are highly variable with low to high levels of overhanging branches and trees in the Richmond catchment.
Figure 20 Overhanging trees and branches along the Jock River and Marlborough Creek in the Richmond catchment
3.2.6 Anthropogenic Alterations
Stream alterations are classified based on specific functional criteria associated with the flow conditions, the riparian buffer and potential human influences. Figure 21 shows 62 percent of the Jock River in the Richmond catchment remains “unaltered” with no anthropogenic alterations. Thirty seven percent of Jock River in the Richmond catchment was classified as natural with minor anthropogenic changes and two percent was considered altered. The alterations along the Jock River in this reach were in the form of reduced buffers, shoreline modifications and road crossings.
Figure 21 Anthropogenic alterations along the Jock River in the Richmond catchment
Figure 22 shows 80 percent of Marlborough Creek remains “unaltered” with no anthropogenic alterations. Twenty percent of Marlborough Creek was classified as natural with minor anthropogenic changes. There were minimal anthropogenic alterations observed along the system.
Figure 22 Anthropogenic alterations along Marlborough Creek in the Richmond catchment
3.3 Jock River/Marlborough Creek Instream Aquatic Habitat
3.3.1 Benthic Invertebrates
Freshwater benthic invertebrates are animals without backbones that live on the stream bottom and include crustaceans such as crayfish, molluscs and immature forms of aquatic insects. Benthos represent an extremely diverse group of aquatic animals and exhibit wide ranges of responses to stressors such as organic pollutants, sediments and toxicants, which allows scientists to use them as bioindicators. As part of the Ontario Benthic Biomonitoring Network (OBBN), the RVCA has been collecting benthic invertebrates at the Ottawa River site on the Jock River since 2004. Monitoring data is analyzed for each sample site and the results are presented using the Family Biotic Index, Family Richness and percent Ephemeroptera, Plecoptera and Trichoptera.
Hilsenhoff Family Biotic Index
The Hilsenhoff Family Biotic Index (FBI) is an indicator of organic and nutrient pollution and provides an estimate of water quality conditions for each site using established pollution tolerance values for benthic invertebrates. FBI results for the Jock River Richmond catchment sample location at Ottawa street are separated by reporting period 2004 to 2009 and 2010 to 2015. “Fair” to “Poor” water quality conditions being observed at the Jock River Richmond sample location for the period from 2004 to 2015 (Figure 23) using a grading scheme developed by Conservation Authorities in Ontario for benthic invertebrates.
Figure 23 Hilsenhoff Family Biotic Index at the Jock River Ottawa Street sample location
Family Richness
Family Richness measures the health of the community through its diversity and increases with increasing habitat diversity suitability and healthy water quality conditions. Family Richness is equivalent to the total number of benthic invertebrate families found within a sample. The Jock River Richmond site is reported to have “Fair” family richness (Figure 24).
Figure 24 Family Richness at the Jock River Ottawa Street sample location
EPT
Ephemeroptera (Mayflies), Plecoptera (Stoneflies), and Trichoptera (Caddisflies) are species considered to be very sensitive to poor water quality conditions. High abundance of these organisms is generally an indication of good water quality conditions at a sample location. The EPT indicates that the Jock River Richmond sample location is reported to have “Fairly poor” water quality (Figure 25) from 2004 to 2015.
Figure 25 EPT at the Jock River Ottawa Street sample location
Conclusion
Overall the Jock River Richmond catchment sample location aquatic habitat conditions from a benthic invertebrate perspective is considered “Fairly Poor” from 2004 to 2015 as the samples are dominated by species that are moderately sensitive and sensitive to high organic pollution levels.
3.3.2 Habitat Complexity
Habitat complexity is a measure of the overall diversity of habitat types and features within a stream. Streams with high habitat complexity support a greater variety of species niches, and therefore contribute to greater diversity. Factors such as substrate, flow conditions (pools, riffles) and cover material (vegetation, wood structure, etc.) all provide crucial habitat to aquatic life. Habitat complexity is assessed based on the presence of boulder, cobble and gravel substrates, as well as the presence of instream woody material.
Diverse habitat cover was identified throughout the Jock River Richmond reach and Marlborough Creek, with considerable coverage across the surveyed stream (Figure 26). Many of these sections represent potentially crucial habitat for resident species. Regions with reduced habitat complexity were observed in the lower reaches for both systems within the catchment.
Figure 26 Habitat complexity along the Jock River and Marlborough Creek in the Richmond catchment
3.3.3 Instream Substrate
Diverse substrate is important for fish and benthic invertebrate habitat because some species have specific substrate requirements and for example will only reproduce on certain types of substrate. The absence of diverse substrate types may limit the overall diversity of species within a stream. Figure 27 shows that cobble was present within 75% of the sections, gravel was present at 73% and boulders were present in 69% of surveyed sections. Overall substrate conditions were diverse along the Jock River Richmond reach.
Figure 27 Instream substrate along the Jock River in the Richmond catchment
Figure 28 shows the types of substrate present along Marlborough Creek. Silt was observed within 98% of the sections, clay was present at 80% and boulders were present in 63% of surveyed sections. Cobble was present at 58% of the sections, while gravel was observed at 25% of the sections. Overall there was less diversity in Marlborough Creek than in the Jock River in the Richmond catchment.
Figure 28 Instream substrate along Marlborough Creek in the Richmond catchment
Figure 29 shows the dominant substrate type observed for each section surveyed along the Jock River and Marlborough Creek in the Richmond catchment.
Figure 29 Dominant substrate type along the Jock River and Marlborough Creek in the Richmond catchment
3.3.4 Instream Morphology
Pools and riffles are important habitat features for aquatic life. Riffles are fast flowing areas characterized by agitation and overturn of the water surface. Riffles thereby play a crucial role in contributing to dissolved oxygen conditions and directly support spawning for some fish species. They are also areas that support high benthic invertebrate populations which are an important food source for many aquatic species. Pools are characterized by minimal flows, with relatively deep water and winter and summer refuge habitat for aquatic species. Runs are moderately shallow, with unagitated surfaces of water and areas where the thalweg (deepest part of the channel) is in the center of the channel. Figure 30 shows that the Jock River is fairly diverse; 76 percent consists of runs, 20 percent riffles and four percent pools.
Figure 30 Instream morphology along the Jock River in the Richmond catchment
Figure 31 shows that Marlborough Creek is fairly diverse; 50 percent consists of pools, 45 percent runs and five percent riffles.
Figure 31 Instream morphology along Marlborough Creek in the Richmond catchment
Figure 32 shows where the riffle habitat areas were observed along the Jock River and Marlborough Creek in the Richmond catchment.
Figure 32 Riffle habitat locations along the Jock River and Marlborough Creek in the Richmond catchment
3.3.5 Vegetation Type
Instream vegetation provides a variety of functions and is a critical component of the aquatic ecosystem. Aquatic plants promote stream health by:
- Providing direct riparian/instream habitat
- Stabilizing flows reducing shoreline erosion
- Contributing to dissolved oxygen through photosynthesis
- Maintaining temperature conditions through shading
For example emergent plants along the shoreline can provide shoreline protection from wave action and important rearing habitat for species of waterfowl. Submerged plants provide habitat for fish to find shelter from predator fish while they feed. Floating plants such as water lilies shade the water and can keep temperatures cool while reducing algae growth. Narrow leaved emergents were present at 88% of the sections surveyed, algae was observed in 90% of sections, while free floating plants were observed in 62% of surveyed sections. Broad leaved emergents were observed in 77% of sections, submerged plants in 83%, floating plants in 63% and robust emergents in 19% of sections surveyed. Figure 33 depicts the plant community structure for the Jock River Richmond catchment.
Figure 33 Vegetation type along the Jock River in the Richmond catchment
Algae was observed in 100% of sections, narrow leaved emergents were present at 93% of the sections surveyed, while free floating plants were observed in 60% of the Marlborough Creek surveyed sections. Broad leaved emergents were observed in 68% of sections, submerged plants in 78%, floating plants in 80% and robust emergents in 50% of sections surveyed. Figure 35 depicts the plant community structure for Marlborough Creek.
Figure 34 Vegetation type along Marlborough Creek in the Richmond catchment
Figure 35 Dominant vegetation type along the Jock River and Marlborough Creek in the Richmond catchment
3.3.6 Instream Vegetation Abundance
Instream vegetation is an important factor for a healthy stream ecosystem. Vegetation helps to remove contaminants from the water, contributes oxygen to the stream, and provides habitat for fish and wildlife. Too much vegetation can also be detrimental. Figure 36 demonstrates that the Jock River Richmond reach had normal to common levels of vegetation recorded at 55 percent of stream surveys. Low to rare levels of vegetation were observed at 40% of the stream sections.
Figure 36 Instream vegetation abundance along the Jock River in the Richmond catchment
Figure 37 demonstrates that Marlborough Creek had normal to common levels of vegetation recorded at 32 percent of stream surveys. Extensive levels of vegetation was observed at 62% of the stream sections and was consistent with areas dominated by the invasive aquatic plant European frogbit.
Figure 37 Instream vegetation abundance along Marlborough Creek in the Richmond catchment
3.3.7 Invasive Species
Invasive species can have major implications on streams and species diversity. Invasive species are one of the largest threats to ecosystems throughout Ontario and can out compete native species, having negative effects on local wildlife, fish and plant populations. Sixty nine percent of the sections surveyed along the Jock River Richmond reach had invasive species, while 100 percent of Marlborough Creek had invasive species (Figure 38). The invasive species observed in the Jock River were European frogbit, purple loosestrife, poison/wild parsnip, banded mystery snail, Himalayan balsam, yellow iris, Phragmites and Manitoba maple. The invasive species observed in Marlborough Creek were European frogbit, European/Black alder, purple loosestrife, poison/wild parsnip, common/glossy buckthorn, banded mystery snail, garlic mustard and Manitoba maple. Invasive species abundance (i.e. the number of observed invasive species per section) was assessed to determine the potential range/vector of many of these species (Figure 38).

Figure 38 Invasive species abundance along the Jock River and Marlborough Creek in the Richmond catchment
3.3.8 Water Chemistry
During the stream characterization survey, a YSI probe is used to collect water chemistry information. Dissolved oxygen (DO), specific conductivity (SPC) and pH are measured at the start and end of each section.
3.3.8.1 Dissolved Oxygen
Dissolved oxygen is a measure of the amount of oxygen dissolved in water. The Canadian Environmental Quality Guidelines of the Canadian Council of Ministers of the Environment (CCME) suggest that for the protection of aquatic life the lowest acceptable dissolved oxygen concentration should be 6 mg/L for warmwater biota and 9.5 mg/L for coldwater biota (CCME, 1999). Figure 39 shows that the dissolved oxygen in the Jock River Richmond catchment was below the threshold for warmwater biota in the upper sections of this reach of the system. The average dissolved oxygen levels observed in the Jock River was 7.91 mg/L which is within the recommended levels for warm and cool water biota (Figure 39).
Figure 39 Dissolved oxygen ranges in the Jock River in the Richmond catchment
The average dissolved oxygen levels observed within Marlborough Creek was 7.68 mg/L which is within the recommended levels for warm and cool water biota (Figure 40).
Figure 40 Dissolved oxygen ranges in Marlborough Creek in the Richmond catchment
3.3.8.2 Conductivity
Conductivity in streams is primarily influenced by the geology of the surrounding environment, but can vary drastically as a function of surface water runoff. Currently there are no CCME guideline standards for stream conductivity; however readings which are outside the normal range observed within the system are often an indication of unmitigated discharge and/or stormwater input. The average conductivity observed within the main stem of Jock River in the Richmond catchment was 480.15 µs/cm (Figure 41).
Figure 41 Specific conductivity ranges in the Jock River in the Richmond catchment
Average conductivity observed within Marlborough Creek in the Richmond catchment was 964.41 µs/cm (Figure 42). These levels would be considered higher than most systems in the Jock River watershed.
Figure 42 Specific conductivity ranges in Marlborough Creek in the Richmond catchment
3.3.8.3 pH
Based on the PWQO for pH, a range of 6.5 to 8.5 should be maintained for the protection of aquatic life. Average pH values for the Jock River in the Richmond catchment averaged 7.97 (Figure 43).
Figure 43 pH ranges in the Jock River in the Richmond catchment
Average pH values averaged 7.91 for Marlborough Creek thereby meeting the provincial standard (Figure 44).
Figure 44 pH ranges in Marlborough Creek in the Richmond catchment
3.3.8.4 Oxygen Saturation
Oxygen saturation is measured as the ratio of dissolved oxygen relative to the maximum amount of oxygen that will dissolve based on the temperature and atmospheric pressure. Well oxygenated water will stabilize at or above 100% saturation, however the presence of decaying matter/pollutants can drastically reduce these levels. Oxygen input through photosynthesis has the potential to increase saturation above 100% to a maximum of 500%, depending on the productivity level of the environment. In order to represent the relationship between concentration and saturation, the measured values have been summarized into 6 classes:
- <100% Saturation / <6.0 mg/L Concentration. Oxygen concentration and saturation are not sufficient to support aquatic life and may represent impairment
- >100% Saturation / <6.0 mg/L Concentration. Oxygen concentration is not sufficient to support aquatic life, however saturation levels indicate that the water has stabilized at its estimated maximum. This is indicative of higher water temperatures and stagnant flows.
- <100% Saturation / 6.0-9.5 mg/L Concentration. Oxygen concentration is sufficient to support warm water biota, however depletion factors are likely present and are limiting maximum saturation.
- >100% Saturation / 6.0-9.5 mg/L Concentration. Oxygen concentration and saturation levels are optimal for warm water biota.
- <100% Saturation / >9.5 mg/L Concentration. Oxygen concentration is sufficient to support cold water biota, however depletion factors are likely present and are limiting maximum saturation.
- 6) >100% Saturation / >9.5 mg/L Concentration. Oxygen concentration and saturation levels are optimal for coldwater biota.
 and saturation (%) on the Jock River and Marlborough Creek in the Richmond catchment")
Figure 45 A bivariate assessment of dissolved oxygen concentration (mg/L) and saturation (%) on the Jock River and Marlborough Creek in the Richmond catchment
Dissolved oxygen conditions on the Jock River and Marlborough Creek in the Richmond catchment are highly variable with areas that are sufficient to support a mixed community; while certain sections had levels that were insufficient to support warm and coldwater biota (Figure 45).
3.3.8.5 Specific Conductivity
Specific conductivity (SPC) is a standardized measure of electrical conductance, collected at or corrected to a water temperature of 25⁰C. SPC is directly related to the concentration of ions in water, and is commonly influenced by the presence of dissolved salts, alkalis, chlorides, sulfides and carbonate compounds. The higher the concentration of these compounds, the higher the conductivity. Common sources of elevated conductivity include storm water, agricultural inputs and commercial/industrial effluents.
In order to summarize the conditions observed, SPC levels were evaluated as either normal, moderately elevated or highly elevated. These categories correspond directly to the degree of variation (i.e. standard deviation) at each site relative to the average across the system.
Normal levels were maintained along the lower sections of the Jock River and Marlborough Creek in the Richmond catchment, with moderately elevated levels observed in the upper reaches of both systems (Figure 46).
Figure 46 Relative specific conductivity levels on the Jock River and Marlborough Creek in the Richmond catchment
3.3.9 Thermal Regime
Many factors can influence fluctuations in stream temperature, including springs, tributaries, precipitation runoff, discharge pipes and stream shading from riparian vegetation. Water temperature is used along with the maximum air temperature (using the Stoneman and Jones method) to classify a watercourse as either warm water, cool water or cold water. Figure 47 shows where the thermal sampling sites were located along Jock River and Marlborough Creek. Analysis of the data collected indicates that Jock River in the Richmond catchment is classified as a warm water system with cool to warm water reaches (Figure 48). Marlborough Creek is classified as a warm water system with cool to warm water reaches (Figure 49).
Figure 47 Temperature logger locations on the Jock River and Marlborough Creek in the Richmond catchment
Figure 48 Temperature logger data for three sites on Jock River in the Richmond catchment
Figure 49 Temperature logger data for the site on Marlborough Creek
Each point on the graph represents a temperature that meets the following criteria:
- Sampling dates between July 1st and September 7th
- Sampling date is preceded by two consecutive days above 24.5 °C, with no rain
- Water temperatures are collected at 4pm
- Air temperature is recorded as the max temperature for that day
3.3.10 Groundwater
Groundwater discharge areas can influence stream temperature, contribute nutrients, and provide important stream habitat for fish and other biota. During stream surveys, indicators of groundwater discharge are noted when observed. Indicators include: springs/seeps, watercress, iron staining, significant temperature change and rainbow mineral film. Figure 50 shows areas where one or more of the above groundwater indicators were observed during stream surveys and headwater assessments.
Figure 50 Groundwater indicators observed in the Richmond catchment
3.3.11 Fish Community
The Jock River Richmond catchment is classified as a mixed community of warm and cool water recreational and baitfish fishery with 39 species observed. Figure 51 shows the sampling locations along the Jock River and Marlborough Creek in the Richmond catchment.
Figure 51 Jock River and Marlborough Creek fish community in the Richmond catchment
The following table contains a list of species observed in the watershed.
Table 7 Fish species observed in Jock River Richmond catchment
Walleye and smallmouth bass captured at the Jock River embayment at the Richmond Conservation Area
Northern pike captured in the Jock River embayment at the Richmond Conservation Area
3.3.12 Migratory Obstructions
It is important to know locations of migratory obstructions because these can prevent fish from accessing important spawning and rearing habitat. Migratory obstructions can be natural or manmade, and they can be permanent or seasonal. Figure 52 shows that Jock River in the Richmond catchment had one weir which is a seasonal barrier known as the Richmond weir at the time of the survey in 2015. One debris dam was observed on Marlborough Creek at the timeof the survey in 2015.
Figure 52 Migratory obstructions along Jock River in the Richmond catchment
3.3.13 Riparian Restoration
Figure 53 depicts the locations of various riparian restoration opportunities as a result of observations made during the stream survey and headwater drainage feature assessments.
Figure 53 Riparian restoration opportunities along the Jock River and Marlborough Creek in the Richmond catchment
3.3.14 Instream Restoration
Figure 54 depicts the locations of various instream restoration opportunities as a result of observations made during the stream survey and headwater drainage feature assessments.
Figure 54 Instream restoration opportunities along the Jock River and Marlborough Creek in the Richmond catchment
3.4 Headwater Drainage Feature Assessment
3.4.1 Headwater Sampling
The RVCA Stream Characterization program assessed Headwater Drainage Features for the Jock River subwatershed in 2015. This protocol measures zero, first and second order headwater drainage features (HDF). It is a rapid assessment method characterizing the amount of water, sediment transport, and storage capacity within headwater drainage features (HDF). RVCA is working with other Conservation Authorities and the Ministry of Natural Resources and Forestry to implement the protocol with the goal of providing standard datasets to support science development and monitoring of headwater drainage features. An HDF is a depression in the land that conveys surface flow. Additionally, this module provides a means of characterizing the connectivity, form and unique features associated with each HDF (OSAP Protocol, 2013). In 2015 the program sampled 9 sites at road crossings in the Jock River Richmond catchment area (Figure 55).

Figure 55 Locations of the headwater sampling sites in the Jock River Richmond catchment
3.4.2 Headwater Feature Type
The headwater sampling protocol assesses the feature type in order to understand the function of each feature. The evaluation includes the following classifications: defined natural channel, channelized or constrained, multi-thread, no defined feature, tiled, wetland, swale, roadside ditch and pond outlet. By assessing the values associated with the headwater drainage features in the catchment area we can understand the ecosystem services that they provide to the watershed in the form of hydrology, sediment transport, and aquatic and terrestrial functions. Three features were classified as having been tiled, two were channelized, one feature was identified as a roadside drainage features, one was classified as a wetland and two feature were classified as natural. Figure 56 shows the feature type of the primary feature at the sampling locations.
Figure 56 Headwater feature types in the Jock River Richmond catchment
3.4.3 Headwater Feature Flow
The observed flow condition within headwater drainage features can be highly variable depending on timing relative to the spring freshet, recent rainfall, soil moisture, etc. Flow conditions are assessed in the spring and in the summer to determine if features are perennial and flow year round, if they are intermittent and dry up during the summer months or if they are ephemeral systems that do not flow regularly and generally respond to specific rainstorm events or snowmelt. Flow conditions in headwater systems can change from year to year depending on local precipitation patterns. Figure 57 shows the observed flow conditions at the sampling locations in the Jock River Richmond catchment in 2015.
Figure 57 Headwater feature flow conditions in the Jock River Richmond catchment
A spring photo of the headwater sample site in the Jock River Richmond catchment located on Joy’s Road
A summer photo of the headwater sample site in the Jock River Richmond catchment located on Joy’s Road
3.4.4 Headwater Feature Channel Modifications
Channel modifications were assessed at each headwater drainage feature sampling location. Modifications include channelization, dredging, hardening and realignments. The Jock River Richmond catchment area had three sites classified as having no channel modifications, four features were classified as being dredged and two had mixed modifications. Figure 58 shows the channel modifications observed at the sampling locations for Jock River Richmond.
Figure 58 Headwater feature channel modifications in the Jock River Richmond catchment
3.4.5 Headwater Feature Vegetation
Headwater feature vegetation evaluates the type of vegetation that is found within the drainage feature. The type of vegetated within the channel influences the aquatic and terrestrial ecosystem values that the feature provides. For some types of headwater features the vegetation within the feature plays a very important role in flow and sediment movement and provides wildlife habitat. The following classifications are evaluated no vegetation, lawn, wetland, meadow, scrubland and forest. Figure 59 depicts the dominant vegetation observed at the sampled headwater sites in the Jock River Richmond catchment.
Figure 59 Headwater feature vegetation types in the Jock River Richmond catchment
3.4.6 Headwater Feature Riparian Vegetation
Headwater riparian vegetation evaluates the type of vegetation that is found along the adjacent lands of a headwater drainage feature. The type of vegetation within the riparian corridor influences the aquatic and terrestrial ecosystem values that the feature provides to the watershed. Figure 60 depicts the type of riparian vegetation observed at the sampled headwater sites in the Jock River Richmond catchment.
Figure 60 Headwater feature riparian vegetation types in the Jock River Richmond catchment
3.4.7 Headwater Feature Sediment Deposition
Assessing the amount of recent sediment deposited in a channel provides an index of the degree to which the feature could be transporting sediment to downstream reaches (OSAP, 2013). Evidence of excessive sediment deposition might indicate the requirement to follow up with more detailed targeted assessments upstream of the site location to identify potential best management practices to be implemented. Conditions ranged from minimal to extensive deposition recorded. Figure 61 depicts the degree of sediment deposition observed at the sampled headwater sites in the Jock River Richmond catchment.
Figure 61 Headwater feature sediment deposition in the Jock River Richmond catchment
3.4.8 Headwater Feature Upstream Roughness
Feature roughness will provide a measure of the amount of materials within the bankfull channel that could slow down the velocity of water flowing within the headwater feature (OSAP, 2013). Materials on the channel bottom that provide roughness include vegetation, woody debris and boulders/cobble substrates. Roughness can provide benefits in mitigating downstream erosion on the headwater drainage feature and the receiving watercourse by reducing velocities. Roughness also provides important habitat conditions to aquatic organisms. The sample locations in the Jock River Richmond catchment area ranged from minimal to extreme roughness conditions. Figure 62 shows the feature roughness conditions at the sampling locations in the Jock River Richmond catchment.
Figure 62 Headwater feature roughness in the Jock River Richmond catchment
4.0 Jock River-Richmond Catchment: Land Cover
Land cover and any change in coverage that has occurred over a six-year period is summarized for the Jock River-Richmond catchment using spatially continuous vector data representing the catchment during the spring of 2008 and 2014. This dataset was developed by the RVCA through heads-up digitization of 20cm DRAPE ortho-imagery at a 1:4000 scale and details the surrounding landscape using 10 land cover classes.
4.1 Richmond Catchment Change
As shown in Table 8 and Figure 1, the dominant land cover type in 2014 was crop and pastureland.
Table 8 Land cover (2008 vs. 2014) in the Richmond catchment
* Does not include treed swamps ** Includes treed swamps
From 2008 to 2014, there was an overall change of 134 hectares (from one land cover class to another). Most of the change in the Richmond catchment is a result of the conversion of wetland and woodland and areas of meadow-thicket to crop and pastureland (Figure 63).
Figure 63 Land cover change in the Richmond catchment
Table 9 provides a detailed breakdown of all land cover change that has taken place in the Richmond catchment between 2008 and 2014.
Table 9 Land cover change in the Richmond catchment (2008 to 2014)
4.2 Woodland Cover
In the Environment Canada Guideline (Third Edition) entitled “How Much Habitat Is Enough?” (hereafter referred to as the “Guideline”) the opening narrative under the Forest Habitat Guidelines section states that prior to European settlement, forest was the predominant habitat in the Mixedwood Plains ecozone. The remnants of this once vast forest now exist in a fragmented state in many areas (including the Rideau Valley watershed) with woodland patches of various sizes distributed across the settled landscape along with higher levels of forest cover associated with features such as the Frontenac Axis (within the on-Shield areas of the Rideau Lakes and Tay River subwatersheds). The forest legacy, in terms of the many types of wildlife species found, overall species richness, ecological functions provided and ecosystem complexity is still evident in the patches and regional forest matrices (found in the Jock River subwatershed and elsewhere in the Rideau Valley watershed). These ecological features are in addition to other influences which forests have on water quality and stream hydrology including reducing soil erosion, producing oxygen, storing carbon along with many other ecological services that are essential not only for wildlife but for human well-being.
The Guideline also notes that forests provide a great many habitat niches that are in turn occupied by a great diversity of plant and animal species. They provide food, water and shelter for these species - whether they are breeding and resident locally or using forest cover to help them move across the landscape. This diversity of species includes many that are considered to be species at risk. Furthermore, from a wildlife perspective, there is increasing evidence that the total forest cover in a given area is a major predictor of the persistence and size of bird populations, and it is possible or perhaps likely that this pattern extends to other flora and fauna groups. The overall effect of a decrease in forest cover on birds in fragmented landscapes is that certain species disappear and many of the remaining ones become rare, or fail to reproduce, while species adapted to more open and successional habitats, as well as those that are more tolerant to human-induced disturbances in general, are able to persist and in some cases thrive. Species with specialized-habitat requirements are most likely to be adversely affected. The overall pattern of distribution of forest cover, the shape, area and juxtaposition of remaining forest patches and the quality of forest cover also play major roles in determining how valuable forests will be to wildlife and people alike.
The current science generally supports minimum forest habitat requirements between 30 and 50 percent, with some limited evidence that the upper limit may be even higher, depending on the organism/species phenomenon under investigation or land-use/resource management planning regime being considered/used.
As shown in Figure 64, 17 percent of the Richmond catchment contains 505 hectares of upland forest and 46 hectares of lowland forest (treed swamps) versus the 26 percent of woodland cover in the Jock River subwatershed. This is less than the 30 percent of forest cover that is identified as the minimum threshold required to sustain forest birds according to the Guideline and which may only support less than one half of potential species richness and marginally healthy aquatic systems. When forest cover drops below 30 percent, forest birds tend to disappear as breeders across the landscape.
Figure 64 Woodland cover and forest interior (2014)
4.2.1 Woodland (Patch) Size
According to the Ministry of Natural Resources’ Natural Heritage Reference Manual (Second Edition), larger woodlands are more likely to contain a greater diversity of plant and animal species and communities than smaller woodlands and have a greater relative importance for mobile animal species such as forest birds.
Bigger forests often provide a different type of habitat. Many forest birds breed far more successfully in larger forests than they do in smaller woodlots and some rely heavily on forest interior conditions. Populations are often healthier in regions with more forest cover and where forest fragments are grouped closely together or connected by corridors of natural habitat. Small forests support small numbers of wildlife. Some species are “area-sensitive” and tend not to inhabit small woodlands, regardless of forest interior conditions. Fragmented habitat also isolates local populations, especially small mammals, amphibians and reptiles with limited mobility. This reduces the healthy mixing of genetic traits that helps populations survive over the long run (Conserving the Forest Interior. Ontario Extension Notes, 2000).
The Environment Canada Guideline also notes that for forest plants that do not disperse broadly or quickly, preservation of some relatively undisturbed large forest patches is needed to sustain them because of their restricted dispersal abilities and specialized habitat requirements and to ensure continued seed or propagation sources for restored or regenerating areas nearby.
The Natural Heritage Reference Manual continues by stating that a larger size also allows woodlands to support more resilient nutrient cycles and food webs and to be big enough to permit different and important successional stages to co-exist. Small, isolated woodlands are more susceptible to the effects of blowdown, drought, disease, insect infestations, and invasions by predators and non-indigenous plants. It is also known that the viability of woodland wildlife depends not only on the characteristics of the woodland in which they reside, but also on the characteristics of the surrounding landscape where the woodland is situated. Additionally, the percentage of forest cover in the surrounding landscape, the presence of ecological barriers such as roads, the ability of various species to cross the matrix surrounding the woodland and the proximity of adjacent habitats interact with woodland size in influencing the species assemblage within a woodland.
In the Richmond catchment (in 2014), sixty-four (54 percent) of the 119 woodland patches are very small, being less than one hectare in size. Another 50 (42 percent) of the woodland patches ranging from one to less than 20 hectares in size tend to be dominated by edge-tolerant bird species. The remaining five (four percent of) woodland patches range between 22 and 86 hectares in size. and may support a few area-sensitive species and some edge intolerant species, but will be dominated by edge tolerant species. No patch exceeds the 100 plus hectare size needed to support most forest dependent, area sensitive birds and which are large enough to support approximately 60 percent of edge-intolerant species. No patch tops 200 hectares, which according to the Environment Canada Guideline will support 80 percent of edge-intolerant forest bird species (including most area sensitive species) that prefer interior forest habitat conditions.
Table 10 presents a comparison of woodland patch size in 2008 and 2014 along with any changes that have occurred over that time. A decrease (of 78 ha) has been observed in the overall woodland patch area between the two reporting periods with most change occurring in the 50 to 100 hectare woodland patch size class range.
Table 10 Woodland patches in the Richmond catchment (2008 and 2014)
*Includes treed swamps
4.2.2 Woodland (Forest) Interior Habitat
The forest interior is habitat deep within woodlands. It is a sheltered, secluded environment away from the influence of forest edges and open habitats. Some people call it the “core” or the “heart” of a woodland. The presence of forest interior is a good sign of woodland health, and is directly related to the woodland’s size and shape. Large woodlands with round or square outlines have the greatest amount of forest interior. Small, narrow woodlands may have no forest interior conditions at all. Forest interior habitat is a remnant natural environment, reminiscent of the extensive, continuous forests of the past. This increasingly rare forest habitat is now a refuge for certain forest-dependent wildlife; they simply must have it to survive and thrive in a fragmented forest landscape (Conserving the Forest Interior. Ontario Extension Notes, 2000).
The Natural Heritage Reference Manual states that woodland interior habitat is usually defined as habitat more than 100 metres from the edge of the woodland and provides for relative seclusion from outside influences along with a moister, more sheltered and productive forest habitat for certain area sensitive species. Woodlands with interior habitat have centres that are more clearly buffered against the edge effects of agricultural activities or more harmful urban activities than those without.
In the Richmond catchment (in 2014), the 119 woodland patches contain 15 forest interior patches (Figure 64) that occupy two percent (55 ha.) of the catchment land area (which is less than the three percent of interior forest in the Jock River Subwatershed). This is below the ten percent figure referred to in the Environment Canada Guideline that is considered to be the minimum threshold for supporting edge intolerant bird species and other forest dwelling species in the landscape.
Most patches (13) have less than 10 hectares of interior forest, nine of which have small areas of interior forest habitat less than one hectare in size. The remaining two patches contain 18 and 23 hectares of interior forest. Between 2008 and 2014, there has been a change in the number of woodland patches containing smaller areas of interior habitat with an overall loss of seven hectares in the catchment (Table11), suggesting an increase in forest fragmentation over the six year period.
Table 11 Woodland interior in the Richmond catchment (2008 and 2014)
4.3 Wetland Cover
Wetlands are habitats forming the interface between aquatic and terrestrial systems. They are among the most productive and biologically diverse habitats on the planet. By the 1980s, according to the Natural Heritage Reference Manual, 68 percent of the original wetlands south of the Precambrian Shield in Ontario had been lost through encroachment, land clearance, drainage and filling.
Wetlands perform a number of important ecological and hydrological functions and provide an array of social and economic benefits that society values. Maintaining wetland cover in a watershed provides many ecological, economic, hydrological and social benefits that are listed in the Reference Manual and which may include:
- contributing to the stabilization of shorelines and to the reduction of erosion damage through the mitigation of water flow and soil binding by plant roots
- mitigating surface water flow by storing water during periods of peak flow (such as spring snowmelt and heavy rainfall events) and releasing water during periods of low flow (this mitigation of water flow also contributes to a reduction of flood damage)
- contributing to an improved water quality through the trapping of sediments, the removal and/or retention of excess nutrients, the immobilization and/or degradation of contaminants and the removal of bacteria
- providing renewable harvesting of timber, fuel wood, fish, wildlife and wild rice
- contributing to a stable, long-term water supply in areas of groundwater recharge and discharge
- providing a high diversity of habitats that support a wide variety of plants and animals
- acting as “carbon sinks” making a significant contribution to carbon storage
- providing opportunities for recreation, education, research and tourism
Historically, the overall wetland coverage within the Great Lakes basin exceeded 10 percent, but there was significant variability among watersheds and jurisdictions, as stated in the Environment Canada Guideline. In the Rideau Valley Watershed, it has been estimated that pre-settlement wetland cover averaged 35 percent using information provided by Ducks Unlimited Canada (2010) versus the 21 percent of wetland cover existing in 2014 derived from DRAPE imagery analysis.
Using the same dataset, it is estimated that pre-settlement (historic) wetland cover averaged 51 percent in the Jock River subwatershed versus the 24 percent of cover existing in 2014 (as summarized in Table 12).
Table 12 Wetland cover in the Jock River subwatershed and Richmond catchment (Historic to 2014)
This decline in wetland cover is also evident in the Richmond catchment (as seen in Figure 65) where wetland was reported to cover 59 percent of the area prior to settlement, as compared to 15 percent in 2014. This represents a 74 percent loss of historic wetland cover and what remains (in 2014) falls below the 40 percent historic wetland threshold cited in the Environment Canada Guideline for maintaining key ecological and hydrological functions. To maintain critical hydrological, ecological functions along with related recreational and economic benefits provided by these wetland habitats in the catchment, the Guideline recommends a “no net loss” approach for currently existing wetlands combined with efforts to work towards restoring upwards of 40 percent of the historic wetland coverage, where feasible.
Figure 65 Richmond catchment wetland cover
4.4 Shoreline Cover
The riparian or shoreline zone is that special area where the land meets the water. Well-vegetated shorelines are critically important in protecting water quality and creating healthy aquatic habitats, lakes and rivers. Natural shorelines intercept sediments and contaminants that could impact water quality conditions and harm fish habitat in streams. Well established buffers protect the banks against erosion, improve habitat for fish by shading and cooling the water and provide protection for birds and other wildlife that feed and rear young near water. A recommended target (from the Environment Canada Guideline) is to maintain a minimum 30 metre wide vegetated buffer along at least 75 percent of the length of both sides of rivers, creeks and streams.
Figure 66 shows the extent of the ‘Natural’ vegetated riparian zone (predominantly wetland/woodland features) and ‘Other’ anthropogenic cover (crop/pastureland, roads/railways, settlements) along a 30-metre-wide area of land, both sides of the shoreline of the Jock River and its tributaries in the Richmond catchment.
Figure 66 Natural and other riparian land cover in the Richmond catchment
This analysis shows that the riparian zone in the Richmond catchment in 2014 was comprised of crop and pastureland (39 percent), wetland (20 percent), woodland (20 percent), settlement (nine percent), transportation (seven percent) and meadow-thicket (five percent). Additional statistics for the Richmond catchment are presented in Table 13 and show that there has been very little change in shoreline cover from 2008 to 2014.
Table 13 Riparian land cover (2008 vs. 2014) in the Richmond catchment
5.0 Jock River-Richmond Catchment: Stewardship and Water Resources Protection
The RVCA and its partners are working to protect and enhance environmental conditions in the Jock River Subwatershed. Figure 67 shows the location of all stewardship projects completed in the Jock River-Richmond catchment along with sites identified for potential shoreline restoration.
5.1 Rural Clean Water Projects
From 2010 to 2015, one well decommissioning, one well upgrade, one septic system replacement and one milkhouse wastewater treatment facility were completed. Between 2004 and 2009, 16 well upgrades, one septic system replacement, one precision farming and one manure storage/wastewater runoff project were finished and prior to 2004, two septic system replacement and two precision farming projects were completed. Two of these projects were completed within the 30 metre riparian zone of the Jock River. Total value of all 27 projects is $327,897 with $36,814 of that amount funded through grant dollars from the RVCA.
Figure 67 Stewardship site locations
5.2 Private Land Forestry Projects
The location of RVCA tree planting projects is shown in Figure 67. From 2010 to 2015, 5,007 trees were planted at one site. Between 2004 and 2009, 7,300 trees were planted at four sites and prior to 2004, 58,900 trees were planted at nine sites, In total, 71,207 trees were planted resulting in the reforestation of 36 hectares. One of these projects was completed within the 30 metre riparian zone of the Jock River. Total project value of all 14 projects is $224,332 with $60,895 of that amount coming from fundraising sources.
Through the RVCA Butternut Recovery Program, an additional 50 butternut trees were planted in the Richmond catchment (Figure 67) between 2004 and 2015, as part of efforts to introduce healthy seedlings from tolerant butternuts into various locations across Eastern Ontario.
5.3 Shoreline Naturalization Projects
With the assistance of the RVCA’s Shoreline Naturalization Program, 1954 trees and shrubs were planted to create an overall 1,372 metre long shoreline buffer at a total project value of $22,818.
5.4 Ontario Drinking Water Stewardship Projects
Figure 67 shows the location of all Ontario Drinking Water Stewardship Program (ODWSP) projects in the Jock River-Richmond catchment. From 2010 to 2015, 11 well upgrades, three septic decommissionings, three sewer line connections, two fuel handling and storage facilities, one well decommissioning and one septic system repair/replacement were completed. Between 2004 and 2009, 6 well upgrades were carried out. Total value of all 27 projects is $73,144 with $45,934 of that amount funded by the Ontario Ministry of the Environment.
5.5 Wetland Restoration Project
The RVCA in partnership with Fisheries and Oceans Canada, Shell Fuelling Change, Muskies Canada Ottawa Chapter, National Defence Fish and Game Club, Community Foundation of Ottawa, Fendock and the Ottawa Flyfishers Society constructed a fish habitat embayment at the Richmond Conservation Area in October 2014. The project involved converting an existing grassed park area into a small wetland embayment along the shoreline of the Jock River and created 1000 square metres of new spawning, nursery, rearing, and feeding habitat to support the 40 species of fish that reside in the Jock River. It also resulted in approximately 100 metres of new shoreline being created by re-grading the existing slope and planting a shoreline buffer around the perimeter of the new embayment feature. Many volunteers participated in the construction of the embayment and contributed 294 volunteer hours towards the project. Post monitoring results have shown that the feature is meeting its objectives by providing enhanced fish habitat and amphibian breeding habitat.
Jock River Wetland Embayment summer condition
Jock River Wetland Embayment winter condition
5.6 Valley, Stream, Wetland and Hazard Lands
The Richmond catchment covers 31 square kilometres with 9.1 square kilometres (or 29 percent) of the drainage area being within the regulation limit of Ontario Regulation 174/06 (Figure 68), giving protection to wetland areas and river or stream valleys that are affected by flooding and erosion hazards.
Wetlands occupy 4.8 sq. km. (or 15 percent) of the catchment. Of these wetlands, 2.9 sq. km (or 60 percent) are designated as provincially significant and included within the RVCA regulation limit. This leaves the remaining 1.9 sq. km (or 40 percent) of wetlands in the catchment outside the regulated area limit.
Of the 60.4 kilometres of stream in the catchment, regulation limit mapping has been plotted along 32.1 kilometers of streams (representing 53 percent of all streams in the catchment). Some of these regulated watercourses (6.1 km or 10 percent of all streams) flow through regulated wetlands; the remaining 26.0 km (or 81 percent) of regulated streams are located outside of those wetlands. Plotting of the regulation limit on the remaining 28.3 km (or 47 percent) of streams
Within those areas of the Richmond catchment subject to the regulation (limit), efforts (have been made and) continue through RVCA planning and regulations input and review to manage the impact of development (and other land management practices) in areas where “natural hazards” are associated with rivers, streams, valley lands and wetlands. For areas beyond the regulation limit, protection of the catchment’s watercourses is only provided through the “alteration to waterways” provision of the regulation.
Within those areas of the Richmond catchment subject to the RVCA regulation (limit), efforts (have been made and) continue through RVCA planning and regulations input and review to manage the impact of development (and other land management practices) in areas where “natural hazards” are associated with rivers, streams, valley lands and wetlands. Additionally, in the urbanizing areas of the Richmond catchment, significant effort is made through land use planning and development control processes and carefully planned stormwater management systems, initially guided by master drainage planning and integrated subwatershed planning, to meet the natural heritage and natural hazards policies presented in the City of Ottawa Official Plan. Also, within areas beyond the regulation limit, protection of the catchment’s watercourses is provided through the “alteration to waterways” provision of the regulation.
Figure 68 RVCA regulation limits
5.7 Vulnerable Drinking Water Areas
The Wellhead Protection Area around the Richmond (King’s Park) drinking water source is located within the Jock River-Richmond drainage catchment. This area is subject to mandatory policies in the Mississippi-Rideau Source Protection Plan developed under the Clean Water Act. These policies specifically regulate land uses and activities that are considered drinking water threats, thereby reducing the risk of contamination of the municipal drinking water source.
The Jock River-Richmond drainage catchment is also considered to have a Highly Vulnerable Aquifer. This means that the nature of the overburden (thin soils, fractured bedrock) does not provide a high level of protection for the underlying groundwater making the aquifer more vulnerable to contaminants released on the surface. The Mississippi-Rideau Source Protection Plan includes policies that focus on the protection of groundwater region-wide due to the fact that most of the region, which encompasses the Mississippi and Rideau watersheds, is considered Highly Vulnerable Aquifer.
For detailed maps and policies that have been developed to protect drinking water sources, please go to the Mississippi-Rideau Source Protection Region website at www.mrsourcewater.ca to view the Mississippi-Rideau Source Protection Plan.
6.0 Jock River-Richmond Catchment: Challenges/Issues
Water Quality/Quantity
Surface chemistry water quality in the Jock River within the Jock River-Richmond catchment is “Fair” over two reporting periods (2004-2009 and 2010-2015). The score at this site reflects few exceedances across measured parameters with occasional instances of elevated nutrients and bacterial counts
Instream biological water quality conditions at the Jock River Richmond sample location range from “ Poor” to “Fair” from 2004 to 2015 (using a grading scheme developed by Ontario Conservation Authorities in Ontario for benthic invertebrates) with an overall benthic invertebrate water quality rating of “Fairly Poor” determined for this period
Effect of the Richmond sewage lagoons on Jock River surface water quality conditions needs to be understood
Effect of climate change on the hydrologic function (water budget) of the Jock River subwatershed and associated natural hazards (flood risk) posed to the built/urban areas of the Village of Richmond are not understood, including the flood risk associated with proposed subdivision development on the west side of Richmond that remains unresolved
Existing hydrological and geochemical datasets and assessments (academic, RVCA, others) are only recently available and/or are not being considered in the characterization of the numerous hydrologic functions of the Jock River subwatershed. Further, there is a dearth of hydrologic information (hydroperiod, groundwater/surface water interactions, geochemistry) about the wetlands that remain in the Jock River subwatershed
Headwaters/Instream/Shorelines
‘Natural’ vegetation covers 45 percent of the riparian zone of the Jock River and its tributaries (Figure 66) and is below the recommended 30 metre wide, naturally vegetated target along 75 percent of the length of the catchment’s watercourses
Richmond weir is a seasonal impediment to fish movement along the Jock River and can fragment/ isolate fish populations
Land Cover
Woodlands cover 17 percent of the catchment and is less than the 30 percent of forest cover that is identified as the minimum threshold for sustaining forest birds and other woodland dependent species (Figure 64)
Pre-settlement wetlands have declined by 74 percent and now cover 15 percent (476 ha.) of the catchment (Figure 65). Forty percent (191 ha.) of these wetlands remain unevaluated/unregulated and are vulnerable to drainage and land clearing activities in the absence of any regulatory and planning controls that would otherwise protect them for the many important hydrological, social, biological and ecological functions/services/values they provide to landowners and the surrounding community
7.0 Jock River-Richmond Catchment: Opportunities/Actions
Water Quality/Quantity
Reduce total phosphorus and E. coli levels via non-point and point source pollution control both in rural areas as well as the developed portion of Richmond
Consider the incorporation of low impact development features within Richmond to assist in storm water management
Private landowners should consider taking advantage of The Rural Clean Water Programs which offer grants to landowners interested in implementing projects on their property that will help to protect and improve water quality.
- Homeowners may be interested in projects to repair, replace or upgrade their well or septic system, or addressing erosion through buffer plantings and erosion control
- Farmers can take advantage of a wide range of projects, including livestock fencing, manure storage, tile drainage control structures, cover crops, and many more
Consider a second monitoring site in the downstream portion of the catchment (where Eagleson Road crosses the Jock River) to capture any surface water quality impacts from the Village of Richmond as well as any potential impact of emergency overflow from the former Richmond sewage lagoon
Continue to coordinate environmental monitoring and reporting activities with the City of Ottawa
Use wetland restoration as a tool to improve surface water quality and help restore the hydrologic integrity of the Jock River and its tributaries
List, share and when possible, synthesize and use existing hydrological and geochemical datasets and assessment outcomes to facilitate the characterization of subwatershed and catchment hydrological functions. In addition, prepare guidance on best practices for the preparation of water budget assessments to better understand the hydrologic cycle requirements that occur at site specific scales; and share existing catchment and subwatershed scale water budget assessment outcomes
Headwaters/Instream/Shorelines
Promote the Rideau Valley Shoreline Naturalization Program to landowners to increase existing 45 percent of natural shoreline cover
Educate landowners about the value of and best management practices used to maintain and enhance natural shorelines and headwater drainage features
Work with the City of Ottawa to consistently implement current land use planning and development policies for water quality and shoreline protection (i.e., adherence to a minimum 30 metre development setback from water) adjacent to the Jock River and other catchment streams
Target shoreline restoration at sites identified in this report (shown as “Other riparian land cover” in Figure 66 and “Potential Riparian/Instream Restoration” in Figures 53/54) and explore other restoration and enhancement opportunities along the Jock River and its tributaries
Land Cover
Promote the City of Ottawa’s Green Acres Reforestation Program to landowners to increase existing 17 percent of woodland cover
Encourage the City of Ottawa to strengthen natural heritage and water resources policies in official plans and zoning by-laws where shoreline, wetland, woodland cover and watercourse setbacks are determined to be at or below critical ecological thresholds. Information for this purpose is provided in the RVCA’s subwatershed and catchment reports
Explore ways and means to more effectively enforce and implement conditions of land-use planning and development approvals to achieve net environmental gains
Re-consider the RVCA’s approach to wetland regulation where there is an identified hydrologic imperative to do so (i.e., significant loss of historic wetland cover (see Figure 65) and/or seasonal, critically low baseflows in the Jock River and/or areas of seasonal flooding)
Full Catchment Report
Jock River Subwatershed Report 2016
JOCK RIVER-RICHMOND FEN CATCHMENT
The RVCA produces individual reports for 12 catchments in the Jock River subwatershed. Using data collected and analyzed by the RVCA through its watershed monitoring and land cover classification programs, surface water quality and in-stream conditions are reported for the Jock River along with a summary of environmental conditions for the surrounding countryside every six years.
This information is used to better understand the effects of human activity on our water resources, allows us to better track environmental change over time and helps focus watershed management actions where they are needed the most to help sustain the ecosystem services (cultural, aesthetic and recreational values; provisioning of food, fuel and clean water; regulation of erosion/natural hazard protection and water purification; supporting nutrient/water cycling and habitat provision) provided by the catchment’s lands and forests and waters (Millennium Ecosystem Assessment 2005).
The following sections of this report for the Jock River - Richmond Fen catchment are a compilation of that work.
| Catchment Facts |
Section 1.0 |
| Riparian Conditions |
Section 2.0 |
| Land Cover |
Section 3.0 |
| Land Stewardship and Water Resources Protection |
Section 4.0 |
| Challenges/Issues |
Section 5.0 |
| Actions/Opportunities |
Section 6.0 |
For other Jock River catchments and the Jock River Subwatershed Report, please visit the RVCA website at www.rvca.ca

Figure 1 Land cover in the Jock River - Richmond Fen catchment
1.0 Jock River-Richmond Fen Catchment: Facts
1.1 General/Physical Geography
Municipalities
- Ottawa: (26 km2; 100% of catchment)
Geology/Physiography
- The Richmond Fen Catchment resides within an extensive physiographic region known as the Ottawa Valley Clay Plain. This part of the clay plain, however, is generally very thin or absent; and is overlain by an extensive area of organic soil. Areas of glacial till and some beach sands and gravels and sand plains flank the organic soils to the east and west
- In this catchment, bedrock includes the interbedded limestone and dolostone, sandstone with shale and limestone, dolostone, and some limestone respectively from the Gull River, Rockcliffe, Oxford and Bobcaygeon Formations. In addition, numerous geologic faults may pass through the catchment
Topography
- The ground surface ranges in elevation from approximately 128 masl near Munster Hamlet to approximately 97 masl throughout the PSW and at the catchment’s outlet
Drainage Area
- 26 square kilometers; occupies five percent of the Jock River subwatershed, less than one percent of the Rideau Valley watershed
Stream Length
- Jock River and tributaries: 42 km
1.2 Vulnerable Areas
Flood/Erosion Hazard
- Jock River is subject to a flooding hazard during the regional storm flood (the 100 year flood). Surveys and studies undertaken in accordance with provincial standards have determined that the 100 year flood elevation in the catchment ranges from 101.8 metres above mean sea level at Franktown Road to 97.5 metres above mean sea level along the northern edge of the Richmond Fen Provincially Significant Wetland
Aquifer Vulnerability
- The Mississippi-Rideau Source Protection initiative has mapped scattered parts of this catchment as a significant groundwater recharge areas and all the catchment as Highly Vulnerable Aquifer. Parts of Wellhead Protection Areas (WHPA) C and D for the municipal wells in Richmond underlie the eastern extent of this catchment
Wetland Hydrology
- A watershed model developed by the RVCA in 2009 was used to study the hydrologic function of wetlands in the Rideau Valley Watershed, including those found in the Richmond Fen catchment
1.3 Conditions at a Glance
Water Quality
- Surface chemistry water quality rating for the Jock River in the Richmond Fen catchment is unknown
- Instream biological water quality conditions for the Jock River in the Richmond Fen catchment are unknown
Instream and Riparian
- Overall instream and riparian condition for the Jock River-Richmond Fen catchment as assessed by the stream characterization and headwater drainage feature assessment programs show that the Jock River and its tributaries are in generally good condition. The majority of the system has low erosion levels and a healthy forested riparian corridor along the Jock River. Instream diversity of aquatic habitat is fairly complex in the upper reach of the Jock River, while the lower reach is dominated by the Provincially Significant Richmond Fen wetland which is a very important wetland feature with high values that support catchment health
Thermal Regime
- Warm/cool water thermal guild supporting the Jock River/Rideau River fishery
Fish Community
- Eighteen species of recreational and bait fish
Shoreline Cover Type (30 m. riparian area; 2014)
- Wetland (56%)
- Crop and Pasture (24%)
- Woodland (9%)
- Transportation (6%)
- Settlement (4%)
- Meadow-Thicket (1%)
Land Cover Type (2014)
- Wetland (50%)
- Crop and Pasture (28%)
- Woodland (14%)
- Settlement (5%)
- Transportation (2%)
- Meadow-Thicket (1%)
- Aggregate (<1%)
- Water (<1%)
Land Cover Change (2008 to 2014)
- Crop and Pasture (-5 ha)
- Aggregate (0 ha)
- Meadow-Thicket (0 ha)
- Transportation (0 ha)
- Water (0 ha)
- Wetland (0 ha)
- Woodland (+2 ha)
- Settlement (+3 ha)
Significant Natural Features
- Richmond Fen Provincially Significant Wetland
- Richmond Fen Area of Natural and Scientific Interest
Water Wells
- Seventy operational (approximately) private water wells in the catchment. Groundwater uses are mainly domestic but also include livestock watering and crop irrigation
Aggregates
- No Aggregate Resources Act licenses in the catchment. Limited sand and gravel resources are of tertiary importance
Species at Risk (Elemental Occurrence)
- Bogbean Buckmoth, Eastern Prairie Fringed Orchid, Henslow's Sparrow, Loggerhead Shrike, Spotted Turtle (Endangered)
- Barn Swallow, Blanding's Turtle, Bobolink, Eastern Meadowlark, Least Bittern (Threatened)
- Eastern Milksnake, Snapping Turtle, Yellow Rail (Special Concern)
1.4 Catchment Care
Stewardship
- Twenty-five stewardship projects undertaken (see Section 4)
Environmental Monitoring
- Fish survey along the Jock River (see Section 2.3.9)
- Stream characterization survey on the Jock River in 2015, working upstream to the headwaters from its mouth where it empties into the Rideau River, taking measurements and recording observations on instream habitat, bank stability, other attributes and preparing a temperature profile (see Section 2)
- Four headwater drainage feature assessments in 2015 at road crossings in the catchment. The protocol measures zero, first and second order headwater drainage features and is a rapid assessment method characterizing the amount of water, sediment transport, and storage capacity within headwater drainage features (see Section 2.4)
Environmental Management
- Development along the Jock River and in and adjacent to the Richmond Fen Provincially Significant Wetlands in the catchment is subject to Ontario Regulation 174-06 (entitled “Development, Interference with Wetlands and Alterations to Shorelines and Watercourses”) that protects the hydrologic function of the wetland and also protects landowners and their property from natural hazards (flooding, fluctuating water table, unstable soils) associated with them
- Three Active Permits To Take Water (PTTW) in the Richmond Fen catchment issued for a commercial water supply and golf course irrigation
2. Surface Water Quality Conditions
Barbers Creek Water Quality
Water Quality Rating
Nutrients
Summary
E. Coli
Summary
Metals
Summary
[1] - copy this to the where the link to the footnote is in the text, then delete is line
[1] type footnote text here
[2] Lorem ipus
2.0 Jock River-Richmond Fen Catchment: Riparian Conditions
2.1 Jock River Overbank Zone
2.1.1 Riparian Buffer Land Cover Evaluation
Figure 2 demonstrates the buffer conditions of the left and right banks separately. The Jock River in the Richmond Fen catchment had a buffer of greater than 30 meters along 93 percent of the right bank and 91 percent of the left bank.
Figure 2 Riparian Buffer Evaluation along the Jock River in the Richmond Fen catchment
2.1.2 Riparian Buffer Alterations
Alterations within the riparian buffer were assessed within three distinct shoreline zones (0-5m, 5-15m, 15-30m), and evaluated based on the dominant vegetative community and/or land cover type (Figure 3). The riparian buffer zone along the Jock River within the Richmond Fen catchment was found to have highly variable conditions along the riparian corridor. These alterations were generally associated with infrastructure in the form of railway, roads and agricultural land use.
Figure 3 Riparian buffer alterations within the Jock River Richmond Fen catchment
2.1.3 Adjacent Land Use
The RVCA’s Stream Characterization Program identifies nine different land uses beside the Jock River in the Richmond Fen catchment (Figure 4). Surrounding land use is considered from the beginning to end of the survey section (100m) and up to 100m on each side of the river. Land use outside of this area is not considered for the surveys but is nonetheless part of the subwatershed and will influence the creek. Natural areas made up 83 percent of the stream, characterized by forest, scrubland, meadow and wetland. Forest habitat was dominant in the adjacent lands along the Jock River in the Richmond Fen catchment at 45 percent. The remaining land use consisted of active agriculture, pasture, abandoned agriculture, recreational and infrastructure in the form of railway and road crossings.
Figure 4 Land Use along the Jock River in the Richmond Fen catchment
2.2 Jock River Shoreline Zone
2.2.1 Instream Erosion
Stream erosion is the process by which water erodes and transports sediments, resulting in dynamic flows and diverse habitat conditions. Excessive erosion can result in drastic environmental changes, as habitat conditions, water quality and aquatic life are all negatively affected. Bank stability was assessed as the overall extent of each section with “unstable” shoreline conditions. These conditions are defined by the presence of significant exposed soils/roots, minimal bank vegetation, severe undercutting, slumping or scour and potential failed erosion measures. The majority of the Jock River had no signs of erosion with the exception of the upper extent of the system which had low levels of erosion and one area in the middle reach had high levels of erosion observed. Figure 5 shows erosion levels along the Jock River in the Richmond Fen catchment.
Figure 5 Erosion along the Jock River in the Richmond Fen catchment
2.2.2 Undercut Stream Banks
Stream bank undercuts can provide excellent cover habitat for aquatic life, however excessive levels can be an indication of unstable shoreline conditions. Bank undercut was assessed as the overall extent of each surveyed section with overhanging bank cover present. Figure 6 shows that Jock River in the Richmond Fen catchment had low to moderate levels of undercut banks along the system.
Figure 6 Undercut stream banks along the Jock River in the Richmond Fen catchment
2.2.3 Stream Shading
Grasses, shrubs and trees all contribute towards shading a stream. Shade is important in moderating stream temperature, contributing to food supply and helping with nutrient reduction within a stream. Stream cover is assessed as the total coverage area in each section that is shaded by overhanging trees/grasses and tree canopy, at greater than 1m above the water surface. Figure 7 shows highly variable conditions of low to high levels of stream shading along the Jock River in the Richmond Fen catchment.
Figure 7 Stream shading along the Jock River in the Richmond Fen catchment
2.2.4 Instream Woody Debris
Figure 8 shows that the majority of Jock River in the Richmond Fen catchment had highly variable levels of instream woody debris in the form of branches and trees along the system. Instream woody debris is important for fish and benthic invertebrate habitat, by providing refuge and feeding areas.
Figure 8 Instream woody debris along the Jock River in the Richmond Fen catchment
2.2.5 Overhanging Trees and Branches
Trees and branches that are less than one meter from the surface of the water are defined as overhanging. Overhanging branches and trees provide a food source, nutrients and shade which helps to moderate instream water temperatures. Figure 9 shows the system is highly variable with low to high levels of overhanging branches and trees along the Jock River in the Richmond Fen catchment.
Figure 9 Overhanging trees and branches along the Jock River in the Richmond Fen catchment
2.2.6 Anthropogenic Alterations
Stream alterations are classified based on specific functional criteria associated with the flow conditions, the riparian buffer and potential human influences. Figure 10 shows 70 percent of the Jock River in the Richmond Fen catchment remains “unaltered” with no anthropogenic alterations. Thirty percent of Jock River in the Richmond Fen catchment was classified as natural with minor anthropogenic changes. The alterations along the Jock River in this reach were in the form of reduced buffers and road crossings.
Figure 10 Anthropogenic alterations along the Jock River in the Richmond Fen catchment
2.3 Jock River Instream Aquatic Habitat
2.3.1 Habitat Complexity
Habitat complexity is a measure of the overall diversity of habitat types and features within a stream. Streams with high habitat complexity support a greater variety of species niches, and therefore contribute to greater diversity. Factors such as substrate, flow conditions (pools, riffles) and cover material (vegetation, wood structure, etc.) all provide crucial habitat to aquatic life. Habitat complexity is assessed based on the presence of boulder, cobble and gravel substrates, as well as the presence of instream woody material.
Low to high habitat complexity was identified for the Jock River Richmond Fen reach (Figure 11). Regions with increased habitat complexity were observed in the upper reaches of the system within the catchment. The lower to middle reaches of the Jock River in the Richmond Fen catchment provide important wetland habitat.
Figure 11 Habitat complexity along the Jock River in the Richmond Fen catchment
2.3.2 Instream Substrate
Diverse substrate is important for fish and benthic invertebrate habitat because some species have specific substrate requirements and for example will only reproduce on certain types of substrate. The absence of diverse substrate types may limit the overall diversity of species within a stream. Figure 12 shows that 73 percent of the sections observed in the Jock River in the Richmond Fen catchment had the presence of silt substrate. Overall substrate conditions were highly diverse along the Jock River Richmond Fen reach with all substrate types being recorded along the reach. Figure 13 shows the dominant substrate type observed for each section surveyed along the Jock River in the Richmond Fen catchment. The map depicts the locations within the Richmond Fen wetland as being dominated by silt while the upper reaches of the Jock River within the catchment are dominated by cobble habitat.
Figure 12 Instream substrate along the Jock River in the Richmond Fen catchment
Figure 13 shows the dominant substrate type along the Jock River Richmond Fen catchment.
2.3.3 Instream Morphology
Pools and riffles are important habitat features for aquatic life. Riffles are fast flowing areas characterized by agitation and overturn of the water surface. Riffles thereby play a crucial role in contributing to dissolved oxygen conditions and directly support spawning for some fish species. They are also areas that support high benthic invertebrate populations which are an important food source for many aquatic species. Pools are characterized by minimal flows, with relatively deep water and winter/summer refuge habitat for aquatic species. Runs are moderately shallow, with unagitated surfaces of water and areas where the thalweg (deepest part of the channel) is in the center of the channel. Figure 14 shows that the Jock River in the Richmond Fen catchment is highly variable; 82 percent consists of runs, 5 percent riffles and 13 percent pools. Figure 15 shows where the riffle habitat areas were observed along the Jock River in the Richmond Fen catchment.

Figure 14 Instream morphology along the Jock River in the Richmond Fen catchment
Figure 15 Riffle habitat locations along the Jock River in the Richmond Fen catchment
2.3.4 Vegetation Type
Instream vegetation provides a variety of functions and is a critical component of the aquatic ecosystem. Aquatic plants promote stream health by:
- Providing direct riparian/instream habitat
- Stabilizing flows reducing shoreline erosion
- Contributing to dissolved oxygen through photosynthesis
- Maintaining temperature conditions through shading
For example emergent plants along the shoreline can provide shoreline protection from wave action and important rearing habitat for species of waterfowl. Submerged plants provide habitat for fish to find shelter from predator fish while they feed. Floating plants such as water lilies shade the water and can keep temperatures cool while reducing algae growth. Narrow leaved emergents were present at 86% of the sections surveyed, algae was observed in 85% of sections, while free floating plants were observed in 34% of surveyed sections. Broad leaved emergents were observed in 30% of sections, submerged plants in 84%, floating plants in 54% and robust emergents in only 38% of sections surveyed. Figure 16 depicts the plant community structure for the Jock River Richmond Fen catchment. Figure 17 shows the dominant vegetation type observed for each section surveyed along the Jock River in the Richmond Fen catchment.
Figure 16 Vegetation type along the Jock River in the Richmond Fen catchment
Figure 17 Dominant vegetation type along the Jock River in the Richmond Fen catchment
2.3.5 Instream Vegetation Abundance
Instream vegetation is an important factor for a healthy stream ecosystem. Vegetation helps to remove contaminants from the water, contributes oxygen to the stream, and provides habitat for fish and wildlife. Too much vegetation can also be detrimental. Figure 18 demonstrates that the Jock River Richmond Fen reach had no vegetation to low levels of instream vegetation for 61 percent of its length. Normal to common levels of vegetation were recorded at 30 percent of stream surveys. Extensive levels were observed at 9 percent along the system.
Figure 18 Instream vegetation abundance along the Jock River in the Richmond Fen catchment
2.3.6 Invasive Species
Invasive species can have major implications on streams and species diversity. Invasive species are one of the largest threats to ecosystems throughout Ontario and can out compete native species, having negative effects on local wildlife, fish and plant populations. Ninety three percent of the sections surveyed along the Jock River Richmond Fen reach had invasive species. The invasive species observed in the Jock River Richmond Fen reach were European frogbit, poison/wild parsnip, carp, banded mystery snail, yellow iris, bull thistle, Eurasian milfoil, Chinese mystery snail, and Manitoba maple. Invasive species abundance (i.e. the number of observed invasive species per section) was assessed to determine the potential range/vector of many of these species (Figure 19).
Figure 19 Invasive species abundance along the Jock River in the Richmond Fen catchment
2.3.7 Water Chemistry
During the stream characterization survey, a YSI probe is used to collect water chemistry information. Dissolved oxygen (DO), specific conductivity (SPC) and pH are measured at the start and end of each section.
2.3.7.1 Dissolved Oxygen
Dissolved oxygen is a measure of the amount of oxygen dissolved in water. The Canadian Environmental Quality Guidelines of the Canadian Council of Ministers of the Environment (CCME) suggest that for the protection of aquatic life the lowest acceptable dissolved oxygen concentration should be 6 mg/L for warmwater biota and 9.5 mg/L for coldwater biota (CCME, 1999). Figure 20 shows that the dissolved oxygen in the Jock River Richmond Fen catchment was within the threshold for warmwater biota in this reach of the system. The average dissolved oxygen levels observed within the main stem of the Jock River Richmond Fen was 8.98mg/L which is within the recommended levels for warmwater biota.
Figure 20 Dissolved oxygen ranges in the Jock River for the Richmond Fen catchment
2.3.7.2 Conductivity
Conductivity in streams is primarily influenced by the geology of the surrounding environment, but can vary drastically as a function of surface water runoff. Currently there are no CCME guideline standards for stream conductivity; however readings which are outside the normal range observed within the system are often an indication of unmitigated discharge and/or stormwater input. The average conductivity observed within the main stem of Jock River in the Richmond Fen catchment was 495.9 µs/cm. Figure 21 shows the conductivity readings for the Jock River in the Richmond Fen catchment.
Figure 21 Specific conductivity ranges in the Jock River for the Richmond Fen catchment
2.3.7.3 pH
Based on the PWQO for pH, a range of 6.5 to 8.5 should be maintained for the protection of aquatic life. Average pH values for the Jock River Richmond Fen catchment averaged 8.12 thereby meeting the provincial standard (Figure 22).
Figure 22 pH ranges in the Jock River for the Richmond Fen catchment
2.3.7.4 Oxygen Saturation (%)
Oxygen saturation is measured as the ratio of dissolved oxygen relative to the maximum amount of oxygen that will dissolve based on the temperature and atmospheric pressure. Well oxygenated water will stabilize at or above 100% saturation, however the presence of decaying matter/pollutants can drastically reduce these levels. Oxygen input through photosynthesis has the potential to increase saturation above 100% to a maximum of 500%, depending on the productivity level of the environment. In order to represent the relationship between concentration and saturation, the measured values have been summarized into 6 classes:
- <100% Saturation / <6.0 mg/L Concentration. Oxygen concentration and saturation are not sufficient to support aquatic life and may represent impairment.
- >100% Saturation / <6.0 mg/L Concentration. Oxygen concentration is not sufficient to support aquatic life, however saturation levels indicate that the water has stabilized at its estimated maximum. This is indicative of higher water temperatures and stagnant flows.
- <100% Saturation / 6.0-9.5 mg/L Concentration. Oxygen concentration is sufficient to support warm water biota, however depletion factors are likely present and are limiting maximum saturation.
- >100% Saturation / 6.0-9.5 mg/L Concentration. Oxygen concentration and saturation levels are optimal for warm water biota.
- <100% Saturation / >9.5 mg/L Concentration. Oxygen concentration is sufficient to support cold water biota, however depletion factors are likely present and are limiting maximum saturation.
- >100% Saturation / >9.5 mg/L Concentration. Oxygen concentration and saturation levels are optimal for cold water biota.
 and saturation (%) in the Jock River Richmond Fen reach")
Figure 23 A bivariate assessment of dissolved oxygen concentration (mg/L) and saturation (%) in the Jock River Richmond Fen reach
Dissolved oxygen conditions on the Jock River in the Richmond Fen catchment are generally sufficient for both warm and coolwater species (Figure 23). Dissolved oxygen conditions are higher in the upper reach which is a function of the riffle habitat in those sections of the Jock River. Oxygen levels in wetland habitats are typically lower than they are in areas where the substrate is dominated by cobble and riffle habitat.
2.3.7.5 Specific Conductivity Assessment
Specific conductivity (SPC) is a standardized measure of electrical conductance, collected at or corrected to a water temperature of 25⁰C. SPC is directly related to the concentration of ions in water, and is commonly influenced by the presence of dissolved salts, alkalis, chlorides, sulfides and carbonate compounds. The higher the concentration of these compounds, the higher the conductivity. Common sources of elevated conductivity include storm water, agricultural inputs and commercial/industrial effluents.
In order to summarize the conditions observed, SPC levels were evaluated as either normal, moderately elevated or highly elevated. These categories correspond directly to the degree of variation (i.e. standard deviation) at each site relative to the average across the system.
Normal levels were maintained along the majority of the Jock River in the Richmond Fen catchment, with highly elevated areas immediately upstream of the Richmond Fen wetland and moderately elevated levels observed in the middle and lower reaches within the Richmond Fen (Figure 24).
Figure 24 Relative specific conductivity levels on the Jock River in the Richmond Fen catchment
2.3.8 Groundwater
Groundwater discharge areas can influence stream temperature, contribute nutrients, and provide important stream habitat for fish and other biota. During stream surveys, indicators of groundwater discharge are noted when observed. Indicators include: springs/seeps, watercress, iron staining, significant temperature change and rainbow mineral film. Figure 25 shows areas where one or more of the above groundwater indicators were observed during stream surveys and headwater assessments.
Figure 25 Groundwater indicators observed in the Jock River Richmond Fen catchment
2.3.9 Fish Community
The Jock River Richmond Fen catchment is classified as a mixed community of warm and cool water recreational and baitfish fishery with 18 species observed. Figure 26 shows the sampling locations along the Jock River in the catchment.
Figure 26 Fish sampling locations and observations for the Richmond Fen catchment
The following table contains a list of species observed in the watershed.
Table 1 Fish species observed in the Jock River Richmond Fen catchment
2.3.10 Riparian Restoration
Figure 27 depicts the locations of riparian restoration opportunities as a result of observations made during the stream survey.
Figure 27 Riparian restoration opportunities along Jock River in the Richmond Fen catchment
2.3.11 Instream Restoration
Figure 28 depicts the locations of instream restoration opportunities as a result of observations made during the stream survey. Only one small stream garbage cleanup restoration opportunity was observed in the Ruchmond Fen catchment.
Figure 28 Instream restoration opportunities along Jock River in the Richmond Fen catchment
2.4 Headwater Drainage Features Assessment
2.4.1 Headwater Sampling Locations
The RVCA Stream Characterization program assessed Headwater Drainage Features for the Jock River subwatershed in 2015. This protocol measures zero, first and second order headwater drainage features (HDF). It is a rapid assessment method characterizing the amount of water, sediment transport, and storage capacity within headwater drainage features (HDF). RVCA is working with other Conservation Authorities and the Ministry of Natural Resources and Forestry to implement the protocol with the goal of providing standard datasets to support science development and monitoring of headwater drainage features. An HDF is a depression in the land that conveys surface flow. Additionally, this module provides a means of characterizing the connectivity, form and unique features associated with each HDF (OSAP Protocol, 2013). In 2015 the program sampled 4 sites at road crossings in the Jock River Richmond Fen catchment area (Figure 29).

Figure 29 Location of the headwater sampling site in the Jock River Richmond Fen catchment
2.4.2 Headwater Feature Type
The headwater sampling protocol assesses the feature type in order to understand the function of each feature. The evaluation includes the following classifications: defined natural channel, channelized or constrained, multi-thread, no defined feature, tiled, wetland, swale, roadside ditch and pond outlet. By assessing the values associated with the headwater drainage features in the catchment area we can understand the ecosystem services that they provide to the watershed in the form of hydrology, sediment transport, and aquatic and terrestrial functions. The headwater drainage features in the Richmond Fen catchment are primarily classified as wetland with one feature classified as a road side ditch. Figure 30 shows the feature type of the primary feature at the sampling locations.
Figure 30 Headwater feature types in the Jock River Richmond Fen catchment
A spring photo of the headwater sample site in the Jock River Richmond Fen catchment located on Munster Road
A summer photo of the headwater sample site in the Jock River Richmond Fen catchment located on Munster Road
2.4.3 Headwater Feature Flow
The observed flow condition within headwater drainage features can be highly variable depending on timing relative to the spring freshet, recent rainfall, soil moisture, etc. Flow conditions are assessed in the spring and in the summer to determine if features are perennial and flow year round, if they are intermittent and dry up during the summer months or if they are ephemeral systems that do not flow regularly and generally respond to specific rainstorm events or snowmelt. Flow conditions in headwater systems can change from year to year depending on local precipitation patterns. Figure 31 shows the observed flow condition at the sampling locations in the Jock River Richmond Fen catchment in 2015.
Figure 31 Headwater feature flow conditions in the Jock River Richmond Fen catchment
2.4.4 Feature Channel Modifications
Channel modifications were assessed at each headwater drainage feature sampling location. Modifications include channelization, dredging, hardening and realignments. The Jock River Richmond Fen catchment area had one site as having been recently dredged, while three locations had no channel modifications observed. Figure 32 shows the channel modifications observed at the sampling locations for Jock River Richmond Fen.
Figure 32 Headwater feature channel modifications in the Jock River Richmond Fen catchment
2.4.5 Headwater Feature Vegetation
Headwater feature vegetation evaluates the type of vegetation that is found within the drainage feature. The type of vegetated within the channel influences the aquatic and terrestrial ecosystem values that the feature provides. For some types of headwater features the vegetation within the feature plays a very important role in flow and sediment movement and provides wildlife habitat. The following classifications are evaluated no vegetation, lawn, wetland, meadow, scrubland and forest. Figure 33 depicts the dominant vegetation observed at the sampled headwater sites in the Jock River Richmond Fen catchment.
Figure 33 Headwater feature vegetation types in the Jock River Richmond Fen catchment
2.4.6 Headwater Feature Riparian Vegetation
Headwater riparian vegetation evaluates the type of vegetation that is found along the adjacent lands of a headwater drainage feature. The type of vegetation within the riparian corridor influences the aquatic and terrestrial ecosystem values that the feature provides to the watershed. Figure 34 depicts the type of riparian vegetation observed at the sampled headwater sites in the Jock River Richmond Fen catchment.
Figure 34 Headwater feature riparian vegetation types in the Jock River Richmond Fen catchment
2.4.7 Headwater Feature Sediment Deposition
Assessing the amount of recent sediment deposited in a channel provides an index of the degree to which the feature could be transporting sediment to downstream reaches (OSAP, 2013). Evidence of excessive sediment deposition might indicate the requirement to follow up with more detailed targeted assessments upstream of the site location to identify potential best management practices to be implemented. Sediment deposition ranged from none to extensive for the headwater sites sampled in the Jock River Richmond Fen catchment area. Figure 35 depicts the degree of sediment deposition observed at the sampled headwater sites in the Jock River Richmond Fen catchment.
Figure 35 Headwater feature sediment deposition in the Jock River Richmond Fen catchment
2.4.8 Headwater Feature Upstream Roughness
Feature roughness will provide a measure of the amount of materials within the bankfull channel that could slow down the velocity of water flowing within the headwater feature (OSAP, 2013). Materials on the channel bottom that provide roughness include vegetation, woody debris and boulders/cobble substrates. Roughness can provide benefits in mitigating downstream erosion on the headwater drainage feature and the receiving watercourse by reducing velocities. Roughness also provides important habitat conditions for aquatic organisms. Figure 36 shows the feature roughness conditions at the sampling location in the Jock River Richmond Fen catchment.
Figure 36 Headwater feature roughness in the Jock River Richmond Fen catchment
3.0 Jock River-Richmond Fen Catchment: Land Cover
Land cover and any change in coverage that has occurred over a six year period is summarized for the Richmond Fen catchment using spatially continuous vector data representing the catchment during the spring of 2008 and 2014. This dataset was developed by the RVCA through heads-up digitization of 20cm DRAPE ortho-imagery at a 1:4000 scale and details the surrounding landscape using 10 land cover classes.
3.1 Richmond Fen Catchment Change
As shown in Table 2 and Figure 1, the dominant land cover type in 2014 was wetland followed by crop and pastureland and woodland.
Table 2 Land cover (2008 vs. 2014) in the Richmond Fen catchment
*Does not include treed swamps **Includes treed swamps
From 2008 to 2014, there was an overall change of 12 hectares (from one land cover class to another). Most of the change in the Richmond Fen catchment is a result of crop and pastureland reverting to woodland and the conversion of woodland to crop and pastureland and settlement (Figure 37).
Figure 37 Land cover change in the Richmond Fen catchment
Table 3 provides a detailed breakdown of all land cover change that has taken place in the Richmond Fen catchment between 2008 and 2014.
Table 3 Land cover change in the Richmond Fen catchment (2008 to 2014)
3.2 Woodland Cover
In the Environment Canada Guideline (Third Edition) entitled “How Much Habitat Is Enough?” (hereafter referred to as the “Guideline”) the opening narrative under the Forest Habitat Guidelines section states that prior to European settlement, forest was the predominant habitat in the Mixedwood Plains ecozone. The remnants of this once vast forest now exist in a fragmented state in many areas (including the Rideau Valley watershed) with woodland patches of various sizes distributed across the settled landscape along with higher levels of forest cover associated with features such as the Frontenac Axis (within the on-Shield areas of the Rideau Lakes and Tay River subwatersheds). The forest legacy, in terms of the many types of wildlife species found, overall species richness, ecological functions provided and ecosystem complexity is still evident in the patches and regional forest matrices (found in the Jock River subwatershed and elsewhere in the Rideau Valley watershed). These ecological features are in addition to other influences which forests have on water quality and stream hydrology including reducing soil erosion, producing oxygen, storing carbon along with many other ecological services that are essential not only for wildlife but for human well-being.
The Guideline also notes that forests provide a great many habitat niches that are in turn occupied by a great diversity of plant and animal species. They provide food, water and shelter for these species - whether they are breeding and resident locally or using forest cover to help them move across the landscape. This diversity of species includes many that are considered to be species at risk. Furthermore, from a wildlife perspective, there is increasing evidence that the total forest cover in a given area is a major predictor of the persistence and size of bird populations, and it is possible or perhaps likely that this pattern extends to other flora and fauna groups. The overall effect of a decrease in forest cover on birds in fragmented landscapes is that certain species disappear and many of the remaining ones become rare, or fail to reproduce, while species adapted to more open and successional habitats, as well as those that are more tolerant to human-induced disturbances in general, are able to persist and in some cases thrive. Species with specialized-habitat requirements are most likely to be adversely affected. The overall pattern of distribution of forest cover, the shape, area and juxtaposition of remaining forest patches and the quality of forest cover also play major roles in determining how valuable forests will be to wildlife and people alike.
The current science generally supports minimum forest habitat requirements between 30 and 50 percent, with some limited evidence that the upper limit may be even higher, depending on the organism/species phenomenon under investigation or land-use/resource management planning regime being considered/used.
As shown in Figure 38, 18 percent of the Richmond Fen catchment contains 370 hectares of upland forest and 279 hectares of lowland forest (treed swamps) versus the 26 percent of woodland cover in the Jock River subwatershed. This is less than the 30 percent of forest cover that is identified as the minimum threshold required to sustain forest birds according to the Guideline and which may only support less than one half of potential species richness and marginally healthy aquatic systems. When forest cover drops below 30 percent, forest birds tend to disappear as breeders across the landscape.
Figure 38 Woodland cover and forest interior (2014)
3.2.1 Woodland (Patch) Size
According to the Ministry of Natural Resources’ Natural Heritage Reference Manual (Second Edition), larger woodlands are more likely to contain a greater diversity of plant and animal species and communities than smaller woodlands and have a greater relative importance for mobile animal species such as forest birds.
Bigger forests often provide a different type of habitat. Many forest birds breed far more successfully in larger forests than they do in smaller woodlots and some rely heavily on forest interior conditions. Populations are often healthier in regions with more forest cover and where forest fragments are grouped closely together or connected by corridors of natural habitat. Small forests support small numbers of wildlife. Some species are “area-sensitive” and tend not to inhabit small woodlands, regardless of forest interior conditions. Fragmented habitat also isolates local populations, especially small mammals, amphibians and reptiles with limited mobility. This reduces the healthy mixing of genetic traits that helps populations survive over the long run (Conserving the Forest Interior. Ontario Extension Notes, 2000).
The Environment Canada Guideline also notes that for forest plants that do not disperse broadly or quickly, preservation of some relatively undisturbed large forest patches is needed to sustain them because of their restricted dispersal abilities and specialized habitat requirements and to ensure continued seed or propagation sources for restored or regenerating areas nearby.
The Natural Heritage Reference Manual continues by stating that a larger size also allows woodlands to support more resilient nutrient cycles and food webs and to be big enough to permit different and important successional stages to co-exist. Small, isolated woodlands are more susceptible to the effects of blowdown, drought, disease, insect infestations, and invasions by predators and non-indigenous plants. It is also known that the viability of woodland wildlife depends not only on the characteristics of the woodland in which they reside, but also on the characteristics of the surrounding landscape where the woodland is situated. Additionally, the percentage of forest cover in the surrounding landscape, the presence of ecological barriers such as roads, the ability of various species to cross the matrix surrounding the woodland and the proximity of adjacent habitats interact with woodland size in influencing the species assemblage within a woodland.
In the Richmond Fen catchment (in 2014), forty-three (48 percent) of the 90 woodland patches are very small, being less than one hectare in size. Another 39 (43 percent) of the woodland patches ranging from one to less than 20 hectares in size tend to be dominated by edge-tolerant bird species. The remaining eight (nine percent of) woodland patches range between 20 and 50 hectares in size and may support a few area-sensitive species and some edge intolerant species, but will be dominated by edge tolerant species. No patch exceeds the 100 plus hectare size needed to support most forest dependent, area sensitive birds and which are, when present, large enough to support approximately 60 percent of edge-intolerant species. Nor does any patch top 200 hectares, which according to the Environment Canada Guideline will support 80 percent of edge-intolerant forest bird species (including most area sensitive species) that prefer interior forest habitat conditions.
Table 4 presents a comparison of woodland patch size in 2008 and 2014 along with any changes that have occurred over that time. An increase (of 3 ha) has been observed in the overall woodland patch area between the two reporting periods with most change occurring in the one to 20 hectare woodland patch size class range.
Table 4 Woodland patches in the Richmond Fen catchment (2008 and 2014)
*Includes treed swamps
3.2.2 Woodland (Forest) Interior Habitat
The forest interior is habitat deep within woodlands. It is a sheltered, secluded environment away from the influence of forest edges and open habitats. Some people call it the “core” or the “heart” of a woodland. The presence of forest interior is a good sign of woodland health, and is directly related to the woodland’s size and shape. Large woodlands with round or square outlines have the greatest amount of forest interior. Small, narrow woodlands may have no forest interior conditions at all. Forest interior habitat is a remnant natural environment, reminiscent of the extensive, continuous forests of the past. This increasingly rare forest habitat is now a refuge for certain forest-dependent wildlife; they simply must have it to survive and thrive in a fragmented forest landscape (Conserving the Forest Interior. Ontario Extension Notes, 2000).
The Natural Heritage Reference Manual states that woodland interior habitat is usually defined as habitat more than 100 metres from the edge of the woodland and provides for relative seclusion from outside influences along with a moister, more sheltered and productive forest habitat for certain area sensitive species. Woodlands with interior habitat have centres that are more clearly buffered against the edge effects of agricultural activities or more harmful urban activities than those without.
In the Richmond Fen catchment (in 2014), the 90 woodland patches contain 25 forest interior patches (Figure 38) that occupy one percent (34 ha.) of the catchment land area (which is less than the three percent of interior forest in the Jock River Subwatershed). This is below the ten percent figure referred to in the Environment Canada Guideline that is considered to be the minimum threshold for supporting edge intolerant bird species and other forest dwelling species in the landscape.
Most patches (17) have less than one hectare of interior forest. The remaining eight patches contain interior forest ranging between one and 12 hectares in area. Between 2008 and 2014, there has been a change in the number of woodland patches containing smaller areas (below one hectare) of interior habitat with an overall increase of one hectare in the catchment (Table 5).
Table 5 Woodland interior in the Richmond Fen catchment (2008 and 2014)
3.3 Wetland Cover
Wetlands are habitats forming the interface between aquatic and terrestrial systems. They are among the most productive and biologically diverse habitats on the planet. By the 1980s, according to the Natural Heritage Reference Manual, 68 percent of the original wetlands south of the Precambrian Shield in Ontario had been lost through encroachment, land clearance, drainage and filling.
Wetlands perform a number of important ecological and hydrological functions and provide an array of social and economic benefits that society values. Maintaining wetland cover in a watershed provides many ecological, economic, hydrological and social benefits that are listed in the Reference Manual and which may include:
- contributing to the stabilization of shorelines and to the reduction of erosion damage through the mitigation of water flow and soil binding by plant roots
- mitigating surface water flow by storing water during periods of peak flow (such as spring snowmelt and heavy rainfall events) and releasing water during periods of low flow (this mitigation of water flow also contributes to a reduction of flood damage)
- contributing to an improved water quality through the trapping of sediments, the removal and/or retention of excess nutrients, the immobilization and/or degradation of contaminants and the removal of bacteria
- providing renewable harvesting of timber, fuel wood, fish, wildlife and wild rice
- contributing to a stable, long-term water supply in areas of groundwater recharge and discharge
- providing a high diversity of habitats that support a wide variety of plants and animals
- acting as “carbon sinks” making a significant contribution to carbon storage
- providing opportunities for recreation, education, research and tourism
Historically, the overall wetland coverage within the Great Lakes basin exceeded 10 percent, but there was significant variability among watersheds and jurisdictions, as stated in the Environment Canada Guideline. In the Rideau Valley Watershed, it has been estimated that pre-settlement wetland cover averaged 35 percent using information provided by Ducks Unlimited Canada (2010) versus the 21 percent of wetland cover existing in 2014 derived from DRAPE imagery analysis.
Using the same dataset, it is estimated that pre-settlement (historic) wetland cover averaged 51 percent in the Jock River subwatershed versus the 24 percent of cover existing in 2014 (as summarized in Table 6).
Table 6 Wetland cover in the Jock River subwatershed and Richmond Fen catchment (Historic to 2014)
This decline in wetland cover is also evident in the Richmond Fen catchment (as seen in Figure 39) where wetland was reported to cover 70 percent of the area prior to settlement, as compared to 50 percent in 2014. This represents a 29 percent loss of historic wetland cover. To maintain critical hydrological, ecological functions along with related recreational and economic benefits provided by these wetland habitats in the catchment, a “no net loss” of currently existing wetlands should be employed to ensure the continued provision of tangible benefits accruing from them to landowners and surrounding communities.
Figure 39 Richmond Fen catchment wetland cover
3.4 Shoreline Cover
The riparian or shoreline zone is that special area where the land meets the water. Well-vegetated shorelines are critically important in protecting water quality and creating healthy aquatic habitats, lakes and rivers. Natural shorelines intercept sediments and contaminants that could impact water quality conditions and harm fish habitat in streams. Well established buffers protect the banks against erosion, improve habitat for fish by shading and cooling the water and provide protection for birds and other wildlife that feed and rear young near water. A recommended target (from the Environment Canada Guideline) is to maintain a minimum 30 metre wide vegetated buffer along at least 75 percent of the length of both sides of rivers, creeks and streams.
Figure 40 shows the extent of the ‘Natural’ vegetated riparian zone (predominantly wetland/woodland features) and ‘Other’ anthropogenic cover (crop/pastureland, roads/railways, settlements) along a 30-metre-wide area of land, both sides of the shoreline of the Jock River and its tributaries in the Richmond Fen catchment.
Figure 40 Natural and other riparian land cover in the Richmond Fen catchment
This analysis shows that the riparian zone in the Richmond Fen catchment in 2014 was comprised of wetland (56 percent), crop and pastureland (24 percent), woodland (nine percent), transportation (six percent), settlement (four percent) and meadow-thicket (one percent). Additional statistics for the Richmond Fen catchment are presented in Table 7 and show that there has been very little change in shoreline cover from 2008 to 2014.
Table 7 Riparian land cover (2008 vs. 2014) in the Richmond Fen catchment
4.0 Jock River-Richmond Fen Catchment: Stewardship and Water Resources Protection
The RVCA and its partners are working to protect and enhance environmental conditions in the Jock River Subwatershed. Figure 41 shows the location of all stewardship projects completed in the Jock River-Richmond Fen catchment along with sites identified for potential shoreline restoration.
4.1 Rural Clean Water Projects
From 2004 to 2009, two well decommissionings and one crop residue project were finished and prior to 2004, two crop residue projects and one livestock fencing were completed. One of these projects was undertaken within the 30 metre riparian zone of the Jock River. No projects were undertaken between 2010 and 2015. Total value of all six projects is $10,023 with $6,017 of that amount funded through grant dollars from the RVCA.
Figure 41 Stewardship site locations
4.2 Private Land Forestry Projects
The location of RVCA tree planting projects is shown in Figure 41. From 2010 to 2015, 1,000 trees were planted at one site. Between 2004 and 2009, 3,260 trees were planted at two sites and prior to 2004, 91,080 trees were planted at 16 sites, In total, 95,340 trees were planted resulting in the reforestation of 47 hectares. Three of these projects were completed within the 30 metre riparian zone of the Jock River. Total value of all 19 projects is $302,216 with $99,034 of that amount coming from fundraising sources.
4.3 Valley, Stream, Wetland and Hazard Lands
The Richmond Fen catchment covers 26 square kilometres with 14.7 square kilometres (or 57 percent) of the drainage area being within the regulation limit of Ontario Regulation 174/06 (Figure 42), giving protection to wetland areas and river or stream valleys that are affected by flooding and erosion hazards.
Wetlands occupy 12.9 sq. km. (or 49 percent) of the catchment. Of these wetlands, 12 sq. km (or 93 percent) are designated as provincially significant and included within the RVCA regulation limit. This leaves the remaining 0.9 sq. km (or seven percent) of wetlands in the catchment outside the regulated area limit.
Of the 42 kilometres of stream in the catchment, regulation limit mapping has been plotted along 30.2 kilometers of streams (representing 72 percent of all streams in the catchment). Some of these regulated watercourses (21.2 km or 51 percent of all streams) flow through regulated wetlands; the remaining 9 km (or 30 percent) of regulated streams are located outside of those wetlands. Plotting of the regulation limit on the remaining 11.8 km (or 28 percent) of streams requires identification of flood and erosion hazards and valley systems.
Within those areas of the Richmond Fen catchment subject to the regulation (limit), efforts (have been made and) continue through RVCA planning and regulations input and review to manage the impact of development (and other land management practices) in areas where “natural hazards” are associated with rivers, streams, valley lands and wetlands. For areas beyond the regulation limit, protection of the catchment’s watercourses is only provided through the “alteration to waterways” provision of the regulation.
Figure 42 RVCA regulation limits
4.4 Vulnerable Drinking Water Areas
Portions of the Wellhead Protection Areas around the Munster municipal drinking water source and the Richmond (King’s Park) drinking water source are located within the Jock River-Richmond Fen drainage catchment. These areas are subject to mandatory policies in the Mississippi-Rideau Source Protection Plan developed under the Clean Water Act. These policies specifically regulate land uses and activities that are considered drinking water threats, thereby reducing the risk of contamination of the municipal drinking water source.
The Jock River-Richmond Fen drainage catchment is also considered to have a Highly Vulnerable Aquifer. This means that the nature of the overburden (thin soils, fractured bedrock) does not provide a high level of protection for the underlying groundwater making the aquifer more vulnerable to contaminants released on the surface. The Mississippi-Rideau Source Protection Plan includes policies that focus on the protection of groundwater region-wide due to the fact that most of the region, which encompasses the Mississippi and Rideau watersheds, is considered Highly Vulnerable Aquifer.
The lands immediately to the west and north of Munster Hamlet are also considered a Significant Groundwater Recharge Area. This means that there is a volume of water moving from the surface into the ground and groundwater serves either as a municipal drinking water source or supplies a coldwater ecosystem such as a brook trout stream. The Plan was not required to include policies to specifically address Significant Groundwater Recharge Areas.
For detailed maps and policies that have been developed to protect drinking water sources, please go to the Mississippi-Rideau Source Protection Region website at www.mrsourcewater.ca to view the Mississippi-Rideau Source Protection Plan.
5.0 Jock River-Richmond Fen Catchment: Challenges/Issues
Water Quality/Quantity
Surface chemistry water quality rating for the Jock River in the Richmond Fen catchment is unknown
Instream biological water quality conditions for the Jock River in the Richmond Fen catchment are unknown
Existing hydrological and geochemical datasets and assessments (academic, RVCA, others) are only recently available and/or are not being considered in the characterization of the numerous hydrologic functions of the Jock River subwatershed. Further, there is a dearth of hydrologic information (hydroperiod, groundwater/surface water interactions, geochemistry) about the wetlands that remain in the Jock River subwatershed
Headwaters/Instream/Shorelines
‘Natural’ vegetation covers 67 percent of the riparian zone of the Jock River and its tributaries (Figure 40) and is below the recommended 30 metre wide, naturally vegetated target along 75 percent of the length of the catchment’s rivers, creeks and streams
Land Cover
Woodlands cover 18 percent of the catchment and is less than the 30 percent of forest cover that is identified as the minimum threshold for sustaining forest birds and other woodland dependent species (Figure 38)
Pre-settlement wetlands have declined by 29 percent and now cover 50 percent (1290 ha.) of the catchment (Figure 39). Eight percent (101 ha.) of these wetlands remain unevaluated/unregulated and are vulnerable to drainage and land clearing activities in the absence of any regulatory and planning controls that would otherwise protect them for the many important hydrological, social, biological and ecological functions/services/values they provide to landowners and the surrounding community
6.0 Jock River-Richmond Fen Catchment: Opportunities/Actions
Water Quality/Quantity
Consider establishing a surface water quality sampling location along the Jock River at Munster Road
Landowners should consider taking advantage of the Rural Clean Water Programs which offer grants to landowners interested in implementing projects on their property that will help to protect and improve water quality:
- Homeowners may be interested in projects to repair, replace or upgrade their well or septic system, or addressing erosion through buffer plantings and erosion control
- Farmers can take advantage of a wide range of projects, including livestock fencing, manure storage, tile drainage control structures, cover crops, and many more
Continue to coordinate environmental monitoring and reporting activities with the City of Ottawa
Use wetland restoration as a tool to improve surface water quality and help restore the hydrologic integrity of the Jock River and its tributaries
List, share and when possible, synthesize and use existing hydrological and geochemical datasets and assessment outcomes to facilitate the characterization of subwatershed and catchment hydrological functions. In addition, prepare guidance on best practices for the preparation of water budget assessments to better understand the hydrologic cycle requirements that occur at site specific scales; and share existing catchment and subwatershed scale water budget assessment outcomes
Headwaters/Instream/Shorelines
Promote the Rideau Valley Shoreline Naturalization Program to landowners to increase existing 67 percent of natural shoreline cover
Educate landowners about the value of and best management practices used to maintain and enhance natural shorelines and headwater drainage features
Work with the City of Ottawa to consistently implement current land use planning and development policies for water quality and shoreline protection (i.e., adherence to a minimum 30 metre development setback from water) adjacent to the Jock River and other catchment streams
Target shoreline restoration at sites identified in this report (shown as “Other riparian land cover” in Figure 40 and “Potential Riparian/Instream Restoration” in Figures 27/28) and explore other restoration and enhancement opportunities along the Jock River and its tributaries
Land Cover
Promote the City of Ottawa’s Green Acres Reforestation Program to landowners to increase existing 18 percent of woodland cover
Encourage the City of Ottawa to strengthen natural heritage policies in official plans and zoning by-laws where shoreline, wetland, woodland cover and watercourse setbacks are determined to be at or below critical ecological thresholds. Information for this purpose is provided in the RVCA’s subwatershed and catchment reports
Explore ways and means to more effectively enforce and implement conditions of land-use planning and development approvals to achieve net environmental gains
Maintain critical hydrological and ecological functions along with related recreational and economic benefits provided by the Richmond Fen wetland in the catchment by employing a no net loss strategy to ensure the continued provision of tangible benefits accruing from them to landowners and surrounding communities
Re-consider the RVCA’s approach to wetland regulation where there is an identified hydrologic imperative to do so (i.e., significant loss of historic wetland cover (see Figure 39) and/or seasonal, critically low baseflows in the Jock River and/or areas of seasonal flooding)
Full Catchment Report
Jock River Subwatershed Report 2016
KINGS CREEK CATCHMENT
The RVCA produces individual reports for 12 catchments in the Jock River subwatershed. Using data collected and analyzed by the RVCA through its watershed monitoring and land cover classification programs, surface water quality and in-stream conditions are reported for the Jock River along with a summary of environmental conditions for the surrounding countryside every six years.
This information is used to better understand the effects of human activity on our water resources, allows us to better track environmental change over time and helps focus watershed management actions where they are needed the most to help sustain the ecosystem services (cultural, aesthetic and recreational values; provisioning of food, fuel and clean water; regulation of erosion/natural hazard protection and water purification; supporting nutrient/water cycling and habitat provision) provided by the catchment’s lands and forests and waters (Millennium Ecosystem Assessment 2005).
The following sections of this report for the Kings Creek catchment are a compilation of that work.
| Catchment Facts |
Section 1.0 |
| Surface Water Quality Conditions |
Section 2.0 |
| Riparian Conditions |
Section 3.0 |
| Land Cover |
Section 4.0 |
| Land Stewardship and Water Resources Protection |
Section 5.0 |
| Challenges/Issues |
Section 6.0 |
| Actions/Opportunities |
Section 7.0 |
For other Jock River catchments and the Jock River Subwatershed Report, please visit the RVCA website at www.rvca.ca

Figure 1 Land cover in the Kings Creek catchment
1.0 Kings Creek Catchment: Facts
1.1 General/Physical Geography
Municipalities
- Beckwith (39 km2; 43% of catchment)
- Montague (25 km2; 27% of catchment)
- Ottawa: (27 km2; 30% of catchment)
Geology/Physiography
- The Kings Creek Catchment resides with an extensive physiographic region known as the Smith Falls Limestone Plain. In this catchment, the limestone plain is discontinuously overlain by organic soils and localized areas of beach sands and gravels
- In this catchment, bedrock consists of interbedded sandstone and dolostone of the March Formation in the southern parts, and dolostone of the Oxford Formation in the northern parts
Topography
- The ground surface ranges in elevation from approximately 142 masl at the head to approximately 100 masl at the catchment’s outlet
Drainage Area
- 91 square kilometers; occupies 16 percent of the Jock River subwatershed, two percent of the Rideau Valley watershed
Stream Length
- Kings Creek and tributaries: 143 km
1.2 Vulnerable Areas
Aquifer Vulnerability
- The Mississippi-Rideau Source Protection initiative has mapped scattered parts of this catchment as a significant groundwater recharge areas and all the catchment as Highly Vulnerable Aquifer. Parts of Wellhead Protection Area (WHPA) D for the municipal wells in Kemptville underlie the southern extent of this catchment
Wetland Hydrology
- A watershed model developed by the RVCA in 2009 was used to study the hydrologic function of wetlands in the Rideau Valley Watershed, including those found in the Kings Creek catchment
1.3 Conditions at a Glance
Water Quality
- Surface chemistry water quality on Kings Creek catchment is “Good” due to a few of the measured parameters exceeding their respective guidelines
- Instream biological water quality conditions at the Kings Creek sample location range from “Fair” to “ Poor” from 2004 to 2015 (using a grading scheme developed by Ontario Conservation Authorities in Ontario for benthic invertebrates) with an overall benthic invertebrate water quality rating of “Poor” determined for this period
Instream and Riparian
- Overall instream and riparian condition for the Kings Creek catchment as assessed by the stream characterization and headwater drainage feature assessment programs show that the Kings Creek and its tributaries are in generally good condition. The majority of the system has low erosion levels and a healthy forested/wetland riparian corridor along Kings Creek. Instream diversity of aquatic habitat is fairly complex in the lower reaches of Kings Creek, while the upper and middle reaches are dominated by wetland which is a very important wetland feature with high values that support catchment health
Thermal Regime
- Warm/cool water thermal guild supporting the Jock River fishery
Fish Community
- Twenty-nine species of recreational and bait fish
Shoreline Cover Type (30 m. riparian area; 2014)
- Wetland (55%)
- Crop and Pasture (19%)
- Woodland (19%)
- Transportation (3%)
- Settlement (2%)
- Meadow-Thicket (1%)
- Aggregate (<1)
Land Cover Type (2014)
- Woodland (40%)
- Wetland (26%)
- Crop and Pasture (22%)
- Meadow-Thicket (6%)
- Settlement (4%)
- Transportation (2%)
- Aggregate (<1%)
- Water (<1%)
Land Cover Change (2008 to 2014)
- Meadow-Thicket (-26 ha)
- Woodland (-17 ha)
- Crop and Pasture (0 ha)
- Water (0 ha)
- Aggregate (+1 ha)
- Transportation (+5 ha)
- Wetland (+11 ha)
- Settlement (+24 ha)
Significant Natural Features
- Franktown Swamp Provincially Significant Wetland
- Nichols Creek Provincially Significant Wetland
- North Montague Swamp Area of Natural and Scientific Interest
- North Mud Lake Provincially Significant Wetland
- Pinery Road Provincially Significant Wetland
- Prospect Bog Provincially Significant Wetland
- Richmond Fen Provincially Significant Wetland
Water Wells
- Several hundred (~ 430) operational private water wells in the Kings Creek Catchment. Groundwater uses are mainly domestic but also include livestock watering and municipal and other public water supplies
Aggregates
- Four sand and gravel pits within the catchment. Sand and gravel resources are limited and of tertiary importance
Species at Risk (Elemental Occurrence)
- Loggerhead Shrike, Spotted Turtle (Endangered)
- Blanding’s Turtle, Bobolink, Eastern Meadowlark, Gray Ratsnake (Threatened)
- Black Tern, Snapping Turtle (Special Concern)
1.4 Catchment Care
Stewardship
- Thirty-four stewardship projects undertaken (see Section 5)
Environmental Monitoring
- Chemical surface (in-stream) water quality collection since 2003 (see Section 2)
- Benthic invertebrate (aquatic insect) surface (in-stream) water quality collection since 2003 (see Section 3.3.1)
- Fish survey along the Jock River (see Section 3.3.11)
- Stream characterization survey on the Jock River in 2015, working upstream to the headwaters from the mouth of the creek where it empties into the Jock River, taking measurements and recording observations on instream habitat, bank stability, other attributes and preparing a temperature profile (see Section 3)
- Twenty-five headwater drainage feature assessments in 2015 at road crossings in the catchment. The protocol measures zero, first and second order headwater drainage features and is a rapid assessment method characterizing the amount of water, sediment transport, and storage capacity within headwater drainage features (see Section 3.4)
- Groundwater chemistry information is available from the Ontario Geological Survey for a well located in this catchment
Environmental Management
- Development along Kings Creek and in and adjacent to the Provincially Significant Wetlands in the catchment (Franktown Swamp, Nichols Creek, North Mud Lake, Pinery Road, Prospect Bog, Richmond Fen) are subject to Ontario Regulation 174-06 (entitled “Development, Interference with Wetlands and Alterations to Shorelines and Watercourses”) that protects the hydrologic function of the wetland and also protects landowners and their property from natural hazards (flooding, fluctuating water table, unstable soils) associated with them
- One active Permit To Take Water (PTTW) in the Kings Creek catchment issued for pit/quarry dewatering
- Environmental Compliance Approvals issued for a municipal and private sewage work and a municipal or private water works in the catchment
2.0 Kings Creek Catchment: Surface Water Quality Conditions
Surface water quality conditions in the Kings Creek catchment are monitored by the City of Ottawa Baseline Water Quality Monitoring Program. This program provides information on the condition of Ottawa’s surface water resources; data is collected for multiple parameters including nutrients (total phosphorus, total Kjeldahl nitrogen and ammonia), E. coli, metals (like aluminum and copper) and additional chemical/physical parameters (such as alkalinity, chlorides, pH and total suspended solids). The locations of monitoring sites are shown in Figure 2 and Table 1.
Figure 2 Water quality monitoring site on Kings Creek in the Kings Creek Catchment
2.1 Kings Creek Water Quality Rating
The RVCA's water quality rating for the Kings Creek site CK75-01 is “Good” (Table 1) as determined by the Canadian Council of Ministers of the Environment (CCME) Water Quality Index. A “Good” rating indicates that water quality is protected with only a minor degree of threat or impairment; conditions rarely depart from natural or desirable levels. Each parameter is evaluated against established guidelines to determine water quality conditions. Those parameters that are more likely to exceed guidelines are presented below. Table 1 shows the overall rating for the monitored surface water quality site within the Kings Creek catchment and Table 2 outlines the Water Quality Index (WQI) scores and their corresponding ratings.
There is one monitored water quality site on Kings Creek within the Kings Creek Catchment (CK75-01, Figure 2). Due to limited data availability, only data for the 2010-2015 period has been assessed. The water quality scores at this site is “Good” (Table 1), this score is largely due to few parameters that exceed their respective guideline. For more information on the CCME WQI, please see the Jock River Subwatershed Report.
Table 1 Water Quality Index rating for the Kings Creek Catchment
Table 2 Water Quality Index ratings and corresponding index scores (RVCA terminology, original WQI category names in brackets)
2.2 Nutrients
Total phosphorus (TP) is used as a primary indicator of excessive nutrient loading and may contribute to abundant aquatic vegetation growth and depleted dissolved oxygen levels. The Provincial Water Quality Objective (PWQO) is used as the TP Guideline and states that in streams concentrations greater than 0.030 mg/l indicate an excessive amount of TP.
Total Kjeldahl nitrogen (TKN) and ammonia (NH3) are used as secondary indicators of nutrient loading. RVCA uses a guideline of 0.500 mg/l to assess TKN[1] and the PWQO of 0.020 mg/l to assess NH3 concentrations in Kings Creek.
Tables 3, 4 and 5 summarize average nutrient concentrations at the monitored site within the Kings Creek Catchment and show the proportion of results that meet the guidelines.
Table 3 Summary of total phosphorus results for the Kings Creek catchment, 2010-2015
Table 4 Summary of total Kjeldahl nitrogen results for the Kings Creek catchment from 2010-2015. Highlighted values indicate average concentrations exceed the guideline
Table 5 Summary of ammonia results for Kings Creek catchment from 2010-2015
Monitoring Site CK75-01
Elevated TP results were a rare occurrence at site CK75-01. Ninety-eight percent of samples were below the guideline in the 2010-2015 period (Figure 3). The average TP concentration was also well below the guideline at 0.015 mg/l (Table 3).
The bulk of TKN results have exceeded the guideline (Figure 4), with 17 percent of samples below the guideline in the 2010-2015. The average concentration was elevated and exceeded the guideline at 0.645 mg/l (Table 4).
The results for NH3 showed very few exceedances occurred. Ninety-eight percent of results were below the guideline in the 2010-2015 reporting period (Figure 5). The average NH3 was well below the PWQO of 0.004 mg/l (Table 5).
Figure 3 Total phosphorous concentrations in Kings Creek, 2010-2015
Figure 4 Total Kjeldahl nitrogen concentrations in Kings Creek, 2010-2015
Figure 5 Ammonia concentrations in Kings Creek, 2010-2015
Summary
Nutrient enrichment is not a significant feature at the monitored site on Kings Creek. Overall, average TP and NH3 concentrations are well below the guideline, while regular TKN exceedances were observed. The elevated TKN concentrations coupled with low NH3 and TP results provide evidence that nutrient environment may be a natural feature in this part of the creek. Upstream of CK75-01 there is limited development and large wetland areas which likely contribute to naturally high levels of organic nutrients. Best management practices such as minimizing storm water runoff, enhanced shoreline buffers, preventing the use of fertilizers and restricting livestock access should all be employed wherever possible to prevent unnecessary nutrient loading to downstream reaches and protect the “Good” water quality in this area.
2.3 Escherichia coli
Escherichia coli (E. coli) is used as an indicator of bacterial pollution from human or animal waste; in elevated concentrations, it can pose a risk to human health. The PWQO of 100 colony forming units/100 millilitres (CFU/100 ml) is used. E. coli counts greater than this guideline indicate that bacterial contamination may be a problem within a waterbody.
Table 6 summarizes the geometric mean[2] for the monitored site on Kings Creek within this catchment and shows the proportion of samples that meet the E. coli guideline of 100 CFU/100 ml. The results of the geometric mean with respect to the guideline for the 2010-2015 period is shown in Figure 6.
Table 6 Summary of E. coli results for Kings Creek, 2010-2015
Monitoring Site CK75-01
E. coli counts at site CK75-01 were occasionally elevated. These exceedances generally occur in the mid-summer months where increased temperature would favour bacterial growth. Most samples (73 percent) are below the guideline in the 2010-2015 period (Figure 6). The count at the geometric was minimal at 42 CFU/100ml (Table 6).
Figure 6 Geometric mean of E. coli results in Kings Creek, 2010-2015
Summary
Bacterial contamination does not appear to be a significant concern in this reach of Kings Creek. As previously noted; best management practices such as enhancing shoreline buffers, restricting livestock access and minimizing storm water runoff should be employed wherever possible to help protect and enhance water quality conditions in Kings Creek.
1No Ontario guideline for TKN is presently available; however, waters not influenced by excessive organic inputs typically range from 0.100 to 0.500 mg/l, Environment Canada (1979) Water Quality Sourcebook, A Guide to Water Quality Parameters, Inland Waters Directorate, Water Quality Branch, Ottawa, Canada
2A type of mean or average, which indicates the central tendency or typical value of a set of numbers by using the product of their values (as opposed to the arithmetic mean which uses their sum). It is often used to summarize a variable that varies over several orders of magnitude, such as E. coli counts
3.0 Kings Creek Catchment: Riparian Conditions
3.1 Kings Creek Overbank Zone
3.1.1 Riparian Buffer Width Evaluation
Figure 7 demonstrates the buffer conditions of the left and right banks separately. Kings Creek had a buffer of greater than 30 meters along 98 percent of the right bank and 99 percent of the left bank.
Figure 7 Riparian Buffer Evaluation along Kings Creek
3.1.2 Riparian Buffer Alterations
Alterations within the riparian buffer were assessed within three distinct shoreline zones (0-5m, 5-15m, 15-30m), and evaluated based on the dominant vegetative community and/or land cover type (Figure 8). The riparian buffer zone along the Kings Creek was found to be dominated by forest and wetland conditions along the riparian corridor.
Figure 8 Riparian buffer alterations along Kings Creek
3.1.3 Adjacent Land Use
The RVCA’s Stream Characterization Program identifies seven different land uses along Kings Creek (Figure 9). Surrounding land use is considered from the beginning to end of the survey section (100m) and up to 100m on each side of the river. Land use outside of this area is not considered for the surveys but is nonetheless part of the subwatershed and will influence the creek. Natural areas made up 96 percent of the stream, characterized by forest, scrubland, meadow and wetland. Wetland habitat was dominant in the adjacent lands along Kings Creek at 57 percent. The remaining land use consisted of active agriculture, residential and infrastructure in the form of road crossings.
Figure 9 Land Use along Kings Creek
3.2 Kings Creek Shoreline Zone
3.2.1 Instream Erosion
Stream erosion is the process by which water erodes and transports sediments, resulting in dynamic flows and diverse habitat conditions. Excessive erosion can result in drastic environmental changes, as habitat conditions, water quality and aquatic life are all negatively affected. Bank stability was assessed as the overall extent of each section with “unstable” shoreline conditions. These conditions are defined by the presence of significant exposed soils/roots, minimal bank vegetation, severe undercutting, slumping or scour and potential failed erosion measures. The majority of Kings Creek had low levels of erosion with the exception of one location along the system which had moderate to high levels of erosion (Figure 10).
Figure 10 Erosion levels along Kings Creek
3.2.2 Undercut Stream Banks
Stream bank undercuts can provide excellent cover habitat for aquatic life, however excessive levels can be an indication of unstable shoreline conditions. Bank undercut was assessed as the overall extent of each surveyed section with overhanging bank cover present. Figure 11 shows that Kings Creek had low levels of undercut banks along the majority of the system with a few specific locations having moderate levels of undercut banks observed.
Figure 11 Undercut stream banks along Kings Creek
3.2.3 Stream Shading
Grasses, shrubs and trees all contribute towards shading a stream. Shade is important in moderating stream temperature, contributing to food supply and helping with nutrient reduction within a stream. Stream cover is assessed as the total coverage area in each section that is shaded by overhanging trees/grasses and tree canopy, at greater than 1m above the water surface. Figure 12 shows highly variable conditions of low to high levels of stream shading along Kings Creek.
Figure 12 Stream shading along Kings Creek
3.2.4 Instream Woody Debris
Figure 13 shows that the majority of Kings Creek had highly variable levels of instream woody debris in the form of branches and trees along the system. Instream woody debris is important for fish and benthic invertebrate habitat, by providing refuge and feeding areas.
Figure 13 Instream woody debris along Kings Creek
3.2.5 Overhanging Trees and Branches
Trees and branches that are less than one meter from the surface of the water are defined as overhanging. Overhanging branches and trees provide a food source, nutrients and shade which helps to moderate instream water temperatures. Figure 14 shows the system is highly variable with low to high levels of overhanging branches and trees along Kings Creek.
Figure 14 Overhanging trees and branches along Kings Creek
3.2.6 Anthropogenic Alterations
Stream alterations are classified based on specific functional criteria associated with the flow conditions, the riparian buffer and potential human influences. Figure 15 shows 67 percent of Kings Creek remains “unaltered” with no anthropogenic alterations. Thirty two percent of Kings Creek was classified as natural with minor anthropogenic changes while only two percent was considered altered. The alterations along Kings Creek were in the form of road crossings.
Figure 15 Anthropogenic alterations along Kings Creek
3.3 Kings Creek Instream Aquatic Habitat
3.3.1 Benthic Invertebrates
Freshwater benthic invertebrates are animals without backbones that live on the stream bottom and include crustaceans such as crayfish, molluscs and immature forms of aquatic insects. Benthos represent an extremely diverse group of aquatic animals and exhibit wide ranges of responses to stressors such as organic pollutants, sediments and toxicants, which allows scientists to use them as bioindicators. As part of the Ontario Benthic Biomonitoring Network (OBBN), the RVCA has been collecting benthic invertebrates at the Jock Trail Road site on Kings Creek since 2004. Monitoring data is analyzed for each sample site and the results are presented using the Family Biotic Index, Family Richness and percent Ephemeroptera, Plecoptera and Trichoptera.
OBBN sampling location photo from spring 2015 at Jock Trail Road
Hilsenhoff Family Biotic Index
The Hilsenhoff Family Biotic Index (FBI) is an indicator of organic and nutrient pollution and provides an estimate of water quality conditions for each site using established pollution tolerance values for benthic invertebrates. FBI results for the Kings Creek catchment sample location at Jock Trail Road are summarized by year from 2004 to 2015. “Fair” to “Poor” water quality conditions was observed at the Kings Creek sample location (Figure 16) using a grading scheme developed by Conservation Authorities in Ontario for benthic invertebrates.
Figure 16 Hilsenhoff Family Biotic Index at the Kings Creek Jock Trail Road sample location
Family Richness
Family Richness measures the health of the community through its diversity and increases with increasing habitat diversity suitability and healthy water quality conditions. Family Richness is equivalent to the total number of benthic invertebrate families found within a sample. The Kings Creek site is reported to have “Fair” family richness (Figure 17).
Figure 17 Family Richness at the Kings Creek Jock Trail Road sample location
EPT
Ephemeroptera (Mayflies), Plecoptera (Stoneflies), and Trichoptera (Caddisflies) are species considered to be very sensitive to poor water quality conditions. High abundance of these organisms is generally an indication of good water quality conditions at a sample location. The community structure is typically dominated by species that are moderately tolerant and tolerant to poorer water quality conditions. As a result, the EPT indicates that the Kings Creek sample location is reported to have “Fair” to “Poor” water quality (Figure 18) from 2004 to 2015.
Figure 18 EPT at the Kings Creek Jock Trail Road sample location
Conclusion
Overall the Kings Creek sample location aquatic habitat conditions from a benthic invertebrate perspective is considered “Poor” from 2004 to 2015 as the samples are dominated by species that are moderately tolerant and tolerant to high organic pollution levels.
3.3.2 Habitat Complexity
Habitat complexity is a measure of the overall diversity of habitat types and features within a stream. Streams with high habitat complexity support a greater variety of species niches, and therefore contribute to greater diversity. Factors such as substrate, flow conditions (pools, riffles) and cover material (vegetation, wood structure, etc.) all provide crucial habitat to aquatic life. Habitat complexity is assessed based on the presence of boulder, cobble and gravel substrates, as well as the presence of instream woody material.
Low to high habitat complexity was identified for Kings Creek (Figure 19). Regions with increased habitat complexity were observed in the lower to middle reaches of the system within the catchment.
Figure 19 Habitat complexity along Kings Creek
3.3.3 Instream Substrate
Diverse substrate is important for fish and benthic invertebrate habitat because some species have specific substrate requirements and for example will only reproduce on certain types of substrate. The absence of diverse substrate types may limit the overall diversity of species within a stream. Figure 20 shows the overall presence of various substrate types observed along Kings Creek. Substrate conditions were highly diverse along Kings Creek with all substrate types being recorded at various locations along the creek. Figure 21 shows the dominant substrate type observed for each section surveyed along Kings Creek.
Figure 20 Instream substrate along Kings Creek
Figure 21 Dominant substrate type along Kings Creek
3.3.4 Instream Morphology
Pools and riffles are important habitat features for aquatic life. Riffles are fast flowing areas characterized by agitation and overturn of the water surface. Riffles thereby play a crucial role in contributing to dissolved oxygen conditions and directly support spawning for some fish species. They are also areas that support high benthic invertebrate populations which are an important food source for many aquatic species. Pools are characterized by minimal flows, with relatively deep water and winter/summer refuge habitat for aquatic species. Runs are moderately shallow, with unagitated surfaces of water and areas where the thalweg (deepest part of the channel) is in the center of the channel. Figure 22 shows that Kings Creek is highly variable; 64 percent consists of runs, 5 percent riffles and 31 percent pools. Figure xx shows where the riffle habitat areas were observed along Kings Creek.
Figure 22 Instream morphology along Kings Creek
3.3.5 Vegetation Type
Instream vegetation provides a variety of functions and is a critical component of the aquatic ecosystem. Aquatic plants promote stream health by:
- Providing direct riparian/instream habitat
- Stabilizing flows reducing shoreline erosion
- Contributing to dissolved oxygen through photosynthesis
- Maintaining temperature conditions through shading
For example emergent plants along the shoreline can provide shoreline protection from wave action and important rearing habitat for species of waterfowl. Submerged plants provide habitat for fish to find shelter from predator fish while they feed. Floating plants such as water lilies shade the water and can keep temperatures cool while reducing algae growth. Narrow leaved emergents were present at 95% of the sections surveyed, algae was observed in 80% of sections, while free floating plants were observed in 7% of surveyed sections. Broad leaved emergents were observed in 35% of sections, submerged plants in 97%, floating plants in 78% and robust emergents in 27% of sections surveyed. Fifty eight percent of the sections had no instream vegetation present, this is likely as a result of a large number of sections with bedrock as the dominant substrate type. It is very difficult for instream vegetation to establish in those sections with vegetation establishing only along the shoreline. Figure 23 depicts the plant community structure for Kings Creek. Figure 24 shows the dominant vegetation type observed for each section surveyed along the Kings Creek catchment.

Figure 23 Vegetation type along Kings Creek
Figure 24 Dominant vegetation type along Kings Creek
3.3.6 Instream Vegetation Abundance
Instream vegetation is an important factor for a healthy stream ecosystem. Vegetation helps to remove contaminants from the water, contributes oxygen to the stream, and provides habitat for fish and wildlife. Too much vegetation can also be detrimental. Figure 25 demonstrates that the Kings Creek reach had no vegetation to low levels of instream vegetation for 22 percent of its length. Normal to common levels of vegetation were recorded at 35 percent of stream surveys. Extensive levels of vegetation were observed along 43 percent of the systems length and were consistent with areas dominated by European Frogbit.
Figure 25 Instream vegetation abundance along Kings Creek
3.3.7 Invasive Species
Invasive species can have major implications on streams and species diversity. Invasive species are one of the largest threats to ecosystems throughout Ontario and can out compete native species, having negative effects on local wildlife, fish and plant populations. Seventy eight percent of the sections surveyed along Kings Creek reach had invasive species. The invasive species observed in the Kings Creek reach were European frogbit, poison/wild parsnip, purple loosestrife, rusty crayfish and Manitoba maple. Invasive species abundance (i.e. the number of observed invasive species per section) was assessed to determine the potential range/vector of many of these species (Figure 26).
Figure 26 Invasive species abundance along Kings Creek
3.3.8 Water Chemistry
During the stream characterization survey, a YSI probe is used to collect water chemistry information. Dissolved oxygen (DO), specific conductivity (SPC) and pH are measured at the start and end of each section.
3.3.8.1 Dissolved Oxygen
Dissolved oxygen is a measure of the amount of oxygen dissolved in water. The Canadian Environmental Quality Guidelines of the Canadian Council of Ministers of the Environment (CCME) suggest that for the protection of aquatic life the lowest acceptable dissolved oxygen concentration should be 6 mg/L for warmwater biota and 9.5 mg/L for coldwater biota (CCME, 1999). Figure 27 shows that the dissolved oxygen in Kings Creek was within the threshold for warmwater biota in this reach of the system. The average dissolved oxygen levels observed within Kings Creek was 5.05mg/L which is below the recommended levels for warmwater biota. The upper sections of the reach fell below the recommended 6.0mg/L for warmwater biota.
Figure 27 Dissolved oxygen ranges in Kings Creek
3.3.8.2 Conductivity
Conductivity in streams is primarily influenced by the geology of the surrounding environment, but can vary drastically as a function of surface water runoff. Currently there are no CCME guideline standards for stream conductivity; however readings which are outside the normal range observed within the system are often an indication of unmitigated discharge and/or stormwater input. The average conductivity observed within the main stem of Kings Creek catchment was 383.91 µs/cm. Figure 28 shows the conductivity readings for Kings Creek.
Figure 28 Specific conductivity ranges in Kings Creek
3.3.8.3 pH
Based on the PWQO for pH, a range of 6.5 to 8.5 should be maintained for the protection of aquatic life. Average pH values for the Kings Creek catchment averaged 7.54 thereby meeting the provincial standard (Figure 29).
Figure 29 pH ranges in Kings Creek
3.3.8.4 Oxygen Saturation (%)
Oxygen saturation is measured as the ratio of dissolved oxygen relative to the maximum amount of oxygen that will dissolve based on the temperature and atmospheric pressure. Well oxygenated water will stabilize at or above 100% saturation, however the presence of decaying matter/pollutants can drastically reduce these levels. Oxygen input through photosynthesis has the potential to increase saturation above 100% to a maximum of 500%, depending on the productivity level of the environment. In order to represent the relationship between concentration and saturation, the measured values have been summarized into 6 classes:
- <100% Saturation / <6.0 mg/L Concentration. Oxygen concentration and saturation are not sufficient to support aquatic life and may represent impairment
- >100% Saturation / <6.0 mg/L Concentration. Oxygen concentration is not sufficient to support aquatic life, however saturation levels indicate that the water has stabilized at its estimated maximum. This is indicative of higher water temperatures and stagnant flows.
- <100% Saturation / 6.0-9.5 mg/L Concentration. Oxygen concentration is sufficient to support warm water biota, however depletion factors are likely present and are limiting maximum saturation.
- >100% Saturation / 6.0-9.5 mg/L Concentration. Oxygen concentration and saturation levels are optimal for warm water biota.
- <100% Saturation / >9.5 mg/L Concentration. Oxygen concentration is sufficient to support cold water biota, however depletion factors are likely present and are limiting maximum saturation.
- >100% Saturation / >9.5 mg/L Concentration. Oxygen concentration and saturation levels are optimal for cold water biota.
 and saturation (%) in Kings Creek")
Figure 30 A bivariate assessment of dissolved oxygen concentration (mg/L) and saturation (%) in Kings Creek
Dissolved oxygen conditions on the Kings Creek catchment are generally sufficient for both warm and coolwater species (Figure 30). Dissolved oxygen conditions are higher in the lower reach and lower in the upper reaches which are dominated by wetland habitat. Oxygen levels in wetland habitats are typically lower than they are in areas where the substrate is dominated by cobble and riffle habitat.
3.3.8.5 Specific Conductivity Assessment
Specific conductivity (SPC) is a standardized measure of electrical conductance, collected at or corrected to a water temperature of 25⁰C. SPC is directly related to the concentration of ions in water, and is commonly influenced by the presence of dissolved salts, alkalis, chlorides, sulfides and carbonate compounds. The higher the concentration of these compounds, the higher the conductivity. Common sources of elevated conductivity include storm water, agricultural inputs and commercial/industrial effluents.
In order to summarize the conditions observed, SPC levels were evaluated as either normal, moderately elevated or highly elevated. These categories correspond directly to the degree of variation (i.e. standard deviation) at each site relative to the average across the system.
Normal levels were maintained along the majority of Kings Creek, however there were elevated areas in the middle reaches (Figure 31).
Figure 31 Relative specific conductivity levels along Kings Creek
3.3.9 Thermal Regime
Many factors can influence fluctuations in stream temperature, including springs, tributaries, precipitation runoff, discharge pipes and stream shading from riparian vegetation. Water temperature is used along with the maximum air temperature (using the Stoneman and Jones method) to classify a watercourse as either warm water, cool water or cold water. Figure 32 shows where the thermal sampling sites were located along Kings Creek. Analysis of the data collected indicates that Kings Creek catchment is classified as a warm water system with cool water reaches (Figure 33).
Figure 32 Temperature logger locations in the Kings Creek catchment
Figure 33 Temperature logger data for the three sites in the Kings Creek catchment
Each point on the graph represents a temperature that meets the following criteria:
- Sampling dates between July 1st and September 7th
- Sampling date is preceded by two consecutive days above 24.5 °C, with no rain
- Water temperatures are collected at 4pm
- Air temperature is recorded as the max temperature for that day
3.3.10 Groundwater
Groundwater discharge areas can influence stream temperature, contribute nutrients, and provide important stream habitat for fish and other biota. During stream surveys, indicators of groundwater discharge are noted when observed. Indicators include: springs/seeps, watercress, iron staining, significant temperature change and rainbow mineral film. Figure 34 shows areas where one or more of the above groundwater indicators were observed during stream surveys and headwater assessments.
Figure 34 Groundwater indicators observed in the Kings Creek catchment
3.3.11 Fish Community
The Kings Creek catchment is classified as a mixed community of warm and cool water recreational and baitfish fishery with 29 species observed. Figure 35 shows the sampling locations along the Jock River in the Barrhaven catchment.
Figure 35 Fish species observed at sampling locations in the Kings Creek catchment
Fyke net set on Kings Creek
The following table contains a list of species observed in the watershed.
Table 7 Fish community species observed in the Kings Creek catchment
3.3.12 Migratory Obstructions
It is important to know locations of migratory obstructions because these can prevent fish from accessing important spawning and rearing habitat. Migratory obstructions can be natural or manmade, and they can be permanent or seasonal. Figure 36 shows that Kings Creek catchment had several debris dams and beaver dams identified along Kings Creek at the time of the survey in 2015.
Figure 36 Migratory obstructions in the Kings Creek catchment
3.3.13 Riparian Restoration
Figure 37 depicts the locations of riparian restoration opportunities as a result of observations made during the stream survey.
Figure 37 Riparian restoration opportunities in the Kings Creek catchment
3.4 Headwater Drainage Features Assessment
3.4.1 Headwater Sampling Locations
The RVCA Stream Characterization program assessed Headwater Drainage Features for the Jock River subwatershed in 2015. This protocol measures zero, first and second order headwater drainage features (HDF). It is a rapid assessment method characterizing the amount of water, sediment transport, and storage capacity within headwater drainage features (HDF). RVCA is working with other Conservation Authorities and the Ministry of Natural Resources and Forestry to implement the protocol with the goal of providing standard datasets to support science development and monitoring of headwater drainage features. An HDF is a depression in the land that conveys surface flow. Additionally, this module provides a means of characterizing the connectivity, form and unique features associated with each HDF (OSAP Protocol, 2013). In 2015 the program sampled 26 sites at road crossings in the Kings Creek catchment area (Figure 38).

Figure 38 Location of the headwater sampling site in the Kings Creek catchment
3.4.2 Headwater Feature Type
The headwater sampling protocol assesses the feature type in order to understand the function of each feature. The evaluation includes the following classifications: defined natural channel, channelized or constrained, multi-thread, no defined feature, tiled, wetland, swale, roadside ditch and pond outlet. By assessing the values associated with the headwater drainage features in the catchment area we can understand the ecosystem services that they provide to the watershed in the form of hydrology, sediment transport, and aquatic and terrestrial functions. The headwater drainage features in the Kings Creek catchment are primarily classified as wetland with twelve, six features classified as natural, one feature was classified as a road side ditch, one multi thread and six features as channelized. Figure 39 shows the feature type of the primary feature at the sampling locations.
Figure 39 Headwater feature types in the Kings Creek catchment
A spring photo of the headwater sample site in the Kings Creek catchment located on Bourne Road
A summer photo of the headwater sample site in the Kings Creek catchment located on Bourne Road
3.4.3 Headwater Feature Flow
The observed flow condition within headwater drainage features can be highly variable depending on timing relative to the spring freshet, recent rainfall, soil moisture, etc. Flow conditions are assessed in the spring and in the summer to determine if features are perennial and flow year round, if they are intermittent and dry up during the summer months or if they are ephemeral systems that do not flow regularly and generally respond to specific rainstorm events or snowmelt. Flow conditions in headwater systems can change from year to year depending on local precipitation patterns. Figure 40 shows the observed flow condition at the sampling locations in the Kings Creek catchment in 2015.
Figure 40 Headwater feature flow conditions in the Kings Creek catchment
3.4.4 Feature Channel Modifications
Channel modifications were assessed at each headwater drainage feature sampling location. Modifications include channelization, dredging, hardening and realignments. The Kings Creek catchment area had fourteen with no channel modifications observed, six site as having been recently dredged, three locations had mixed modifications, one had channel had been hardened and one had a pond area constructed. Figure 41 shows the channel modifications observed at the sampling locations for Kings Creek.
Figure 41 Headwater feature channel modifications in the Kings Creek catchment
3.4.5 Headwater Feature Vegetation
Headwater feature vegetation evaluates the type of vegetation that is found within the drainage feature. The type of vegetated within the channel influences the aquatic and terrestrial ecosystem values that the feature provides. For some types of headwater features the vegetation within the feature plays a very important role in flow and sediment movement and provides wildlife habitat. The following classifications are evaluated no vegetation, lawn, wetland, meadow, scrubland and forest. Figure 42 depicts the dominant vegetation observed at the sampled headwater sites in the Kings Creek catchment.
Figure 42 Headwater feature vegetation types in the Kings Creek catchment
3.5.6 Headwater Feature Riparian Vegetation
Headwater riparian vegetation evaluates the type of vegetation that is found along the adjacent lands of a headwater drainage feature. The type of vegetation within the riparian corridor influences the aquatic and terrestrial ecosystem values that the feature provides to the watershed. Figure 43 depicts the type of riparian vegetation observed at the sampled headwater sites in the Kings Creek catchment.
Figure 43 Headwater feature riparian vegetation types in the Kings Creek catchment
3.5.7 Headwater Feature Sediment Deposition
Assessing the amount of recent sediment deposited in a channel provides an index of the degree to which the feature could be transporting sediment to downstream reaches (OSAP, 2013). Evidence of excessive sediment deposition might indicate the requirement to follow up with more detailed targeted assessments upstream of the site location to identify potential best management practices to be implemented. Sediment deposition ranged from none to extensive for the headwater sites sampled in the Kings Creek catchment area. Figure 44 depicts the degree of sediment deposition observed at the sampled headwater sites in the Kings Creek catchment.
Figure 44 Headwater feature sediment deposition in the Kings Creek catchment
3.5.8 Headwater Feature Upstream Roughness
Feature roughness will provide a measure of the amount of materials within the bankfull channel that could slow down the velocity of water flowing within the headwater feature (OSAP, 2013). Materials on the channel bottom that provide roughness include vegetation, woody debris and boulders/cobble substrates. Roughness can provide benefits in mitigating downstream erosion on the headwater drainage feature and the receiving watercourse by reducing velocities. Roughness also provides important habitat conditions for aquatic organisms. Figure 45 shows the feature roughness conditions at the sampling location in the Kings Creek catchment.
Figure 45 Headwater feature roughness in the Kings Creek catchment
4.0 Kings Creek Catchment: Land Cover
Land cover and any change in coverage that has occurred over a six year period is summarized for the Kings Creek catchment using spatially continuous vector data representing the catchment during the spring of 2008 and 2014. This dataset was developed by the RVCA through heads-up digitization of 20cm DRAPE ortho-imagery at a 1:4000 scale and details the surrounding landscape using 10 land cover classes.
4.1 Kings Creek Catchment Change
As shown in Table 8 and Figure 1, the dominant land cover type in 2014 was woodland followed by wetland and crop and pastureland.
Table 8 Land cover (2008 vs. 2014) in the Kings Creek catchment
* Does not include treed swamps ** Includes treed swamps
From 2008 to 2014, there was an overall change of 112 hectares (from one land cover class to another). Most of the change in the Kings Creek catchment is a result of crop and pastureland reverting to woodland and the conversion of woodland to crop and pastureland and settlement along with meadow-thicket areas being turned into crop and pastureland (Figure 46).
Figure 46 Land cover change in the Kings Creek catchment (2014)
Table 9 provides a detailed breakdown of all land cover change that has taken place in the Kings Creek catchment between 2008 and 2014.
Table 9 Land cover change in the Kings Creek catchment (2008 to 2014)
4.2 Woodland Cover
In the Environment Canada Guideline (Third Edition) entitled “How Much Habitat Is Enough?” (hereafter referred to as the “Guideline”) the opening narrative under the Forest Habitat Guidelines section states that prior to European settlement, forest was the predominant habitat in the Mixedwood Plains ecozone. The remnants of this once vast forest now exist in a fragmented state in many areas (including the Rideau Valley watershed) with woodland patches of various sizes distributed across the settled landscape along with higher levels of forest cover associated with features such as the Frontenac Axis (within the on-Shield areas of the Rideau Lakes and Tay River subwatersheds). The forest legacy, in terms of the many types of wildlife species found, overall species richness, ecological functions provided and ecosystem complexity is still evident in the patches and regional forest matrices (found in the Jock River subwatershed and elsewhere in the Rideau Valley watershed). These ecological features are in addition to other influences which forests have on water quality and stream hydrology including reducing soil erosion, producing oxygen, storing carbon along with many other ecological services that are essential not only for wildlife but for human well-being.
The Guideline also notes that forests provide a great many habitat niches that are in turn occupied by a great diversity of plant and animal species. They provide food, water and shelter for these species - whether they are breeding and resident locally or using forest cover to help them move across the landscape. This diversity of species includes many that are considered to be species at risk. Furthermore, from a wildlife perspective, there is increasing evidence that the total forest cover in a given area is a major predictor of the persistence and size of bird populations, and it is possible or perhaps likely that this pattern extends to other flora and fauna groups. The overall effect of a decrease in forest cover on birds in fragmented landscapes is that certain species disappear and many of the remaining ones become rare, or fail to reproduce, while species adapted to more open and successional habitats, as well as those that are more tolerant to human-induced disturbances in general, are able to persist and in some cases thrive. Species with specialized-habitat requirements are most likely to be adversely affected. The overall pattern of distribution of forest cover, the shape, area and juxtaposition of remaining forest patches and the quality of forest cover also play major roles in determining how valuable forests will be to wildlife and people alike.
The current science generally supports minimum forest habitat requirements between 30 and 50 percent, with some limited evidence that the upper limit may be even higher, depending on the organism/species phenomenon under investigation or land-use/resource management planning regime being considered/used.
As shown in Figure 47, 41 percent of the Kings Creek catchment contains 3665 hectares of upland forest and 89 hectares of lowland forest (treed swamps) versus the 26 percent of woodland cover in the Jock River subwatershed. This is greater than the 30 percent of forest cover that is identified as the minimum threshold required to sustain forest birds according to the Guideline and which may only support less than one half of potential species richness and marginally healthy aquatic systems. When forest cover drops below 30 percent, forest birds tend to disappear as breeders across the landscape.
Figure 47 Woodland cover and forest interior (2014)
4.2.1 Woodland (Patch) Size
According to the Ministry of Natural Resources’ Natural Heritage Reference Manual (Second Edition), larger woodlands are more likely to contain a greater diversity of plant and animal species and communities than smaller woodlands and have a greater relative importance for mobile animal species such as forest birds.
Bigger forests often provide a different type of habitat. Many forest birds breed far more successfully in larger forests than they do in smaller woodlots and some rely heavily on forest interior conditions. Populations are often healthier in regions with more forest cover and where forest fragments are grouped closely together or connected by corridors of natural habitat. Small forests support small numbers of wildlife. Some species are “area-sensitive” and tend not to inhabit small woodlands, regardless of forest interior conditions. Fragmented habitat also isolates local populations, especially small mammals, amphibians and reptiles with limited mobility. This reduces the healthy mixing of genetic traits that helps populations survive over the long run (Conserving the Forest Interior. Ontario Extension Notes, 2000).
The Environment Canada Guideline also notes that for forest plants that do not disperse broadly or quickly, preservation of some relatively undisturbed large forest patches is needed to sustain them because of their restricted dispersal abilities and specialized habitat requirements and to ensure continued seed or propagation sources for restored or regenerating areas nearby.
The Natural Heritage Reference Manual continues by stating that a larger size also allows woodlands to support more resilient nutrient cycles and food webs and to be big enough to permit different and important successional stages to co-exist. Small, isolated woodlands are more susceptible to the effects of blowdown, drought, disease, insect infestations, and invasions by predators and non-indigenous plants. It is also known that the viability of woodland wildlife depends not only on the characteristics of the woodland in which they reside, but also on the characteristics of the surrounding landscape where the woodland is situated. Additionally, the percentage of forest cover in the surrounding landscape, the presence of ecological barriers such as roads, the ability of various species to cross the matrix surrounding the woodland and the proximity of adjacent habitats interact with woodland size in influencing the species assemblage within a woodland.
In the Kings Creek catchment (in 2014), one hundred and eighteen (43 percent) of the 273 woodland patches are very small, being less than one hectare in size. Another 118 (43 percent) of the woodland patches ranging from one to less than 20 hectares in size tend to be dominated by edge-tolerant bird species. The remaining 37 (14 percent of) woodland patches range between 20 and 377 hectares in size. Twenty-nine of these patches contain woodland between 20 and 100 hectares and may support a few area-sensitive species and some edge intolerant species, but will be dominated by edge tolerant species.
Conversely, eight (three percent) of the 273 woodland patches in the drainage area exceed the 100 plus hectare size needed to support most forest dependent, area sensitive birds and are large enough to support approximately 60 percent of edge-intolerant species. Five patches top 200 hectares, which according to the Environment Canada Guideline will support 80 percent of edge-intolerant forest bird species (including most area sensitive species) that prefer interior forest habitat conditions.
Table 10 presents a comparison of woodland patch size in 2008 and 2014 along with any changes that have occurred over that time. A decrease (of 17 ha) has been observed in the overall woodland patch area between the two reporting periods with most change occurring in the 20 to 50 woodland patch size class range.
Table 10 Woodland patches in the Kings Creek catchment (2008 and 2014)
*Includes treed swamps
4.2.2 Woodland (Forest) Interior Habitat
The forest interior is habitat deep within woodlands. It is a sheltered, secluded environment away from the influence of forest edges and open habitats. Some people call it the “core” or the “heart” of a woodland. The presence of forest interior is a good sign of woodland health, and is directly related to the woodland’s size and shape. Large woodlands with round or square outlines have the greatest amount of forest interior. Small, narrow woodlands may have no forest interior conditions at all. Forest interior habitat is a remnant natural environment, reminiscent of the extensive, continuous forests of the past. This increasingly rare forest habitat is now a refuge for certain forest-dependent wildlife; they simply must have it to survive and thrive in a fragmented forest landscape (Conserving the Forest Interior. Ontario Extension Notes, 2000).
The Natural Heritage Reference Manual states that woodland interior habitat is usually defined as habitat more than 100 metres from the edge of the woodland and provides for relative seclusion from outside influences along with a moister, more sheltered and productive forest habitat for certain area sensitive species. Woodlands with interior habitat have centres that are more clearly buffered against the edge effects of agricultural activities or more harmful urban activities than those without.
In the Kings Creek catchment (in 2014), the 273 woodland patches contain 129 forest interior patches (Figure 47) that occupy seven percent (656 ha.) of the catchment land area (which is greater than the three percent of interior forest in the Jock River Subwatershed). This is below the ten percent figure referred to in the Environment Canada Guideline that is considered to be the minimum threshold for supporting edge intolerant bird species and other forest dwelling species in the landscape.
Most patches (115) have less than 10 hectares of interior forest, 77 of which have small areas of interior forest habitat less than one hectare in size. The remaining 14 patches contain interior forest between 10 and 127 hectares in area. Between 2008 and 2014, there has been a large change in the number of woodland patches containing smaller areas (below 10 hectares) of interior habitat with an overall loss of 26 hectares in the catchment (Table 11), suggesting an increase in forest fragmentation over the six year period.
Table 11 Woodland interior in the Kings Creek catchment (2008 and 2014)
4.3 Wetland Cover
Wetlands are habitats forming the interface between aquatic and terrestrial systems. They are among the most productive and biologically diverse habitats on the planet. By the 1980s, according to the Natural Heritage Reference Manual, 68 percent of the original wetlands south of the Precambrian Shield in Ontario had been lost through encroachment, land clearance, drainage and filling.
Wetlands perform a number of important ecological and hydrological functions and provide an array of social and economic benefits that society values. Maintaining wetland cover in a watershed provides many ecological, economic, hydrological and social benefits that are listed in the Reference Manual and which may include:
- contributing to the stabilization of shorelines and to the reduction of erosion damage through the mitigation of water flow and soil binding by plant roots
- mitigating surface water flow by storing water during periods of peak flow (such as spring snowmelt and heavy rainfall events) and releasing water during periods of low flow (this mitigation of water flow also contributes to a reduction of flood damage)
- contributing to an improved water quality through the trapping of sediments, the removal and/or retention of excess nutrients, the immobilization and/or degradation of contaminants and the removal of bacteria
- providing renewable harvesting of timber, fuel wood, fish, wildlife and wild rice
- contributing to a stable, long-term water supply in areas of groundwater recharge and discharge
- providing a high diversity of habitats that support a wide variety of plants and animals
- acting as “carbon sinks” making a significant contribution to carbon storage
- providing opportunities for recreation, education, research and tourism
Historically, the overall wetland coverage within the Great Lakes basin exceeded 10 percent, but there was significant variability among watersheds and jurisdictions, as stated in the Environment Canada Guideline. In the Rideau Valley Watershed, it has been estimated that pre-settlement wetland cover averaged 35 percent using information provided by Ducks Unlimited Canada (2010) versus the 21 percent of wetland cover existing in 2014 derived from DRAPE imagery analysis.
Using the same dataset, it is estimated that pre-settlement (historic) wetland cover averaged 51 percent in the Jock River subwatershed versus the 24 percent of cover existing in 2014 (as summarized in Table 12).
Table 12 Wetland cover in the Jock River subwatershed and Kings Creek catchment (Historic to 2014)
This decline in wetland cover is also evident in the Kings Creek catchment (as seen in Figure 48) where wetland was reported to cover 42 percent of the area prior to settlement, as compared to 26 percent in 2014. This represents a 38 percent loss of historic wetland cover. To maintain critical hydrological, ecological functions along with related recreational and economic benefits provided by these wetland habitats in the catchment, a “no net loss” of currently existing wetlands should be employed to ensure the continued provision of tangible benefits accruing from them to landowners and surrounding communities.
Figure 48 Kings Creek catchment wetland cover
4.4 Shoreline Cover
The riparian or shoreline zone is that special area where the land meets the water. Well-vegetated shorelines are critically important in protecting water quality and creating healthy aquatic habitats, lakes and rivers. Natural shorelines intercept sediments and contaminants that could impact water quality conditions and harm fish habitat in streams. Well established buffers protect the banks against erosion, improve habitat for fish by shading and cooling the water and provide protection for birds and other wildlife that feed and rear young near water. A recommended target (from the Environment Canada Guideline) is to maintain a minimum 30 metre wide vegetated buffer along at least 75 percent of the length of both sides of rivers, creeks and streams.
Figure 49 shows the extent of the ‘Natural’ vegetated riparian zone (predominantly wetland/woodland features) and ‘Other’ anthropogenic cover (crop/pastureland, roads/railways, settlements) along a 30-metre-wide area of land, both sides of the shoreline of the Jock River and its tributaries in the Kings Creek catchment.
Figure 49 Natural and other riparian land cover in the Kings Creek catchment
This analysis shows that the riparian zone in the Kings Creek catchment in 2014 was comprised of wetland (55 percent), woodland (19 percent), crop and pastureland (19 percent), transportation (three percent), settlement (two percent), meadow-thicket (one percent) and aggregate (less than one percent). Additional statistics for the Kings Creek catchment are presented in Table 13 and show that there has been very little change in shoreline cover from 2008 to 2014.
Table 13 Riparian land cover (2008 vs. 2014) in the Kings Creek catchment
5.0 Kings Creek Catchment: Stewardship and Water Resources Protection
The RVCA and its partners are working to protect and enhance environmental conditions in the Jock River Subwatershed. Figure 50 shows the location of all stewardship projects completed in the Kings Creek catchment along with sites identified for potential shoreline restoration.
5.1 Rural Clean Water Projects
From 2010 to 2015, two well upgrades, two windbreak buffers, one septic system replacement and one clean water diversion project were completed. Between 2004 and 2009, two well upgrades, one septic system replacement, one well decommissioning and one well replacement were completed. Total value of all 11 projects is $65,519 with $14,786 of that amount funded through grant dollars from the RVCA.
Figure 50 Stewardship site locations
5.2 Private Land Forestry Projects
The location of RVCA tree planting projects is shown in Figure 50. From 2010 to 2015, 16,900 trees were planted at seven sites. Between 2004 and 2009, 15,600 trees were planted at three sites and prior to 2004, 74,560 trees were planted at 13 sites, In total, 107,060 trees were planted resulting in the reforestation of 52 hectares. One of these projects was completed within the 30 metre riparian zone of the Jock River. Total value of all 23 projects is $322,147 with $99,138 of that amount coming from fundraising sources.
Through the RVCA Butternut Recovery Program, an additional 20 butternut trees were planted in the Kings Creek catchment (Figure 50) between 2004 and 2015, as part of efforts to introduce healthy seedlings from tolerant butternuts into various locations across Eastern Ontario.
5.3 Valley, Stream, Wetland and Hazard Lands
The Kings Creek catchment covers 91 square kilometres with 16.5 square kilometres (or 18 percent) of the drainage area being within the regulation limit of Ontario Regulation 174/06 (Figure 51), giving protection to wetland areas and river or stream valleys that are affected by flooding and erosion hazards.
Wetlands occupy 23.4 sq. km. (or 26 percent) of the catchment. Of these wetlands, 9.1 sq. km (or 39 percent) are designated as provincially significant and included within the RVCA regulation limit. This leaves the remaining 14.3 sq. km (or 61 percent) of wetlands in the catchment outside the regulated area limit.
Of the 143.1 kilometres of stream in the catchment, regulation limit mapping has been plotted along 26.7 kilometers of streams (representing 19 percent of all streams in the catchment). Some of these regulated watercourses (21.7 km or 15 percent of all streams) flow through regulated wetlands; the remaining 5 km (or 19 percent) of regulated streams are located outside of those wetlands. Plotting of the regulation limit on the remaining 116.4 km (or 81 percent) of streams requires identification of flood and erosion hazards and valley systems.
Within those areas of the Kings Creek catchment subject to the regulation (limit), efforts (have been made and) continue through RVCA planning and regulations input and review to manage the impact of development (and other land management practices) in areas where “natural hazards” are associated with rivers, streams, valley lands and wetlands. For areas beyond the regulation limit, protection of the catchment’s watercourses is only provided through the “alteration to waterways” provision of the regulation.
Figure 51 RVCA regulation limits
5.4 Vulnerable Drinking Water Areas
The Kings Creek drainage catchment is considered to have a Highly Vulnerable Aquifer. This means that the nature of the overburden (thin soils, fractured bedrock) does not provide a high level of protection for the underlying groundwater making the aquifer more vulnerable to contaminants released on the surface. The Mississippi-Rideau Source Protection Plan includes policies that focus on the protection of groundwater region-wide due to the fact that most of the region, which encompasses the Mississippi and Rideau watersheds, is considered Highly Vulnerable Aquifer.
For detailed maps and policies that have been developed to protect drinking water sources, please go to the Mississippi-Rideau Source Protection Region website at www.mrsourcewater.ca to view the Mississippi-Rideau Source Protection Plan.
6.0 Kings Creek Catchment: Challenges/Issues
Water Quality/Quantity
Instream biological water quality conditions at the Kings Creek sample location range from “Fair” to “ Poor” from 2004 to 2015 (using a grading scheme developed by Ontario Conservation Authorities in Ontario for benthic invertebrates) with an overall benthic invertebrate water quality rating of “Poor” determined for this period
Natural hazard lands have not been identified
Existing hydrological and geochemical datasets and assessments (academic, RVCA, others) are only recently available and/or are not being considered in the characterization of the numerous hydrologic functions of the Jock River subwatershed. Further, there is a dearth of hydrologic information (hydroperiod, groundwater/surface water interactions, geochemistry) about the wetlands that remain in the Jock River subwatershed
Land Cover
Pre-settlement wetlands have declined by 38 percent and now cover 26 percent (2343 ha.) of the catchment (Figure 50). Sixty-one percent (1432 ha) of these wetlands remain unevaluated/unregulated and are vulnerable to drainage and land clearing activities in the absence of any regulatory and planning controls that would otherwise protect them for the many important hydrological, social, biological and ecological functions/services/values they provide to landowners and the surrounding community
7.0 Kings Creek Catchment: Opportunities/Actions
Water Quality/Quantity
Landowners should consider taking advantage of The Rural Clean Water Programs which offer grants to landowners interested in implementing projects on their property that will help to protect and improve water quality:
- Homeowners may be interested in projects to repair, replace or upgrade their well or septic system, or addressing erosion through buffer plantings and erosion control
- Farmers can take advantage of a wide range of projects, including livestock fencing, manure storage, tile drainage control structures, cover crops, and many more
Continue to coordinate environmental monitoring and reporting activities with the City of Ottawa
Use wetland restoration as a tool to improve surface water quality and help restore the hydrologic integrity of the Jock River and its tributaries, including Kings Creek
List, share and when possible, synthesize and use existing hydrological and geochemical datasets and assessment outcomes to facilitate the characterization of subwatershed and catchment hydrological functions. In addition, prepare guidance on best practices for the preparation of water budget assessments to better understand the hydrologic cycle requirements that occur at site specific scales; and share existing catchment and subwatershed scale water budget assessment outcomes
Kings Creek flood risks are to be studied as part of ongoing efforts to prepare flood plain mapping for the Jock River subwatershed
Headwaters/Instream/Shorelines
Promote the Rideau Valley Shoreline Naturalization Programs to landowners to increase shoreline cover
Educate landowners about the value of and best management practices used to maintain and enhance natural shorelines and headwater drainage features
Work with the Townships of Beckwith and Montague and City of Ottawa to consistently implement current land use planning and development policies for water quality and shoreline protection (i.e., adherence to a minimum 30 metre development setback from water) adjacent to the Jock River and other catchment watercourses, including Kings Creek
Target shoreline restoration at sites identified in this report (shown as “Other riparian land cover” in Figure 49 and “Potential Riparian Restoration” in Figure 37) and explore other restoration and enhancement opportunities along Kings Creek and its tributaries
Land Cover
Promote the City of Ottawa Green Acres Reforestation Program and the Rideau Valley Trees for Tomorrow Program to landowners to increase existing woodland cover
Encourage the Townships of Montague and Beckwith and City of Ottawa to strengthen natural heritage policies in official plans and zoning by-laws where shoreline, wetland, woodland cover and watercourse setbacks are determined to be at or below critical ecological thresholds. Information for this purpose is provided in the RVCA’s subwatershed and catchment reports
Explore ways and means to more effectively enforce and implement conditions of land-use planning and development approvals to achieve net environmental gains
Re-consider the RVCA’s approach to wetland regulation where there is an identified hydrologic imperative to do so (i.e., significant loss of historic wetland cover (see Figure 48) and/or seasonal, critically low baseflows in the Jock River and/or areas of seasonal flooding)
Full Catchment Report
Jock River Subwatershed Report 2016
MONAHAN DRAIN CATCHMENT
The RVCA produces individual reports for 12 catchments in the Jock River subwatershed. Using data collected and analyzed by the RVCA through its watershed monitoring and land cover classification programs, surface water quality and in-stream conditions are reported for the Jock River along with a summary of environmental conditions for the surrounding countryside every six years.
This information is used to better understand the effects of human activity on our water resources, allows us to better track environmental change over time and helps focus watershed management actions where they are needed the most to help sustain the ecosystem services (cultural, aesthetic and recreational values; provisioning of food, fuel and clean water; regulation of erosion/natural hazard protection and water purification; supporting nutrient/water cycling and habitat provision) provided by the catchment’s lands and forests and waters (Millennium Ecosystem Assessment 2005).
The following sections of this report for the Monahan Drain catchment are a compilation of that work.
| Catchment Facts |
Section 1.0 |
| Surface Water Quality Conditions |
Section 2.0 |
| Riparian Conditions |
Section 3.0 |
| Land Cover |
Section 4.0 |
| Land Stewardship and Water Resources Protection |
Section 5.0 |
| Challenges/Issues |
Section 6.0 |
| Actions/Opportunities |
Section 7.0 |
For other Jock River catchments and the Jock River Subwatershed Report, please visit the RVCA website at www.rvca.ca

Figure 1 Land cover in the Monahan Drain catchment
1.0 Monahan Drain Catchment: Facts
1.1 General/Physical Geography
Municipalities
- Ottawa: (45 km2; 100% of catchment)
Geology/Physiography
- The Monahan Catchment resides within an extensive physiographic region known as the Ottawa Valley Clay Plain. This part of the clay plain can be greater than 15 metres deep but is truncated to the north and west where Paleozoic bedrock outcrops at the ground surface. This sediment was deposited in the Champlain Sea after the last glaciation. In this catchment, the Kars Esker, a regional sand and gravel feature, is found beneath the clay plain and is oriented northwest–southeast
- In this catchment, the clay plain and buried esker are underlain mostly by dolostone and some limestone from the Oxford, Gull River and Bobcaygeon Formations. In addition, several geologic faults may pass through the catchment
Topography
- The ground surface ranges in elevation from approximately 125 masl near along Old Richmond Road to approximately 90 masl at the catchment’s outlet
Drainage Area
- 45 square kilometers; occupies eight percent of the Jock River subwatershed, one percent of the Rideau Valley watershed
Stream Length
- Monahan Drain and tributaries: 97 km
1.2 Vulnerable Areas
Aquifer Vulnerability
- The Mississippi-Rideau Source Protection initiative has not identified any Significant Groundwater Recharge Areas (SGRA), Highly Vulnerable Aquifers (HVA) or Wellhead Protection Areas (WHPA) in the catchment
Wetland Hydrology
- A watershed model developed by the RVCA in 2009 was used to study the hydrologic function of wetlands in the Rideau Valley Watershed, including those found in the Monahan Drain catchment
1.3 Conditions at a Glance
Water Quality
- Surface chemistry water quality rating in the Monahan Drain catchment is rated as “Poor” at both monitored water quality sites for the 2010-2015 period. The scores are largely influenced by frequent high nutrient concentrations, bacterial pollution, occasional metal exceedances and elevated chloride levels
- Instream biological water quality conditions in the Monahan Drain are unknown
Instream and Riparian
- Overall instream and riparian condition for the Monahan Drain is unknown
Thermal Regime
- Warm/cool water thermal guild supporting the Jock River fishery
Fish Community
- Twenty-three species of recreational and bait fish
Shoreline Cover Type (30 m. riparian area; 2014)
- Crop and Pasture (65%)
- Settlement (14%)
- Transportation (13%)
- Woodland (6%)
- Meadow-Thicket (2%)
Land Cover Type (2014)
- Crop and Pasture (60%)
- Settlement (22%)
- Transportation (8%)
- Woodland (7%)
- Meadow-Thicket (2%)
- Aggregate (1%)
- Wetland (<1%)
- Water (<1%)
Land Cover Change (2008 to 2014)
- Crop and Pasture (-181 ha)
- Woodland (-36 ha)
- Meadow-Thicket (-4 ha)
- Wetland (0 ha)
- Water (+3 ha)
- Aggregate (+8 ha)
- Transportation (+59 ha)
- Settlement (+152 ha)
Significant Natural Features
- Stony Swamp Provincially Significant Wetland
Water Wells
- Several hundred (~500) operational private water wells in the Monahan Drain Catchment. Groundwater uses are mainly domestic, but also include groundwater monitoring and testing, municipal and other public water supplies, livestock watering and crop irrigation and commercial and industrial uses
Aggregates
- Sections of three bedrock quarry licenses within the catchment
Species at Risk (Elemental Occurrence)
- Bobolink (Threatened)
- Eastern Milksnake (Special Concern)
1.4 Catchment Care
Stewardship
- Twenty-two stewardship projects undertaken (see Section 5)
Environmental Monitoring
- Chemical surface (in-stream) water quality collection since 2003 (see Section 2)
- Fish survey along the Monahan Drain (see Section 3.1.3)
- Thirteen headwater drainage feature assessments in 2015 at road crossings in the catchment. The protocol measures zero, first and second order headwater drainage features and is a rapid assessment method characterizing the amount of water, sediment transport, and storage capacity within headwater drainage features (see Section 3.2)
- Groundwater chemistry information is available from the Ontario Geological Survey for two wells located in this catchment
Environmental Management
- Development along the Monahan Drain and in and adjacent to the Stony Swamp Provincially Significant Wetland in the catchment is subject to Ontario Regulation 174-06 (entitled “Development, Interference with Wetlands and Alterations to Shorelines and Watercourses”) that protects the hydrologic function of the wetland and also protects landowners and their property from natural hazards (flooding, fluctuating water table, unstable soils) associated with them
- Twenty active Permits To Take Water (PTTW) in the Monahan Drain catchment issued for ongoing construction dewatering and 1 active PTTW for nursery irrigation
- Twenty Environmental Compliance Approvals and/or Environmental Activity and Sector Registrations in the Monahan Drain Catchment. Most of these approvals/registrations are for municipal and private sewage works and municipal drinking water systems, while others are for waste management systems, municipal or private water works, industrial sewage works and air emissions
2.0 Monahan Drain Catchment: Surface Water Quality Conditions
Surface water quality conditions in the Monahan Drain catchment are monitored by the City of Ottawa’s Baseline Water Quality Monitoring Program. This program provides information on the condition of Ottawa’s surface water resources; data is collected for multiple parameters including nutrients (total phosphorus, total Kjeldahl nitrogen and ammonia), E. coli, metals (like aluminum and copper) and additional chemical/physical parameters (such as alkalinity, chlorides, pH and total suspended solids). The locations of monitoring sites are shown in Figure 2 and Table 1.
Figure 2 Water quality monitoring sites on the Monahan Drain
2.1 Monahan Drain Water Quality Rating
The RVCA's water quality rating for the Monahan Drain sites (CK68-01 and CK68-03) are “POOR” (Table 1) as determined by the Canadian Council of Ministers of the Environment (CCME) Water Quality Index[1]. A “POOR” rating indicates that water quality is frequently threatened or impaired; conditions often depart from natural or desirable levels. Each parameter is evaluated against established guidelines to determine water quality conditions. Those parameters that frequently exceed guidelines are presented below. Table 1 shows the overall rating for the monitored surface water quality sites within the Monahan Drain catchment and Table 2 outlines the Water Quality Index (WQI) scores and their corresponding ratings.
There are two monitored water quality sites on the Monahan Drain in this catchment (CK68-01 and CK68-03, Figure 2). There is limited data prior to 2010, therefore only data from the 2010-2015 period will be presented in the following. Water quality scores at both sites is reported as “Poor” (Table 1). The scores at these sites are largely influenced by frequent high nutrient concentrations, bacterial pollution, occasional metal exceedances and elevated chloride levels. For more information on the CCME WQI, please see the Jock River Subwatershed Report.
Table 1 Water Quality Index ratings for the Monahan Drain Catchment
Table 2 Water Quality Index ratings and corresponding index scores (RVCA terminology, original WQI category names in brackets)
2.2 Nutrients
Total phosphorus (TP) is used as a primary indicator of excessive nutrient loading and may contribute to abundant aquatic vegetation growth and depleted dissolved oxygen levels. The Provincial Water Quality Objective (PWQO) is used as the TP Guideline and states that in streams concentrations greater than 0.030 mg/l indicate an excessive amount of TP.
Total Kjeldahl nitrogen (TKN) and ammonia (NH3) are used as secondary indicators of nutrient loading. RVCA uses a guideline of 0.500 mg/l to assess TKN[2] and the PWQO of 0.020 mg/l to assess NH3 concentrations in the Jock River.
Tables 3, 4 and 5 summarize average nutrient concentrations at monitored sites within the Jock River-Barrhaven catchment and show the proportion of results that meet the guidelines.
Table 3 Summary of total phosphorus results for the Monahan Drain catchment, 2004-2009 and 2010-2015. Highlighted values indicate average concentrations exceed the guideline
Table 4 Summary of total Kjeldahl nitrogen results for the Monahan Drain catchment from 2004-2009 and 2010-2015. Highlighted values indicate average concentrations exceed the guideline
Table 5 Summary of ammonia results for Monahan Drain catchment from 2004-2009 and 2010-2015. Highlighted values indicate average concentrations exceed the guideline
Monitoring Site CK68-01
The majority of samples at site CK68-01 were above the TP guideline in the 2010-2015 monitoring period. There were no samples below the guideline (Figure 3) and the average concentration was 0.108 mg/l.
TKN concentrations show that the bulk of results exceeded the guideline (Figure 4); there were few samples (two percent) in the 2010-2015 period. The average concentration was elevated at 0.851 mg/l (Table 4).
In the 2010-2015 reporting period only 10 percent of NH3 results were below the guideline with an average concentration of 0.227 mg/l (Figure 5, Table 5).
Monitoring Site CK68-03
Elevated TP results were also common occurrence at site CK68-03. There were no TP results below the guideline in the 2010-2015 period (Figure 3). The average TP concentration was well above the PWQO guideline at 0.140 mg/l (Table 3).
Similar to TP results, all samples analyzed for TKN have exceeded the guideline (Figure 4). The average concentration was 1.115 mg/l (Table 4).
The results for NH3 indicate that exceedances were common. Twelve percent of samples were below the guideline in the 2010-2015 period (Figure 5). The average NH3 concentration was 0.399 mg/l (Table 5).
Figure 3 Total phosphorous concentrations in the Monahan Drain, 2010-2015
Figure 4 Total Kjeldahl nitrogen concentrations in the Monahan Drain, 2010-2015
Figure 5 Ammonia concentrations in the Monahan Drain, 2010-2015
Summary
Nutrient enrichment is a feature in the monitored portions of the Monahan Drain. Overall, average nutrient concentrations are very high with very few results below established guidelines. All parameters (total phosphorus, total Kjeldahl nitrogen and ammonia) are above guidelines at each site. Elevated nutrients may result in nutrient loading to the Jock River. High nutrient concentrations can help stimulate the growth of algae blooms and other aquatic vegetation in a waterbody and deplete oxygen levels as the vegetation dies off. Best management practices such as minimizing storm water runoff, enhanced shoreline buffers, preventing fertilizer runoff and restricting cattle access in upstream agricultural areas can help to reduce nutrient enrichment in the Jock River.
2.3 Escherichia coli
Escherichia coli (E. coli) is used as an indicator of bacterial pollution from human or animal waste; in elevated concentrations it can pose a risk to human health. The PWQO of 100 colony forming units/100 millilitres (CFU/100 ml) is used. E. coli counts greater than this guideline indicate that bacterial contamination may be a problem within a waterbody.
Table 6 summarizes the geometric mean[3] for the monitored sites on the Jock River within the Barrhaven catchment and shows the proportion of samples that meet the E. coli guideline of 100 CFU/100 ml. The results of the geometric mean with respect to the guideline is shown in Figure 6.
Table 6 Summary of
E. coli results for the Jock River, 2010-2015
Monitoring Site CK68-01
E. coli counts at site CK68-01 indicate bacterial pollution at this site is common, the majority of results exceeded the PWQO with 43 percent of samples below the guideline (Figure 6). The count at the geometric mean was 125 CFU/100ml (Table 6).
Monitoring Site CK68-03
Elevated E. coli counts at site CK68-03 were also a regular occurrence. The majority of samples (51 percent) were below the guideline (Figure 6). The geometric mean was just above the PWQO at 101 CFU/100ml (Table 6).
Figure 6 E.coli count in the Monahan Drain, 2010-2015
Summary
Bacterial pollution appears to be a significant concern in Monahan Drain. Both sites (CK68-01 and CK68-03) have regular exceedances and counts at the geometric mean are above the guideline of 100 CFU/100ml. Best management practices such as restricting livestock assess and minimizing runoff should be employed wherever possible to protect water quality conditions in this tributary and downstream impacts on the Jock River.
2.4 Metals
Of the metals routinely monitored in the Monahan Drain, aluminum (Al) regularly reported concentrations above the respective PWQO. In elevated concentrations, these metals can have toxic effects on sensitive aquatic species.
Table 7 summarize metal concentrations at sites CK68-01 and CK68-03, and show the proportion of samples that meet guidelines. Figure 7 shows Al concentration with respect to the guideline of 0.075 mg/l for 2010-2015 period.
Table 7 Summary of Aluminum results in the Monahan Drain, 2010-2015. Highlighted values indicate average concentrations exceed the guideline
Monitoring Site CK68-01
The average Al concentration at site CK68-01 exceeded the guideline, only 20 percent of result were below the guideline (Figure 7). The average concentration was also elevated at 0.306 mg/l (Table 7).
Monitoring Site CK68-03
Results from site show elevated Al concentrations are also a concern further upstream. Only 34 percent of samples were below the guideline (Figure 7). The average concentration of Al was 0.385 mg/l (Table 7).

Figure 7 Average aluminum concentrations in the Monahan Drain, 2010-2015
Summary
In the Monahan Drain catchment aluminum concentrations have increased at both sites, CK68-01 and CK68-03. Increased concentrations appear to be more common during the spring and fall and therefore may be due to increased runoff from rainfall/meltwater. Efforts should continue to be made to identify pollution sources and implement best management practices to reduce any inputs such as storm water runoff, metal alloys from vehicle traffic, fungicides and pesticides to improve overall stream health and lessen downstream impacts.
2.5 Chloride
Chloride is a naturally occurring component of surface water. However, it has been shown to an indicator of increasing urbanization due to runoff from road salt application and can impact sensitive aquatic species. Of all the sites monitored in the Jock River subwatershed the two sites on the Monahan Drain were the only locations that had the majority of samples above the chloride guideline of 120 mg/l.
Table 8 Summary of chloride results in the Monahan Drain, 2010-2015
Monitoring Site CK68-01
The average chloride concentration at site CK68-01 was below the guideline at 94 mg/l. Though overall the concentration met the objective only 29 percent of result were below the guideline (Figure 8). The average concentration was also elevated at 306 mg/l (Table 8).
Monitoring Site CK68-03
Results from site show elevated chloride concentrations are also a concern further upstream. Only 22 percent of samples were below the guideline (Figure 8). The average concentration was 99 mg/l (Table 7).
Figure 8. Chloride concentrations in the Monahan Drain, 2010-2015
Summary
In the Monahan Drain catchment there is evidence of elevated chloride concentrations at both sites, CK68-01 and CK68-03. The concentrations tend to be elevated regardless of the season, (please note the result for January in Figure 8 is based on a single sample value). As this is a highly altered feature in a agricultural area, it is likely to be impacted by local land uses. Further investigation is perhaps warranted to see if the outflow has an impact on the Jock River.
1 The City of Ottawa Baseline Water Quality Monitoring Program has also applied the CCME WQI to monitored sites. The parameters used in the index and time periods differs between the RVCA and City of Ottawa’s application of the index, thus in same cases has resulted in different ratings
2 No Ontario guideline for TKN is presently available; however, waters not influenced by excessive organic inputs typically range from 0.100 to 0.500 mg/l, Environment Canada (1979) Water Quality Sourcebook, A Guide to Water Quality Parameters, Inland Waters Directorate, Water Quality Branch, Ottawa, Canada
3 A type of mean or average, which indicates the central tendency or typical value of a set of numbers by using the product of their values (as opposed to the arithmetic mean which uses their sum). It is often used to summarize a variable that varies over several orders of magnitude, such as E. coli counts
3.0 Monahan Drain Catchment: Riparian Conditions
3.1 Monahan Drain Instream Aquatic Habitat
3.1.1 Thermal Regime
Many factors can influence fluctuations in stream temperature, including springs, tributaries, precipitation runoff, discharge pipes and stream shading from riparian vegetation. Water temperature is used along with the maximum air temperature (using the Stoneman and Jones method) to classify a watercourse as either warm water, cool water or cold water. Figure 9 shows where the thermal sampling site was located on Monahan Drain. Analysis of the data collected indicates that Monahan Drain is classified as a warm water system (Figure 10).
Figure 9 Temperature logger location in the Monahan Drain catchment on Old Richmond Road
Figure 10 Temperature logger data for the site location on Monahan Drain.
Each point on the graph represents a temperature that meets the following criteria:
- Sampling dates between July 1st and September 7th
- Sampling date is preceded by two consecutive days above 24.5 °C, with no rain
- Water temperatures are collected at 4pm
- Air temperature is recorded as the max temperature for that day
3.1.2 Groundwater
Groundwater discharge areas can influence stream temperature, contribute nutrients, and provide important stream habitat for fish and other biota. During stream surveys, indicators of groundwater discharge are noted when observed. Indicators include: springs/seeps, watercress, iron staining, significant temperature change and rainbow mineral film. Figure 11 shows areas where one or more of the above groundwater indicators were observed during the headwater assessments.
Figure 11 Groundwater indicators observed in the Monahan Drain catchment
3.1.3 Fish Community
The Monahan Drain catchment is classified as a mixed community of warm and cool water recreational and baitfish fishery with 23 species observed. Figure 12 shows the sampling locations in the Monahan Drain catchment.
Figure 12 Monahan Drain catchment fish community
The following table contains a list of species observed in the watershed.
Table 9 Fish species observed in Monahan Drain catchment
3.2 Headwater Drainage Features Assessment
3.2.1 Headwaters Sampling Locations
The RVCA Stream Characterization program assessed Headwater Drainage Features for the Jock River subwatershed in 2015. This protocol measures zero, first and second order headwater drainage features (HDF). It is a rapid assessment method characterizing the amount of water, sediment transport, and storage capacity within headwater drainage features (HDF). RVCA is working with other Conservation Authorities and the Ministry of Natural Resources and Forestry to implement the protocol with the goal of providing standard datasets to support science development and monitoring of headwater drainage features. An HDF is a depression in the land that conveys surface flow. Additionally, this module provides a means of characterizing the connectivity, form and unique features associated with each HDF (OSAP Protocol, 2013). In 2015 the program sampled 13 sites at road crossings in the Monahan Drain catchment area (Figure 13).

Figure 13 Locations of the headwater sampling sites in the Monahan Drain catchment
3.2.2 Headwater Feature Type
The headwater sampling protocol assesses the feature type in order to understand the function of each feature. The evaluation includes the following classifications: defined natural channel, channelized or constrained, multi-thread, no defined feature, tiled, wetland, swale, roadside ditch and pond outlet. By assessing the values associated with the headwater drainage features in the catchment area we can understand the ecosystem services that they provide to the watershed in the form of hydrology, sediment transport, and aquatic and terrestrial functions. Six features were classified as having been channelized, 3 features were roadside ditches, one wetland which was an online stormwater pond/constructed wetland and two features were identified as natural. Figure 14 shows the feature type of the primary feature at the sampling locations.
Figure 14 Headwater feature types in the Monahan Drain catchment
3.2.3 Headwater Feature Flow
The observed flow condition within headwater drainage features can be highly variable depending on timing relative to the spring freshet, recent rainfall, soil moisture, etc. Flow conditions are assessed in the spring and in the summer to determine if features are perennial and flow year round, if they are intermittent and dry up during the summer months or if they are ephemeral systems that do not flow regularly and generally respond to specific rainstorm events or snowmelt. Flow conditions in headwater systems can change from year to year depending on local precipitation patterns. Figure 15 shows the observed flow conditions at the sampling locations in the Monahan Drain catchment in 2015.
Figure 15 Headwater feature flow conditions in the Monahan Drain catchment
A spring photo of the headwater sample site in the Monahan Drain catchment located on Fernbank Road
A summer photo of the headwater sample site in the Monahan Drain catchment located on Fernbank Road
3.2.4 Feature Channel Modifications
The majority of the headwater drainage features in the Monahan catchment are classified as municipal drains and have been historically created and or modified natural systems. Channel modifications were assessed at each headwater drainage feature sampling location. Modifications include dredging, channel hardening and mixed modifications. The Monahan Drain catchment area had one feature which was classified as being hardened, seven classified as dredged and four were identified as having mixed modifications. Figure 16 shows the channel modifications observed at the sampling locations for Monahan Drain.
Figure 16 Headwater feature channel modifications in the Monahan Drain catchment
3.2.5 Headwater Feature Vegetation
Headwater feature vegetation evaluates the type of vegetation that is found within the drainage feature. The type of vegetated within the channel influences the aquatic and terrestrial ecosystem values that the feature provides. For some types of headwater features the vegetation within the feature plays a very important role in flow and sediment movement and provides fish and wildlife habitat. The following classifications are evaluated no vegetation, lawn, wetland, meadow, scrubland and forest. The features assessed in the Monahan Drain catchment were classified as being dominated by wetland and meadow vegetation. Three features were classified as having no vegetation within the channel. Figure 17 depicts the dominant vegetation observed at the sampled headwater sites in the Monahan Drain catchment.
Figure 17 Headwater feature vegetation types in the Monahan Drain catchment
3.2.6 Headwater Feature Riparian Vegetation
Headwater riparian vegetation evaluates the type of vegetation that is found along the adjacent lands of a headwater drainage feature. The type of vegetation within the riparian corridor influences the aquatic and terrestrial ecosystem values that the feature provides to the watershed. Four sample locations in Monahan Drain were dominated by natural vegetation in the form of scrubland and meadow vegetation. Nine sample locations were dominated by other forms of vegetation of either crops or ornamental grasses. Figure 18 depicts the type of riparian vegetation observed at the sampled headwater sites in the Monahan Drain catchment.
Figure 18 Headwater feature riparian vegetation types in the Monahan Drain catchment
3.2.7 Headwater Feature Sediment Deposition
Assessing the amount of recent sediment deposited in a channel provides an index of the degree to which the feature could be transporting sediment to downstream reaches (OSAP, 2013). Evidence of excessive sediment deposition might indicate the requirement to follow up with more detailed targeted assessments upstream of the site location to identify potential best management practices to be implemented. Conditions ranged from no deposition observed to extensive deposition recorded. Figure 19 depicts the degree of sediment deposition observed at the sampled headwater sites in the Monahan Drain catchment.
Figure 19 Headwater feature sediment deposition in the Monahan Drain catchment
3.2.8 Headwater Feature Upstream Roughness
Feature roughness will provide a measure of the amount of materials within the bankfull channel that could slow down the velocity of water flowing within the headwater feature (OSAP, 2013). Materials on the channel bottom that provide roughness include vegetation, woody debris and boulders/cobble substrates. Roughness can provide benefits in mitigating downstream erosion on the headwater drainage feature and the receiving watercourse by reducing velocities. Roughness also provides important habitat conditions for aquatic organisms. The sample locations in the Monahan Drain catchment area ranged from minimal to extreme roughness conditions. Figure 20 shows the feature roughness conditions at the sampling locations in the Monahan Drain catchment.
Figure 20 Headwater feature roughness in the Monahan Drain catchment
4.0 Monahan Drain Catchment: Land Cover
Land cover and any change in coverage that has occurred over a six year period is summarized for the Monahan Drain catchment using spatially continuous vector data representing the catchment during the spring of 2008 and 2014. This dataset was developed by the RVCA through heads-up digitization of 20cm DRAPE ortho-imagery at a 1:4000 scale and details the surrounding landscape using 10 land cover classes.
4.1 Monahan Drain Catchment Change
As shown in Table 10 and Figure 1, the dominant land cover type in 2014 was crop and pastureland, followed by settlement.
Table 10 Land cover (2008 vs. 2014) in the Monahan Drain catchment
* Does not include treed swamps ** Includes treed swamps
From 2008 to 2014, there was an overall change of 307 hectares (from one land cover class to another). Most of the change in the Monahan Drain catchment is a result of the conversion of crop and pastureland and woodland to settlement and transportation (Figure 21).
Figure 21 Land cover change in the Monahan Drain catchment (2014)
Table 11 provides a detailed breakdown of all land cover change that has taken place in the Monahan Drain catchment between 2008 and 2014.
Table 11 Land cover change in the Monahan Drain catchment (2008 to 2014)
4.2 Woodland Cover
In the Environment Canada Guideline (Third Edition) entitled “How Much Habitat Is Enough?” (hereafter referred to as the “Guideline”) the opening narrative under the Forest Habitat Guidelines section states that prior to European settlement, forest was the predominant habitat in the Mixedwood Plains ecozone. The remnants of this once vast forest now exist in a fragmented state in many areas (including the Rideau Valley watershed) with woodland patches of various sizes distributed across the settled landscape along with higher levels of forest cover associated with features such as the Frontenac Axis (within the on-Shield areas of the Rideau Lakes and Tay River subwatersheds). The forest legacy, in terms of the many types of wildlife species found, overall species richness, ecological functions provided and ecosystem complexity is still evident in the patches and regional forest matrices (found in the Jock River subwatershed and elsewhere in the Rideau Valley watershed). These ecological features are in addition to other influences which forests have on water quality and stream hydrology including reducing soil erosion, producing oxygen, storing carbon along with many other ecological services that are essential not only for wildlife but for human well-being.
The Guideline also notes that forests provide a great many habitat niches that are in turn occupied by a great diversity of plant and animal species. They provide food, water and shelter for these species - whether they are breeding and resident locally or using forest cover to help them move across the landscape. This diversity of species includes many that are considered to be species at risk. Furthermore, from a wildlife perspective, there is increasing evidence that the total forest cover in a given area is a major predictor of the persistence and size of bird populations, and it is possible or perhaps likely that this pattern extends to other flora and fauna groups. The overall effect of a decrease in forest cover on birds in fragmented landscapes is that certain species disappear and many of the remaining ones become rare, or fail to reproduce, while species adapted to more open and successional habitats, as well as those that are more tolerant to human-induced disturbances in general, are able to persist and in some cases thrive. Species with specialized-habitat requirements are most likely to be adversely affected. The overall pattern of distribution of forest cover, the shape, area and juxtaposition of remaining forest patches and the quality of forest cover also play major roles in determining how valuable forests will be to wildlife and people alike.
The current science generally supports minimum forest habitat requirements between 30 and 50 percent, with some limited evidence that the upper limit may be even higher, depending on the organism/species phenomenon under investigation or land-use/resource management planning regime being considered/used.
As shown in Figure 22, seven percent of the Monahan Drain catchment contains 315 hectares of upland forest versus the 26 percent of woodland cover in the Jock River subwatershed. This is less than the 30 percent of forest cover that is identified as the minimum threshold required to sustain forest birds according to the Guideline and which may only support less than one half of potential species richness and marginally healthy aquatic systems. When forest cover drops below 30 percent, forest birds tend to disappear as breeders across the landscape.
Figure 22 Woodland cover and forest interior (2014)
4.2.1 Woodland (Patch) Size
According to the Ministry of Natural Resources’ Natural Heritage Reference Manual (Second Edition), larger woodlands are more likely to contain a greater diversity of plant and animal species and communities than smaller woodlands and have a greater relative importance for mobile animal species such as forest birds.
Bigger forests often provide a different type of habitat. Many forest birds breed far more successfully in larger forests than they do in smaller woodlots and some rely heavily on forest interior conditions. Populations are often healthier in regions with more forest cover and where forest fragments are grouped closely together or connected by corridors of natural habitat. Small forests support small numbers of wildlife. Some species are “area-sensitive” and tend not to inhabit small woodlands, regardless of forest interior conditions. Fragmented habitat also isolates local populations, especially small mammals, amphibians and reptiles with limited mobility. This reduces the healthy mixing of genetic traits that helps populations survive over the long run (Conserving the Forest Interior. Ontario Extension Notes, 2000).
The Environment Canada Guideline also notes that for forest plants that do not disperse broadly or quickly, preservation of some relatively undisturbed large forest patches is needed to sustain them because of their restricted dispersal abilities and specialized habitat requirements and to ensure continued seed or propagation sources for restored or regenerating areas nearby.
The Natural Heritage Reference Manual continues by stating that a larger size also allows woodlands to support more resilient nutrient cycles and food webs and to be big enough to permit different and important successional stages to co-exist. Small, isolated woodlands are more susceptible to the effects of blowdown, drought, disease, insect infestations, and invasions by predators and non-indigenous plants. It is also known that the viability of woodland wildlife depends not only on the characteristics of the woodland in which they reside, but also on the characteristics of the surrounding landscape where the woodland is situated. Additionally, the percentage of forest cover in the surrounding landscape, the presence of ecological barriers such as roads, the ability of various species to cross the matrix surrounding the woodland and the proximity of adjacent habitats interact with woodland size in influencing the species assemblage within a woodland.
In the Monahan Drain catchment (in 2014), fifty-two (52 percent) of the 100 woodland patches are very small, being less than one hectare in size. Another 45 (45 percent) of the woodland patches ranging from one to less than 20 hectares in size tend to be dominated by edge-tolerant bird species. The remaining three (three percent of) woodland patches range between 24 and 41 hectares in size and may support a few area-sensitive species along with some edge intolerant species, but will be dominated by edge tolerant species. No patch exceeds the 100 plus hectare size needed to support most forest dependent, area sensitive birds and which are large enough to support approximately 60 percent of edge-intolerant species. No patch tops 200 hectares, which according to the Environment Canada Guideline will support 80 percent of edge-intolerant forest bird species (including most area sensitive species) that prefer interior forest habitat conditions.
Table 12 presents a comparison of woodland patch size in 2008 and 2014 along with any changes that have occurred over that time. A decrease (of 37 ha) has been observed in the overall woodland patch area between the two reporting periods with most change occurring in the 20 to50 hectare woodland patch size class range.
Table 12 Woodland patches in the Monahan Drain catchment (2008 and 2014)
*Includes treed swamps
4.2.2 Woodland (Forest) Interior Habitat
The forest interior is habitat deep within woodlands. It is a sheltered, secluded environment away from the influence of forest edges and open habitats. Some people call it the “core” or the “heart” of a woodland. The presence of forest interior is a good sign of woodland health, and is directly related to the woodland’s size and shape. Large woodlands with round or square outlines have the greatest amount of forest interior. Small, narrow woodlands may have no forest interior conditions at all. Forest interior habitat is a remnant natural environment, reminiscent of the extensive, continuous forests of the past. This increasingly rare forest habitat is now a refuge for certain forest-dependent wildlife; they simply must have it to survive and thrive in a fragmented forest landscape (Conserving the Forest Interior. Ontario Extension Notes, 2000).
The Natural Heritage Reference Manual states that woodland interior habitat is usually defined as habitat more than 100 metres from the edge of the woodland and provides for relative seclusion from outside influences along with a moister, more sheltered and productive forest habitat for certain area sensitive species. Woodlands with interior habitat have centres that are more clearly buffered against the edge effects of agricultural activities or more harmful urban activities than those without.
In the Monahan Drain catchment (in 2014), the 100 woodland patches contain 11 forest interior patches (Figure 22) that occupy less than one percent (25 ha.) of the catchment land area (which is less than the three percent of interior forest in the Jock River Subwatershed). This is below the ten percent figure referred to in the Environment Canada Guideline that is considered to be the minimum threshold for supporting edge intolerant bird species and other forest dwelling species in the landscape.
Most patches (10) have less than 10 hectares of interior forest, six of which have small areas of interior forest habitat less than one hectare in size. The remaining patch contains 15 hectares of interior forest. Between 2008 and 2014, there was an overall loss of nine hectares of interior forest in the catchment (Table 13).
Table 13 Woodland interior in the Monahan Drain catchment (2008 and 2014)
4.3 Wetland Cover
Wetlands are habitats forming the interface between aquatic and terrestrial systems. They are among the most productive and biologically diverse habitats on the planet. By the 1980s, according to the Natural Heritage Reference Manual, 68 percent of the original wetlands south of the Precambrian Shield in Ontario had been lost through encroachment, land clearance, drainage and filling.
Wetlands perform a number of important ecological and hydrological functions and provide an array of social and economic benefits that society values. Maintaining wetland cover in a watershed provides many ecological, economic, hydrological and social benefits that are listed in the Reference Manual and which may include:
- contributing to the stabilization of shorelines and to the reduction of erosion damage through the mitigation of water flow and soil binding by plant roots
- mitigating surface water flow by storing water during periods of peak flow (such as spring snowmelt and heavy rainfall events) and releasing water during periods of low flow (this mitigation of water flow also contributes to a reduction of flood damage)
- contributing to an improved water quality through the trapping of sediments, the removal and/or retention of excess nutrients, the immobilization and/or degradation of contaminants and the removal of bacteria
- providing renewable harvesting of timber, fuel wood, fish, wildlife and wild rice
- contributing to a stable, long-term water supply in areas of groundwater recharge and discharge
- providing a high diversity of habitats that support a wide variety of plants and animals
- acting as “carbon sinks” making a significant contribution to carbon storage
- providing opportunities for recreation, education, research and tourism
Historically, the overall wetland coverage within the Great Lakes basin exceeded 10 percent, but there was significant variability among watersheds and jurisdictions, as stated in the Environment Canada Guideline. In the Rideau Valley Watershed, it has been estimated that pre-settlement wetland cover averaged 35 percent using information provided by Ducks Unlimited Canada (2010) versus the 21 percent of wetland cover existing in 2014 derived from DRAPE imagery analysis.
Using the same dataset, it is estimated that pre-settlement (historic) wetland cover averaged 51 percent in the Jock River subwatershed versus the 24 percent of cover existing in 2014 (as summarized in Table 14).
Table 14 Wetland cover in the Jock River subwatershed and Monahan Drain catchment (Historic to 2014)
This decline in wetland cover is also evident in the Monahan Drain catchment (as seen in Figure 23) where wetland was reported to cover 69 percent of the area prior to settlement, as compared to less than one percent in 2014. This represents a 99 percent loss of historic wetland cover and what remains (in 2014) falls far below the 40 percent historic wetland threshold cited in the Environment Canada Guideline for maintaining key ecological and hydrological functions. To maintain critical hydrological, ecological functions along with related recreational and economic benefits provided by these wetland habitats in the catchment, the Guideline recommends a “no net loss” approach for currently existing wetlands combined with efforts to work towards restoring upwards of 40 percent of the historic wetland coverage, where feasible.
Figure 23 Catchment wetland cover
4.4 Shoreline Cover
The riparian or shoreline zone is that special area where the land meets the water. Well-vegetated shorelines are critically important in protecting water quality and creating healthy aquatic habitats, lakes and rivers. Natural shorelines intercept sediments and contaminants that could impact water quality conditions and harm fish habitat in streams. Well established buffers protect the banks against erosion, improve habitat for fish by shading and cooling the water and provide protection for birds and other wildlife that feed and rear young near water. A recommended target (from the Environment Canada Guideline) is to maintain a minimum 30 metre wide vegetated buffer along at least 75 percent of the length of both sides of rivers, creeks and streams.
Figure 24 shows the extent of the ‘Natural’ vegetated riparian zone (predominantly wetland/woodland features) and ‘Other’ anthropogenic cover (crop/pastureland, roads/railways, settlements) along a 30-metre-wide area of land, both sides of the shoreline of the Jock River and its tributaries in the Monahan Drain catchment.
Figure 24 Natural and other riparian land cover in the Monahan Drain catchment
This analysis shows that the riparian buffer in the Monahan Drain catchment in 2014 was comprised of crop and pastureland (65 percent), settlement (14 percent), transportation (13 percent), woodland (six percent), and meadow-thicket (two percent). Additional statistics for the Monahan Drain catchment are presented in Table 15. Of particular interest is the observed increase in the area of “Settlement” along the shoreline of the Monahan Drain over a six year period.
Table 15 Riparian land cover (2008 vs. 2014) in the Monahan Drain catchment
5.0 Monahan Drain Catchment: Stewardship and Water Resources Protection
The RVCA and its partners are working to protect and enhance environmental conditions in the Jock River Subwatershed. Figure 25 shows the location of all stewardship projects completed in the Monahan Drain catchment along with sites identified for potential shoreline restoration.
5.1 Rural Clean Water Projects
From 2010 to 2015, two clean water diversions, one windbreak buffer, one well decommissioning and one manure storage/wastewater runoff project were completed. Between 2004 and 2009, two septic system replacements, one well decommissioning, one well replacement and one well upgrade were completed. Prior to 2004, five crop residue projects and one livestock fencing were completed. Total value of all 16 projects is $336,954 with $34,463 of that amount funded through grant dollars from the RVCA.
Figure 25 Stewardship site locations
5.2 Private Land Forestry Projects
The location of RVCA tree planting projects is shown in Figure 25. From 2010 to 2015, 13,350 trees were planted at two sites. Between 2004 and 2009, 6000 trees were planted at three sites. No trees were planted in the catchment prior to 2004, In total, 19,350 trees were planted, resulting in the reforestation of 10 hectares. Total value of all five projects is $100,739 with $34,607 of that amount coming from various fundraising sources.
5.3 Shoreline Naturalization Projects
With the assistance of the RVCA’s Shoreline Naturalization Program, 234 trees and shrubs were planted to create a 77 metre long shoreline buffer along the Monahan Drain at a total project value of $4,004.
5.4 Valley, Stream, Wetland and Hazard Lands
The Monahan Drain catchment covers 45 square kilometres with 1 square kilometre (or two percent) of the drainage area being within the regulation limit of Ontario Regulation 174/06 (Figure 26), giving protection to wetland areas and river or stream valleys that are affected by flooding and erosion hazards.
Wetlands occupy 12.5 ha. (or less than one percent) of the catchment, all of which are designated as provincially significant and included within the RVCA regulation limit.
Of the 97.2 kilometres of stream in the catchment, regulation limit mapping has been plotted along 4.2 kilometers of streams (representing four percent of all streams in the catchment). Plotting of the regulation limit on the remaining 93 km (or 96 percent) of streams requires identification of flood and erosion hazards and valley systems.
Within those areas of the Monahan Drain catchment subject to the RVCA regulation (limit), efforts (have been made and) continue through RVCA planning and regulations input and review to manage the impact of development (and other land management practices) in areas where “natural hazards” are associated with rivers, streams, valley lands and wetlands. Additionally, in the rapidly urbanizing areas of Kanata South within the Monahan Drain catchment , significant effort is made through land use planning and development control processes and carefully planned stormwater management systems, initially guided by master drainage planning and integrated subwatershed planning, to meet the natural heritage and natural hazards policies presented in the City of Ottawa Official Plan. Also, within areas beyond the regulation limit, protection of the catchment’s watercourses is provided through the “alteration to waterways” provision of the regulation.
Figure 26 RVCA regulation limits
6. Monahan Drain Catchment: Challenges/Issues
Water Quality/Quantity
Surface chemistry water quality in the Monahan Drain catchment is “Poor” at both monitored water quality sites for the 2010-2015 period. The scores at these sites are largely influenced by frequent high nutrient concentrations, bacterial pollution, occasional metal exceedances and elevated chloride levels
Instream biological water quality conditions in the Monahan Drain are unknown
Natural hazard lands have not been identified
Effect of climate change on the hydrologic function of the Jock River subwatershed and associated natural hazards (flood risk) posed to the built/urban areas of the catchment are not fully understood
Existing hydrological and geochemical datasets and assessments (academic, RVCA, others) are only recently available and/or are not being considered in the characterization of the numerous hydrologic functions of the Jock River subwatershed. Further, there is a dearth of hydrologic information (hydroperiod, groundwater/surface water interactions, geochemistry) about the wetlands that remain in the Jock River subwatershed
Headwaters/Instream/Shorelines
‘Natural’ vegetation covers eight percent of the riparian zone of Monahan Drain and its tributaries (Figure 24) and is below the recommended 30 metre wide, naturally vegetated target along 75 percent of the length of the catchment’s watercourses
No information available about instream aquatic and riparian conditions along Monahan Drain
Land Cover
Woodlands cover seven percent of the catchment and is below the 30 percent of forest cover that is identified as the minimum threshold for sustaining forest birds and other woodland dependent species (Figure 22)
Pre-settlement wetlands have declined by 99 percent and now cover less than one percent (12 ha.) of the catchment (Figure 23)
7.0 Monahan Drain Catchment: Opportunities/Actions
Water Quality/Quantity
Target the Monahan Drain catchment to reduce loading via non-point and point source pollution control. Implement storm water and agricultural best management practices to address water quality concerns, including the protection of existing riparian cover and enhancement in areas where it is limited
Private landowners should consider taking advantage of The Rural Clean Water Programs which offer grants to landowners interested in implementing projects on their property that will help to protect and improve water quality.
- Homeowners may be interested in projects to repair, replace or upgrade their well or septic system, or addressing erosion through buffer plantings and erosion control
- Farmers can take advantage of a wide range of projects, including livestock fencing, manure storage, tile drainage control structures, cover crops, and many more
Continue to coordinate environmental monitoring and reporting activities with the City of Ottawa
Use wetland restoration as a tool to improve surface water quality and help restore the hydrologic integrity of the Jock River and its tributaries, including Monahan Drain
List, share and when possible, synthesize and use existing hydrological and geochemical datasets and assessment outcomes to facilitate the characterization of subwatershed and catchment hydrological functions. In addition, prepare guidance on best practices for the preparation of water budget assessments to better understand the hydrologic cycle requirements that occur at site specific scales; and share existing catchment and subwatershed scale water budget assessment outcomes
Monahan Drain flood risks are to be studied as part of ongoing efforts to prepare flood plain mapping for the Jock River subwatershed
Headwaters/Instream/Shorelines
Promote the Rideau Valley Shoreline Naturalization Program to landowners to increase existing eight percent of natural shoreline cover
Educate landowners about the value of and best management practices used to maintain and enhance natural shorelines and headwater drainage features
Work with the City of Ottawa to consistently implement current land use planning and development policies for water quality and shoreline protection (i.e., adherence to a minimum 30 metre development setback from water) adjacent to the Jock River and other catchment streams, including Monahan Drain
Target shoreline restoration at sites identified in this report (shown as “Other riparian land cover” in Figure 24) and explore other restoration and enhancement opportunities along the Monahan Drain and its tributaries
Land Cover
Promote the City of Ottawa Green Acres Reforestation Program to landowners to increase existing seven percent of woodland cover
Encourage the City of Ottawa to strengthen natural heritage and water resources policies in official plans and zoning by-laws where shoreline, wetland, woodland cover and watercourse setbacks are determined to be at or below critical ecological thresholds. Information for this purpose is provided in the RVCA’s subwatershed and catchment reports
Explore ways and means to more effectively enforce and implement conditions of land-use planning and development approvals to achieve net environmental gains
Re-consider the RVCA’s approach to wetland regulation where there is an identified hydrologic imperative to do so (i.e., significant loss of historic wetland cover (see Figure 23) and/or seasonal, critically low baseflows in the Jock River and/or areas of seasonal flooding)
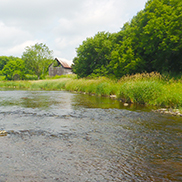


")
")


")
")


")
")


 and saturation (%) in the Jock River Ashton - Dwyer Hill reach")


 captured at Franktown Road")


")
")


 and saturation (%) on the Jock River Barrhaven reach")


")
")


")
")


 and saturation (%) on the Jock River Leamy Creek reach")


")
")


 and saturation (%) on the Jock River and Marlborough Creek in the Richmond catchment")


 and saturation (%) in the Jock River Richmond Fen reach")


")


 and saturation (%) in Kings Creek")


")
")


")
")


 and saturation (%) in Nichols Creek")


")
")


