2. Surface Water Quality Conditions
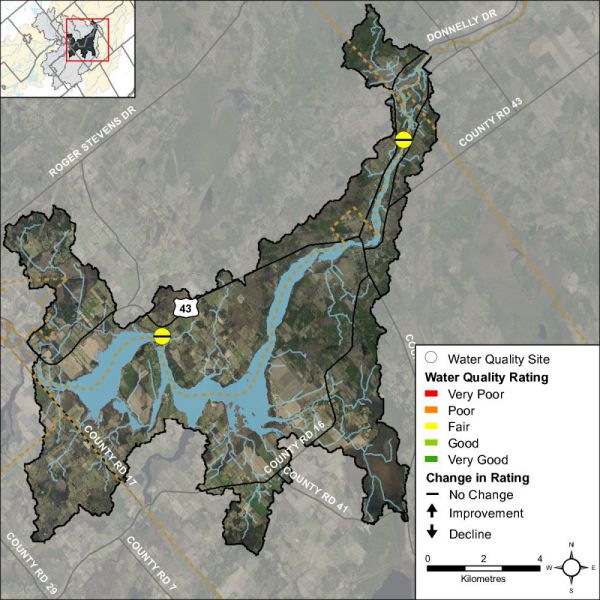
Surface water quality conditions in the Rideau-Merrickville catchment are monitored by the Ministry of the Environment and Climate Change’s Provincial Water Quality Monitoring Program. The Provincial Water Quality Monitoring Program focuses on streams; data is collected for 19 parameters including nutrients (total phosphorus and total Kjeldahl nitrogen) and metals (like aluminum and lead) and additional chemical/physical parameters (such as alkalinity, pH and total suspended solids). Figure 1 shows the location of monitoring sites along the Rideau River in the catchment.
Rideau River Water Quality
Water Quality Rating
The water quality ratings for the Rideau-Merrickville catchment are “Fair” (Table 1) as determined by the CCME Water Quality Index and are largely influenced by high nutrients and elevated metal concentrations. Each parameter is evaluated against established guidelines to determine water quality conditions. Those parameters that frequently exceed guidelines are presented below. Analysis of the data has been broken into two periods (2003 to 2008 and 2009 to 2014) for the two monitoring sites located along the Rideau River (Kilmarnock and Andrewsville) to examine if conditions have changed between these periods. Table 1 shows the overall rating for the monitored surface water quality sites within the Rideau-Merrickville catchment and Table 2 outlines the Water Quality Index (WQI) scores and their corresponding ratings.
| Sampling Site | Location | 2003-2008 | Rating |
|---|---|---|---|
| Kilmarnock | Rideau River at Kilmarnock Rd. | 70 | Fair |
| Andrewsville | Rideau River at Andrewsville Rd. | 70 | Fair |
| Sampling Site | Location | 2009-2014 | Rating |
| Kilmarnock | Rideau River at Kilmarnock Rd. | 66 | Fair |
| Andrewsville | Rideau River at Andrewsville Rd. | 64 | Fair |
| Rating | Index Score |
|---|---|
| Very Good (Excellent) | 95-100 |
| Good | 80-94 |
| Fair | 65-79 |
| Poor (Marginal) | 45-64 |
| Very Poor (Poor) | 0-44 |
Nutrients
Total phosphorus (TP) is used as a primary indicator of excessive nutrient loading and may contribute to abundant aquatic vegetation growth and depleted dissolved oxygen levels. The Provincial Water Quality Objective (PWQO) is used as the TP Guideline and states that in rivers concentrations greater than 0.030 mg/l indicate an excessive amount of TP.
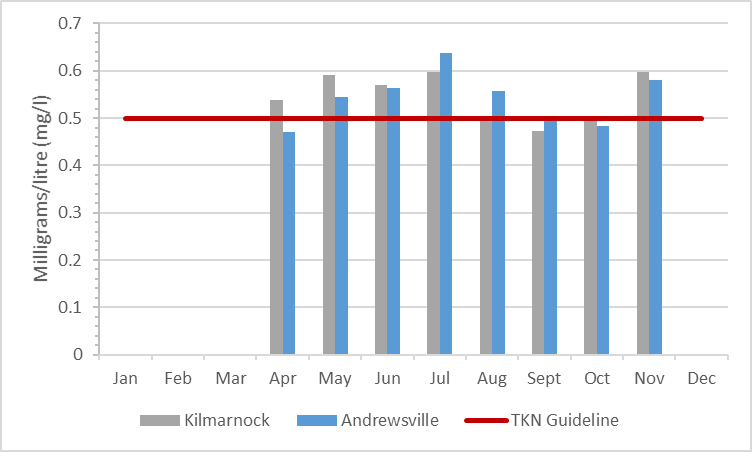
Total Kjeldahl nitrogen (TKN) is used as secondary indicator of nutrient loadings. RVCA uses a guideline of 0.500 mg/l to assess TKN[1] concentrations at the monitored site.
Tables 3 and 4 summarize average nutrient concentrations at monitored sites within the Rideau River-Merrickville catchment and show the proportion of results that meet the guidelines.
| Total Phosphorous 2003-2008 | |||
|---|---|---|---|
| Site | Average | Below Guideline | No. Samples |
| Kilmarnock | 0.027 | 91% | 34 |
| Andrewsville | 0.022 | 82% | 33 |
| Total Phosphorous 2009-2014 | |||
| Site | Average | Below Guideline | No. Samples |
| Kilmarnock | 0.019 | 88% | 43 |
| Andrewsville | 0.019 | 93% | 41 |
| Total Kjeldahl Nitrogen 2003-2008 | |||
|---|---|---|---|
| Site | Average | Below Guideline | No. Samples |
| Kilmarnock | 0.647 | 12% | 49 |
| Andrewsville | 0.575 | 12% | 33 |
| Total Kjeldahl Nitrogen 2009-2014 | |||
| Site | Average | Below Guideline | No. Samples |
| Kilmarnock | 0.546 | 30% | 43 |
| Andrewsville | 0.542 | 27% | 41 |
Kilmarnock Site
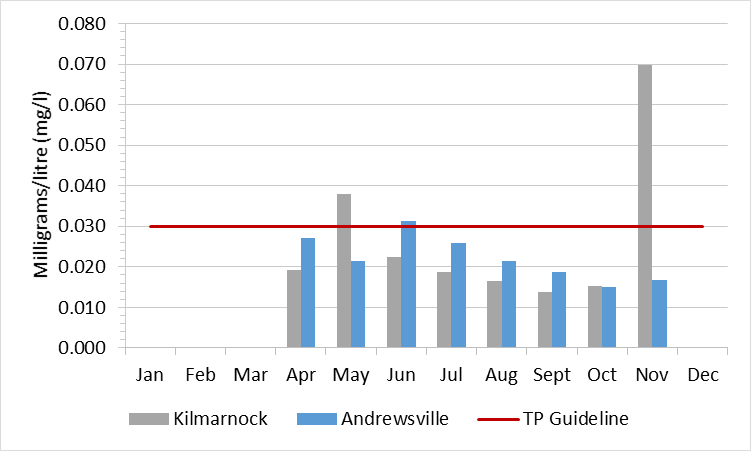
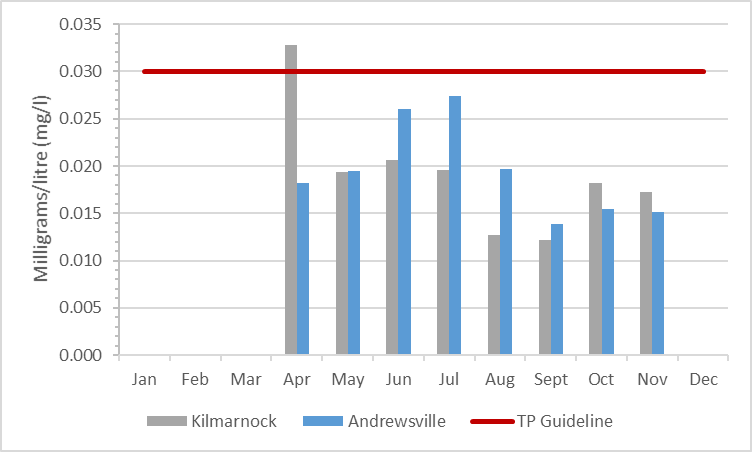
Total phosphorous results were occasionally elevated at site Kilmarnock; 91 percent of samples were below the guideline in the 2003-2008 period (Figure 2); this declined to 88 percent of samples in the 2009-2014 period (Figure 3). The average TP concentration decreased from 0.027 mg/l (2002- 2007) to 0.019 mg/l (2009-2014).
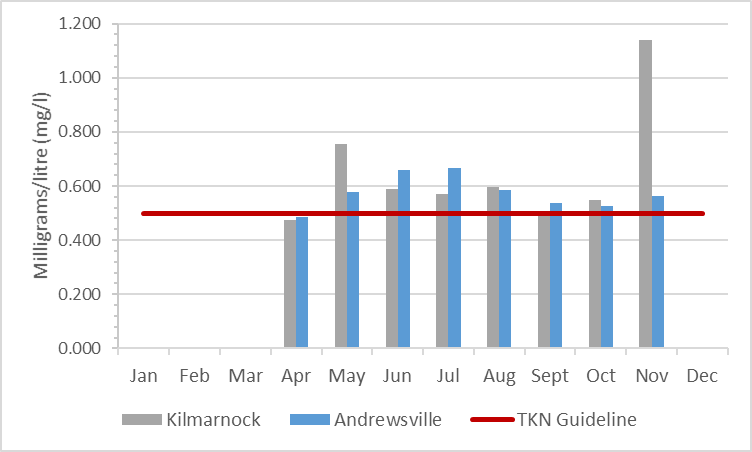
TKN results show that evaluated results were a regular occurrence (Figures 4 and 5); there were few samples (12 percent) below the guideline in the 2003-2008 period and this increased to 30 percent in the 2009-2014 period. The average concentration was generally elevated but did decrease from 0.647 mg/l to 0.546 mg/l (Table 4).
Andrewsville Site
Elevated TP results were an occasional occurrence at Andrewsville; 82 percent of samples were below the guideline in the 2003-2008 period (Figure 2); this increased to 93 percent of samples in the 2009-2014 period (Figure 3). The average TP concentration also decreased slightly from 0.022 mg/l (2003- 2008) to 0.019 mg/l (2009-2014).
The bulk of TKN results have exceeded the guideline (Figure 4 and 5), with 12 percent of samples below the guideline in the 2003-2008 period, increasing to 27 percent of samples below the guideline from 2009-2014. The average concentration was elevated for both monitoring periods and decreased from 0.575 mg/l to 0.542 mg/l (Table 4).
Summary
The data shows that nutrient enrichment is a feature of the Rideau River. Elevated nutrients may result in nutrient loading downstream. High nutrient concentrations can help stimulate the growth of algae blooms and other aquatic vegetation in a waterbody and deplete oxygen levels as the vegetation dies off. It is important to reduce human impacts wherever possible. Enhancing shoreline buffers and diverting runoff away from the river by absorbing rainfall onsite will reduce nutrient loading into the river.
Metals
Metals were only monitored for the 2003-2008 period at the Kilmarnock site and are not available for the 2009-2014 monitoring period. Metals were monitored for both monitoring periods at the Andrewsville site. Of the metals that were routinely monitored at the Kilmarnock and Andrewsville sites on the Rideau River, Aluminum (Al),) Cadmium (Cd) and Lead (Pb) were the only metals that frequently reported concentrations above the PWQO. In elevated concentrations metals can have toxic effects on sensitive aquatic species.
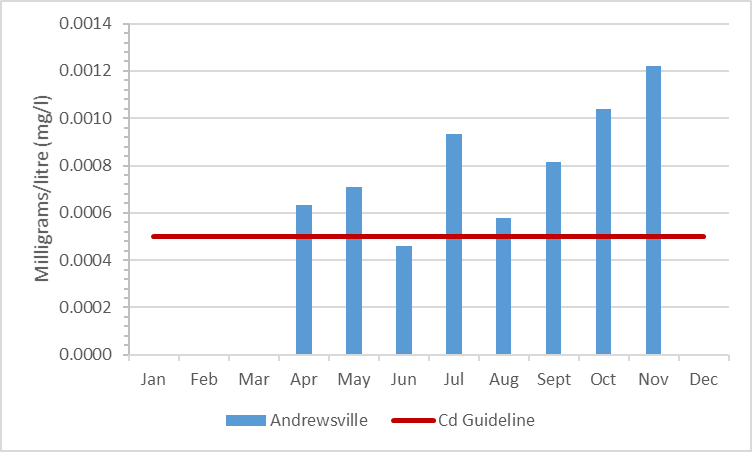
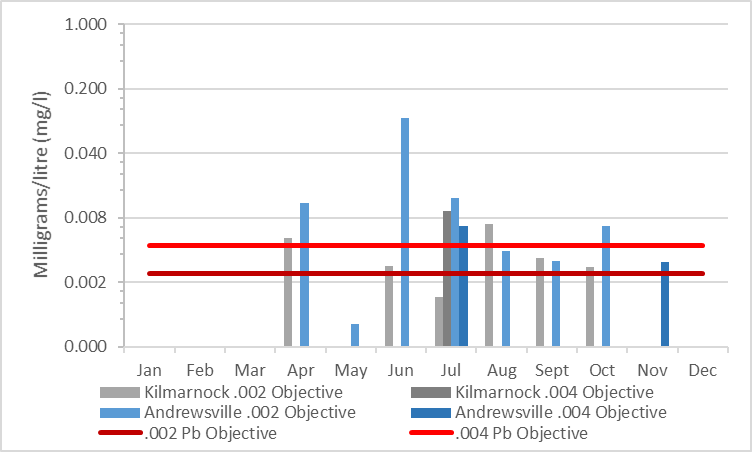
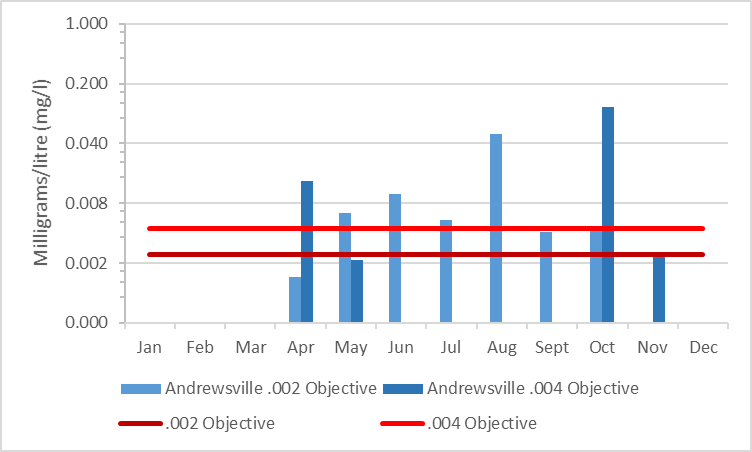
Tables 5, 6, 7 and 8 summarize metal concentrations at Kilmarnock and Andrewsville sites as well as show the proportion of samples that meet guidelines. Figures 6 to 11 show metal concentrations with respect to the guidelines for the two periods of interest, 2003–2008 and 2009–2014.
For Al, the PWQO is 0.075 mg/l and 0.0005 mg/l for Cd. The PWQO for Pb depends on the hardness of the water. The Rideau River at both Kilmarnock and Andrewsville site was either 60 to 120 mg/l which would make the Pb objective 0.002 or 120-180 mg/l which would make the Pb guideline 0.004.
Some Cd and Pb results have also been removed from the analysis as they have been reported as a negative concentration. These results are estimates of concentrations and when results are close to zero about half of the results will be above the average and half will be below. When they are mapped onto a concentration axis, negative results can occur.
| Aluminum 2003-2008 | |||
|---|---|---|---|
| Site | Average (mg/l) | Below Guideline | No. Samples |
| Kilmarnock | 0.058 | 86% | 21 |
| Andrewsville | 0.034 | 90% | 30 |
| Aluminum 2009-2014 | |||
| Site | Average (mg/l) | Below Guideline | No. Samples |
| Andrewsville | 0.031 | 95% | 41 |
| Cadmium 2003-2008 | |||
|---|---|---|---|
| Site | Average (mg/l) | Below Guideline | No. Samples |
| Andrewsville | 0.0005 | 59% | 17 |
| Cadmium 2003-2008 | |||
| Site | Average (mg/l) | Below Guideline | No. Samples |
| Andrewsville | 0.0008 | 21% | 28 |
| Lead 2003-2008 0.002 Objective | |||
|---|---|---|---|
| Site | Average (mg/l) | Below Guideline | No. Samples |
| Kilmarnock | 0.003 | 45% | 11 |
| Andrewsville | 0.018 | 47% | 17 |
| Lead 2009-2014 0.002 Objective | |||
| Site | Average (mg/l) | Below Guideline | No. Samples |
| Andrewsville | 0.014 | 20% | 15 |
| Lead 2003-2008 0.004 Objective | |||
|---|---|---|---|
| Site | Average (mg/l) | Below Guideline | No. Samples |
| Kilmarnock | 0.010 | 0% | 1 |
| Andrewsville | 0.005 | 50% | 2 |
| Lead 2009-2014 0.004 Objective | |||
| Site | Average (mg/l) | Below Guideline | No. Samples |
| Andrewsville | 0.034 | 57% | 7 |
Kilmarnock Site
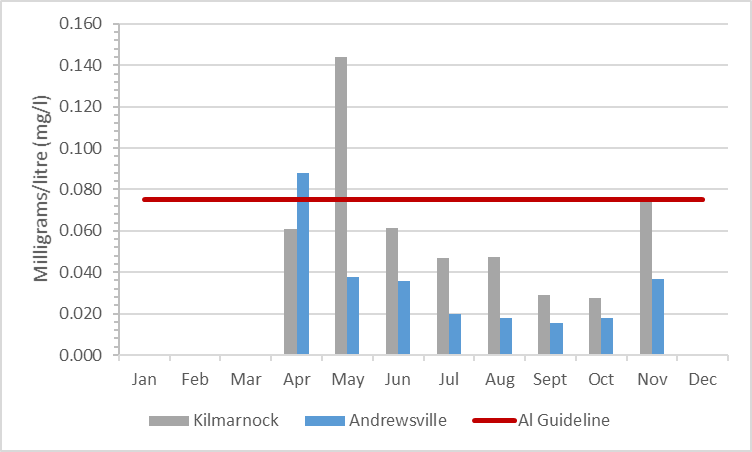
Of the metals routinely monitored in the Rideau River at the Kilmarnock site during the 2003-2008 period, Al and Pb reported concentrations above the PWQO.
Table 6 summarizes the Al concentrations at the monitored site and show the proportion of samples (86%) are below the guideline, with an average concentration of 0.058 mg/l.
Lead concentrations were broken up in the two guidelines depending on the water hardness of the sample (0.002, Table 7 and 0.004, Table 8). There were 45 percent of samples below the 0.002 guideline. The average concentration was 0.003 mg/l which slightly exceeded the 0.002 objective. Only one sample at Kilmarnock had a 0.004 objective. This one sample was above the guideline, with a reading of 0.010 mg/l.
Andrewsville Site
The Andrewsville site on the Rideau River had Al, Cd and Pb results that exceeded the guidelines for both monitoring periods.
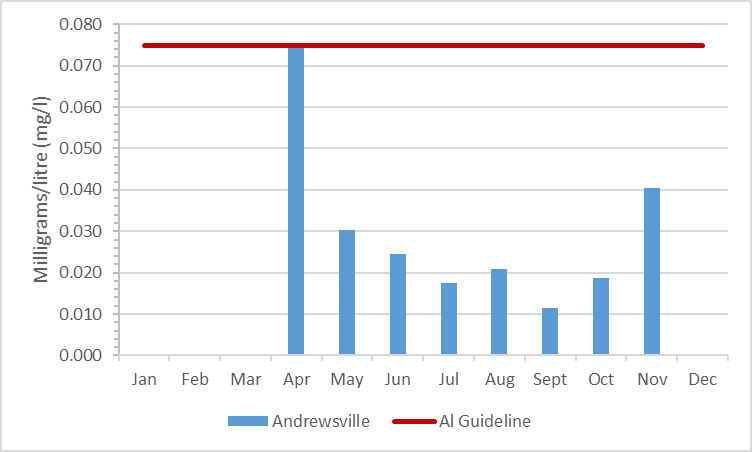
From 2003-2008 and 2009-2014 a majority of Al concentrations were below the guidelines (Figures 6 and 7). The percentage of samples below the guideline increased from 90 to 95 percent between the two reporting periods. Both average concentrationss were below the guideline, with 0.034 mg/l from 2003-2008, decreasing to 0.031 mg/l from 2009-2014 (Table 5).
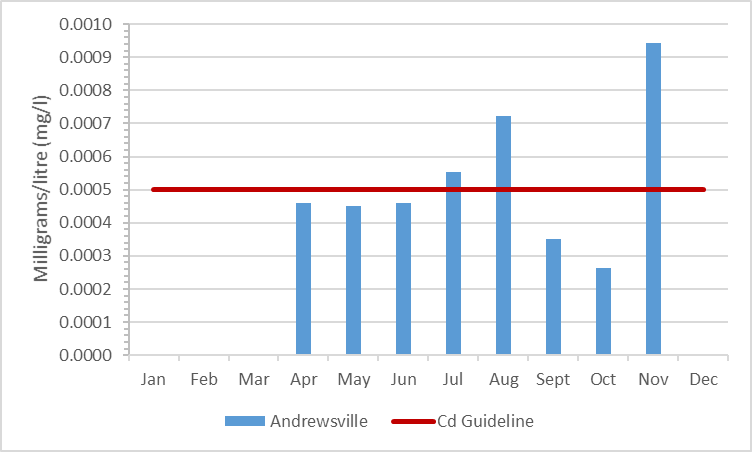
Cadmium results exceeded the guideline for both reporting periods (Figures 8 and 9). Ther percentage of results below the guidleine was 59 percent from 2003-2008, with an average concentration of 0.0005 mg/l. Results below the guidelines increased from 2009-2014, to 21 percent, with an average conetration of 0.0008 mg/l which also slightly increased from the previous reporting period (Table 6).
Results for Pb concentrations were separated into two guidelines depending on the hardness of the water (0.002, Table 7 and 0.004 Table 8). For the 0.002 guideline there were 47 percent of results that were below the guideline with an average concentration of 0.018 mg/l (Figure 10). Results improved slightly during the second reporting period with an average concentration of 0.014 mg/l and 21 percent of samples below the guideline (Figure 11). The 0.004 guidline had fewer results; the average concentration of results was 0.005 mg/l with 50 percent of samples below the guideline (Figure 10). The average concentration increased to 0.034 mg/l with 57 percent of samples below the guideline in the second reporting period (Figure 11).
Summary
For the 2003-2008 and 2009-2014 monitoring periods metal concentrations were occasionally elevated. The Kilmarnock site was not sampled for metals in the 2009-2014 reporting period and no long term trend can be observed. The Andrewsville site had a decline in Al, but not in Cd or Pb. Efforts should be made to identify pollution sources and reduce any inputs (such as runoff, metal alloys, fungicides and pesticides) to improve the overall water quality and lessen downstream impacts of the river.
[1] No Ontario guideline for TKN is presently available; however, waters not influenced by excessive organic inputs typically range from 0.100 to 0.500 mg/l, Environment Canada (1979) Water Quality Sourcebook, A Guide to Water Quality Parameters, Inland Waters Directorate, Water Quality Branch, Ottawa, Canada
