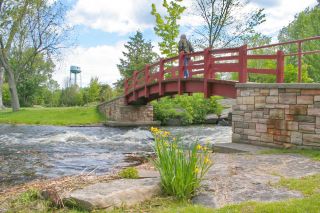
Tay River - Town of Perth
6.0 Perth Catchment: Accomplishments
Achievements and activities noted by the Friends of the Tay Watershed Association (FoTW) are indicated by an asterisk.*
In-stream/Fish Habitat
4.6 kilometres of the Tay River in the catchment have been surveyed and seven headwaters sites are sampled once every six years by the RVCA using the Ontario Stream Assessment Protocol.
The report "Fish Habitat of the Tay River Watershed: Existing Conditions and Opportunities for Enhancement" was prepared in 2002 by MNR, RVCA, Parks Canada and DFO. A number of specific fish habitat enhancement projects are identified in the report to improve the fishery along the Tay River (see pp. 86-92). One such project identified along the reach of the Tay River in the Town of Perth includes the refurbishment of the two Haggart Island dams. Both of these structures have now been replaced with a rocky ramp on the Little Tay River (in 2015) and another one on the Tay River (in 2017)(see section 5.4 of this report).
Shoreline Planting
The Friends of the Tay Watershed and RVCA developed the Wendy Laut Ribbon of Life demonstration area in Last Duel Park alongside the Tay River. Recently, the Perth Horticultural Society has updated the area.*
4554 native trees and shrubs have been planted along 764 metres of shoreline at various locations along the Tay River in the Town of Perth with services provided by the RVCA Shoreline Naturalization Program.
Water Quality
Drinking Water
Following a successful field trial and Environmental Assessment, the Town of Perth advanced the implementation of the geotube back technology (Bishop Water Technologies-Eganville, ON) to remove solids from the discharged water. The processes involved the re-routing of process water into large porous geotextile bags that allow water to weep through the surface of the bag while retaining the solids inside the vessel. The three (3) large geotube bags are alternated daily to allow the solids enough time to dewater and consolidate throughout the seasons. One (1) of the bags is placed in a large greenhouse to allow filtering process to continue during freezing temperatures.
The Town of Perth meets the guidelines of 15mg/l of Total Suspended Solids in the discharged water that returns to the Tay River. Since 2015 approximately 550 tonnes of solids are captured annually within the geotube system. This material is harvested from each of the geotube bags and transported to the Perth Landfill Site and used for daily cover of waste. This process also prevented process water from being conveyed and treated at the Perth Wastewater Facility, which would inherently require capital costs in piping and pump stations as well as negatively affecting development capacity for the municipality.
Sanitary
The Town of Perth wastewater treatment facility is located on the south side of the Tay River, adjacent to the Tay Marsh. The outflow from the Perth sewage lagoons has impacted water downstream for decades. Outflow quality has, on the average, been within provincial limits, but inevitably has had an impact on the Tay Marsh and is one of (many) sources encouraging excessive vegetation growth in the wetland, which damages its fish and wildlife habitat. In response to concerns raised about the impact of the Town of Perth sewage lagoons on the Tay River and Tay Marsh, the Town has taken action over the years to reduce its effect on surface water quality in the system, which, from cursory observation has been beneficial, and more recently enhanced with an innovative phosphorus reduction system.*
Further to this observation, it is stated in the Infrastructure Master Plan for the Western Annex in the Town of Perth (Jp2g Consultants, Jan.2019) that, since 2007, the Town has undergone an intensive wet weather flow reduction program, including sealing and repair work of sewers, elimination of combined sewers and sealing and elevating manholes. These efforts have successfully reduced average inflows to the lagoon and the wet weather program is continuing with further improvements expected.
Perth completed the installation of the SAGR (Submerged Attached Growth Reactor) system in the fall of 2018. This $11 million project focused on providing tertiary treatment to the Town's existing wastewater lagoon system and has also increased the development capacity of the municipality to an equivalent of 8200 residents. Results throughout 2019 have shown dramatic decreases in E-coli, ammonia, total suspended solids, and ammonia levels using the new treatment system. The SAGR uses aeration and naturally-occurring biological processes to breakdown and polish sewage waste without chemicals or the need for mechanical processes.
Stormwater
In collaboration with the Town of Perth, the Friends of the Tay Watershed sampled stormwater during the first flush of a rain event on 29 September 2015. Thirty samples were taken during this single event from six access points along the lower five blocks of the Town of Perth’s Wilson Street Stormwater Drain, from Leslie Street to Herriott Street, adjacent to the outfall into the Little Tay River. Samples were analysed for E coli, Fecal Strep, Total Suspended Solids, Phosphates, Total Kjeldahl Nitrogen, and Sodium. Additionally, temperature at capture, pH, Colour, Alkalinity and Turbidity were measured and recorded by Town of Perth Water Treatment Plant staff. Further information has been gathered about the extent of contaminant levels in local storm water in the Wilson Street Stormwater Drain. The sources of contamination appear to be from the washing of large, more heavily trafficked paved surfaces, such as parking lots and major roads. No particular trends were displayed along the length of the Drain studied. Besides indicating the sources and extent of E. coli content in the system, this assessment raises additional concerns needing further study, including the consequences of river contamination by the nutrients and suspended solids discharged with urban storm water.*
Swimming
The Friends of the Tay Watershed sampled three sites along the Tay River in 2013, all popular swimming spots in Perth. All showed high levels of E. coli after rain but not before; likely due to untreated stormwater being channelled quickly into the Tay River. Before rain event E. coli levels were higher even though temperatures were a little lower, possibly due to more and heavier rains resulting in near-flooding conditions along the Tay River and strong water currents. In mid-September 2014, three more sites were sampled by FoTW along the Tay River in Perth. Ten samples were taken in close proximity to two storm sewer outflows. Five more samples were taken farther downstream in Perth, but not near any stormwater outflows. All were taken within an hour of the start of light rain and the arithmetically averaged geometric mean from the test samples was 993 units of E. coli per 100 ml of water. All of the previously elevated E. coli counts had returned to “normal” levels close to or within the safe-to-swim limit of 100 units of E. coli per 100 ml. of water, 24 hours after the rain had stopped, with an average geometric mean of 83 E. coli per 100 ml. of water. All samples taken near the outflows were much higher than those taken some distance from any outflow. These findings complete the FoTW testing picture that shows consistently low and swimmable levels of E. coli before rain events and also within 24 hours of a rain event, but that levels of E. coli are, however, consistently higher even after a light rain and dangerously high near storm sewer outflows.*
The 2011 Perth Catchment Report and water testing records for the Town of Perth have been a major help in monitoring and determining activity in this sector. As in any urban area, Perth has an impact on the water quality in its Tay River. The Town has generally taken this seriously and attempted to mitigate it, with innovative and environmentally sensitive approaches. Both RVCA and the Friends of the Tay Watershed Association have presumably been instrumental in pointing out need and have cooperated with the Town of Perth in determining and following up actions.*
Three stream monitoring sites on the Tay River in the Town of Perth are sampled yearly by the RVCA for 22 parameters at each location, six times a year, to assess surface chemistry water quality conditions.
Eighteen Rural Clean Water Program projects were completed by the RVCA Rural Clean Water Program.
Watershed Planning and Management
The Tay Watershed Management Plan (2002) brought together a diverse group of watershed stakeholders to exchange information and opinions on the challenges facing the watershed. This forum focused the community on the need for managing the Tay Watershed, requiring positive cooperation amongst a range of stakeholders and helped develop a foundation of data and information on the watershed and resources against which later developments and trends are being measured and decisions are being made.
The Plan also led to the formation of the Friends of the Tay Watershed Association, who have been instrumental in implementing 20 of 24 management plan recommendations. In the opinion of the Association, one of the most significant measures of success for the water protection activities carried out in the Tay watershed is that there has never been a serious environmental pollution incident that threatened the area’s drinking water or its recreational waterbodies. To this day, the Friends of the Tay Watershed remain committed to preserving and enhancing the health of the Tay River watershed through their work, including:
- Building an understanding of the Tay River and promoting the Tay Canal and need for its care. RVCA catchment reports have played a major role in this by documenting it and its needs.
- Increasing awareness of the Tay Wildlife Reserve, helping promote the Butterfly Garden at the Reserve (in the 2009 Anniversary celebration), researching the Canal’s history and documenting it in an interpretive panel at the Reserve, and working with RVCA in placing a canoe/boat dock at the Reserve. The launch of the Tay Canal tour boat, by private individuals, was done to provide a means of bringing residents to the Tay River and Canal, and educating them about it.
- Bursaries to high school students proceeding to an environment degree as well as continuing post-secondary students.
- Development of interpretive panels for Source Water Protection (eg. Glen Tay catchment area) and the Tay River viewpoint (along the Tay Trail).
- Environmental Awards.
- Outreach to children and schools as well as the public through initiatives such as the Perth Maple Fest, the Stewart Park Festival and the Association's annual Tay Watershed Discovery Day that increases awareness of the importance of the Tay River and area lakes to the health of the Tay Watershed.
- Submissions to government on regulatory reviews (eg. Climate change action; Conservation Authority Act) and the Rideau Canal Management Plan.
- Support to other environmental, watershed organisations (e.g., Lake Links, Lake Networking Group).
Tay River Subwatershed Report 2017
PERTH CATCHMENT
 Figure 1 Land cover in the Perth catchment
The RVCA produces individual reports for 14 catchments in the Tay River subwatershed. Using data collected and analyzed by the RVCA through its watershed monitoring and land cover classification programs, surface water quality and in-stream conditions are reported for the Tay River, Tay Watershed lakes and Tay tributaries along with a summary of environmental conditions for the surrounding countryside every six years, which includes analysis of data collected through the programs along with local information provided by stakeholders up to 2017.
This information is used to better understand the effects of human activity on our water resources, allows us to better track environmental change over time and helps focus watershed management actions where they are needed the most to help sustain the ecosystem services (cultural, aesthetic and recreational values; provisioning of food, fuel and clean water; regulation of erosion/natural hazard protection and water purification; supporting nutrient/water cycling and habitat provision) provided by the catchment’s lands and forests and waters (Millennium Ecosystem Assessment 2005).
The following sections of this report are a compilation of that work for the Perth catchment.
| Catchment Facts | Section 1.0 |
| Water Quality Conditions | Section 2.0 |
| Riparian Conditions | Section 3.0 |
| Land Cover | Section 4.0 |
| Stewardship and Water Resources Protection | Section 5.0 |
| Accomplishments | Section 6.0 |
| Challenges/Issues | Section 7.0 |
| Actions/Opportunities | Section 8.0 |
For other Tay River catchments and the Tay River Subwatershed Report, please see Rideau Valley Conservation Authority Subwatershed Reports.
2.0 Perth Catchment: Water Quality Conditions
Surface water quality conditions in the Perth catchment are monitored by the Rideau Valley Conservation Authority (RVCA) Baseline Water Quality Monitoring Program. The baseline water quality program focuses on streams; data is collected for 22 parameters including nutrients (total phosphorus and total Kjeldahl nitrogen), E. coli, metals (like aluminum and copper) and additional chemical/physical parameters (such as alkalinity, chlorides, pH and total suspended solids). Figure 2 shows the locations of monitoring sites in the catchment.

Figure 2 Water quality monitoring sites on the Tay River in the Perth catchment
2.1 Tay River: Water Quality Rating
Three locations are monitored for water quality within the urban portion of the Town of Perth (Figure 2). The RVCA's water quality rating ranges from "Fair" to "Good" (Table 1) along the Tay River in the catchment, as determined by the Canadian Council of Ministers of the Environment (CCME) Water Quality Index.
A "Fair" rating indicates that water quality is usually protected but is occasionally threatened or impaired; conditions sometimes depart from natural or desirable levels. "Good" indicates that only a minor degree of threat or impairment is observed and conditions rarely depart from natural or desirable levels. Each parameter is evaluated against established guidelines to determine water quality conditions. Those parameters that frequently exceed guidelines are presented below.
Data has been analyzed over the 2006-2017 period for general trends and conditions. Table 1 shows the overall rating for the monitored surface water quality sites within the catchment and Table 2 outlines the Water Quality Index (WQI) scores and their corresponding ratings. The scores at these sites are largely influenced by few high nutrient concentrations and bacterial counts. For more information on the CCME WQI, please see the Tay River Subwatershed Report.
Table 1 Water Quality Index ratings for the Tay River in the Town of Perth
| Site | Location | 2006-2008 | 2009-2011 | 2012-2014 | 2015-2017 |
|---|---|---|---|---|---|
| TAY-04 | Tay River at Rogers Rd. | Good (84) | Fair (69) | Good (84) | Good (90) |
| TAY-08 | Tay River at Gore St. | Good (91) | Good (80) | Good (84) | Good (90) |
| TAY-19 | Tay River at Craig St. | Good (81) | Fair (77) | Good (87) | Good (87) |
Table 2 Water Quality Index ratings and corresponding index scores (RVCA terminology, original WQI category names in brackets)
| Rating | Index Score |
|---|---|
| Very Good (Excellent) | 95-100 |
| Good | 80-94 |
| Fair | 65-79 |
| Poor (Marginal) | 45-64 |
| Very Poor (Poor) | 0-44 |
2.1.1 Tay River: Nutrients
Total phosphorus (TP) is used as a primary indicator of excessive nutrient loading and may contribute to abundant aquatic vegetation growth and depleted dissolved oxygen levels. The Provincial Water Quality Objective (PWQO) is used as the TP Guideline and states that in streams concentrations greater than 0.030 mg/l indicate an excessive amount of TP.
Total Kjeldahl nitrogen (TKN) is used as secondary indicators of nutrient loading. RVCA uses a guideline of 0.500 mg/l to assess TKN[1] .
Tables 3 and 4 summarize average nutrient concentrations at monitored sites within the Perth catchment and show the proportion of results that meet the guidelines.
Table 3 Summary of total phosphorus results for the Perth Catchment (2006-2017).
| Total Phosphorus 2006-2017 | |||
|---|---|---|---|
| Site | Average (mg/l) | Below Guideline | No. Samples |
| TAY-04 | 0.021 | 88% | 72 |
| TAY-08 | 0.018 | 97% | 71 |
| TAY-19 | 0.020 | 92% | 72 |
Table 4 Summary of total Kjeldahl nitrogen results for the Perth Catchment catchment (2006-2017).
| Total Kjeldahl Nitrogen 2006-2017 | |||
|---|---|---|---|
| Site | Average (mg/l) | Below Guideline | No. Samples |
| TAY-04 | 0.499 | 65% | 72 |
| TAY-08 | 0.462 | 69% | 71 |
| TAY-19 | 0.476 | 65% | 72 |
Monitoring Site TAY-04
Site TAY-04 is the most upstream site within the Town of Perth. The majority (88 percent) of samples at this site were below the TP guideline from 2006-2017 (Figures 3 and 4). The average TP concentration in the at this site was 0.021 mg/l (Table 3), the monthly average concentrations appear higher in the spring and early summer and decline into the fall (Figure 3). In August the average concentrations exceeded the guideline (Figure 3), however this seems to be due to the influence of a single elevated sample in August 2011 (Figure 4) and does not reflect typical concentrations. Overall a decrease was observed in TP concentrations over the 2006-2017 period2.
TKN concentrations show that the bulk of results (65 percent) were also below the guideline (Figure 6, Table 4). The average concentration over the 2006-2017 period was 0.499 mg/l (Table 4); monthly averages increased from April to August, with lower concentrations observed in the fall months (Figure 5). There was no significant trend found in TKN results at this site.
Monitoring Site TAY-08
Site TAY-08 is downstream of TAY-04 and within the urban portion of Perth. TP results were low, the average concentrations was 0.018 and 97 percent of samples were below the guideline (Table 3, Figure 4). Monthly TP concentrations followed a similar pattern to upstream site TAY-04, with the highest concentrations observed from May-July, average TP concentrations did not exceed the guideline in any of the monitored months (Figure 3). A declining trend in TP concentrations was also observed in the data from this site.
The majority of TKN results were below the guideline (Figure 5 and 6), 69 percent of samples were below 0.500 mg/l (TKN Guideline) with an average concentration of 0.462 mg/l (Table 4). Average monthly concentrations were comparable and also followed a similar pattern to TAY-04 (Figure 5). No significant trend was observed in the 2006-2017 TKN dataset.
Monitoring Site TAY-19
Site TAY-19 is the most downstream site within the Town of Perth, TP concentrations are comparable to both upstream sites (TAY-04 and TAY-08) previously discussed (Figure 3). Ninety-two percent of samples at this site were below the TP guideline from 2006-2017 (Figures 3 and 4), and the average TP concentration in the at this site was 0.020 mg/l (Table 3). The monthly average concentrations were also the highest from May to July and no average monthly concentration exceeded the guideline (Figure 3). A decrease was observed in TP concentrations over the 2006-2017 period.
TKN concentrations show that the bulk of results (65 percent) were also below the guideline (Figure 6, Table 4). The average concentration over the 2006-2017 period was 0.476 mg/l (Table 4). Average monthly concentrations (Figure 5) show a similar pattern to upstream sites (TAY-04 and TAY-08) with generally comparable concentrations. No trend in TKN concentrations was observed at this site.

Figure 3 Average monthly total phosphorous concentrations in the Town of Perth catchment, 2006-2017

Figure 4 Distribution of total phosphorous concentrations in the Town of Perth catchment, 2006-2017

Figure 5 Average monthly total Kjeldahl nitrogen concentrations in the Town of Perth catchment, 2006-2017
 Figure 6 Distribution of total Kjeldahl nitrogen concentrations in the Town of Perth catchment, 2006-2017
Summary of Tay River Nutrients
The data collected in this catchment provides evidence that nutrient enrichment is not a significant concern in this reach of the Tay River. Overall, the consistency in TP and TKN concentrations from TAY-04 to TAY-19 support that there is little nutrient enrichment as the Tay River flows through the Town of Perth. A declining trend in TP concentrations was also noted at all sites. This provides support that cumulative changes throughout the catchment has reduced nutrient concentrations. This should be taken as a positive sign as high nutrient concentrations can help stimulate the growth of algae blooms and other aquatic vegetation in a waterbody and deplete oxygen levels as the vegetation dies off. It is important to continue using best management practices that help prevent nutrient pollution in the Tay River; measures such as maintaining/upgrading municipal infrastructure (sanitary/stormwater sewers and water works), enhancing shoreline buffers, minimizing/discontinuing the use of fertilizers and restricting livestock access in upstream agricultural areas of the catchment.
2.1.2 Tay River E. coli
Escherichia coli (E. coli) is used as an indicator of bacterial pollution from human or animal waste; in elevated concentrations it can pose a risk to human health. The PWQO of 100 colony forming units/100 milliliters (CFU/100 ml) is used. E. coli counts greater than this guideline indicate that bacterial contamination may be a problem within a waterbody.
Table 5 summarizes the geometric mean[3] for the monitored sites within the Town of Perth catchment and shows the proportion of samples that meet the E. coli guideline of 100 CFU/100 ml. The results of the geometric mean with respect to the guideline, are shown in Figures 7 and 8 respectively.
Table 5 Summary of E. coli results for the Tay River-Town of Perth Catchment, 2006-2017.
| E. coli 2006-2017 | |||
|---|---|---|---|
| Site | Geometric Mean (CFU/100ml) | Below Guideline | No. Samples |
| TAY-04 | 80 | 50% | 71 |
| TAY-08 | 72 | 51% | 72 |
| TAY-11 | 86 | 46% | 71 |
Monitoring Site TAY-04
E. coli counts at site TAY-04 indicate that counts regularly exceed the guideline of 100 CFU/100ml. Fifty percent of samples were below the guideline (Figures 7-8) and the count at the geometric mean was only 80 CFU/100ml (Table 5). Monthly E. coli counts showed that the geometric mean was highest during the warmer months and counts exceeded the guideline in June, August and September. Warm water temperatures are more favourable for bacterial growth. (Figure 7). No trend was noted in E. coli counts over the 2006-2017 period.
Monitoring Site TAY-08
Elevated E. coli counts at site downstream site TAY-08 were also common. Fifty-one percent of samples were below the guideline (Figure 8) from 2006-2017 and the count at the geometric mean was 72 CFU/100ml (Table 5). The highest counts were recorded in June and August (Figure 7). As with site TAY-09 there was no significant trend in E. coli data over the 2006-2017 period.
Monitoring Site TAY-19
E. coli counts at site TAY-19 was comparable to those upstream (TAY-04 and TAY-08). Forty-six percent of samples were below the guideline, with count of 86 CFU/100ml at the geometric mean (Table 5, Figure 8). Monthly E. coli counts were above the guideline from June-September (Figure 7). As with upstream sites, no trend was noted in E. coli counts over the 2006-2017 period.
 Figure 7 Geometric mean of E. coli results in the Town of Perth catchment, 2006-2017
Figure 8 Distribution of E. coli counts in the Town of Perth catchment, 2006-2017.
Summary of Tay River Bacterial Contamination
Given the frequency of samples that exceed the guidelines and counts approaching the guideline at all three sites, there is evidence that at times bacterial pollution is a concern within this reach of the Tay River. The data is comparable between all three sites thus does not provide sufficient information to; pinpoint possible sources of pollution; Minimizing runoff from infrastructure and roadways should be a priority in this catchment, such as ongoing efforts to improve storm water management within developed areas. Best management practices such as maintaining/enhancing municipal infrastructure, enhancing shoreline buffers, limiting livestock access and minimizing runoff in both agricultural and developed areas can help to protect this reach of the Tay River into the future.
1 No Ontario guideline for TKN is presently available; however, waters not influenced by excessive organic inputs typically range from 0.100 to 0.500 mg/l, Environment Canada (1979) Water Quality Sourcebook, A Guide to Water Quality Parameters, Inland Waters Directorate, Water Quality Branch, Ottawa, Canada.
2 Trends in the data were assessed using the Mann-Kendall trend test and Sens slope statistic.
3 Type of mean or average, which indicates the central tendency or typical value of a set of numbers by using the product of their values (as opposed to the arithmetic mean which uses their sum). It is often used to summarize a variable that varies over several orders of magnitude, such as E. coli counts.
![]()
The RVCA is part of the provincial Watershed Checkup Program.