Middle Rideau Subwatershed Report 2015
RIDEAU - MERRICKVILLE CATCHMENT
The RVCA produces individual reports for ten catchments in the Middle Rideau subwatershed. Using data collected and analysed by the RVCA through its watershed monitoring and land cover classification programs, surface water quality conditions are reported for the Rideau River along with a summary of environmental conditions for the surrounding countryside every six years.
This information is used to better understand the effects of human activity on our water resources, allows us to better track environmental change over time and helps focus watershed management actions where they are needed the most to help sustain the ecosystem services (cultural, aesthetic and recreational values; provisioning of food, fuel and clean water; regulation of erosion/natural hazard protection and water purification; supporting nutrient/water cycling and habitat provision) provided by the catchment’s lands and forests and waters (Millennium Ecosystem Assessment 2005).
The following pages of this report are a compilation of that work and contain information on surface water quality, riparian conditions, land cover, stewardship activity and hazard land and water resources protection.
1. Catchment Facts
General Geography
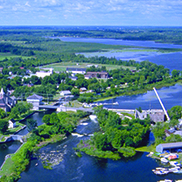
- The Rideau River flows through the heart of the Middle Rideau and is a focal point for residents and visitors to the area. It extends from the outlet of Lower Rideau Lake at Poonamalie (where there is one dam and one lock) to Burritts Rapids (where there is also a dam and lock), at which point it enters the Lower Rideau on its way to Rideau Falls. The Rideau River is a designated Canadian Heritage River and an integral part of the Rideau Canal National Historic Site of Canada that is a UNESCO World Heritage Site and a major tourist attraction. Smiths Falls, Merrickville and Burritts Rapids are the main settlements in the subwatershed
- The Village of Merrickville-Wolford is called the Jewel of the Rideau. It occupies the area of the catchment to the south of the Rideau River and is characterized by a diverse landscape. The largest centre of the community is Merrickville which is known for its boutiques and local craft people and artists. It is considered to be one of the best preserved 19th century villages in Ontario with more than 100 historic buildings designated. There are active farmlands, large wetlands, extensive woodlands, and cleared areas where full time farming has been abandoned because of marginal soil capability. The Rideau Canal National Historic Site of Canada has had a significant impact on the historic development of the Village, and continues to be an important influence on its role as an arts community which draws visitors from a large surrounding area as well as tourists visiting the National Capital Region. Within the Village, there are four lock stations, Edmunds, Kilmarnock, Merrickville, and Upper and Lower Nicholsons which provide places for public access to the Canal, passive recreation and presentation of the Canal story. The Easton-Kilmarnock marshes are among the most significant wetlands along the Canal, and the section of Canal from Merrickville to Burritts Rapids is a particularly scenic and historic area
- Parks Canada staff manage water levels for recreational purposes along the Rideau Canal/Waterway that flows by the catchment, ensuring 1.5 metres of draft during the navigation season. In this managed system, water levels on the Rideau Canal are manipulated by operation of numerous dams. In the Middle Rideau subwatershed, Parks Canada staff operate 9 dam and lock complexes with 13 locks for a fall of 36.2 metres over 35.6 kilometres. Water levels are maintained as close as possible to set objectives through the May to October navigation season. The levels are lowered through the rest of October and into November and held at the winter levels until the spring freshet in late March or early April naturally increases inflows to the system. To reduce the impact of the higher flows in the spring, the amount of snow water equivalent, forecast rain, ice cover, flows and levels are assessed and the dams in the Middle Rideau reach are operated accordingly to quickly pass as much water as possible. In late April and early May, the dams are gradually closed and water levels are brought up to be ready, once again, for the navigation season
Physical Geography
- All of the Rideau-Merrickville catchment and the rest of the Middle Rideau subwatershed primarily resides within the Smith Falls Limestone Plain. This catchment is primarily underlain by Oxford Formation dolostone. The bedrock in the upper part of the catchment is mainly overlain by an array of glacial till, clay, and river deposits whereas most of the remainder of the catchment is overlain by a thin veneer of glacial sediment, referred to as ‘drift’ that is generally less than a metre in thickness. A geologic fault likely cuts through the northern western part of the catchment and the topography is generally flat
- Fifty-three percent of the catchment lies within the Village of Merrickville-Wolford, 34 percent in the Township of Montague, seven percent in the Township of Elizabethtown-Kitley, three percent in the City of Ottawa, one percent in the Municipality of North Grenville, one percent in the Township of Rideau Lakes and one percent in the Town of Smiths Falls
- Rideau-Merrickville catchment drainage area is 116 square kilometres and occupies about 14 percent of the Middle Rideau subwatershed and three percent of the Rideau Valley watershed
Vulnerable Areas
- Lands along the Rideau River in the catchment are subject to flooding during the regional (100 year) storm. Flood elevations for this section of the Rideau River range from 104.4 metres above mean sea level (masl) downstream of the Edmonds Lock, to 103.7 masl below the Kilmarnock Lock, to 103.1 masl upriver of Mill Street in Merrickville, to 89.6 masl at the Andrewsville Bridge, to 89.2 masl upstream of the Burritts Rapids dam
- The Assessment Report developed under the Ontario Clean Water Act identifies the upper bedrock aquifer underlying the majority of the catchment area as a Highly Vulnerable Aquifer, although, where sediments are thicker in a local area, the vulnerability would be less. The northern half of the catchment contains Wellhead Protection Areas A through D for the Merrickville municipal water supply; related provincial policies apply
Development/Trends
- Montague Township’s rural riverfront within the catchment along the north shore of the Rideau River includes a significant portion of wetland (locally and provincially significant) that takes up close to half of the overall shoreline frontage and as such much of the shoreline has retained its natural setting. The remainder of the frontage is primarily residential; however, with some exceptions mostly near Smiths Falls, the very dense small lot cottage development seen elsewhere in the subwatershed does not predominate here. Montague does not have a significant historical cottage pattern of development. Without the recreational waterfront component to the extent seen along the lakes, there is a less developed tourism infrastructure, although the river is part of the Rideau Canal corridor which attracts significant through boat traffic. While natural and environmental constraints would probably preclude a large scale obtrusive waterfront development project, there is likely opportunity for additional recreational development near the water in the Township. The wetland areas provide opportunities for low impact recreational activities such as fishing, hunting and bird watching. There is very limited amount, if any, public water access in Montague Township
- Towards Merrickville, agricultural lands are more prevalent at the south end of Montague Township along the Rideau basin (with the best land from Smiths Falls to Kilmarnock along the Highway 43 corridor) and there is some residential estate development along the river with a mixture of historic stone houses and newer development during the last few decades. These tend to be on larger lots with increased waterbody setbacks. There have been a number of severances in these areas in recent years and shoreline protection has typically been a condition of development
- Merrickville and Eastons Corners are the main settlements within the Village of Merrickville-Wolford portion of the catchment. Here, land use is predominately Rural and Agriculture with some areas of Wetland. A few private laneways with densely developed, undersized lots are found elsewhere along the Rideau River. Within the remainder of the catchment, land use is predominately Rural with some Natural Heritage-Provincially Significant Wetland designations
Conditions at a Glance
Water Quality
- Surface chemistry water quality ratings in the Rideau River (Merrickville catchment) are “Fair” over two reporting periods (2003-2008 and 2009-2014)
- Elevated nutrient and metal concentrations from inflows of nutrients (from private septic systems, agricultural and residential surface water runoff) are an occasional feature of the Rideau River. Surface chemistry water quality conditions have declined for both sites between the two monitoring periods. Decreased nutrient and metal concentrations are needed to improve the overall health of the creek
Instream and Riparian
- In the Rideau-Merrickville catchment, the riparian buffer (30 m. wide strip along the shoreline of the Rideau River and its tributaries) is comprised of wetland (43 percent), crop and pastureland (26 percent), woodland (22 percent), settlement areas (six percent) and roads (three percent)
Land Cover
- Dominant land cover is crop and pastureland (37 percent), followed by woodland (28 percent), wetland (19 percent), water (seven percent), settlement areas (six percent) and roads (three percent)
- From 2008 to 2014, there was an overall change of 109 hectares (from one land cover class to another). Within the Rideau-Merrickville catchment, change is primarily associated with the transitioning of crop and pastureland to woodland and conversion to settlement along with the conversion of woodland to settlement and crop and pastureland
- Woodland cover in the catchment has decreased by 20 hectares between 2008 and 2014 and interior forest habitat has increased by five hectares
- Wetland cover has decreased by eight percent (900 ha) from pre-settlement times to the present and now occupies 19 percent of the catchment area
Other
- Approximately 720 to 760 in-use water wells with provincial records exist in this catchment. While most water wells are used for domestic water supply, several are also used for commercial, industrial, agricultural, municipal and public water supplies or monitoring
- There are several Environmental Compliance Approvals in this catchment for discharge to the environment related to municipal and private sewage works; industrial and commercial air emissions and for waste management activities.
- There are two sand and gravel pit licenses and an abandoned pit in the catchment
- There are three Permits to Take Water TTW in this catchment for the municipal well water supply in Merrickville
Catchment Care
- Seventy-four stewardship projects have been completed with assistance from the RVCA’s Rural Clean Water, Tree Planting and Shoreline Naturalization Programs (see Section 5 of this report for details)
- Rideau River surface chemistry water quality is assessed by the Ministry of the Environment and Climate Change through its Provincial Water Quality Monitoring Program. The surface water quality sites at Andrewsville and Kilmarnock are monitored by the RVCA once a month from April to November
- Well casings of the three drinking water production wells in Merrickville have been extended into the deep aquifer, resulting in a safer municipal drinking water supply
- A watershed model developed by the RVCA in 2009 was used to study the hydrologic function of wetlands in the Rideau Valley Watershed, including those found in the Rideau-Merrickville catchment
- The Township of Montague, Village of Merrickville-Wolford and the Township of Elizabethtown-Kitley have land use planning policies and zoning provisions - on water setbacks, frontage and naturalized shorelines and wetland protection - and in some instances use site plan control to implement these policies and provisions. Together with RVCA, these municipalities work with landowners on a case by case basis to enable new development while ensuring the scale is suitable on the lot, impacts on neighbours are minimized and development maximizes the watercourse setback
- Development in and adjacent to the Provincially Significant Wetlands in the catchment (Barber’s Creek Marsh, Brassils Creek, Kilmarnock Marsh, Merrickville Marsh, Merrickville Wetland, Rideau River Part 1, Rideau River Part 4, Wolford Bog Complex) are subject to Ontario Regulation 174-06 (entitled “Development, Interference with Wetlands and Alterations to Shorelines and Watercourses”) that protects the hydrologic function of the wetland and also protects landowners and their property from natural hazards (flooding, fluctuating water table, unstable soils) associated with them
- The report entitled “A Multidisciplinary, Community-Based Study of the Environmental Health of the Rideau River” was prepared by the Canadian Museum of Nature in 2001. The study’s goals were to assess the biodiversity of the Rideau River, from Smiths Falls to Ottawa, and to reconcile local needs with long-term sustainable management of its biological diversity
- Rideau Canal National Historic Site of Canada Management Plan (2005) update establishes the long term strategic direction for the management of the Rideau Canal and the Rideau Canal World Heritage Site Management Plan (2005) specifies how its world heritage values will be protected for present and future generations
- The Landscape Character Assessment Report identifying key features and visual values along the Rideau Canal was released by the Rideau Corridor Landscape Strategy Steering Committee in April 2013 and includes recommendations for future planning and management actions to protect the visual setting of the Rideau Canal from Ottawa to Kingston, including those found in the Rideau-Smiths Falls catchment
2. Surface Water Quality Conditions
Surface water quality conditions in the Rideau-Merrickville catchment are monitored by the Ministry of the Environment and Climate Change’s Provincial Water Quality Monitoring Program. The Provincial Water Quality Monitoring Program focuses on streams; data is collected for 19 parameters including nutrients (total phosphorus and total Kjeldahl nitrogen) and metals (like aluminum and lead) and additional chemical/physical parameters (such as alkalinity, pH and total suspended solids). Figure 1 shows the location of monitoring sites along the Rideau River in the catchment.
Figure 1 Water quality monitoring sites on the Rideau River in the Rideau-Merrickville Catchment
Rideau River Water Quality
Water Quality Rating
The water quality ratings for the Rideau-Merrickville catchment are “Fair” (Table 1) as determined by the CCME Water Quality Index and are largely influenced by high nutrients and elevated metal concentrations. Each parameter is evaluated against established guidelines to determine water quality conditions. Those parameters that frequently exceed guidelines are presented below. Analysis of the data has been broken into two periods (2003 to 2008 and 2009 to 2014) for the two monitoring sites located along the Rideau River (Kilmarnock and Andrewsville) to examine if conditions have changed between these periods. Table 1 shows the overall rating for the monitored surface water quality sites within the Rideau-Merrickville catchment and Table 2 outlines the Water Quality Index (WQI) scores and their corresponding ratings.
Table 1 Water Quality Index ratings for the Rideau-Merrickville Catchment
Table 2 Water Quality Index ratings and corresponding index scores (RVCA terminology, original WQI category names in brackets)
Nutrients
Total phosphorus (TP) is used as a primary indicator of excessive nutrient loading and may contribute to abundant aquatic vegetation growth and depleted dissolved oxygen levels. The Provincial Water Quality Objective (PWQO) is used as the TP Guideline and states that in rivers concentrations greater than 0.030 mg/l indicate an excessive amount of TP.
Total Kjeldahl nitrogen (TKN) is used as secondary indicator of nutrient loadings. RVCA uses a guideline of 0.500 mg/l to assess TKN[1] concentrations at the monitored site.
Tables 3 and 4 summarize average nutrient concentrations at monitored sites within the Rideau River-Merrickville catchment and show the proportion of results that meet the guidelines.
Table 3 Summary of total phosphorous results for the Rideau River, 2003-2008 and 2009-2014
Table 4 Summary of total Kjeldahl nitrogen results for the Rideau River, 2003-2008 and 2009-2014. Highlighted values indicate average concentrations that exceed the guideline
Kilmarnock Site
Total phosphorous results were occasionally elevated at site Kilmarnock; 91 percent of samples were below the guideline in the 2003-2008 period (Figure 2); this declined to 88 percent of samples in the 2009-2014 period (Figure 3). The average TP concentration decreased from 0.027 mg/l (2002- 2007) to 0.019 mg/l (2009-2014).
TKN results show that evaluated results were a regular occurrence (Figures 4 and 5); there were few samples (12 percent) below the guideline in the 2003-2008 period and this increased to 30 percent in the 2009-2014 period. The average concentration was generally elevated but did decrease from 0.647 mg/l to 0.546 mg/l (Table 4).
Andrewsville Site
Elevated TP results were an occasional occurrence at Andrewsville; 82 percent of samples were below the guideline in the 2003-2008 period (Figure 2); this increased to 93 percent of samples in the 2009-2014 period (Figure 3). The average TP concentration also decreased slightly from 0.022 mg/l (2003- 2008) to 0.019 mg/l (2009-2014).
The bulk of TKN results have exceeded the guideline (Figure 4 and 5), with 12 percent of samples below the guideline in the 2003-2008 period, increasing to 27 percent of samples below the guideline from 2009-2014. The average concentration was elevated for both monitoring periods and decreased from 0.575 mg/l to 0.542 mg/l (Table 4).
Figure 2 Total phosphorous concentrations in the Rideau River, 2003-2008
Figure 3 Total phosphorous concentrations in the Rideau River, 2009-2014
Figure 4 Total Kjeldahl nitrogen concentrations in the Rideau River, 2003-2008
Figure 5 Total Kjeldahl nitrogen concentrations in the Rideau River, 2009-2014
Summary
The data shows that nutrient enrichment is a feature of the Rideau River. Elevated nutrients may result in nutrient loading downstream. High nutrient concentrations can help stimulate the growth of algae blooms and other aquatic vegetation in a waterbody and deplete oxygen levels as the vegetation dies off. It is important to reduce human impacts wherever possible. Enhancing shoreline buffers and diverting runoff away from the river by absorbing rainfall onsite will reduce nutrient loading into the river.
Metals
Metals were only monitored for the 2003-2008 period at the Kilmarnock site and are not available for the 2009-2014 monitoring period. Metals were monitored for both monitoring periods at the Andrewsville site. Of the metals that were routinely monitored at the Kilmarnock and Andrewsville sites on the Rideau River, Aluminum (Al),) Cadmium (Cd) and Lead (Pb) were the only metals that frequently reported concentrations above the PWQO. In elevated concentrations metals can have toxic effects on sensitive aquatic species.
Tables 5, 6, 7 and 8 summarize metal concentrations at Kilmarnock and Andrewsville sites as well as show the proportion of samples that meet guidelines. Figures 6 to 11 show metal concentrations with respect to the guidelines for the two periods of interest, 2003–2008 and 2009–2014.
For Al, the PWQO is 0.075 mg/l and 0.0005 mg/l for Cd. The PWQO for Pb depends on the hardness of the water. The Rideau River at both Kilmarnock and Andrewsville site was either 60 to 120 mg/l which would make the Pb objective 0.002 or 120-180 mg/l which would make the Pb guideline 0.004.
Some Cd and Pb results have also been removed from the analysis as they have been reported as a negative concentration. These results are estimates of concentrations and when results are close to zero about half of the results will be above the average and half will be below. When they are mapped onto a concentration axis, negative results can occur.
Table 5 Aluminum concentrations in the Rideau River, 2003-2008 and 2009-2014
Table 6 Cadmium concentrations in the Rideau River, 2003-2008 and 2009-2014
Table 7 Lead concentrations for the 0.002 objective in the Rideau River, 2003-2008 and 2009-2014
Table 8 Lead concentrations for the 0.004 objective in the Rideau River, 2003-2008 and 2009-2014
Kilmarnock Site
Of the metals routinely monitored in the Rideau River at the Kilmarnock site during the 2003-2008 period, Al and Pb reported concentrations above the PWQO.
Table 6 summarizes the Al concentrations at the monitored site and show the proportion of samples (86%) are below the guideline, with an average concentration of 0.058 mg/l.
Lead concentrations were broken up in the two guidelines depending on the water hardness of the sample (0.002, Table 7 and 0.004, Table 8). There were 45 percent of samples below the 0.002 guideline. The average concentration was 0.003 mg/l which slightly exceeded the 0.002 objective. Only one sample at Kilmarnock had a 0.004 objective. This one sample was above the guideline, with a reading of 0.010 mg/l.
Andrewsville Site
The Andrewsville site on the Rideau River had Al, Cd and Pb results that exceeded the guidelines for both monitoring periods.
From 2003-2008 and 2009-2014 a majority of Al concentrations were below the guidelines (Figures 6 and 7). The percentage of samples below the guideline increased from 90 to 95 percent between the two reporting periods. Both average concentrationss were below the guideline, with 0.034 mg/l from 2003-2008, decreasing to 0.031 mg/l from 2009-2014 (Table 5).
Cadmium results exceeded the guideline for both reporting periods (Figures 8 and 9). Ther percentage of results below the guidleine was 59 percent from 2003-2008, with an average concentration of 0.0005 mg/l. Results below the guidelines increased from 2009-2014, to 21 percent, with an average conetration of 0.0008 mg/l which also slightly increased from the previous reporting period (Table 6).
Results for Pb concentrations were separated into two guidelines depending on the hardness of the water (0.002, Table 7 and 0.004 Table 8). For the 0.002 guideline there were 47 percent of results that were below the guideline with an average concentration of 0.018 mg/l (Figure 10). Results improved slightly during the second reporting period with an average concentration of 0.014 mg/l and 21 percent of samples below the guideline (Figure 11). The 0.004 guidline had fewer results; the average concentration of results was 0.005 mg/l with 50 percent of samples below the guideline (Figure 10). The average concentration increased to 0.034 mg/l with 57 percent of samples below the guideline in the second reporting period (Figure 11).
Figure 6 Summary of aluminum concentrations in the Rideau River, 2003-2008
Figure 7 Summary of aluminum concentrations in the Rideau River, 2009-2014
Figure 8 Summary of cadmium concentrations in the Rideau River, 2003-2008
Figure 9 Summary of cadmium concentrations in the Rideau River, 2009-2014
Figure 10 Summary of lead concentrations in the Rideau River, 2003-2008
Figure 11 Summary of lead concentrations in the Rideau River, 2009-2014
Summary
For the 2003-2008 and 2009-2014 monitoring periods metal concentrations were occasionally elevated. The Kilmarnock site was not sampled for metals in the 2009-2014 reporting period and no long term trend can be observed. The Andrewsville site had a decline in Al, but not in Cd or Pb. Efforts should be made to identify pollution sources and reduce any inputs (such as runoff, metal alloys, fungicides and pesticides) to improve the overall water quality and lessen downstream impacts of the river.
[1] No Ontario guideline for TKN is presently available; however, waters not influenced by excessive organic inputs typically range from 0.100 to 0.500 mg/l, Environment Canada (1979) Water Quality Sourcebook, A Guide to Water Quality Parameters, Inland Waters Directorate, Water Quality Branch, Ottawa, Canada
3. Rideau River Tributary Riparian Conditions
Shoreline Buffer Land Cover Evaluation
The riparian or shoreline zone is that special area where the land meets the water. Well-vegetated shorelines are critically important in protecting water quality and creating healthy aquatic habitats, lakes and rivers. Natural shorelines intercept sediments and contaminants that could impact water quality conditions and harm fish habitat in streams. Well established buffers protect the banks against erosion, improve habitat for fish by shading and cooling the water and provide protection for birds and other wildlife that feed and rear young near water. A recommended target (from Environment Canada’s Guideline: How Much Habitat is Enough?) is to maintain a minimum 30 metre wide vegetated buffer along at least 75 percent of the length of both sides of rivers, creeks and streams.
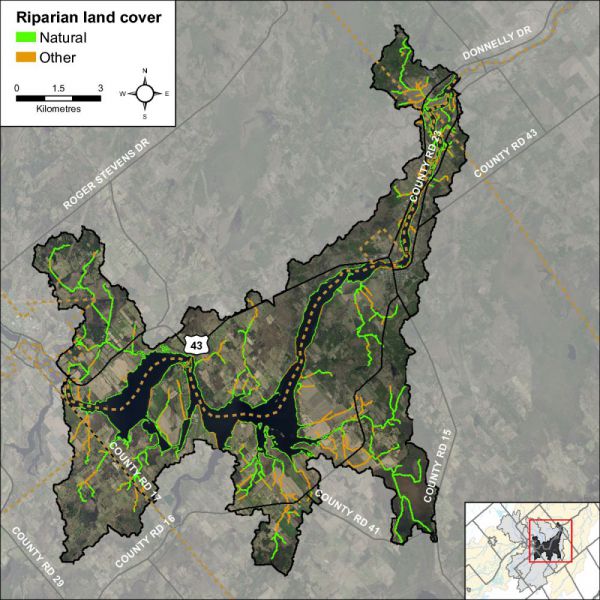
Figure 12 shows the extent of the naturally vegetated riparian zone along a 30 metre wide strip of shoreline of the Rideau River and its tributaries. This information is derived from a dataset developed by the RVCA’s Land Cover Classification Program through heads-up digitization of 20cm DRAPE ortho-imagery at a 1:4000 scale, which details the catchment landscape using 10 land cover classes.
Figure 12 Natural and other riparian land cover in the Rideau-Merrickville catchment
This analysis shows that the riparian buffer in the Rideau-Merrickville catchment is comprised of wetland (43 percent), crop and pastureland (26 percent), woodland (22 percent), settlement areas (six percent) and roads (three percent). Additional statistics for the Rideau-Merrickville catchment are presented in Table 9 and show that there has been very little change in shoreline cover from 2008 to 2014.
Table 9 Riparian land cover (2008 vs. 2014) in the Rideau-Merrickville catchment
Rideau River Tributary Instream Aquatic Habitat
Groundwater
Groundwater discharge areas can influence stream temperature, contribute nutrients, and provide important stream habitat for fish and other biota. During stream surveys, indicators of groundwater discharge are noted when observed. Indicators include: springs/seeps, watercress, iron staining, significant temperature change and rainbow mineral film. Figure 13 shows areas where one or more of the above groundwater indicators were observed during the headwater drainage feature assessments.
Figure 13 Groundwater indicators observed in the Rideau-Merrickville catchment
Headwaters Drainage Features Assessment
The RVCA Stream Characterization program assessed Headwater Drainage Features for the Middle Rosedale subwatershed in 2014. This protocol measures zero, first and second order headwater drainage features (HDF). It is a rapid assessment method characterizing the amount of water, sediment transport, and storage capacity within headwater drainage features (HDF). RVCA is working with other Conservation Authorities and the Ministry of Natural Resources and Forestry to implement the protocol with the goal of providing standard datasets to support science development and monitoring of headwater drainage features. An HDF is a depression in the land that conveys surface flow. Additionally, this module provides a means of characterizing the connectivity, form and unique features associated with each HDF (OSAP Protocol, 2013). In 2014 the program sampled 23 sites at road crossings in the Rideau – Merrickville catchment area (Figure 14).

Figure 14 Locations of the headwater sampling sites in the Rideau-Merrickville catchment
Spring photo of a headwater sample site in the Rideau-Merrickville catchment located on Putnam Road
Spring photo of a headwater sample site in the Rideau-Merrickville catchment located on Roses Bridge Road
Feature Type
The headwater sampling protocol assesses the feature type in order to understand the function of each feature. The evaluation includes the following classifications: defined natural channel, channelized or constrained, multi-thread, no defined feature, tiled, wetland, swale, roadside ditch and pond outlet. By assessing the values associated with the headwater drainage features in the catchment area we can understand the ecosystem services that they provide to the watershed in the form of hydrology, sediment transport, and aquatic and terrestrial functions. The Rideau-Merrickville catchment headwater drainage features had a wide variety of feature types including wetland, natural channel, channelized, roadside and swale. Figure 15 shows the feature type of the primary feature at the sampling locations.
Figure 15 Headwater feature types in the Rideau-Merrickville catchment
Headwater Feature Flow
The observed flow condition within headwater drainage features can be highly variable depending on timing relative to the spring freshet, recent rainfall, soil moisture, etc. Flow conditions are assessed in the spring and in the summer to determine if features are perennial and flow year round, if they are intermittent and dry up during the summer months or if they are ephemeral systems that do not flow regularly and generally respond to specific rainstorm events or snowmelt. Flow conditions in headwater systems can change from year to year depending on local precipitation patterns. Many of the features were not assessed in the summer due to timing constraints which resulted in the feature flow types being classified as unknown. Figure 16 shows the observed flow conditions at the sampling locations in the Rideau-Merrickville catchment.
Figure 16 Headwater feature flow conditions in the Rideau-Merrickville catchment
Feature Channel Modifications
Channel modifications were assessed at each headwater drainage feature sampling location. Modifications include channelization, dredging, hardening and realignments. The majority of sampling locations for the Rideau-Merrickville catchment area were classified as having no channel modifications and four appeared to have been historically dredged. Figure 17 shows the channel modifications observed at the sampling locations in the Rideau-Merrickville catchment.
Figure 17 Headwater feature channel modifications in the Rideau-Merrickville catchment
Headwater Feature Vegetation
Headwater feature vegetation evaluates the type of vegetation that is found within the drainage feature. The type of vegetated within the channel influences the aquatic and terrestrial ecosystem values that the feature provides. For some types of headwater features the vegetation within the feature plays a very important role in flow and sediment movement and provides wildlife habitat. The following classifications are evaluated no vegetation, lawn, wetland, meadow, scrubland and forest. The features assessed in the Rideau-Merrickville catchment were dominated by wetland and meadow vegetation within the features. One feature was classified as scrubland and one was classified as having lawn within the feature. Figure 18 depicts the dominant vegetation observed at the sampled headwater sites in the Rideau-Merrickville catchment.
Figure 18 Headwater feature vegetation types in the Rideau-Merrickville catchment
Headwater Feature Riparian Vegetation
Headwater riparian vegetation evaluates the type of vegetation that is found along the adjacent lands of a headwater drainage feature. The type of vegetation within the riparian corridor influences the aquatic and terrestrial ecosystem values that the feature provides to the watershed. The sample locations in Rideau - Merrickville were dominated by natural vegetation in the form of meadow, scrubland, forest and wetland vegetation. Figure 19 depicts the type of riparian vegetation observed at the sampled headwater sites in the Rideau-Merrickville catchment.
Figure 19 Headwater feature riparian vegetation types in the Rideau-Merrickville catchment
Headwater Feature Sediment Deposition
Assessing the amount of recent sediment deposited in a channel provides an index of the degree to which the feature could be transporting sediment to downstream reaches (OSAP, 2013). Evidence of excessive sediment deposition might indicate the requirement to follow up with more detailed targeted assessments upstream of the site location to identify potential best management practices to be implemented. Conditions ranged from no deposition observed to substantial deposition recorded. Figure 20 depicts the degree of sediment deposition observed at the sampled headwater sites in the Rideau-Merrickville catchment.
Figure 20 Headwater feature sediment deposition in the Rideau-Merrickville catchment
Headwater Feature Upstream Roughness
Feature roughness will provide a measure of the amount of materials within the bankfull channel that could slow down the velocity of water flowing within the headwater feature (OSAP, 2013). Materials on the channel bottom that provide roughness include vegetation, woody debris and boulders/cobble substrates. Roughness can provide benefits in mitigating downstream erosion on the headwater drainage feature and the receiving watercourse by reducing velocities. Roughness also provides important habitat conditions to aquatic organisms. The sample locations in the Rideau-Merrickville catchment area ranged from minimal to extreme roughness conditions. Figure 21 shows the feature roughness conditions at the sampling locations in the Rideau-Merrickville catchment.
Figure 21 Headwater feature roughness in the Rideau-Merrickville catchment
Fish Community
The Rideau-Merrickville catchment is classified as a mixed community of warm and cool water recreational and baitfish fishery with 27 species observed. Table 10 lists those species observed in the catchment (Source: MNR/RVCA). Figure 22 shows the sampling locations along the Rideau River and its tributaries.
Figure 22 Rideau-Merrickville fish sampling locations
Table 10 Fish species observed in the Rideau-Merrickville catchment
Riparian Restoration
Figure 23 depicts the location of several riparian restoration opportunities as a result of observations made during the headwater drainage feature assessments.
Figure 23 Riparian restoration opportunities along tributaries of the Rideau River
4. Land Cover
Land cover and any change in coverage that has occurred over a six year period is summarized for the Rideau-Merrickville catchment using spatially continuous vector data representing the catchment during the spring of 2008 and 2014. This dataset was developed by the RVCA through heads-up digitization of 20cm DRAPE ortho-imagery at a 1:4000 scale and details the surrounding landscape using 10 land cover classes.
As shown in Table 11, the dominant land cover types in 2008 and 2014 were crop and pastureland and wetland, followed by settlement areas and woodland.
Table 11 Land cover (2008 vs. 2014) in the Rideau-Merrickville catchment
* Does not include treed swamps ** Includes treed swamps
From 2008 to 2014, there was an overall change of 109 hectares (from one land cover class to another). Change within the Rideau-Merrickville catchment is primarily associated with the transitioning of crop and pastureland to woodland and conversion to settlement along with the conversion of woodland to settlement and crop and pastureland (see Figure 24 for the location of the major changes).
Figure 24 Dominant land cover change in the Rideau-Merrickville catchment (2014)
Table 12 shows the type of land cover change that has taken place between land cover classes/types from 2008 to 2014. Overall, the net area of crop and pastureland change (loss) is small at 31 hectares relative to the remaining area of crop and pastureland in the catchment (as of 2014), as is the change (loss) in the area of woodland (at 19 hectares) when compared to the remaining woodland (in 2014). However, the net area of settlement change (gain) is greater (at 47 hectares) relative to the remaining area of settlement in the catchment (as of 2014).
Table 12 Land cover change in the Rideau-Merrickville catchment (2008 to 2014)
Woodland Cover
In the Environment Canada Guideline (Third Edition) entitled “How Much Habitat Is Enough?” (hereafter referred to as the “Guideline”) the opening narrative under the Forest Habitat Guidelines section states that prior to European settlement, forest was the predominant habitat in the Mixedwood Plains ecozone. The remnants of this once vast forest now exist in a fragmented state in many areas (including the Rideau Valley watershed) with woodland patches of various sizes distributed across the settled landscape along with higher levels of forest cover associated with features such as the Frontenac Axis (within the on-Shield areas of the Rideau Lakes and Tay River subwatersheds). The forest legacy, in terms of the many types of wildlife species found, overall species richness, ecological functions provided and ecosystem complexity is still evident in the patches and regional forest matrices (found in the Middle Rideau subwatershed and elsewhere in the Rideau Valley watershed). These ecological features are in addition to other influences which forests have on water quality and stream hydrology including reducing soil erosion, producing oxygen, storing carbon along with many other ecological services that are essential not only for wildlife but for human well-being.
The Guideline also notes that forests provide a great many habitat niches that are in turn occupied by a great diversity of plant and animal species. They provide food, water and shelter for these species - whether they are breeding and resident locally or using forest cover to help them move across the landscape. This diversity of species includes many that are considered to be species at risk. Furthermore, from a wildlife perspective, there is increasing evidence that the total forest cover in a given area is a major predictor of the persistence and size of bird populations, and it is possible or perhaps likely that this pattern extends to other flora and fauna groups. The overall effect of a decrease in forest cover on birds in fragmented landscapes is that certain species disappear and many of the remaining ones become rare, or fail to reproduce, while species adapted to more open and successional habitats, as well as those that are more tolerant to human-induced disturbances in general, are able to persist and in some cases thrive. Species with specialized-habitat requirements are most likely to be adversely affected. The overall pattern of distribution of forest cover, the shape, area and juxtaposition of remaining forest patches and the quality of forest cover also play major roles in determining how valuable forests will be to wildlife and people alike.
The current science generally supports minimum forest habitat requirements between 30 and 50 percent, with some limited evidence that the upper limit may be even higher, depending on the organism/species phenomenon under investigation or land-use/resource management planning regime being considered/used.
As shown in Figure 25, 31 percent of the Rideau-Merrickville catchment contains 3302 hectares of upland forest and 296 hectares of lowland forest (treed swamps) versus the 34 percent of woodland cover in the Middle Rideau subwatershed. This is greater than the 30 percent of forest cover that is identified as the minimum threshold required to sustain forest birds according to the Guideline and which may only support less than one half of potential species richness and marginally healthy aquatic systems. When forest cover drops below 30 percent, forest birds tend to disappear as breeders across the landscape.
Figure 25 Woodland cover and forest interior (2014)
Woodland (Patch) Size
According to the Ministry of Natural Resources’ Natural Heritage Reference Manual (Second Edition), larger woodlands are more likely to contain a greater diversity of plant and animal species and communities than smaller woodlands and have a greater relative importance for mobile animal species such as forest birds.
Bigger forests often provide a different type of habitat. Many forest birds breed far more successfully in larger forests than they do in smaller woodlots and some rely heavily on forest interior conditions. Populations are often healthier in regions with more forest cover and where forest fragments are grouped closely together or connected by corridors of natural habitat. Small forests support small numbers of wildlife. Some species are “area-sensitive” and tend not to inhabit small woodlands, regardless of forest interior conditions. Fragmented habitat also isolates local populations, especially small mammals, amphibians and reptiles with limited mobility. This reduces the healthy mixing of genetic traits that helps populations survive over the long run (Conserving the Forest Interior. Ontario Extension Notes, 2000).
The Environment Canada Guideline also notes that for forest plants that do not disperse broadly or quickly, preservation of some relatively undisturbed large forest patches is needed to sustain them because of their restricted dispersal abilities and specialized habitat requirements and to ensure continued seed or propagation sources for restored or regenerating areas nearby.
The Natural Heritage Reference Manual continues by stating that a larger size also allows woodlands to support more resilient nutrient cycles and food webs and to be big enough to permit different and important successional stages to co-exist. Small, isolated woodlands are more susceptible to the effects of blowdown, drought, disease, insect infestations, and invasions by predators and non-indigenous plants. It is also known that the viability of woodland wildlife depends not only on the characteristics of the woodland in which they reside, but also on the characteristics of the surrounding landscape where the woodland is situated. Additionally, the percentage of forest cover in the surrounding landscape, the presence of ecological barriers such as roads, the ability of various species to cross the matrix surrounding the woodland and the proximity of adjacent habitats interact with woodland size in influencing the species assemblage within a woodland.
In the Rideau-Merrickville catchment (in 2014), 117 (36 percent) of the 321 woodland patches are very small, being less than one hectare in size. Another 165 (51 percent) of the woodland patches ranging from one to less than 20 hectares in size tend to be dominated by edge-tolerant bird species. The remaining 39 (13 percent of) woodland patches range between 21 and 290 hectares in size. Thirty-two of these patches contain woodland between 20 and 100 hectares and may support a few area-sensitive species and some edge intolerant species, but will be dominated by edge tolerant species.
Conversely, seven (three percent) of the 321 woodland patches in the drainage area exceed the 100 plus hectare size needed to support most forest dependent, area sensitive birds and are large enough to support approximately 60 percent of edge-intolerant species. One patch tops 200 hectares, which according to the Environment Canada Guideline will support 80 percent of edge-intolerant forest bird species (including most area sensitive species) that prefer interior forest habitat conditions.
Table 13 presents a comparison of woodland patch size in 2008 and 2014 along with any changes that have occurred over that time. A decrease (of 20 ha) has been observed in the overall woodland patch area between the two reporting periods with most of the physical change in area occurring in the 20 to 50 and 100 to 200 hectare woodland patch size class ranges.
Table 13 Woodland patches in the Rideau-Merrickville catchment (2008 and 2014)
*Includes treed swamps
Forest Interior
The forest interior is habitat deep within woodlands. It is a sheltered, secluded environment away from the influence of forest edges and open habitats. Some people call it the “core” or the “heart” of a woodland. The presence of forest interior is a good sign of woodland health, and is directly related to the woodland’s size and shape. Large woodlands with round or square outlines have the greatest amount of forest interior. Small, narrow woodlands may have no forest interior conditions at all. Forest interior habitat is a remnant natural environment, reminiscent of the extensive, continuous forests of the past. This increasingly rare forest habitat is now a refuge for certain forest-dependent wildlife; they simply must have it to survive and thrive in a fragmented forest landscape (Conserving the Forest Interior. Ontario Extension Notes, 2000).
The Natural Heritage Reference Manual states that woodland interior habitat is usually defined as habitat more than 100 metres from the edge of the woodland and provides for relative seclusion from outside influences along with a moister, more sheltered and productive forest habitat for certain area sensitive species. Woodlands with interior habitat have centres that are more clearly buffered against the edge effects of agricultural activities or more harmful urban activities than those without.
In the Rideau-Merrickville catchment (in 2014), the 321 woodland patches contain 119 forest interior patches (Figure 25) that occupy five percent (643 ha.) of the catchment land area (which is equal to the five percent of interior forest in the Middle Rideau Subwatershed). This is below the ten percent figure referred to in the Environment Canada Guideline that is considered to be the minimum threshold for supporting edge intolerant bird species and other forest dwelling species in the landscape.
Most patches (102) have less than 10 hectares of interior forest, 62 of which have small areas of interior forest habitat less than one hectare in size. The remaining 17 patches contain interior forest ranging between 11 and 70 hectares in area.
Between 2008 and 2014, there has been a notable change in the number of woodland patches containing smaller areas of interior habitat (Table 14) with an increase of 43 woodlands containing less than one hectare of interior forest over this period and 16 woodlands with one to 10 hectares of interior habitat. This has occurred as a result of the loss of interior forest habitat in the larger woodland patches in the catchment over this period.
Table 14 Woodland Interior in the Rideau-Merrickville catchment (2008 and 2014)
Wetland Cover
Wetlands are habitats forming the interface between aquatic and terrestrial systems. They are among the most productive and biologically diverse habitats on the planet. By the 1980s, according to the Natural Heritage Reference Manual, 68 percent of the original wetlands south of the Precambrian Shield in Ontario had been lost through encroachment, land clearance, drainage and filling.
Wetlands perform a number of important ecological and hydrological functions and provide an array of social and economic benefits that society values. Maintaining wetland cover in a watershed provides many ecological, economic, hydrological and social benefits that are listed in the Reference Manual and which may include:
- contributing to the stabilization of shorelines and to the reduction of erosion damage through the mitigation of water flow and soil binding by plant roots
- mitigating surface water flow by storing water during periods of peak flow (such as spring snowmelt and heavy rainfall events) and releasing water during periods of low flow (this mitigation of water flow also contributes to a reduction of flood damage)
- contributing to an improved water quality through the trapping of sediments, the removal and/or retention of excess nutrients, the immobilization and/or degradation of contaminants and the removal of bacteria
- providing renewable harvesting of timber, fuel wood, fish, wildlife and wild rice
- contributing to a stable, long-term water supply in areas of groundwater recharge and discharge
- providing a high diversity of habitats that support a wide variety of plants and animals
- acting as “carbon sinks” making a significant contribution to carbon storage
- providing opportunities for recreation, education, research and tourism
Historically, the overall wetland coverage within the Great Lakes basin exceeded 10 percent, but there was significant variability among watersheds and jurisdictions, as stated in the Environment Canada Guideline. In the Rideau Valley Watershed, it has been estimated that pre-settlement wetland cover averaged 35 percent using information provided by Ducks Unlimited Canada (2010) versus the 21 percent of wetland cover existing in 2014 derived from DRAPE imagery analysis.
Using the same dataset, it is estimated that pre-settlement (historic) wetland cover averaged 32 percent in the Middle Rideau subwatershed versus the 27 percent of cover existing in 2014. This decline in wetland cover is also evident in the Rideau-Merrickville catchment (as seen in Figure 26) where there has been an eight percent decrease in the area of wetland cover from pre-settlement times to the present (as summarized in Table 15).
Figure 26 Catchment wetland cover
While there has been a reported decrease in wetland cover in the Rideau-Merrickville catchment from pre-settlement times, the remaining wetland cover in 2014 remains above the ecological thresholds cited in the Environment Canada Guideline. Nonetheless, in order to maintain critical hydrological, ecological functions along with related recreational and economic benefits provided by these wetland habitats in the catchment, a “no net loss” of currently existing wetlands should be employed to ensure the continued provision of tangible benefits accruing from them for landowners and surrounding communities.
Table 15 Wetland cover in the Middle Rideau subwatershed and Rideau-Merrickville catchment (Historic to 2014)
5. Stewardship and Protection
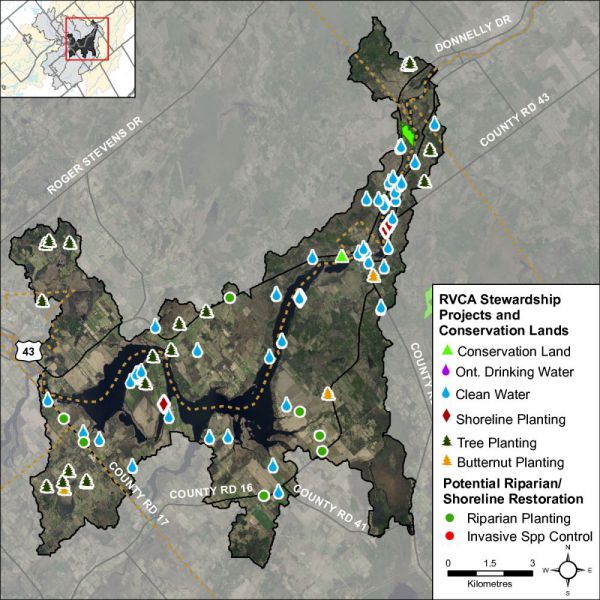
The RVCA and its partners are working to protect and enhance environmental conditions in the Middle Rideau Subwatershed. Figure 27 shows the location of all stewardship projects completed in the Rideau-Merrickville catchment along with sites identified for potential shoreline restoration.
Rural Clean Water Projects
From 2009 to 2014, seven septic system replacements, four erosion control projects, three well decommissionings, three well upgrades, one well replacement, one livestock fencing project, one milkhouse washwater treatment facility and one windbreak buffer were completed. Between 2003 and 2008, seven septic system replacements, five well decommissionings, three livestock fencing projects, two well upgrades, one windbreak buffer, one erosion control project, one fuel storage and handling facility, one nutrient management plan and one wastewater runoff project were carried out. Prior to 2003, three livestock fencing projects, two septic system replacements, one milkhouse washwater treatment facility and one manure storage facility were completed. Total value of all 50 projects is $380,843 with $207,425 of that amount funded through grant dollars from the RVCA.
Figure 27 Stewardship and potential restoration locations
Tree Planting Projects
The location of RVCA Tree Planting Program projects is shown in Figure 27. From 2009 to 2014, 18,000 trees were planted at two sites. Between 2003 and 2008, 20,476 trees were planted at six sites and prior to 2003, 28,355 trees were planted at 10 sites, resulting in the reforestation of 35 hectares. Total value of all 18 projects is $186,978 with $58,904 of that amount coming from various fundraising sources.
Through the RVCA Butternut Recovery Program, an additional 60 butternut trees were planted in the Rideau-Merrickville catchment between 2003 and 2014, as part of efforts to introduce healthy seedlings from tolerant butternuts into various locations across Eastern Ontario.
Shoreline Naturalization Projects
With the assistance of the RVCA’s Shoreline Naturalization Program, 963 trees and shrubs were planted at six project locations to create a 722 metre long shoreline buffer at a total project value of $4,183.
Valley, Stream, Wetland and Hazard Land Regulation
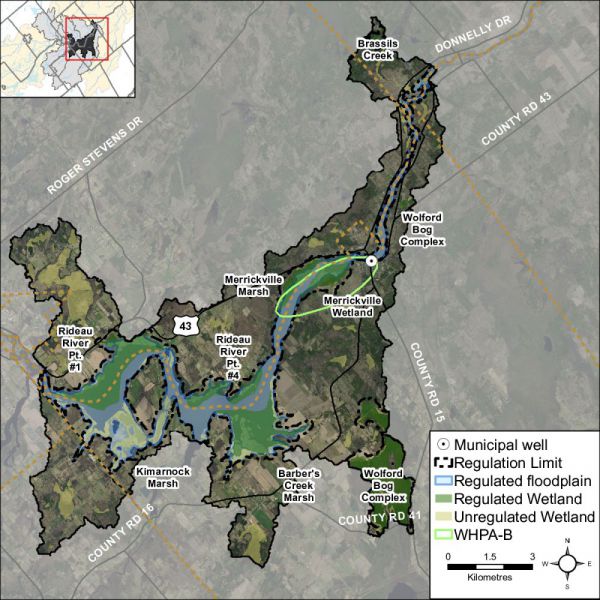
The Rideau-Merrickville catchment covers 116 square kilometres with 31.3 square kilometres (or 27 percent) of the drainage area being within the regulation limit of Ontario Regulation 174/06 (Figure 28), giving protection to wetland areas and river or stream valleys that are affected by flooding and erosion hazards.
Wetlands occupy 22.2 sq. km. (or 19 percent) of the catchment. Of these wetlands, 12.4 sq. km (or 56 percent) are designated as provincially significant and included within the RVCA regulation limit. This leaves the remaining 9.9 sq. km (or 44 percent) of wetlands in the catchment outside the regulated area limit.
Of the 176.1 kilometres of stream in the catchment, regulation limit mapping has been plotted along 86.3 kilometers of streams (representing 49 percent of all streams in the catchment). Some of these regulated watercourses (31.1 km or 18 percent of all streams) flow through regulated wetlands; the remaining 55.2 km (or 64 percent) of regulated streams are located outside of those wetlands. Plotting of the regulation limit on the remaining 89.7 km (or 51 percent) of streams requires identification of flood and erosion hazards and valley systems.
Within the regulation limit, “development” and “site alteration” require RVCA permission. The “alteration to waterways” provision of Ontario Regulation 174/06 applies to all watercourses.
Figure 28 RVCA regulation limits and Merrickville Wellhead Protection Area
Vulnerable Drinking Water Areas
The Wellhead Protection Area around the Village of Merrickville municipal drinking water source is located within the Rideau-Merrickville drainage catchment (Figure 28). This area is subject to mandatory policies in the Mississippi-Rideau Source Protection Plan developed under the Clean Water Act. These policies specifically regulate land uses and activities that are considered drinking water threats, thereby reducing the risk of contamination of the municipal drinking water source.
With the exception of the area around Kilmarnock, the Rideau-Merrickville drainage catchment is also considered to have a Highly Vulnerable Aquifer. This means that the nature of the overburden (thin soils, fractured bedrock) does not provide a high level of protection for the underlying groundwater making the aquifer more vulnerable to contaminants released on the surface. The Mississippi-Rideau Source Protection Plan includes policies that focus on the protection of groundwater region-wide due to the fact that most of the region, which encompasses the Mississippi and Rideau watersheds, is considered Highly Vulnerable Aquifer.
The lands adjacent to the Rideau River are also considered a Significant Groundwater Recharge Area. This means that there is a volume of water moving from the surface into the ground and groundwater serves either as a municipal drinking water source or supplies a lake or stream ecosystem. The Plan was not required to include policies to specifically address Significant Groundwater Recharge Areas.
For detailed maps and policies that have been developed to protect drinking water sources, please go to the Mississippi-Rideau Source Protection Region website at www.mrsourcewater.ca to view the Mississippi-Rideau Source Protection Plan.
6. Challenges/Issues
Water Quality
- Surface water quality in the Rideau River is “Fair” as determined by surface water chemistry data. Occasional exceedances of nutrients and metals contributed to the rating
Shorelines
- The riparian buffer in the Rideau-Merrickville catchment (30 m. wide strip along the shoreline of the Rideau River and its tributaries) is comprised of wetland (43 percent), crop and pastureland (26 percent), woodland (22 percent), settlement areas (six percent) and roads (three percent) and (at 65 percent) is below the recommended target to maintain a minimum 30 metre wide, naturally vegetated buffer along at least 75 percent of the length of both sides of rivers, creeks and streams.
- Emerald ash borer poses a significant threat to the ecology of the subwatershed, given the prominence of ash trees along shorelines and in riparian and wetland areas. Many tree stands are predominantly ash and with their anticipated loss, it is unclear what will replace them and the overall effect of their collective demise on the physical and natural functions/values they provide for erosion, water quality and fish and wildlife habitat protection
Land Cover
- The catchment contains 981 ha of unevaluated wetland (occupying 8 percent of its total area) that provides many important social, hydrological, biological and ecological functions/services. Although not under imminent threat from development activity, they do remain vulnerable to drainage and land clearing activities in the absence of any regulatory and planning controls that would otherwise protect them
Development
- Some waterfront properties contain existing non-complying dwellings with respect to minimum water frontage and lot area and are often located within 30 metres of the water that require minor variances for expansion and/or reconstruction of dwellings where standard development setbacks from water are difficult to achieve. In these cases, Township staff and the Conservation Authority can meet with resistance and push back when attempts are made to implement standards for development setbacks, vegetated shorelines and septic systems
Natural Hazards
- Floodplain mapping for the Middle Rideau is over 35 years out of date for that reach of the Rideau River extending from Smiths Falls to Burritts Rapids
7. Opportunities/Actions
Water Quality
- Investigate the source of possible pollutants along the Rideau River and its tributaries and consider implementing measures to reduce nutrient and bacterial loadings
- Implement agricultural and residential best management practices to address the occasional exceedances of nutrient and metal concentrations in the Rideau River by restricting livestock access to the river, limiting the use of fertilizers and pesticide applications and improving or maintaining a shoreline buffer
- Continue to offer the suite of water quality improvement projects provided by the Rideau Valley Rural Clean Water Program to landowners
- Continue to protect the water resources of the Rideau River and Canal and its tributaries within the catchment through implementation of municipal (Village of Merrickville-Wolford, Township of Elizabethtown-Kitley, Township of Montague) and agency (Parks Canada) land use planning and development policies, practices and standards
Shorelines/Headwaters
- Continue to promote the Rideau Valley Shoreline Naturalization and Tree Planting Programs to landowners
- RVCA and its partners (Village of Merrickville-Wolford, Township of Elizabethtown-Kitley, Township of Montague) are to continue educating landowners about the value and importance of headwater drainage features, natural shorelines and waterfront property best management practices with respect to shoreline use and development, septic system installation and maintenance and shoreline vegetation retention and enhancement
- Protect the riparian buffer along the shoreline of the Rideau River and catchment streams (headwaters) during the development approvals process through adherence to and enforcement of municipal land-use policies and zoning standards
- Target shoreline restoration at sites identified in this report (shown as “Other riparian land cover” in Figure 12 and “Potential Riparian/Shoreline Restoration” in Figure 23) and explore other restoration and enhancement opportunities along the Rideau River and its tributaries
Development
- Collectively work with approval authorities (Township of Elizabethtown-Kitley, Village of Merrickville-Wolford, Conservation Authority, the Health Unit and Mississippi-Rideau Septic System Office) to consistently implement current land use planning and development policies for water quality and shoreline protection adjacent to the Rideau River and Canal and other catchment streams (i.e., to attain a minimum 30 metre development setback from water)
- Explore ways and means to more effectively enforce and implement conditions of land-use planning and development approval to achieve net environmental gains (particularly with respect to rehabilitating or protecting naturally vegetated shorelines and water quality)
- Encourage Committees of Adjustment to take advantage of technical and environmental information and recommendations forthcoming from planning and environmental professionals
- Municipalities and agencies are encouraged to strengthen natural heritage and water resources official plan policies and zoning provisions (water setbacks, frontage and naturalized shorelines and wetland protection) where deemed appropriate
- Utilize RVCA subwatershed and catchment reports to help develop/revise official plan policies to protect surface water resources and the natural environment (including woodlands, wetlands and shoreline cover)
- Consider establishing RVCA regulations limits to protect additional wetlands
Natural Hazards
- RVCA provides ongoing “hazardous lands management” support to the Township of Montague and Village of Merrickville-Wolford through its Hazardous Lands (flood plain, unstable slope) Management Program. In this catchment, this will require that updated floodplain mapping be prepared for the reach of the Rideau River extending from Smiths Falls to Burritts Rapids
Full Catchment Report


")
")