Middle Rideau Subwatershed Report 2015
BARBERS CREEK CATCHMENT
The Rideau Valley Conservation Authority produces individual reports for ten catchments in the Middle Rideau subwatershed. Using data collected and analysed by the RVCA through its watershed monitoring and land cover classification programs, surface water quality conditions are reported for Barbers Creek along with a summary of environmental conditions for the surrounding countryside every six years.
This information is used to better understand the effects of human activity on our water resources, allows us to better track environmental change over time and helps focus watershed management actions where they are needed the most to help sustain the ecosystem services (cultural, aesthetic and recreational values; provisioning of food, fuel and clean water; regulation of erosion/natural hazard protection and water purification; supporting nutrient/water cycling and habitat provision) provided by the catchment’s lands and forests and waters (Millennium Ecosystem Assessment 2005).
The following pages of this report are a compilation of that work and contain information on surface water quality, riparian conditions, land cover, stewardship activity and hazard land and water resources protection.
1. Catchment Facts

General Geography
- The Rideau River flows through the heart of the Middle Rideau and is a focal point for residents and visitors to the area. It extends from the outlet of Lower Rideau Lake at Poonamalie (where there is one dam and one lock) to Burritts Rapids (where there is also a dam and lock), at which point it enters the Lower Rideau on its way to Rideau Falls. The Rideau River is also an integral part of the Rideau Canal National Historic Site of Canada and is a significant tourist attraction which draws boaters, cottagers, and campers to the area
- Smiths Falls, Merrickville and Burritts Rapids are the main settlements in the Middle Rideau subwatershed. The Barbers Creek catchment is predominantly rural in character with agriculture being the main land use
- Parks Canada staff manage water levels for recreational purposes along the Rideau Canal/Waterway that flows by the catchment, ensuring 1.5 metres of draft during the navigation season. In this managed system, water levels on the Rideau Canal are manipulated by operation of numerous dams. In the Middle Rideau subwatershed, Parks Canada staff operate 9 dam and lock complexes with 13 locks for a fall of 36.2 metres over 35.6 kilometres. Water levels are maintained as close as possible to set objectives through the May to October navigation season. The levels are lowered through the rest of October and into November and held at the winter levels until the spring freshet in late March or early April naturally increases inflows to the system. To reduce the impact of the higher flows in the spring, the amount of snow water equivalent, forecast rain, ice cover, flows and levels are assessed and the dams in the Middle Rideau reach are operated accordingly to quickly pass as much water as possible. In late April and early May, the dams are gradually closed and water levels are brought up to be ready, once again, for the navigation season
Physical Geography
- All of the Barbers Creek catchment and the rest of the Middle Rideau subwatershed primarily resides within the Smith Falls Limestone Plain, which in this area, consists mainly of older Paleozoic quartz sandstone and dolostone of the March Formation. Oxford Formation dolostone is, however, found at the northern tip of the catchment. A small area of the bedrock in the lower (northern) catchment is overlain with a rocky, sandy glacial till plain, which may host drumlins. The rest of the bedrock in the catchment is overlain by a thin veneer of glacial sediment, referred to as ‘drift’ that is generally less than a metre in thickness along with organic deposits underlying the two main wetlands in the catchment
- Sixty percent of the catchment lies within the Village of Merrickville-Wolford and 40 percent within the Township of Elizabethtown-Kitley
- Barbers Creek catchment drainage area is 48 square kilometres and occupies about six percent of the Middle Rideau subwatershed and one percent of the Rideau Valley watershed
Vulnerable Areas
- Lower reach of Barbers Creek is subject to a flooding hazard during the regional storm flood (the 100 year flood). Surveys and studies undertaken in accordance with provincial standards have determined that the 100 year flood elevation in this area ranges from 108.7 metres above mean sea level at Barber Road to 103.8 metres above mean sea level at its outlet to the Rideau River
- The Assessment Report developed under the Ontario Clean Water Act identifies the upper bedrock aquifer underlying all of the catchment area as a Highly Vulnerable Aquifer, although, where sediments are thicker in a local area, the vulnerability would be less
Development
- Land uses in the catchment are Rural and Agriculture with some Wetland
Conditions at a Glance
Water Quality
- Surface chemistry water quality rating in Barbers Creek is “Fair” over two reporting periods (2003-2008 and 2009-2014). Elevated bacterial counts and nutrient concentrations from inflows of nutrients (from private septic systems, agricultural and residential surface water runoff) are a feature of Barbers Creek. Decreased nutrient and bacterial counts are needed to improve the overall health of the creek
- Instream biological water quality conditions at the Barbers Creek sample location range from “Very Poor” to “Good” from 2003 to 2014 (using a grading scheme developed by Ontario Conservation Authorities in Ontario for benthic invertebrates) with an overall benthic invertebrate water quality rating of “Poor” to “Good” determined for this period
Instream and Riparian
- Overall instream and riparian condition for the Barbers creek catchment as assessed by the stream characterization and headwater drainage feature assessment programs show that Barbers Creek and its tributaries are in generally fair condition. The majority of the system has low erosion levels and a healthy riparian corridor. Instream diversity of aquatic habitat is fairly uniform. An opportunity was identified along one of the headwater drainage features to enhance riparian habitat conditions
- The Barbers Creek catchment has 28 species of recreational and bait fish and is classified as having a warm/cool water thermal guild that supports the Barbers Creek/Rideau River fishery
- In the Barbers Creek catchment, the riparian buffer (30 m. wide strip along the shoreline of all lakes and streams) is comprised of wetland (46 percent), crop and pastureland (34 percent), woodland (17 percent), roads (two percent) and settlement areas (one percent)
Land Cover
- Dominant land cover is crop and pastureland (40 percent), followed by wetland (29 percent), woodland (26 percent), settlement areas (three percent) and roads (two percent). From 2008 to 2014, there was an overall change of 102 hectares (from one land cover class to another). While a large portion of change for Barbers Creek is a result of the conversion of woodland to crop and pastureland, it also appears that a similar proportion of change is associated with crop and pastureland emerging as young woodland
- Woodland cover in the catchment has decreased by 13 hectares between 2008 and 2014 and interior forest habitat has increased by six hectares
- Wetland cover has decreased by four percent (209 ha) from pre-settlement times to the present and now occupies 29 percent of the catchment area
Other
- Approximately 98 in-use water wells with provincial records exist in this catchment. While most water wells are used for domestic water supply, several are also used for agricultural purposes along with one other that is used as a public water supply
- There are no active Permits to Take Water or Environmental Compliance Approvals in the catchment; nor are there any open or closed aggregate operations in the catchment
Catchment Care
- Eight stewardship projects have been completed with assistance from the RVCA’s Rural Clean Water and Tree Planting Programs (see Section 5 of this report for details)
- Barbers Creek surface water quality has been monitored by the RVCA through its Baseline Monitoring Program since 2003. The surface water quality at site BAR-01 is monitored once a month from April to November
- RVCA has been collecting benthic invertebrates in Barbers Creek at the Weedmark Road site since 2003
- RVCA conducted a fish survey along Barbers Creek in 2014
- RVCA completed a stream characterization survey on Barbers Creek in 2014, working upstream to the headwaters from the mouth of the creek where it empties into the Rideau River taking measurements and recording observations on instream habitat, bank stability, other attributes and preparing a temperature profile
- RVCA completed five headwater drainage feature assessments at road crossings in the Barbers Creek catchment in 2014. This protocol measures zero and first order headwater drainage features and is a rapid assessment method characterizing the amount of water, sediment transport, and storage capacity within headwater drainage features
- A watershed model developed by the RVCA in 2009 was used to study the hydrologic function of wetlands in the Rideau Valley Watershed, including those found in the Barbers Creek catchment
- The Township of Elizabethtown-Kitley and the Village of Merrickville-Wolford have land use planning policies and zoning provisions - on water setbacks, frontage and naturalized shorelines and wetland protection - and in some instances use site plan control to implement these policies and provisions. Together with RVCA, these municipalities work with landowners on a case by case basis to enable new development while ensuring the scale is suitable on the lot, impacts on neighbours are minimized and development maximizes the watercourse setback
- Development in and adjacent to the Provincially Significant Wetlands in the catchment (Barber’s Creek Marsh, Irish Lake-Barber Creek, Wolford Bog Part 1) are subject to Ontario Regulation 174-06 (entitled “Development, Interference with Wetlands and Alterations to Shorelines and Watercourses”) that protects the hydrologic function of the wetland and also protects landowners and their property from natural hazards (flooding, fluctuating water table, unstable soils) associated with them
2. Surface Water Quality Conditions
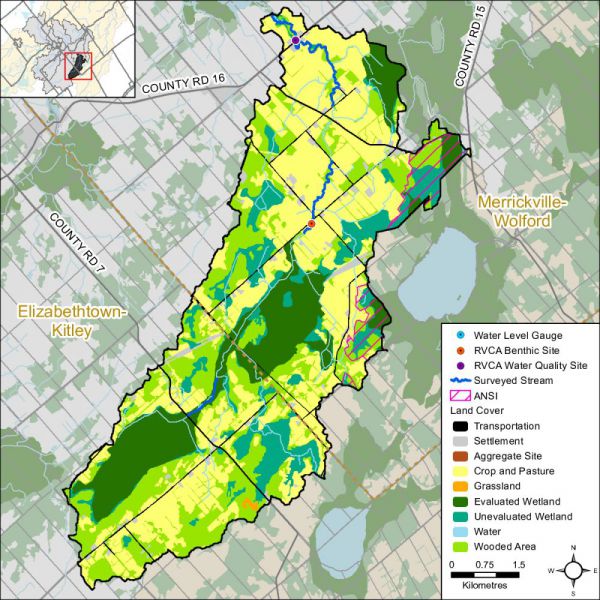
Surface water quality conditions in the Barbers Creek catchment are monitored by the Rideau Valley Conservation Authority’s (RVCA) Baseline Water Quality Monitoring Program. The Baseline Water Quality Program focuses on streams; data is collected for 22 parameters including nutrients (total phosphorus, total Kjeldahl nitrogen and ammonia), E. coli, metals (like aluminum and copper) and additional chemical/physical parameters (such as alkalinity, chlorides, pH and total suspended solids). Figure 1 shows the location of the monitoring site in the catchment.
Figure 1 Water quality monitoring site on Barbers Creek
Barbers Creek Water Quality
Water Quality Rating
The water quality ratings for the Barbers Creek catchment is “Fair” (Table 1) as determined by the Canadian Council of Ministers of the Environment (CCME) Water Quality Index CCME and is largely influenced by high nutrient concentrations, metals and high bacterial counts. A "Fair" rating indicates that water quality is usually protected but is occasionally threatened or impaired; conditions sometimes depart from natural or desirable levels. Each parameter is evaluated against established guidelines to determine water quality conditions. Those parameters that frequently exceed guidelines are presented below. Analysis of the data has been broken into two periods; 2003 to 2008 and 2009 to 2014 for the stream monitoring site located on Barbers Creek (BAR-01) to examine if conditions have changed between these periods. Table 1 shows the overall rating for the monitored surface water quality site within the Barbers Creek catchment and Table 2 outlines the Water Quality Index (WQI) scores and their corresponding ratings.
Table 1 Water Quality Ratings for the Barbers Creek catchment
Table 2 WQI ratings and corresponding index scores (RVCA terminology, original WQI category names in brackets)
Nutrients
Total phosphorus (TP) is used as a primary indicator of excessive nutrient loading and may contribute to abundant aquatic vegetation growth and depleted dissolved oxygen levels. The Provincial Water Quality Objective (PWQO) is used as the TP Guideline and states that in streams concentrations greater than 0.030 mg/l indicate an excessive amount of TP.
Total Kjeldahl nitrogen (TKN) and ammonia (NH3) are used as secondary indicators of nutrient loadings. RVCA uses a guideline of 0.500 mg/l to assess TKN[1] and the PWQO of 0.020 mg/l to assess NH3 concentrations in Barbers Creek.
Tables 3, 4 and 5 summarize average nutrient concentrations at monitored sites within the Barbers Creek catchment and show the proportion of results that meet the guidelines.
Table 3 Summary of total phosphorus results for Barbers Creek, 2003-2008 and 2009-2014. Highlighted values indicate average concentrations exceed the guideline
Table 4 Summary of total Kjeldahl nitrogen results for Barbers Creek from 2003-2008 and 2009-2014. Highlighted values indicate average concentrations exceed the guideline
Table 5 Summary of ammonia results for Barbers Creek from 2003-2008 and 2009-2014. Highlighted values indicate average concentrations exceed the guideline
Elevated TP results were a regular occurrence at site BAR-01; 43 percent of samples were below the guideline in the 2003-2008 period (Figure 2); this increased to 49 percent of samples in the 2009-2014 period (Figure 3). The average TP concentration also decreased slightly from 0.064 mg/l (2003- 2008) to 0.052 mg/l (2009-2014).
Figure 2 Total phosphorous concentrations in Barbers Creek, 2003-2008
Figure 3 Total phosphorous concentrations in Barbers Creek, 2009-2014
TKN data show that the majority of results exceeded the guideline (Figures 4 and 5); there were very few samples (4 percent) below the guideline in the 2003-2008 period and this declined to no samples below the guideline in the 2009-2014 period. The average concentration increased from 1.011 mg/l (2003-2008) to 1.127 mg/l (2003-2008) (Table 4).
Figure 4 Total Kjeldahl nitrogen concentrations in Barbers Creek, 2003-2008
Figure 5 Total Kjeldahl nitrogen concentrations in Barbers Creek, 2009-2014
NH3 data also reported regular instances of exceedances and results at this site were generally above the guideline of 0.020 mg/l (Figures 6 and 7); the proportion of samples below the guideline declined slightly from 38 percent to 33 percent. The average concentration in the 2003-2008 monitoring period was 0.068 mg/l, well above the PWQO. In the 2009-2014 period the average concentration declined to 0.018 mg/l which is still slightly above the PWQO (Table 5).
Figure 6 Ammonia concentrations in Barbers Creek, 2003-2008
Figure 7 Ammonia concentrations in Barbers Creek, 2009-2014
Summary
The data shows that nutrient enrichment is a characteristic of Barbers Creek. High nutrient concentrations can help stimulate the growth of algae blooms and other aquatic vegetation in a waterbody and deplete oxygen levels as the vegetation dies off.
E. Coli
E. coli is used as an indicator of bacterial pollution from human or animal waste; in elevated concentrations it can pose a risk to human health. The PWQO of 100 colony forming units/100 milliliters (CFU/100 ml) is used to assess E. coli. Counts greater than this guideline indicate that bacterial contamination may be a problem within the watercourse.
Table 6 summarizes the geometric mean[2] for the monitored site on Barbers Creek and shows the proportion of samples that meet the E. coli guideline of 100 CFU/100 ml. The results of the geometric mean with respect to the guideline for the two periods, 2003-2008 and 2009- 2014, are shown in Figures 8 and 9 respectively.
Table 6 Summary of E. coli results for Otter Creek, 2003-2008 and 2009-2014. Highlighted values indicated average concentrations have exceeded the guideline.
E. coli counts at site BAR-01 indicate an improvement with regard to bacterial contamination. The proportion of samples below the guideline increased from 24 percent (Figure 8) to 41 percent (Figure 9) and the count at the geometric mean decreased from 215 (2003-2008) to 193 (2009-2014) CFU/100ml.
Figure 8 Geometric mean of E.coli counts in Barbers Creek, 2003-2008
Figure 9 Geometric mean of E.coli counts in Barbers Creek, 2009-2014
Summary
This data shows that bacterial contamination is a concern on Barbers Creek. There has been an improvement from the 2003-2008 to the 2009-2014 monitoring period, however the count at the geometric mean is above the PWQO for both monitoring periods. Properly maintaining septic systems, enhancing shoreline buffers and restricting cattle access can help to improve E.coli levels in Barbers Creek.
Metals
Of the metals routinely monitored in Barbers Creek, aluminum (Al), iron (Fe) and copper (Cu) occasionally reported concentrations above their respective PWQOs. In elevated concentrations, these metals can have toxic effects on sensitive aquatic species.
Tables 7, 8 and 9 summarize metal concentrations at site BAR-01 and show the proportion of samples that meet guidelines. Figures 10 to 15 show metal concentrations with respect to the guidelines for the two periods of interest, 2003–2008 and 2009–2014. The guideline metal concentrations as described by the PWQO are 0.75mg/L Al, 0.300mg/L Fe and 0.005mg/L Cu.
Table 7 Summary of Aluminum results for Barbers Creek from 2003-2008 and 2009-2014; highlighted values indicate the average concentration exceeds the guideline
Results from BAR-01 shows that Al concentrations had some exceedances with 63 percent of samples below the guideline in the 2003-2008 period (Figure 10). This improved to 84 percent of samples in the 2009-2014 period (Figure 11). The average concentration of Al was 0.120 mg/l from 2003-2008 which exceeds the guideline. From 2009-2014 the average concentration improved to 0.031 mg/l which is below the guideline.
Figure 10 Aluminum concentrations in Barbers Creek, 2003-2008
Figure 11 Aluminum concentrations in Barbers Creek, 2009-2014
Table 8 Summary of Iron results for Barbers Creek from 2003-2008 and 2009-2014
Concentrations of Fe also exceeded the PWQO guideline at times but were generally lower than Al. The proportion of Fe samples below the guideline increased from 67 percent to 96 percent (Figures 12 and 13). Although there were observed exceedances, the average concentration of Fe did not exceed the guideline in both monitoring periods; 0.280 mg/l in 2003-2008 and .083 mg/l in 2009-2014.
Figure 12 Iron concentrations in Barbers Creek, 2003-2008
 Figure 13
 Iron concentrations in Barbers Creek, 2009-2014
Table 9 Summary of Copper results for Barbers Creek from 2003-2008 and 2009-2014; highlighted values indicate the average concentration exceeds the guideline
Copper concentrations have occasionally exceeded the guidelines. In the 2003-2008 period 93 percent of samples were below the guideline (Figure 14) and declined to 88 percent of samples in the 2009–2014 period (Figure 15). This contributed to an increase in the average concentration from 0.002 mg/l (2003–2008) to 0.009 mg/l (2009–2014).
Figure 14 Copper concentrations in Barbers Creek, 2003-2008
Figure 15 Copper concentrations in Barbers Creek, 2009-2014
Summary
Aluminum and Iron concentrations declined, while Copper concentrations increased slightly between the two periods of interest. Efforts should continue to be made to identify pollution sources and implement best management practices to reduce any inputs such as runoff, metal alloys, fungicides and pesticides to improve overall stream health and lessen downstream impacts.
[1] No Ontario guideline for TKN is presently available; however, waters not influenced by excessive organic inputs typically range from 0.100 to 0.500 mg/l, Environment Canada (1979) Water Quality Sourcebook, A Guide to Water Quality Parameters, Inland Waters Directorate, Water Quality Branch, Ottawa, Canada
[2] A type of mean or average, which indicates the central tendency or typical value of a set of numbers by using the product of their values (as opposed to the arithmetic mean which uses their sum). It is often used to summarize a variable that varies over several orders of magnitude, such as E. coli counts.
3. Barbers Creek Riparian Conditions
Shoreline Buffer Land Cover Evaluation
The riparian or shoreline zone is that special area where the land meets the water. Well-vegetated shorelines are critically important in protecting water quality and creating healthy aquatic habitats, lakes and rivers. Natural shorelines intercept sediments and contaminants that could impact water quality conditions and harm fish habitat in streams. Well established buffers protect the banks against erosion, improve habitat for fish by shading and cooling the water and provide protection for birds and other wildlife that feed and rear young near water. A recommended target (from Environment Canada’s Guideline: How Much Habitat is Enough?) is to maintain a minimum 30 meter wide vegetated buffer along at least 75 percent of the length of both sides of rivers, creeks and streams.
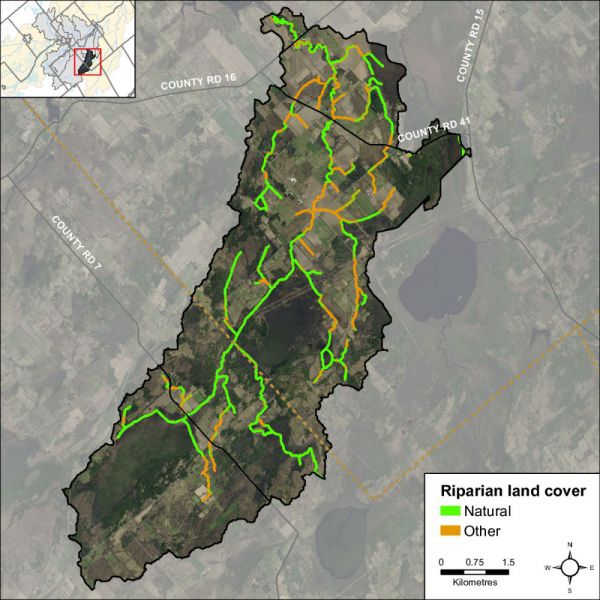
Figure 16 shows the extent of the naturally vegetated riparian zone along a 30 metre strip of the shoreline of Barbers Creek and its tributaries. This information is derived from a dataset developed by the RVCA’s Land Cover Classification Program through heads-up digitization of 20cm DRAPE ortho-imagery at a 1:4000 scale, which details the catchment landscape using 10 land cover classes.
Figure 16 Natural and other riparian land cover in the Barbers Creek catchment
This analysis shows that the riparian buffer in the Barbers Creek catchment is comprised of wetland (46 percent), crop and pastureland (34 percent), woodland (17 percent), roads (two percent) and settlement areas (one percent). Additional statistics for the Barbers Creek catchment are presented in Table 10. Of particular interest is the observed increase in the area of “Crop and Pasture” along the shoreline of Barbers Creek over a six year period.
Table 10 Riparian land cover (2008 vs. 2014) in the Barbers Creek catchment
Barbers Creek Overbank Zone
Riparian Buffer Width Evaluation
Figure 17 demonstrates the buffer conditions of the left and right banks separately. Barbers Creek had a buffer of greater than 30 meters along 77 percent of the right bank and 82 percent of the left bank.
Figure 17 Riparian Buffer Evaluation along Barbers Creek
Adjacent Land Use
The RVCA’s Stream Characterization Program identifies eight different land uses beside Barbers Creek (Figure 18). Surrounding land use is considered from the beginning to end of the survey section (100m) and up to 100m on each side of the creek. Land use outside of this area is not considered for the surveys but is nonetheless part of the subwatershed and will influence the creek. Natural areas made up 62 percent of the stream, characterized by wetlands, forest, scrubland and meadow. The remaining land use consisted of active agriculture, pasture, residential and infrastructure in the form of road crossings.
Figure 18 Land Use along Barbers Creek
Barbers Creek Shoreline Zone
Instream Erosion
Erosion is a normal, important stream process and may not affect actual bank stability; however, excessive erosion and deposition of sediment within a stream can have a detrimental effect on important fish and wildlife habitat. Poor bank stability can greatly contribute to the amount of sediment carried in a waterbody as well as loss of bank vegetation due to bank failure, resulting in trees falling into the stream and the potential to impact instream migration. Figure 19 shows low levels of erosion along Barbers Creek.
Figure 19 Erosion along Barbers Creek
Undercut Stream Banks
Undercut banks are a normal and natural part of stream function and can provide excellent refuge areas for fish. Figure 20 shows that Barbers Creek did not have any undercut banks identified along the system.
Figure 20 Undercut stream banks along Barbers Creek
Stream Shading
Grasses, shrubs and trees all contribute towards shading a stream. Shade is important in moderating stream temperature, contributing to food supply and helping with nutrient reduction within a stream. Figure 21 shows low to moderate levels of stream shading conditions along Barbers Creek.
Figure 21 Stream shading along Barbers Creek
Instream Woody Debris
Figure 22 shows that the majority of Barbers Creek had low to moderate levels of instream woody debris in the form of branches and trees. Instream woody debris is important for fish and benthic invertebrate habitat, by providing refuge and feeding areas.
Figure 22 Instream woody debris along Barbers Creek
Overhanging Trees and Branches
Figure 23 shows low to moderate levels of overhanging branches and trees along Barbers Creek. Overhanging branches and trees provide a food source, nutrients and shade which helps to moderate instream water temperatures.
Figure 23 Overhanging trees and branches along Barbers Creek
Anthropogenic Alterations
Figure 24 shows 95 percent of Barbers Creek remains “unaltered” with no anthropogenic alterations. Five percent of Barbers Creek was classified as natural with minor anthropogenic changes in the form of road crossings.
Figure 24 Anthropogenic alterations along Barbers Creek
Barbers Creek Instream Aquatic Habitat
Benthic Invertebrates
Freshwater benthic invertebrates are animals without backbones that live on the stream bottom and include crustaceans such as crayfish, molluscs and immature forms of aquatic insects. Benthos represent an extremely diverse group of aquatic animals and exhibit wide ranges of responses to stressors such as organic pollutants, sediments and toxicants, which allows scientists to use them as bioindicators. As part of the Ontario Benthic Biomonitoring Network (OBBN), the RVCA has been collecting benthic invertebrates at the Weedmark road site on Barbers Creek since 2003. Monitoring data is analyzed for each sample site and the results are presented using the Family Biotic Index, Family Richness and percent Ephemeroptera, Plecoptera and Trichoptera.
The Hilsenhoff Family Biotic Index (FBI) is an indicator of organic and nutrient pollution and provides an estimate of water quality conditions for each site using established pollution tolerance values for benthic invertebrates. FBI results for Barbers Creek are separated by reporting period 2003 to 2008 and 2009 to 2014. “Very Poor” to “Good” water quality conditions being observed at the Barbers Creek sample location for the period from 2003 to 2014 (Fig.25) using a grading scheme developed by Conservation Authorities in Ontario for benthic invertebrates.
Figure 25 Hilsenhoff Family Biotic Index on Barbers Creek
Family Richness measures the health of the community through its diversity and increases with increasing habitat diversity suitability and healthy water quality conditions. Family Richness is equivalent to the total number of benthic invertebrate families found within a sample. Barbers Creek is reported to have “Fair” to “Good” family richness (Fig.26).
Figure 26 Family Richness in Barbers Creek
Ephemeroptera (Mayflies), Plecoptera (Stoneflies), and Trichoptera (Caddisflies) are species considered to be very sensitive to poor water quality conditions. High abundance of these organisms is generally an indication of good water quality conditions at a sample location. During more recent sampling years the community structure has been shifting to species that are more tolerant to poor water quality conditions. As a result, the EPT indicates that Barbers Creek is reported to have “Poor” to “Fair” water quality (Fig.27) from 2003 to 2014.
Figure 27 EPT in Barbers Creek
Conclusion
Overall Barbers Creek aquatic habitat conditions from a benthic invertebrate perspective range from “Poor” to “Fair” from 2003 to 2014.
Habitat Complexity
Streams are naturally meandering systems and move over time; there are varying degrees of habitat complexity, depending on the creek. Examples of habitat complexity include variable habitat types such as pools and riffles as well as substrate variability and woody debris structure. A high percentage of habitat complexity (heterogeneity) typically increases the biodiversity of aquatic organisms within a system. Only twenty one percent of Barbers Creek was considered heterogeneous, as shown in Figure 28.
Figure 28 Habitat complexity along Barbers Creek
Instream Substrate
Diverse substrate is important for fish and benthic invertebrate habitat because some species have specific substrate requirements and for example will only reproduce on certain types of substrate. Figure 29 shows that 28 percent of the substrate observed on Barbers Creek was dominated by silt. Overall substrate conditions were highly variable along Barbers Creek. Figure 30 shows the dominant substrate type observed for each section surveyed along Barbers Creek.
Figure 29 Instream substrate along Barbers Creek
Figure 30 shows the dominant substrate type along Barbers Creek.
Cobble and Boulder Habitat
Boulders create instream cover and back eddies for large fish to hide and/or rest out of the current. Cobble provides important spawning habitat for certain fish species like walleye and various shiner species who are an important food source for larger fish. Cobble can also provide habitat conditions for benthic invertebrates that are a key food source for many fish and wildlife species. Figure 31 shows where cobble and boulder substrate are found in Barbers Creek.
Figure 31 Instream substrate cobble and boulder along Barbers Creek
Instream Morphology
Pools and riffles are important habitat features for fish. Riffles are areas of agitated water and they contribute higher dissolved oxygen to the stream and act as spawning substrate for some species of fish, such as walleye. Pools provide shelter for fish and can be refuge pools in the summer if water levels drop and water temperature in the creek increases. Pools also provide important over wintering areas for fish. Runs are usually moderately shallow, with unagitated surfaces of water and areas where the thalweg (deepest part of the channel) is in the center of the channel. Figure 32 shows that Barbers Creek is fairly uniform; 93 percent consists of runs, 3 percent riffles and 4 percent pools. Figure 33 shows where riffle habitat was observed along Barbers Creek.
Figure 32 Instream morphology along Barbers Creek
Figure 33 Riffle habitat locations along Barbers Creek
Vegetation Type
Instream vegetation provides a variety of functions and is a critical component of the aquatic ecosystem. For example emergent plants along the shoreline can provide shoreline protection from wave action and important rearing habitat for species of waterfowl. Submerged plants provide habitat for fish to find shelter from predator fish while they feed. Floating plants such as water lilies shade the water and can keep temperatures cool while reducing algae growth. The dominant vegetation type recorded at thirty six percent consisted of algae. Barbers Creek had high levels of diversity for instream vegetation. Figure 34 depicts the plant community structure for Barbers Creek. Figure 35 shows the dominant vegetation type observed for each section surveyed along Barbers Creek.
Figure 34 Vegetation type along Barbers Creek
Figure 35 Dominant vegetation type along Barbers Creek
Instream Vegetation Abundance
Instream vegetation is an important factor for a healthy stream ecosystem. Vegetation helps to remove contaminants from the water, contributes oxygen to the stream, and provides habitat for fish and wildlife. Too much vegetation can also be detrimental. Figure 36 demonstrates that Barbers Creek had common and normal levels of instream vegetation for 50 percent of its length. Low and rare vegetation was measured at 33 percent, while extensive levels were recorded at 17 percent of stream surveys.
Figure 36 Instream vegetation abundance along Barbers Creek
Invasive Species
Invasive species can have major implications on streams and species diversity. Invasive species are one of the largest threats to ecosystems throughout Ontario and can out compete native species, having negative effects on local wildlife, fish and plant populations. One hundred percent of the sections surveyed along Barbers Creek had invasive species (Figure 37). The invasive species observed in Barbers Creek were European frogbit, purple loosestrife, glossy and common buckthorn, poison/wild parsnip and Manitoba maple. Figure 38 shows the frequency of the invasive species observed along Barbers Creek.
Figure 37 Invasive species along Barbers Creek
Figure 38 Invasive species frequency along Barbers Creek
Water Chemistry
During the stream characterization survey, a YSI probe is used to collect water chemistry information. Dissolved oxygen, conductivity and pH are measured at the start and end of each section.
Dissolved Oxygen
Dissolved oxygen is a measure of the amount of oxygen dissolved in water. The Canadian Environmental Quality Guidelines of the Canadian Council of Ministers of the Environment (CCME) suggest that for the protection of aquatic life the lowest acceptable dissolved oxygen concentration should be 6 mg/L for warmwater biota and 9.5 mg/L for coldwater biota (CCME, 1999). Figure 39 shows that the dissolved oxygen in Barbers Creek was within the threshold for warmwater biota in most reaches of the system, however areas in the middle reaches were below the warmwater threshold. The average dissolved oxygen levels observed within the main stem of Barbers Creek was 6. 8 mg/L which is within the recommended levels for warmwater biota.
Figure 39 Dissolved oxygen ranges in Barbers Creek
Conductivity
Conductivity in streams is primarily influenced by the geology of the surrounding environment, but can vary drastically as a function of surface water runoff. Currently there are no CCME guideline standards for stream conductivity; however readings which are outside the normal range observed within the system are often an indication of unmitigated discharge and/or stormwater input. The average conductivity observed within the main stem of Barbers Creek was 311 µs/cm. Figure 40 shows the conductivity readings for Barbers Creek.
Figure 40 Specific conductivity ranges in Barbers Creek
pH
Based on the PWQO for pH, a range of 6.5 to 8.5 should be maintained for the protection of aquatic life. Average pH values for Barbers Creek averaged 7.66 thereby meeting the provincial standard (Figure 41).
Figure 41 pH ranges in Barbers Creek
Thermal Regime
Many factors can influence fluctuations in stream temperature, including springs, tributaries, precipitation runoff, discharge pipes and stream shading from riparian vegetation. Water temperature is used along with the maximum air temperature (using the Stoneman and Jones method) to classify a watercourse as either warm water, cool water or cold water. Figure 42 shows where the thermal sampling sites were located along Barbers Creek. Analysis of the data collected indicates that Barbers Creek is classified as a cool-warm water system with warm water reaches (Figure 43).
Figure 42 Temperature logger locations on Barbers Creek
Figure 43 Temperature logger data for three sites on Barbers Creek
Each point on the graph represents a temperature that meets the following criteria:
- Sampling dates between July 1st and September 7th
- Sampling date is preceded by two consecutive days above 24.5 °C, with no rain
- Water temperatures are collected at 4pm
- Air temperature is recorded as the max temperature for that day
Groundwater
Groundwater discharge areas can influence stream temperature, contribute nutrients, and provide important stream habitat for fish and other biota. During stream surveys, indicators of groundwater discharge are noted when observed. Indicators include: springs/seeps, watercress, iron staining, significant temperature change and rainbow mineral film. Figure 44 shows an area where one or more of the above groundwater indicators were observed during stream surveys and headwater assessments.
Figure 44 Groundwater indicators observed in the Barbers Creek catchment
Headwaters Drainage Features Assessment
The RVCA Stream Characterization program assessed Headwater Drainage Features for the Middle Rideau subwatershed in 2014. This protocol measures zero, first and second order headwater drainage features (HDF). It is a rapid assessment method characterizing the amount of water, sediment transport, and storage capacity within headwater drainage features (HDF). RVCA is working with other Conservation Authorities and the Ministry of Natural Resources and Forestry to implement the protocol with the goal of providing standard datasets to support science development and monitoring of headwater drainage features. An HDF is a depression in the land that conveys surface flow. Additionally, this module provides a means of characterizing the connectivity, form and unique features associated with each HDF (OSAP Protocol, 2013). In 2014 the program sampled 5 sites at road crossings in the Barbers Creek catchment area (Figure 45).

Figure 45 Locations of the headwater sampling sites in the Barbers Creek catchment
Spring photo of a headwater sample site in the Barbers Creek catchment on County Road 7
Summer photo of a headwater sample site in the Barbers Creek catchment on County Road 7
Feature Type
The headwater sampling protocol assesses the feature type in order to understand the function of each feature. The evaluation includes the following classifications: defined natural channel, channelized or constrained, multi-thread, no defined feature, tiled, wetland, swale, roadside ditch and pond outlet. By assessing the values associated with the headwater drainage features in the catchment area we can understand the ecosystem services that they provide to the watershed in the form of hydrology, sediment transport, and aquatic and terrestrial functions. The Barbers Creek catchment is dominated by wetland headwater drainage features. One feature was classified as having been channelized. Figure 46 shows the feature type of the primary feature at the sampling locations.
Figure 46 Headwater feature types in the Barbers Creek catchment
Headwater Feature Flow
The observed flow condition within headwater drainage features can be highly variable depending on timing relative to the spring freshet, recent rainfall, soil moisture, etc. Flow conditions are assessed in the spring and in the summer to determine if features are perennial and flow year round, if they are intermittent and dry up during the summer months or if they are ephemeral systems that do not flow regularly and generally respond to specific rainstorm events or snowmelt. Flow conditions in headwater systems can change from year to year depending on local precipitation patterns. Figure 47 shows the observed flow conditions at the sampling locations in the Barbers Creek catchment.
Figure 47 Headwater feature flow conditions in the Barbers Creek catchment
Feature Channel Modifications
Channel modifications were assessed at each headwater drainage feature sampling location. Modifications include channelization, dredging, hardening and realignments. Three sampling locations for the Barbers Creek catchment area were classified as having no channel modifications and two appeared to have been historically dredged. Figure 48 shows the channel modifications observed at the sampling locations for Barbers Creek.
Figure 48 Headwater feature channel modifications in the Barbers Creek catchment
Headwater Feature Vegetation
Headwater feature vegetation evaluates the type of vegetation that is found within the drainage feature. The type of vegetated within the channel influences the aquatic and terrestrial ecosystem values that the feature provides. For some types of headwater features the vegetation within the feature plays a very important role in flow and sediment movement and provides wildlife habitat. The following classifications are evaluated no vegetation, lawn, wetland, meadow, scrubland and forest. The features assessed in the Barbers Creek catchment were classified as wetland or meadow. Figure 49. Depicts the dominant vegetation observed at the sampled headwater sites in the Barbers Creek catchment.
Figure 49 Headwater feature vegetation types in the Barbers Creek catchment
Headwater Feature Riparian Vegetation
Headwater riparian vegetation evaluates the type of vegetation that is found along the adjacent lands of a headwater drainage feature. The type of vegetation within the riparian corridor influences the aquatic and terrestrial ecosystem values that the feature provides to the watershed. The sample locations in Barbers Creek were dominated by natural vegetation in the form of meadow, scrubland, forest and wetland vegetation. Figure 50. Depicts the type of riparian vegetation observed at the sampled headwater sites in the Barbers Creek catchment.
Figure 50 Headwater feature riparian vegetation types in the Barbers Creek catchment
Headwater Feature Sediment Deposition
Assessing the amount of recent sediment deposited in a channel provides an index of the degree to which the feature could be transporting sediment to downstream reaches (OSAP, 2013). Evidence of excessive sediment deposition might indicate the requirement to follow up with more detailed targeted assessments upstream of the site location to identify potential best management practices to be implemented. Conditions ranged from no deposition observed to moderate deposition recorded. Figure 51. Depicts the degree of sediment deposition observed at the sampled headwater sites in the Barbers Creek catchment.
Figure 51 Headwater feature sediment deposition in the Barbers Creek catchment
Headwater Feature Upstream Roughness
Feature roughness will provide a measure of the amount of materials within the bankfull channel that could slow down the velocity of water flowing within the headwater feature (OSAP, 2013). Materials on the channel bottom that provide roughness include vegetation, woody debris and boulders/cobble substrates. Roughness can provide benefits in mitigating downstream erosion on the headwater drainage feature and the receiving watercourse by reducing velocities. Roughness also provides important habitat conditions to aquatic organisms. The sample locations in the Barbers Creek catchment area were dominated by extreme roughness conditions. Figure 52 shows the feature roughness conditions at the sampling locations in the Barbers Creek catchment.
Figure 52 Headwater feature roughness in the Barbers Creek catchment
Fish Community
The Barbers Creek catchment is classified as a mixed community of warm and cool water recreational and baitfish fishery with 28 species observed. Figure 53 shows the sampling locations along Barbers Creek. Table 11 lists those species observed in the catchment (Source: MNR/RVCA).
Figure 53 Barbers Creek fish community sampling locations
Table 11 Fish species observed in Barbers Creek
RVCA staff sorting fish captured in Barbers Creek into containers by species for identification
Migratory Obstructions
It is important to know locations of migratory obstructions because these can prevent fish from accessing important spawning and rearing habitat. Migratory obstructions can be natural or manmade, and they can be permanent or seasonal. Figure 54 shows that Barbers Creek had one beaver dam at the time of the survey in 2014.
Figure 54 Migratory obstructions along Barbers Creek
Riparian Restoration
Figure 55 depicts the location of a riparian restoration opportunity as a result of observations made during the stream survey and headwater drainage feature assessments. One site was identified on a headwater drainage feature.
Figure 55 Riparian restoration opportunities along Barbers Creek
4. Land Cover
Land cover and any change in coverage that has occurred over a six year period is summarized for the Barbers Creek catchment using spatially continuous vector data representing the catchment during the spring of 2008 and 2014. This dataset was developed by the RVCA through heads-up digitization of 20cm DRAPE ortho-imagery at a 1:4000 scale and details the surrounding landscape using 10 land cover classes.
As shown in Table 12, the dominant land cover type in 2008 and 2014 was crop and pastureland, followed by wetland and woodland.
Table 12 Land cover (2008 vs. 2014) in the Barbers Creek catchment
* Does not include treed swamps ** Includes treed swamps
From 2008 to 2014, there was an overall change of 102 hectares (from one land cover class to another). While a large portion of change for Barbers Creek is a result of the conversion of woodland to crop and pastureland, it also appears that a similar proportion of change is associated with crop and pastureland (i.e., previously cultivated areas/fallow fields) emerging as young woodland (i.e., regenerative and/or plantation) (see Figure 56 for the location of the major changes).
Figure 56 Dominant land cover change in the Barbers Creek catchment (2014)
Table 13 shows the type of land cover change that has taken place between land cover classes/types from 2008 to 2014.
Overall, the net area of woodland change (loss) is small at 13 hectares relative to the remaining area of woodland in the catchment (as of 2014). Similarly, the net area of crop and pastureland change (gain) is also small at eight hectares relative to the remaining area of crop and pastureland in the catchment (as of 2014).
Table 13 Land cover change in the Barbers Creek catchment (2008 to 2014)
Woodland Cover
In the Environment Canada Guideline (Third Edition) entitled “How Much Habitat Is Enough?” (hereafter referred to as the “Guideline”) the opening narrative under the Forest Habitat Guidelines section states that prior to European settlement, forest was the predominant habitat in the Mixedwood Plains ecozone. The remnants of this once vast forest now exist in a fragmented state in many areas (including the Rideau Valley watershed) with woodland patches of various sizes distributed across the settled landscape along with higher levels of forest cover associated with features such as the Frontenac Axis (within the on-Shield areas of the Rideau Lakes and Tay River subwatersheds). The forest legacy, in terms of the many types of wildlife species found, overall species richness, ecological functions provided and ecosystem complexity is still evident in the patches and regional forest matrices (found in the Middle Rideau subwatershed and elsewhere in the Rideau Valley watershed). These ecological features are in addition to other influences which forests have on water quality and stream hydrology including reducing soil erosion, producing oxygen, storing carbon along with many other ecological services that are essential not only for wildlife but for human well-being.
The Guideline also notes that forests provide a great many habitat niches that are in turn occupied by a great diversity of plant and animal species. They provide food, water and shelter for these species - whether they are breeding and resident locally or using forest cover to help them move across the landscape. This diversity of species includes many that are considered to be species at risk. Furthermore, from a wildlife perspective, there is increasing evidence that the total forest cover in a given area is a major predictor of the persistence and size of bird populations, and it is possible or perhaps likely that this pattern extends to other flora and fauna groups. The overall effect of a decrease in forest cover on birds in fragmented landscapes is that certain species disappear and many of the remaining ones become rare, or fail to reproduce, while species adapted to more open and successional habitats, as well as those that are more tolerant to human-induced disturbances in general, are able to persist and in some cases thrive. Species with specialized-habitat requirements are most likely to be adversely affected. The overall pattern of distribution of forest cover, the shape, area and juxtaposition of remaining forest patches and the quality of forest cover also play major roles in determining how valuable forests will be to wildlife and people alike.
The current science generally supports minimum forest habitat requirements between 30 and 50 percent, with some limited evidence that the upper limit may be even higher, depending on the organism/species phenomenon under investigation or land-use/resource management planning regime being considered/used.
As shown in Figure 57, 32 percent of the Barbers Creek catchment contains 1252 hectares of upland forest and 279 hectares of lowland forest (treed swamps) versus the 34 percent of woodland cover in the Middle Rideau subwatershed. This is greater than the 30 percent of forest cover that is identified as the minimum threshold required to sustain forest birds according to the Guideline and which may only support less than one half of potential species richness and marginally healthy aquatic systems. When forest cover drops below 30 percent, forest birds tend to disappear as breeders across the landscape.
Figure 57 Woodland cover and forest interior (2014)
Woodland (Patch) Size
According to the Ministry of Natural Resources’ Natural Heritage Reference Manual (Second Edition), larger woodlands are more likely to contain a greater diversity of plant and animal species and communities than smaller woodlands and have a greater relative importance for mobile animal species such as forest birds.
Bigger forests often provide a different type of habitat. Many forest birds breed far more successfully in larger forests than they do in smaller woodlots and some rely heavily on forest interior conditions. Populations are often healthier in regions with more forest cover and where forest fragments are grouped closely together or connected by corridors of natural habitat. Small forests support small numbers of wildlife. Some species are “area-sensitive” and tend not to inhabit small woodlands, regardless of forest interior conditions. Fragmented habitat also isolates local populations, especially small mammals, amphibians and reptiles with limited mobility. This reduces the healthy mixing of genetic traits that helps populations survive over the long run (Conserving the Forest Interior. Ontario Extension Notes, 2000).
The Environment Canada Guideline also notes that for forest plants that do not disperse broadly or quickly, preservation of some relatively undisturbed large forest patches is needed to sustain them because of their restricted dispersal abilities and specialized habitat requirements and to ensure continued seed or propagation sources for restored or regenerating areas nearby.
The Natural Heritage Reference Manual continues by stating that a larger size also allows woodlands to support more resilient nutrient cycles and food webs and to be big enough to permit different and important successional stages to co-exist. Small, isolated woodlands are more susceptible to the effects of blowdown, drought, disease, insect infestations, and invasions by predators and non-indigenous plants. It is also known that the viability of woodland wildlife depends not only on the characteristics of the woodland in which they reside, but also on the characteristics of the surrounding landscape where the woodland is situated. Additionally, the percentage of forest cover in the surrounding landscape, the presence of ecological barriers such as roads, the ability of various species to cross the matrix surrounding the woodland and the proximity of adjacent habitats interact with woodland size in influencing the species assemblage within a woodland.
In the Barbers Creek catchment (in 2014), forty-one (33 percent) of the 125 woodland patches are very small, being less than one hectare in size. Another 62 (50 percent) of the woodland patches ranging from one to less than 20 hectares in size tend to be dominated by edge-tolerant bird species. The remaining 22 (18 percent of) woodland patches range between 20 and 155 hectares in size. Eighteen of these patches contain woodland between 20 and 100 hectares and may support a few area-sensitive species and some edge intolerant species, but will be dominated by edge tolerant species.
Conversely, four (three percent) of the 125 woodland patches in the drainage area exceed the 100 plus hectare size needed to support most forest dependent, area sensitive birds and are large enough to support approximately 60 percent of edge-intolerant species. No patch tops 200 hectares, which according to the Environment Canada Guideline will support 80 percent of edge-intolerant forest bird species (including most area sensitive species) that prefer interior forest habitat conditions.
Table 14 presents a comparison of woodland patch size in 2008 and 2014 along with any changes that have occurred over that time. A decrease (of 13 ha) has been observed in the overall woodland patch area between the two reporting periods with most change occurring in the 20 to 50 hectare woodland patch size class range.
Table 14 Woodland patches in the Barbers Creek catchment (2008 and 2014)
*Includes treed swamps
Forest Interior
The forest interior is habitat deep within woodlands. It is a sheltered, secluded environment away from the influence of forest edges and open habitats. Some people call it the “core” or the “heart” of a woodland. The presence of forest interior is a good sign of woodland health, and is directly related to the woodland’s size and shape. Large woodlands with round or square outlines have the greatest amount of forest interior. Small, narrow woodlands may have no forest interior conditions at all. Forest interior habitat is a remnant natural environment, reminiscent of the extensive, continuous forests of the past. This increasingly rare forest habitat is now a refuge for certain forest-dependent wildlife; they simply must have it to survive and thrive in a fragmented forest landscape (Conserving the Forest Interior. Ontario Extension Notes, 2000).
The Natural Heritage Reference Manual states that woodland interior habitat is usually defined as habitat more than 100 metres from the edge of the woodland and provides for relative seclusion from outside influences along with a moister, more sheltered and productive forest habitat for certain area sensitive species. Woodlands with interior habitat have centres that are more clearly buffered against the edge effects of agricultural activities or more harmful urban activities than those without.
In the Barbers Creek catchment (in 2014), the 125 woodland patches contain 51 forest interior patches (Figure 58) that occupy five percent (253 ha.) of the catchment land area (which is the same as the five percent of interior forest in the Middle Rideau Subwatershed). This is below the ten percent figure referred to in the Environment Canada Guideline that is considered to be the minimum threshold for supporting edge intolerant bird species and other forest dwelling species in the landscape.
Most patches (43) have less than 10 hectares of interior forest, 22 of which have small areas of interior forest habitat less than one hectare in size. The remaining eight patches contain interior forest ranging between 10 and 34 hectares in area.
Between 2008 and 2014, there has been a notable change in the number of woodland patches containing smaller areas of interior habitat (Table 15). For example, there has been an increase of 13 woodlands containing less than one hectare of interior forest over this period and seven woodlands with one to 10 hectares of interior habitat. This appears to have occurred as a result of the loss of interior forest habitat in the largest woodland patches in the catchment over this period.
Table 15 Woodland Interior in the Barbers Creek catchment (2008 and 2014)
Wetland Cover
Wetlands are habitats forming the interface between aquatic and terrestrial systems. They are among the most productive and biologically diverse habitats on the planet. By the 1980s, according to the Natural Heritage Reference Manual, 68 percent of the original wetlands south of the Precambrian Shield in Ontario had been lost through encroachment, land clearance, drainage and filling.
Wetlands perform a number of important ecological and hydrological functions and provide an array of social and economic benefits that society values. Maintaining wetland cover in a watershed provides many ecological, economic, hydrological and social benefits that are listed in the Reference Manual and which may include:
- contributing to the stabilization of shorelines and to the reduction of erosion damage through the mitigation of water flow and soil binding by plant roots
- mitigating surface water flow by storing water during periods of peak flow (such as spring snowmelt and heavy rainfall events) and releasing water during periods of low flow (this mitigation of water flow also contributes to a reduction of flood damage)
- contributing to an improved water quality through the trapping of sediments, the removal and/or retention of excess nutrients, the immobilization and/or degradation of contaminants and the removal of bacteria
- providing renewable harvesting of timber, fuel wood, fish, wildlife and wild rice
- contributing to a stable, long-term water supply in areas of groundwater recharge and discharge
- providing a high diversity of habitats that support a wide variety of plants and animals
- acting as “carbon sinks” making a significant contribution to carbon storage
- providing opportunities for recreation, education, research and tourism
Historically, the overall wetland coverage within the Great Lakes basin exceeded 10 percent, but there was significant variability among watersheds and jurisdictions, as stated in the Environment Canada Guideline. In the Rideau Valley Watershed, it has been estimated that pre-settlement wetland cover averaged 35 percent using information provided by Ducks Unlimited Canada (2010) versus the 21 percent of wetland cover existing in 2014 derived from DRAPE imagery analysis.
Using the same dataset, it is estimated that pre-settlement (historic) wetland cover averaged 32 percent in the Middle Rideau subwatershed versus the 27 percent of cover existing in 2014. This decline in wetland cover is also evident in the Barbers Creek catchment (as seen in Figure 58) where there has been a four percent decrease in the area of wetland cover from pre-settlement times to the present (as summarized in Table 16).
Figure 58 Catchment wetland cover
While there has been a reported decrease in wetland cover in the Barbers Creek catchment from pre-settlement times, the remaining wetland cover in 2014 remains above the ecological thresholds cited in the Environment Canada Guideline. Nonetheless, in order to maintain critical hydrological, ecological functions along with related recreational and economic benefits provided by these wetland habitats in the catchment, a “no net loss” of currently existing wetlands should be employed to ensure the continued provision of tangible benefits accruing from them for landowners and surrounding communities.
Table 16 Wetland cover in the Middle Rideau subwatershed and Barbers Creek catchment (Historic to 2014)
5. Stewardship and Protection
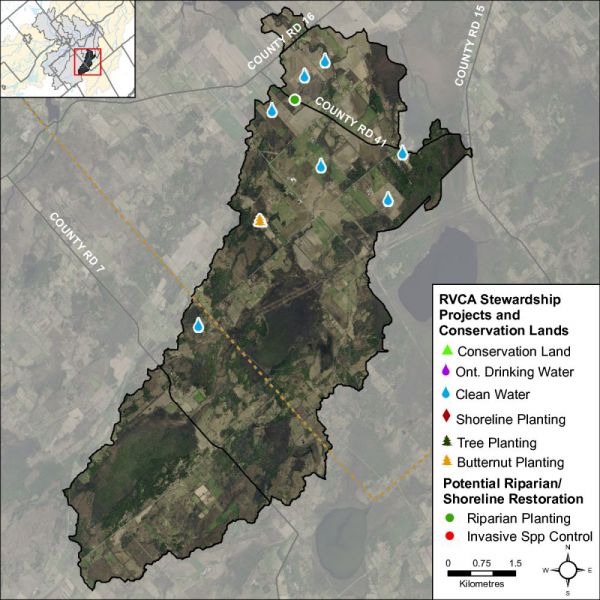
The RVCA and its partners are working to protect and enhance environmental conditions in the Middle Rideau Subwatershed. Figure 59 shows the location of all stewardship projects completed in the Barbers Creek catchment along with sites identified for potential shoreline restoration.
Rural Clean Water Projects
From 2003 to 2008, two well decommissionings and one well replacement were completed. Prior to 2003, two manure storage facilities, two livestock fencing projects and one milkhouse washwater treatment facility were completed. No projects were undertaken between 2009 and 2014. Total value of all eight projects is $119,772 with $51,500 of that amount funded through grant dollars from the RVCA.
Figure 59 Stewardship and restoration locations
Tree Planting Projects
Through the RVCA Butternut Recovery Program, 40 butternut trees were planted in the Barbers Creek catchment between 2009 and 2014, as part of efforts to introduce healthy seedlings from tolerant butternuts into various locations across Eastern Ontario.
Valley, Stream, Wetland and Hazard Land Regulation
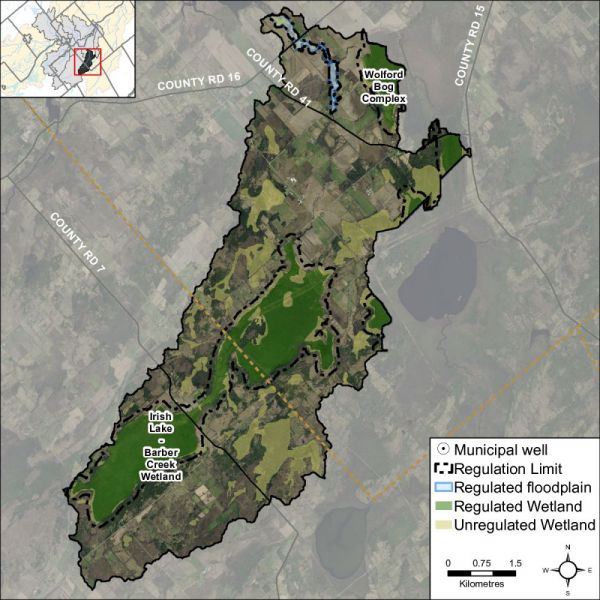
The Barbers Creek catchment covers 48 square kilometres with 13 square kilometres (or 27 percent) of the drainage area being within the regulation limit of Ontario Regulation 174/06 (Figure 60), giving protection to wetland areas and river or stream valleys that are affected by flooding and erosion hazards.
Wetlands occupy 13.7 sq. km. (or 29 percent) of the catchment. Of these wetlands, 7.7 sq. km (or 56 percent) are designated as provincially significant and included within the RVCA regulation limit. This leaves the remaining 6.0 sq. km (or 44 percent) of wetlands in the catchment outside the regulated area limit.
Of the 60.9 kilometres of stream in the catchment, regulation limit mapping has been plotted along 23.5 kilometers of streams (representing 39 percent of all streams in the catchment). Some of these regulated watercourses (13.8 km or 23 percent of all streams) flow through regulated wetlands; the remaining 9.7 km (or 41 percent) of regulated streams are located outside of those wetlands. Plotting of the regulation limit on the remaining 37.5 km (or 61 percent) of streams requires identification of flood and erosion hazards and valley systems.
Within the regulation limit, “development” and “site alteration” require RVCA permission. The “alteration to waterways” provision of Ontario Regulation 174/06 applies to all watercourses.
Figure 60 RVCA regulation limits
Vulnerable Drinking Water Areas
The Barbers Creek drainage catchment is considered to have a Highly Vulnerable Aquifer. This means that the nature of the overburden (thin soils, fractured bedrock) does not provide a high level of protection for the underlying groundwater making the aquifer more vulnerable to contaminants released on the surface. The Mississippi-Rideau Source Protection Plan includes policies that focus on the protection of groundwater region-wide due to the fact that most of the region, which encompasses the Mississippi and Rideau watersheds, is considered Highly Vulnerable Aquifer. For detailed maps and policies that have been developed to protect drinking water sources, please go to the Mississippi-Rideau Source Protection Region website at www.mrsourcewater.ca to view the Mississippi-Rideau Source Protection Plan.
6. Challenges/Issues
Water Quality
-
Surface water quality rating in Barbers Creek is “Fair” over two reporting periods (2003-2008 and 2009-2014) as determined by surface water chemistry data. Frequent exceedances of nutrients and E.coli as well as occasional exceedances of aluminum, copper and iron contributed to the rating
-
Instream biological water quality conditions at the Barbers Creek sample location range from “Very Poor” to “Good” from 2003 to 2014 (using a grading scheme developed by Ontario Conservation Authorities in Ontario for benthic invertebrates) with an overall benthic invertebrate water quality rating of “Poor” to “Good” determined for this period
Shorelines/Headwaters
-
The riparian buffer along Barbers Creek (30 m. wide strip along the shoreline of all lakes and streams) is comprised of wetland (46 percent), crop and pastureland (34 percent), woodland (17 percent), roads (two percent) and settlement areas (one percent) and (at 63 percent) is below the recommended target to maintain a minimum 30 metre wide, naturally vegetated buffer along at least 75 percent of the length of both sides of rivers, creeks and streams
-
Altered instream and riparian conditions exist along Barbers Creek and its tributaries
-
Emerald ash borer poses a significant threat to the ecology of the subwatershed, given the prominence of ash trees along shorelines and in riparian and wetland areas. Many tree stands are predominantly ash and with their anticipated loss, it is unclear what will replace them and the overall effect of their collective demise on the physical and natural functions/values they provide for erosion, water quality and fish and wildlife habitat protection
Land Cover
- The catchment contains 602 ha of unevaluated wetland (occupying 13 percent of its total area) that provides many important social, hydrological, biological and ecological functions/services. Although not under imminent threat from development activity, they do remain vulnerable to drainage and land clearing activities in the absence of any regulatory and planning controls that would otherwise protect them
7. Opportunities/Actions
Water Quality
- Investigate the source of possible pollutants along Barbers Creek and its tributaries and consider implementing measures to reduce nutrient and bacterial loadings
- Implement agricultural best management practices to address the elevated nutrient concentrations, high bacterial counts and occasional metal exceedances on Barbers Creek by restricting livestock access to the creek, limiting the use of fertilizers and pesticide applications and improving or maintaining a shoreline buffer
- Continue to protect Barbers Creek and its tributaries through implementation of municipal and agency land use planning and development policies and practices
- Continue to offer the suite of water quality improvement projects provided by the Rideau Valley Rural Clean Water Program to landowners
Shorelines/Headwaters
- Continue to promote the Rideau Valley Shoreline Naturalization and Tree Planting Programs to landowners
- RVCA and its partners (Township of Elizabethtown-Kitley, Village of Merrickville-Wolford) are to continue educating landowners about the value and importance of headwater drainage features, natural shorelines and waterfront property best management practices with respect to shoreline use and development, septic system installation and maintenance and shoreline vegetation retention and enhancement
- Protect the riparian buffer along the shoreline of Barbers Creek and other catchment streams (headwaters) during the development approvals process through adherence to and enforcement of municipal land-use policies and zoning standards
- Target shoreline restoration at sites identified in this report (shown as “Other riparian land cover” in Figure 16 and “Potential Riparian/Shoreline Restoration” in Figure 55) and explore other restoration and enhancement opportunities along Barbers Creek and its tributaries
Development
- Collectively work with approval authorities (Township of Elizabethtown-Kitley, Village of Merrickville-Wolford, Conservation Authority) to consistently implement current land use planning and development policies for water quality and shoreline protection adjacent to Barbers Creek and other catchment streams (e.g., a minimum 30 metre development setback from water
- Explore ways and means to more effectively enforce and implement conditions of land-use planning and development approval to achieve net environmental gains (particularly with respect to rehabilitating or protecting naturally vegetated shorelines and water quality)
- Municipalities and agencies are encouraged to strengthen natural heritage and water resources official plan policies and zoning provisions (water setbacks, frontage and naturalized shorelines and wetland protection) where deemed appropriate
- Utilize RVCA subwatershed and catchment reports to help develop/revise official plan policies to protect surface water resources and the natural environment (including woodlands, wetlands and shoreline cover)
- Consider establishing RVCA regulations limits to protect additional wetlands
Full Catchment Report


")
")