The RVCA produces individual reports on the Rideau watershed’s catchments. These catchment reports are a compilation of data collected through the RVCA’s watershed monitoring and land cover classification programs.
In the Tay River Subwatershed (locally known as the Tay Watershed), 13 Catchment Reports are produced and presented below in two versions: a Full Catchment Report and a Summary Catchment Report.
Figure 1 Land cover in the Blueberry Creek catchment
The RVCA produces individual reports for 14 catchments in the Tay River subwatershed. Using data collected and analyzed by the RVCA through its watershed monitoring and land cover classification programs, surface water quality and in-stream conditions are reported for the Tay River, Tay Watershed lakes and Tay tributaries along with a summary of environmental conditions for the surrounding countryside every six years, which includes analysis of data collected through the programs along with local information provided by stakeholders up to 2017.
This information is used to better understand the effects of human activity on our water resources, allows us to better track environmental change over time and helps focus watershed management actions where they are needed the most to help sustain the ecosystem services (cultural, aesthetic and recreational values; provisioning of food, fuel and clean water; regulation of erosion/natural hazard protection and water purification; supporting nutrient/water cycling and habitat provision) provided by the catchment’s lands and forests and waters (Millennium Ecosystem Assessment 2005).
The following sections of this report are a compilation of that work for the Blueberry Creek catchment.
Table of Contents: Blueberry Creek Catchment Report
39.1 square kilometres; occupies 4.9 percent of the Tay River subwatershed; 0.9 percent of the Rideau Valley watershed.
Geology/Physiography
The Blueberry Creek catchment resides within a transitionary area between the physiographic regions known as the Algonquin Highlands and the Smith Falls Limestone Plain. The northern half of the catchment lies within the limestone plain, which is a broad flat poorly drained region underlain by thin soils, dolostone and sandstone. The southern part of the catchment lies within the ancient highlands of the Algonquin mass, a geologic region made up of such Precambrian rocks as marble, conglomerates, and dark or colour banded granite-like rocks. A veneer of glacial drift (glacial till, sand etc.) overlies the bedrock. Two geologic faults may cut through this catchment.
Municipal Coverage
Drummond/North Elmsley Township (21.6 km2; 55.5% of catchment)
Tay Valley Township (16.3 km2; 41.9% of catchment)
Town of Perth (1.0 km2; 2.6% of catchment)
Stream Length
All watercourses (including headwater streams): 45.9 km.
1.2 Vulnerable Areas
Aquifer Vulnerability
The Mississippi-Rideau Source Water Protection program has mapped the central part of this catchment as a Significant Groundwater Recharge Area and all of the catchment as a Highly Vulnerable Aquifer. There are no Well-Head Protection Areas in the catchment.
Wetland Hydrology
A watershed model developed by the RVCA in 2009 was used to study the hydrologic function of wetlands in the Rideau Valley Watershed, including those found in the Blueberry Creek catchment.
1.3 Conditions at a Glance
Aggregates
Three aggregate licenses in the Blueberry Creek catchment along with some sand and gravel areas of secondary and tertiary significance.
Fish Community/Thermal Regime
Warm and cool water recreational and baitfish fishery with 14 species observed in Blueberry Creek during 2017.
Headwater Drainage Features
Classified as wetlands and natural features with minimal modifications.
Instream/Riparian Habitat
Blueberry Creek: Low to high habitat complexity along the surveyed sections of the creek. Areas with increased habitat complexity are observed in the lower and middle reaches of the system within the catchment along with a healthy diversity and abundance of plant types. Dissolved oxygen conditions vary from areas below levels required to support aquatic biota to areas that support warmwater fish species.
Land Cover Change (2008 to 2014)
Catchment
Crop-Pasture
Woodland
Meadow-Thicket
Wetland
Transportation
Aggregate
Settlement
Hectares
-6
-6
-2
+1
+1
+3
+9
Land Cover Type (2014)
Catchment
Wetland
Crop-Pasture
Woodland
Settlement
Transportation
Meadow-Thicket
Percent
40
34
18
5
2
1
Shoreline Cover Type (30 m. riparian area; 2014)
Catchment
Percent
Blueberry Creek
Percent
Streams*
Percent
Wetland
55
Wetland
82
Wetland
47
Woodland
19
Woodland
6
Crop-Pasture
25
Crop-Pasture
19
Settlement
6
Woodland
24
Settlement
4
Crop-Pasture
3
Settlement
3
Transportation
2
Transportation
2
Transportation
1
Meadow-Thicket
<1
Meadow-Thicket
<1
---
---
*Excludes Blueberry Creek
Significant Natural Features
Blueberry Marsh Provincially Significant Wetland
Species at Risk (Elemental Occurrence)
Status
Species at Risk
Threatened
Blanding's Turtle
Eastern Meadowlark
Special Concern
Eastern Musk Turtle
---
Water Quality for the Protection of Aquatic Life
Water Quality Source
Blueberry Creek
Surface Chemistry
Fair to Good
Instream Biological
Poor to Fair
Blueberry Creek: Benthic invertebrate samples are dominated with species that are moderately tolerant and tolerant to high organic pollution levels.
Water Wells
Approximately 350 operational private water wells in the Blueberry Creek catchment. Groundwater uses are mainly domestic, but also include commercial, livestock, public and municipal water supplies and monitoring wells.
Wetland Cover
Wetlands are reported to have covered 65 percent of the Blueberry Creek catchment prior to European settlement, as compared to 39 percent (or 15.6 square kilometres) of the area in 2014. This represents a 38 percent (or 9.7 square kilometre) loss of historic wetland cover. Eighty-five percent of the remaining wetlands are regulated leaving 15 percent (or 2.4 square kilometers) unregulated.
1.4 Catchment Care
Environmental Management
Development along Blueberry Creek and in, and adjacent to, the Blueberry Marsh Provincially Significant Wetland in the catchment is subject to Ontario Regulation 174-06 (entitled “Development, Interference with Wetlands and Alterations to Shorelines and Watercourses”) that protects landowners and their property from natural hazards (i.e., flooding, fluctuating water table, unstable soils) along with the hydrologic function of the wetland.
Several Environmental Compliance Approvals and Environmental Activity and Sector Registries were sought and one Permit To Take Water (PTTW) is active in the catchment for aggregate operations.
Environmental Monitoring
Chemical surface (in-stream/lake) water quality collection by the RVCA since 2012 (see Section 2 of this report).
Benthic invertebrate (aquatic insect) surface (in-stream) water quality collection by the RVCA in Blueberry Creek since 2011 (see Section 3.3.1 of this report).
Fish survey and stream characterization survey by the RVCA on Blueberry Creek in 2016 included taking measurements and recording observations on instream habitat, bank stability, other attributes and preparing a temperature profile (see Section 3 of this report).
Eleven drainage feature assessments were conducted by the RVCA in 2017 at road crossings in the catchment. The protocol measures zero, first and second order headwater drainage features and is a rapid assessment method characterizing the amount of water, sediment transport, and storage capacity within headwater drainage features (see Section 3.4 of this report).
Classification of Blueberry Creek catchment land cover types derived by the RVCA from colour aerial photography that was acquired during the spring of 2008 and 2014 (see Section 4.1 of this report).
Groundwater chemistry information is available from the Ontario Geological Survey for one well (#13-AG-021) located in the Blueberry Creek catchment.
Stewardship
Twenty-one stewardship projects were completed by landowners with assistance from the RVCA (see Section 5 of this report).
2.0 Blueberry Creek Catchment: Surface Water Quality Conditions
Surface water quality conditions in the Blueberry Creek catchment are monitored by the Rideau Valley Conservation Authority's Baseline Water Quality Monitoring Program. This program provides information on the condition of tributaries and the Tay River within the Tay River watershed. Data is collected for multiple parameters including nutrients (total phosphorus and total Kjeldahl nitrogen ), E. coli, metals (like aluminum and copper) and additional chemical/physical parameters (such as alkalinity, chlorides, pH and total suspended solids). The locations of monitoring sites are shown in Figure 2 and Table 1.
Figure 2 Water quality monitoring site on Blueberry Creek in the Blueberry Creek Catchment
2.1 Blueberry Creek: Water Quality Rating
There is one monitored water quality site on Blueberry Creek in the Blueberry Creek Catchment (BLU-01), the RVCA's water quality rating for this site ranges from “Fair” to “Good”, this is based on the range of ratings calculated at three year intervals from 2012-2017 (Table 1) as determined by the Canadian Council of Ministers of the Environment (CCME) Water Quality Index. The WQI and corresponding ratings are presented in Table 2. A “Fair” rating indicates that water quality is usually protected but is occasionally threatened or impaired; conditions sometimes depart from natural or desirable levels. While “Good” indicates water quality is protected with only a minor degree of threat or impairment; conditions rarely depart from natural or desirable levels. Each parameter is evaluated against established guidelines to determine water quality conditions. Those parameters that frequently exceed guidelines are presented below. The data has been examined through the period of record to determine if conditions have changed.
The scores at this site are largely influenced by frequent high nutrient concentrations and occasional metal exceedances. For more information on the WQI please see the Tay River Subwatershed Report.
Table 1 Water Quality Index ratings for the Blueberry Creek Catchment
Location
Period
WQI Score
Rating
BLU-01
Blueberry Creek at County Rd 6.
2012-2014
77
Fair
BLU-01
Blueberry Creek at County Rd 6.
2015-2017
80
Good
Table 2 Water Quality Index ratings and corresponding index scores (RVCA terminology, original WQI category names in brackets)
Rating
Index Score
Very Good (Excellent)
95-100
Good
80-94
Fair
65-79
Poor (Marginal)
45-64
Very Poor (Poor)
0-44
2.1.2 Blueberry Creek: Nutrients
Total phosphorus (TP) is used as a primary indicator of excessive nutrient loading and may contribute to abundant aquatic vegetation growth and depleted dissolved oxygen levels. The Provincial Water Quality Objective (PWQO) is used as the TP Guideline and states that in streams concentrations greater than 0.030 mg/l indicate an excessive amount of TP.
Total Kjeldahl nitrogen (TKN) is used as a secondary indicator of nutrient loading. RVCA uses a guideline of 0.500 mg/l to assess TKN[1].
Tables 3 and 4 summarize average nutrient concentrations at the monitored site within the Blueberry Creek catchment and show the proportion of results that meet the guidelines.
Table 3 Summary of total phosphorus results for the Blueberry Creek Catchment, 2012-2017
Total Phosphorus 2012-2017
Site
Average (mg/l)
Below Guideline
No. Samples
BLU-01
0.029
61%
28
Table 4 Summary of total Kjeldahl nitrogen results for the Blueberry Creek Catchment, 2012-2017 (Highlighted values indicate average concentrations exceed the guideline)
Total Kjeldahl Nitrogen 2012-2017
Site
Average (mg/l)
Below Guideline
No. Samples
BLU-01
0.936
3%
28
Monitoring Site BLU-01
Elevated TP results occurred occasionally at site BLU-01 throughout the monitoring period; about 61% of samples were below the guideline (Figure 4) though average concentrations generally exceed the guidelines during the summer months (Figure 3). The average TP concentration was just below the guideline of 0.030 mg/l at 0.029 mg/l (Table 3).
The majority of TKN results have exceeded the guideline (Figure 5), with only three percent of samples below the guideline. The average concentration was 0.936 mg/l and exceeded the guideline of 0.500 mg/l (Table 4).
There was no significant change[2] in the sampled concentrations of TP or TKN in Blueberry creek over the 2012-2017 period (Figure 4 and 6).
Figure 3 Average monthly total phosphorus concentrations in Blueberry Creek, 2012-2017.
Figure 4 Distribution of total phosphorus concentrations in Blueberry Creek, 2012-2017.
Figure 5 Average monthly total Kjeldahl nitrogen concentrations in Blueberry Creek, 2012-2017.
Figure 6 Distribution of total Kjeldahl nitrogen concentrations in Blueberry Creek, 2012-2017
Summary of Blueberry Creek Nutrients
This portion of Blueberry Creek can be identified as nutrient enriched. Overall, average nutrient concentrations have remained consistent through the monitoring period. Both parameters (total phosphorus, total Kjeldahl nitrogen and ammonia) have concentrations that exceed their respective guidelines and average concentrations are approaching or exceed guidelines. Elevated nutrients may result in nutrient loading downstream to the Tay River. High nutrient concentrations can help stimulate the growth of algae blooms and other aquatic vegetation in a waterbody and deplete oxygen levels as the vegetation dies off. It should be noted that this creek is fed by the extensive Blueberry Marsh; this wetland complex is naturally nutrient rich and is likely the largest contributor to elevated nutrient conditions. Best management practices such as minimizing storm water runoff, enhanced shoreline buffers, minimizing/discontinuing the use of fertilizers and restricting livestock access in both surrounding agricultural and developed areas can help to reduce additional nutrient enrichment both within this creek, as well as the Tay River.
2.1.3 Blueberry Creek: E. coli
Escherichia coli (E. coli) is used as an indicator of bacterial pollution from human or animal waste; in elevated concentrations it can pose a risk to human health. The PWQO of 100 colony forming units/100 millilitres (CFU/100 ml) is used as a guideline. E. coli counts greater than this guideline indicate that bacterial contamination may be a problem within a waterbody.
Table 5 summarizes the geometric mean[3] for the monitored site on Blueberry Creek and shows the proportion of samples that meet the E. coli guideline of 100 CFU/100 ml. The results of the geometric mean with respect to the guideline for the 2012-2017 period are shown in Figures 7 and 8.
Table 5 Summary of E. coli results for Blueberry Creek, 2012-2017
E. coli 2012-2017
Site
Geometric Mean (CFU/100ml)
Below Guideline
No. Samples
BLU-01
65
68%
28
Monitoring Site BLU-01
E. coli counts at site BLU-01 show that there has been no significant trend in bacterial counts (Figure 8). The count at the geometric mean was 65 (Table 5), and majority of results (68 percent) were below the E. coli guideline. Figure 7 shows that periods of elevated counts have occurred; this is observed during the summer months and may be attributed to warm weather and low flow conditions.
Figure 7 Geometric mean of monthly E. coli counts in Blueberry Creek, 2012-2017
Figure 8 Distribution of E. coli counts in Blueberry Creek, 2012-2017
Summary of Blueberry Creek Bacterial Contamination
Bacterial contamination does not appear to be a significant concern in this reach of the Blueberry Creek. As indicated by Figure 8 occasional exceedances above the guideline of 100 CFU/100ml have been observed. Best management practices such as enhancing shoreline buffers, limiting livestock access and minimizing runoff in both rural and developed areas can help to protect this reach of the Blueberry Creek into the future.
2.1.4 Blueberry Creek: Metals
Of the metals routinely monitored in Blueberry Creek (Blueberry Creek Catchment) aluminum (Al) occasionally reported concentrations above its respective Provincial Water Quality Objective, which is 0.075 mg/l. In elevated concentrations, these metals can have toxic effects on sensitive aquatic species.
Table 6 summarizes Al concentrations at site BLU-01 as well as show the proportion of samples that meet guidelines. Figures 9 and 10 show metal concentrations with respect to the guidelines for the monitoring period, 2012-2017.
Table 6 Summary of aluminum results in Blueberry Creek from 2012-2017.
Aluminum 2012-2017
Site
Average (mg/l)
Below Guideline
No. Samples
BLU-01
0.069
50%
10
Monitoring Site BLU-01
The average Al concentrations in site BLU-01 was 0.069 mg/l and did not exceed the guideline (PWQO). Fifty percent of samples were below the guideline and there was no significant change in Al concentrations across the monitoring period (Table 6, Figure 10). Please note that metal concentrations are only monitored at this site twice per year, once during high flows in April and the second during the low flow period in August. The elevated concentrations in August may be a result of groundwater contributions, leaching from stream sediments, or concentrated conditions during periods of minimal stream flow.
Figure 9 Average monthly aluminum concentrations in Blueberry Creek, 2012-2017.
Figure 10 Distribution of aluminum concentrations in Blueberry Creek, 2012-2017.
Summary of Blueberry Creek Metals
In the Blueberry Creek Catchment there is little evidence of increased metal concentration above respectve guidelines. Continued efforts should be made to protect against possible pollution sources and implement best management practices to reduce any inputs such as storm water runoff from hardened surfaces to improve overall stream health and lessen downstream impacts to the Tay River.
1 No Ontario guideline for TKN is presently available; however, waters not influenced by excessive organic inputs typically range from 0.100 to 0.500 mg/l, Environment Canada (1979) Water Quality Sourcebook, A Guide to Water Quality Parameters, Inland Waters Directorate, Water Quality Branch, Ottawa, Canada.
2 The evaulations of temporal trends or significant change over time in the data set was preformed using the Mann Kendall trend test and Sens slope estimator, a confidence levels of p<0.05 was used to determine if trends were significant.
3 A type of mean or average, which indicates the central tendency or typical value of a set of numbers by using the product of their values (as opposed to the arithmetic mean which uses their sum). It is often used to summarize a variable that varies over several orders of magnitude, such as E. coli counts.
3.0 Blueberry Creek Catchment: Riparian Conditions
The Stream Characterization Program evaluated 1.5 km of Blueberry Creek in 2016. A total of 15 stream survey assessments were completed in the second week of July.
During the summer and fall of 2016, the Rideau Valley watershed experienced periods of severe drought. Precipitation levels were measured at less than 40% of the long-term average, as the water supply was unable to meet local demand. The lack of rainfall affected the success and function of farm crops, municipal and private wells, lawns and gardens, navigation and ultimately the health of our lakes, rivers and streams.
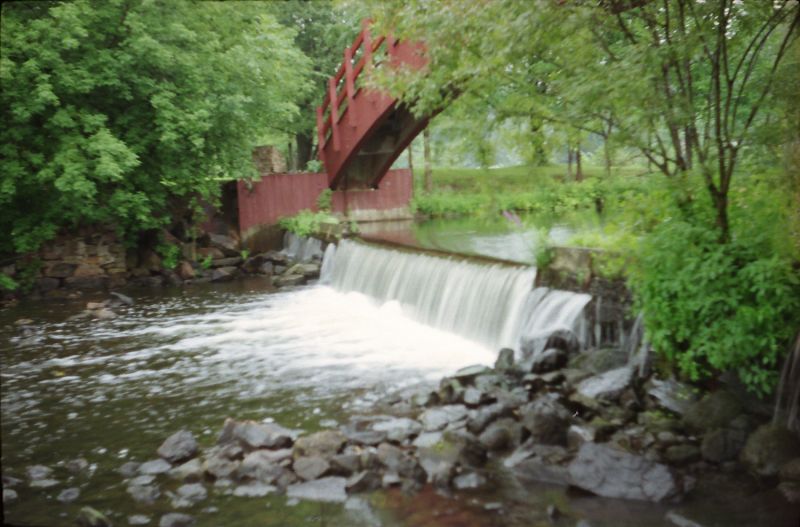
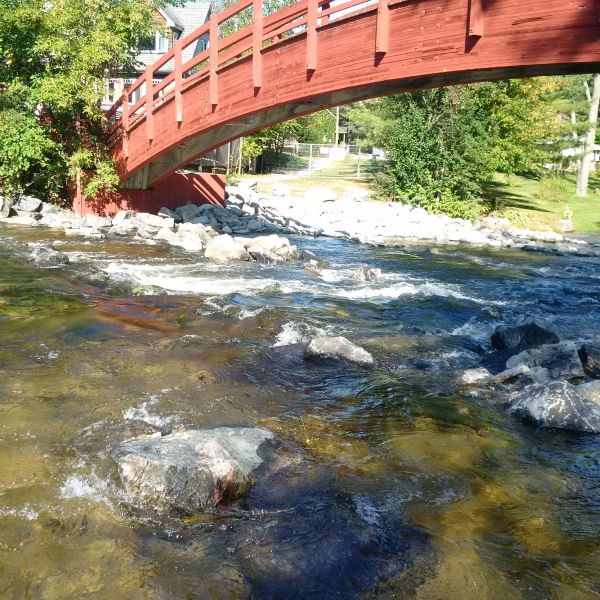
Low water conditions were readily observed throughout the watershed, as many of the streams were highly fragmented or completely dry. Aquatic species such as amphibians, fish and macroinvertebrates were affected, as suitable habitat may have been limited. Fragmentation of habitat was observed along Blueberry Creek (see photos below).
Private crossing upstream of Hwy. 7 showing the effect of the 2016 drought on Blueberry Creek
Private crossing immediately upstream of Hwy. 7 showing the effect of the 2016 drought on Blueberry Creek
3.1 Blueberry Creek Overbank Zone
3.1.1 Riparian Buffer Evaluation
The quality of the riparian area increases with the width, complexity and linear extent of its vegetation along a stream or creek. A complex riparian community consists of diverse plant species native to the site, with multiple age-classes providing vertical structural diversity along a watercourse.
Here is a list of watershed benefits from a healthy riparian buffer zone:
Reduces the amount of pollutants that reach the stream from surface runoff
Helps reduce and mitigates erosion
Provides a microclimate that is cooler during the summer months providing cooler water for aquatic organisms
Provides large wood structure from fallen trees and limbs that form instream cover, create pools, stabilize the streambed, and provide habitat for aquatic organisms
Provides organic material for stream biota that, among other functions, is the base of the food chain in lower order streams
Provides habitat for terrestrial insects that drop in the stream and become food for fish and travel corridors for other terrestrial animals
Dissipates energy during flood events
Often provides the only refuge areas for fish during out-of-bank flows (behind trees, stumps, and logs
Figure 11 demonstrates the buffer conditions of the left and right banks separately. Blueberry Creek had a buffer of greater than 30 meters along 91 percent of the right bank and 93 percent of the left bank.
Figure 11 Riparian Buffer Evaluation along Blueberry Creek
3.1.2 Riparian Buffer Alterations
Alterations within the riparian buffer were assessed within three distinct shoreline zones (0-5m, 5-15m, 15-30m), and evaluated based on the dominant vegetative community and/or land cover type (Figure 12). The riparian buffer zone along Blueberry Creek was found to be dominated by natural conditions in the form of forests and wetlands.
Figure 12 Riparian buffer alterations along Blueberry Creek
3.1.3 Adjacent Land Use
The RVCA’s Stream Characterization Program identifies seven different land uses along Blueberry Creek (Figure 13). Surrounding land use is considered from the beginning to end of the survey section (100m) and up to 100m on each side of the creek. Land use outside of this area is not considered for the surveys but is nonetheless part of the subwatershed and will influence the creek. Natural areas were dominant along Blueberry creek and were characterized by forest, scrubland, meadow and wetland. Forested habitat was dominant in the adjacent lands along Blueberry Creek at 73 percent of the surveyed sections. The remaining land use consisted of recreational, residential and infrastructure in the form of railway and road crossings.
Figure 13 Land Use along Blueberry Creek
3.2 Blueberry Creek Shoreline Zone
3.2.1 Instream Erosion
Stream erosion is the process by which water erodes and transports sediments, resulting in dynamic flows and diverse habitat conditions. Excessive erosion can result in drastic environmental changes, as habitat conditions, water quality and aquatic life are all negatively affected. Bank stability was assessed as the overall extent of each section with “unstable” shoreline conditions. These conditions are defined by the presence of significant exposed soils/roots, minimal bank vegetation, severe undercutting, slumping or scour and potential failed erosion measures. The majority of Blueberry Creek had low to moderate levels of erosion with the exception of one location along the system which had high levels of erosion in the upper reaches of the survey (Figure 14).
Figure 14 Erosion levels along Blueberry Creek
3.2.2 Undercut Stream Banks
Stream bank undercuts can provide excellent cover habitat for aquatic life, however excessive levels can be an indication of unstable shoreline conditions. Bank undercut was assessed as the overall extent of each surveyed section with overhanging bank cover present. Figure 15 shows that Blueberry Creek had highly variable levels of undercut banks along the system and they typically coincided with areas that were experiencing high levels of erosion.
Figure 15 Undercut stream banks along Blueberry Creek
3.2.3 Stream Shading
Grasses, shrubs and trees all contribute towards shading a stream. Shade is important in moderating stream temperature, contributing to food supply and helping with nutrient reduction within a stream. Stream cover is assessed as the total coverage area in each section that is shaded by overhanging shrubs/grasses and tree canopy, at greater than 1m above the water surface. Figure 16 shows low levels of stream shading along Blueberry Creek.
Figure 16 Stream shading along Blueberry Creek
3.2.4 Instream Wood Structure
Forested shorelines provide essential complex habitat through the perpetual process of shoreline trees falling into the water. This continuous recruitment of trees creates a wood-based physical structure in the littoral zone that is common on natural systems. Insects, fish, amphibians, birds, and other animals have also evolved with this abundance of near shore wood and it is essential to their life cycles. With increased development along many waterways, forested shorelines have been altered and wood-based physical structure in many waterways has been reduced. It is important to maintain and restore this essential habitat to aquatic ecosystems.
Shoreline Protection
Protects shorelines by providing a barrier from wind and wave erosion
Reduces sedimentation of the water caused by shoreline slumping due to bank erosion
Allows detritus to collect and settle on the lake or creek bed providing the substrate structure required for native aquatic vegetation to establish and outcompete invasive species
Food Source
Wood complexes are an important food source for invertebrates
Small fish feed on the abundance of invertebrates that are found around these structures
Larger fish, waterfowl and shorebirds all benefit from the abundance of invertebrates and small fish feeding around wood structures in the littoral zone
Cover
Cover from predators is essential for many fish and animals to successfully complete their life cycle
The nooks and crannies of wood complexes offer organisms safety from predators while at the same time concentrating prey to make predators more efficient
Wood provides the structure on which many species must lay or attach their eggs, therefore these complexes provide spawning, nesting and rearing habitat
Diversity
Wood complexes in the littoral zone provide unique edge habitat along the shoreline
Edge habitats contain more species diversity and higher concentrations of species than the adjoining habitats
Figure 17 shows that the majority of Blueberry Creek had low levels of instream wood structure in the form of branches and trees along the system.
Figure 17 Instream wood structure along Blueberry Creek
3.2.5 Overhanging Wood Structure
Trees and branches that are less than one meter from the surface of the water are defined as overhanging. Overhanging wood structure provides a food source, nutrients and shade which helps to moderate instream water temperatures. Figure 18 shows the system ranges from low to moderate levels of overhanging wood structure along Blueberry Creek.
Figure 18 Overhanging trees and branches along Blueberry Creek
3.2.6 Anthropogenic Alterations
Stream alterations are classified based on specific functional criteria associated with the flow conditions, the riparian buffer and potential human influences. Figure 19 shows 40 percent of the sections surveyed on Blueberry Creek remains “unaltered” with no anthropogenic alterations. Thirty three percent of Blueberry Creek was classified as natural with minor anthropogenic changes, while 27 percent was considered altered. The alterations along Blueberry Creek were in the form of road and railway crossings.
Figure 19 Anthropogenic alterations along Blueberry Creek
3.3 Blueberry Creek Instream Aquatic Habitat
3.3.1 Benthic Invertebrates
Freshwater benthic invertebrates are animals without backbones that live on the stream bottom and include crustaceans such as crayfish, molluscs and immature forms of aquatic insects. Benthos represent an extremely diverse group of aquatic animals and exhibit wide ranges of responses to stressors such as organic pollutants, sediments and toxicants, which allows scientists to use them as bioindicators. As part of the Ontario Benthic Biomonitoring Network (OBBN), the RVCA has been collecting benthic invertebrates at the Highway 7 site on Blueberry Creek since 2011. This site was added in 2011 as result of an identified gap in the network during the previous preparation of the 2011 Tay River Subwatershed Report. Monitoring data is analyzed for each sample site and the results are presented using the Family Biotic Index, Family Richness and percent Ephemeroptera, Plecoptera and Trichoptera. There were no values recorded for the Fall of 2016 due to extreme drought conditions therefore no samples could be collected.
Hilsenhoff Family Biotic Index
The Hilsenhoff Family Biotic Index (FBI) is an indicator of organic and nutrient pollution and provides an estimate of water quality conditions for each site using established pollution tolerance values for benthic invertebrates. FBI results for the Blueberry Creek catchment sample location at the Highway 7 sample location are summarized by year from 2011 to 2016. “Fair” to “Poor” water quality conditions were observed at the Blueberry Creek sample location (Figure 20) using a grading scheme developed by Conservation Authorities in Ontario for benthic invertebrates.
Figure 20 Hilsenhoff Family Biotic Index at the Highway 7 sample location
Family Richness
Family Richness measures the health of the community through its diversity and increases with increasing habitat diversity suitability and healthy water quality conditions. Family Richness is equivalent to the total number of benthic invertebrate families found within a sample. The Blueberry Creek site is reported to have “Fair” family richness (Figure 21).
Figure 21 Family Richness at the Highway 7 sample location
EPT
Ephemeroptera (Mayflies), Plecoptera (Stoneflies), and Trichoptera (Caddisflies) are species considered to be very sensitive to poor water quality conditions. High abundance of these organisms is generally an indication of good water quality conditions at a sample location. The community structure is dominated by species that are moderately tolerant and tolerant to poorer water quality conditions. As a result, the EPT indicates that the Blueberry Creek sample location is reported to have “Fair to Poor” water quality (Figure 22) from 2011 to 2016.
Figure 22 EPT results at the Highway 7 sample location
Conclusion
Overall the Blueberry Creek sample location aquatic habitat conditions from a benthic invertebrate perspective is considered “Fair to Poor” from 2011 to 2016 as the samples are dominated by species that are moderately tolerant and tolerant to high organic pollution levels.
3.3.2 Habitat Complexity
Habitat complexity is a measure of the overall diversity of habitat types and features within a stream. Streams with high habitat complexity support a greater variety of species niches, and therefore contribute to greater diversity. Factors such as substrate, flow conditions (pools, riffles) and cover material (vegetation, wood structure, etc.) all provide crucial habitat to aquatic life. Habitat complexity is assessed based on the presence of boulder, cobble and gravel substrates, as well as the presence of instream wood structure.
Low to high habitat complexity was identified for Blueberry Creek (Figure 23). Regions with increased habitat complexity were observed in the lower and middle reaches of the surveyed sections of the system within the catchment.
Figure 23 Habitat complexity along Blueberry Creek
3.3.3 Instream Substrate
Diverse substrate is important for fish and benthic invertebrate habitat because some species have specific substrate requirements and for example will only reproduce on certain types of substrate. The absence of diverse substrate types may limit the overall diversity of species within a stream. Figure 24 shows the overall presence of various substrate types observed along Blueberry Creek. Substrate conditions were highly diverse along Blueberry Creek with all substrate types being recorded at various locations along the creek. Figure 25 shows the dominant substrate type observed for each section surveyed along Blueberry Creek.
Figure 24 Instream substrate along Blueberry Creek
Figure 25 shows the dominant substrate type along Blueberry Creek
3.3.4 Instream Morphology
Pools and riffles are important habitat features for aquatic life. Riffles are fast flowing areas characterized by agitation and overturn of the water surface. Riffles thereby play a crucial role in contributing to dissolved oxygen conditions and directly support spawning for some fish species. They are also areas that support high benthic invertebrate populations which are an important food source for many aquatic species. Pools are characterized by minimal flows, with relatively deep water and winter/summer refuge habitat for aquatic species. Runs are moderately shallow, with unagitated surfaces of water and areas where the thalweg (deepest part of the channel) is in the center of the channel. Figure 26 shows that Blueberry Creek is fairly uniform; 93 percent of sections recorded runs, 80 percent pools and seven percent riffles. Figure 27 shows where the limited riffle habitat area was observed in the lower reach of Blueberry Creek.
Figure 26 Instream morphology along Blueberry Creek
Figure 27 Instream riffle habitat along Blueberry Creek
3.3.5 Vegetation Type
Instream vegetation provides a variety of functions and is a critical component of the aquatic ecosystem. Aquatic plants promote stream health by:
Providing direct riparian/instream habitat
Stabilizing flows reducing shoreline erosion
Contributing to dissolved oxygen through photosynthesis
Maintaining temperature conditions through shading
For example emergent plants along the shoreline can provide shoreline protection from wave action and important rearing habitat for species of waterfowl. Submerged plants provide habitat for fish to find shelter from predator fish while they feed. Floating plants such as water lilies shade the water and can keep temperatures cool while reducing algae growth. Narrow leaved emergents were present in 100% of the sections surveyed, algae was observed in 87% of sections, floating plants were observed in 67% of sections surveyed, broad leaved emergent and submerged plants were observed in 47% of sections while robust emergent were documented in 20% of sections surveyed. Figure 28 depicts the plant community structure for Blueberry Creek. Figure 29 shows the dominant vegetation type observed for each section surveyed along the Blueberry Creek catchment.
Figure 28 Vegetation type along Blueberry Creek
Figure 29 Dominant vegetation type along Blueberry Creek
3.3.6 Instream Vegetation Abundance
Instream vegetation is an important factor for a healthy stream ecosystem. Vegetation helps to remove contaminants from the water, contributes oxygen to the stream, and provides habitat for fish and wildlife. Too much vegetation can also be detrimental. Figure 30 demonstrates that the Blueberry Creek reach had normal to common levels of vegetation recorded at 47 and 40 percent of stream surveys. Extensive levels of vegetation were observed along 20 percent of the surveyed sections while seven percent of sections had areas with no vegetation.
Figure 30 Instream vegetation abundance along Blueberry Creek
3.3.7 Invasive Species
Invasive species can have major implications on streams and species diversity. Invasive species are one of the largest threats to ecosystems throughout Ontario and can out compete native species, having negative effects on local wildlife, fish and plant populations. One hundred percent of the sections surveyed along Blueberry Creek reach had invasive species. The invasive species observed in the Blueberry Creek reach were European frogbit, bull thistle, common/glossy buckthorn, purple loosestrife and poison parsnip. Invasive species abundance (i.e. the number of observed invasive species per section) was assessed to determine the potential range/vector of many of these species (Figure 31).
Figure 31 Invasive species abundance along Blueberry Creek
3.3.8 Water Chemistry
During the stream characterization survey, a YSI probe is used to collect water chemistry information. Dissolved oxygen (DO), specific conductivity (SPC) and pH are measured at the start and end of each section.
3.3.8.1 Dissolved Oxygen
Dissolved oxygen is a measure of the amount of oxygen dissolved in water. The Canadian Environmental Quality Guidelines of the Canadian Council of Ministers of the Environment (CCME) suggest that for the protection of aquatic life the lowest acceptable dissolved oxygen concentration should be 6 mg/L for warmwater biota and 9.5 mg/L for coldwater biota (CCME, 1999). Figure 32 shows that the dissolved oxygen in Blueberry Creek supports warmwater biota and in certain locations is below the recommended levels to support aquatic life. The average dissolved oxygen levels observed within Blueberry Creek was 5.9mg/L which is just below the recommended levels for warmwater biota.
Figure 32 Dissolved oxygen ranges along Blueberry Creek
3.3.8.2 Conductivity
Conductivity in streams is primarily influenced by the geology of the surrounding environment, but can vary drastically as a function of surface water runoff. Currently there are no CCME guideline standards for stream conductivity; however readings which are outside the normal range observed within the system are often an indication of unmitigated discharge and/or stormwater input. The average conductivity observed within the main stem of Blueberry Creek was 540.7 µs/cm. Figure 33 shows the conductivity readings for Blueberry Creek.
Figure 33 Specific conductivity ranges in Blueberry Creek
3.3.8.3 pH
Based on the PWQO for pH, a range of 6.5 to 8.5 should be maintained for the protection of aquatic life. Average pH values for the Blueberry Creek catchment averaged 7.81 thereby meeting the provincial standard (Figure 34).
Figure 34 pH ranges in Blueberry Creek
3.3.8.4 Oxygen Saturation (%)
Oxygen saturation is measured as the ratio of dissolved oxygen relative to the maximum amount of oxygen that will dissolve based on the temperature and atmospheric pressure. Well oxygenated water will stabilize at or above 100% saturation, however the presence of decaying matter/pollutants can drastically reduce these levels. Oxygen input through photosynthesis has the potential to increase saturation above 100% to a maximum of 500%, depending on the productivity level of the environment. In order to represent the relationship between concentration and saturation, the measured values have been summarized into 6 classes:
Dissolved oxygen conditions along Blueberry Creek varied along the system with areas below levels to support aquatic life as well as areas that support warmwater species (Figure 35).
Figure 35 A bivariate assessment of dissolved oxygen concentration (mg/L) and saturation (%) in Blueberry Creek
3.3.8.5 Specific Conductivity Assessment
Specific conductivity (SPC) is a standardized measure of electrical conductance, collected at or corrected to a water temperature of 25⁰C. SPC is directly related to the concentration of ions in water, and is commonly influenced by the presence of dissolved salts, alkalis, chlorides, sulfides and carbonate compounds. The higher the concentration of these compounds, the higher the conductivity. Common sources of elevated conductivity include storm water, agricultural inputs and commercial/industrial effluents.
In order to summarize the conditions observed, SPC levels were evaluated as either normal, moderately elevated or highly elevated. These categories correspond directly to the degree of variation (i.e. standard deviation) at each site relative to the average across the system.
Normal levels were maintained along the majority of Blueberry Creek, however there were moderately and highly elevated areas in the middle reaches (Figure 36). The highly elevated area was located at the Highway 7 crossing likely linked to stormwater runoff from the roadway.
Figure 36 Relative specific conductivity levels along Blueberry Creek
3.3.9 Thermal Regime
Many factors can influence fluctuations in stream temperature, including springs, tributaries, precipitation runoff, discharge pipes and stream shading from riparian vegetation. Water temperature is used along with the maximum air temperature (using the Stoneman and Jones method) to classify a watercourse as either warm water, cool water or cold water. Figure 37 shows where the thermal sampling sites were located on Blueberry Creek. Analysis of the data collected indicates that Blueberry Creek catchment is classified as a warm water system with cool water reaches (Figure 38).
Figure 37 Temperature logger locations along Blueberry Creek
Figure 38 Temperature logger data for the sites on Blueberry Creek
Each point on the graph represents a temperature that meets the following criteria:
Sampling dates between July 1st and September 7th
Sampling date is preceded by two consecutive days above 24.5 °C, with no rain
Water temperatures are collected at 4pm
Air temperature is recorded as the max temperature for that day
3.3.10 Groundwater
Groundwater discharge areas can influence stream temperature, contribute nutrients, and provide important stream habitat for fish and other biota. During stream surveys, indicators of groundwater discharge are noted when observed. Indicators include: springs/seeps, watercress, iron staining, significant temperature change and rainbow mineral film. Figure 39 shows areas where one or more of the above groundwater indicators were observed during stream surveys and headwater drainage feature assessments.
Figure 39 Groundwater indicators observed in the Blueberry Creek catchment
3.3.11 Fish Community
The Blueberry Creek catchment is classified as a mixed community of warm and cool water recreational and baitfish fishery with 14 species observed. Table 7 is a list of species observed historically in the catchment and during the 2016 field sampling season. Figure 40 shows the sampling locations of the fish species identified in the catchment.
Table 7 Fish species observed in the Blueberry Creek catchment
Fish Species
Scientific Name
Fish code
Historical
2016
blackchin shiner
Notropis heterodon
BcShi
X
blacknose dace
Rhinichthys atratulus
BnDac
X
brook stickleback
Culaea inconstans
BrSti
X
X
brown bullhead
Ameiurus nebulosus
BrBul
X
carps and minnows
Cyprinidae
CA_MI
X
central mudminnow
Umbra limi
CeMud
X
X
common shiner
Luxilus cornutus
CoShi
X
X
creek chub
Semotilus atromaculatus
CrChu
X
X
etheostoma sp.
etheostoma sp.
EthSp
X
golden shiner
Notemigonus crysoleucas
GoShi
X
hornyhead chub
Nocomis biguttatus
HhChu
X
X
northern redbelly dace
Chrosomus eos
NRDac
X
X
pumpkinseed
Lepomis gibbosus
Pumpk
X
X
rock bass
Ambloplites rupestris
RoBas
X
X
white sucker
Catostomus commersonii
WhSuc
X
yellow bullhead
Ameiurus natalis
YeBul
X
TOTAL Species
10
14
Figure 40 Historical and 2016 fish sampling locations in the catchment.
A fyke net set on Blueberry Creek in 2016
3.3.12 Beaver Dams
Overall beaver dams create natural changes in the environment. Some of the benefits include providing habitat for wildlife, flood control, and silt retention. Additional benefits come from bacterial decomposition of woody material used in the dams which removes excess nutrient and toxins. Beaver dams have the potential to flood agricultural areas and can be considered potential barriers to fish migration.
Several beaver dams were identified on the surveyed portions of Blueberry Creek in 2016 (Figure 41).
Figure 41 Beaver Dam type and locations along Blueberry Creek
3.3.13 Riparian Restoration
Figure 42 depicts the locations of riparian restoration opportunities as a result of observations made during the stream survey. The project recommended is one that involves streambank erosion mitigation.
Figure 42 Riparian restoration opportunities in the Blueberry Creek catchment
3.3.14 Instream Restoration
Figure 43 depicts the locations of instream restoration opportunities as a result of observations made during the stream survey. The project recommended is a stream garbage cleanup opportunity downstream of Highway 7.
Figure 43 Instream restoration opportunities in the Blueberry Creek catchment
3.4 Headwater Drainage Feature Assessment
3.4.1 Headwaters Sampling Locations
The RVCA Stream Characterization Program assessed Headwater Drainage Features for the Bluberry Creek subwatershed in 2017. This protocol measures zero, first and second order headwater drainage features (HDF). It is a rapid assessment method characterizing the amount of water, sediment transport, and storage capacity within headwater drainage features (HDF). RVCA is working with other Conservation Authorities and the Ministry of Natural Resources and Forestry to implement the protocol with the goal of providing standard datasets to support science development and monitoring of headwater drainage features. An HDF is a depression in the land that conveys surface flow. Additionally, this module provides a means of characterizing the connectivity, form and unique features associated with each HDF (OSAP Protocol, 2013). In 2017 the program sampled 11 sites at road crossings in the Blueberry Creek catchment area (Figure 44).
Figure 44 Location of the headwater sampling sites in the Blueberry Creek catchment
3.4.2 Headwater Feature Type
The headwater sampling protocol assesses the feature type in order to understand the function of each feature. The evaluation includes the following classifications: defined natural channel, channelized or constrained, multi-thread, no defined feature, tiled, wetland, swale, roadside ditch and pond outlet. By assessing the values associated with the headwater drainage features in the catchment area we can understand the ecosystem services that they provide to the watershed in the form of hydrology, sediment transport, and aquatic and terrestrial functions. The headwater drainage features in the Blueberry Creek catchment are primarily classified as wetland for a total of six; three were classified as a road side ditch and two features as channelized. Figure 45 shows the feature type of the primary feature at the sampling locations.
Figure 45 Headwater feature types in the Blueberry Creek catchment
A spring photo of the headwater sample site in the Blueberry Creek catchment located on Clarchris Road
A summer photo of the headwater sample site in the Blueberry Creek catchment located on Clarchris Road
3.4.3 Headwater Feature Flow
The observed flow condition within headwater drainage features can be highly variable depending on timing relative to the spring freshet, recent rainfall, soil moisture, etc. Flow conditions are assessed in the spring and in the summer to determine if features are perennial and flow year round, if they are intermittent and dry up during the summer months or if they are ephemeral systems that do not flow regularly and generally respond to specific rainstorm events or snowmelt. Flow conditions in headwater systems can change from year to year depending on local precipitation patterns. Figure 46 shows the observed flow condition at the sample locations in the Blueberry Creek catchment in 2017.
Figure 46 Headwater feature flow conditions in the Blueberry Creek catchment
3.4.4 Feature Channel Modifications
Channel modifications were assessed at each headwater drainage feature sampling location. Modifications include channelization, dredging, hardening and realignments. The Blueberry Creek catchment area had seven with no channel modifications observed, three sites as having been historically straightened/dredged and one location had mixed modifications. Figure 47 shows the channel modifications observed at the sampling locations for Blueberry Creek.
Figure 47 Headwater feature channel modifications in the Blueberry Creek catchment
3.4.5 Headwater Feature Vegetation
Headwater feature vegetation evaluates the type of vegetation that is found within the drainage feature. The type of vegetated within the channel influences the aquatic and terrestrial ecosystem values that the feature provides. For some types of headwater features the vegetation within the feature plays a very important role in flow and sediment movement and provides wildlife habitat. The following classifications are evaluated no vegetation, lawn, wetland, meadow, scrubland and forest. Figure 48 depicts the dominant vegetation observed at the sampled headwater sites in the Blueberry Creek catchment.
Figure 48 Headwater feature vegetation types in the Blueberry Creek catchment
3.4.6 Headwater Feature Riparian Vegetation
Headwater riparian vegetation evaluates the type of vegetation that is found along the adjacent lands of a headwater drainage feature. The type of vegetation within the riparian corridor influences the aquatic and terrestrial ecosystem values that the feature provides to the watershed. Figure 49 depicts the type of riparian vegetation observed at the sampled headwater sites in the Blueberry Creek catchment.
Figure 49 Headwater feature riparian vegetation types in the Blueberry Creek catchment
3.4.7 Headwater Feature Sediment Deposition
Assessing the amount of recent sediment deposited in a channel provides an index of the degree to which the feature could be transporting sediment to downstream reaches (OSAP, 2013). Evidence of excessive sediment deposition might indicate the requirement to follow up with more detailed targeted assessments upstream of the site location to identify potential best management practices to be implemented. Sediment deposition ranged from none to minimal for the headwater sites sampled in the Blueberry Creek catchment area. Figure 50 depicts the degree of sediment deposition observed at the sampled headwater sites in the Blueberry Creek catchment.
Figure 50 Headwater feature sediment deposition in the Blueberry Creek catchment
3.4.8 Headwater Feature Upstream Roughness
Feature roughness will provide a measure of the amount of materials within the bankfull channel that could slow down the velocity of water flowing within the headwater feature (OSAP, 2013). Materials on the channel bottom that provide roughness include vegetation, wood structure and boulders/cobble substrates. Roughness can provide benefits in mitigating downstream erosion on the headwater drainage feature and the receiving watercourse by reducing velocities. Roughness also provides important habitat conditions for aquatic organisms. Figure 51 shows the feature roughness conditions at the sampling location in the Blueberry Creek catchment.
Figure 51 Headwater feature roughness in the Blueberry Creek catchment
Land cover and any change in coverage that has occurred over a six year period is summarized for the Blueberry Creek catchment using spatially continuous vector data representing the catchment during the spring of 2008 and 2014. This dataset was developed by the RVCA through heads-up digitization of 20cm DRAPE ortho-imagery at a 1:4000 scale and details the surrounding landscape using 10 land cover classes.
4.1 Blueberry Creek Catchment Land Cover/Change
As shown in Table 8 and Figure 1, the dominant land cover types in 2014 is wetland closely followed by crop and pastureland.
Table 8 Land cover (2008 vs. 2014) in the Blueberry Creek catchment
Land Cover
2008
2014
Change - 2008 to 2014
Area
Area
Area
Ha
Percent
Ha
Percent
Ha
Percent
Wetland **
1560
40
1561
40
1
>Evaluated
(1315)
(34)
(1315)
(34)
(0)
(0)
>Unevaluated
(245)
(6)
(246)
(6)
(1)
(0)
Crop and Pasture
1348
34
1342
34
-6
Woodland*
699
18
693
18
-6
Settlement
190
5
199
5
9
Transportation
74
2
75
2
1
Meadow-Thicket
30
1
28
1
-2
Aggregate
9
<1
12
<1
3
Water
<1
<1
<1
<1
* Does not include treed swamps ** Includes treed swamps
From 2008 to 2014, there was an overall change of 14 hectares (from one land cover class to another). Most of the change in the Blueberry Creek catchment is a result of crop and pastureland being converted to settlement and aggregates. The remainder of the change can be attributed to the transformation of woodland to crop and pastureland and settlement (Figure 52).
Figure 52 Land cover change in the Blueberry Creek catchment (2008 to 2014)
Table 9 provides a detailed breakdown of all land cover change that has taken place in the Blueberry Creek catchment between 2008 and 2014.
Table 9 Land cover change in the Blueberry Creek catchment (2008 to 2014)
Land Cover
Change - 2008 to 2014
Area
Ha.
Percent
Crop and Pasture to Settlement
6.3
43.5
Woodland to Crop and Pasture
2.8
19.7
Crop and Pasture to Aggregate
2.7
19.1
Woodland to Settlement
2.6
17.8
4.2 Woodland Cover
In the Environment Canada Guideline (Third Edition) entitled “How Much Habitat Is Enough?” (hereafter referred to as the “Guideline”) the opening narrative under the Forest Habitat Guidelines section states that prior to European settlement, forest was the predominant habitat in the Mixedwood Plains ecozone. The remnants of this once vast forest now exist in a fragmented state in many areas (including the Rideau Valley watershed) with woodland patches of various sizes distributed across the settled landscape along with higher levels of forest cover associated with features such as the Frontenac Axis (within the on-Shield areas of the Rideau Lakes and Tay River subwatersheds). The forest legacy, in terms of the many types of wildlife species found, overall species richness, ecological functions provided and ecosystem complexity is still evident in the patches and regional forest matrices (found in the Tay River subwatershed and elsewhere in the Rideau Valley watershed). These ecological features are in addition to other influences which forests have on water quality and stream hydrology including reducing soil erosion, producing oxygen, storing carbon along with many other ecological services that are essential not only for wildlife but for human well-being.
The Guideline also notes that forests provide a great many habitat niches that are in turn occupied by a great diversity of plant and animal species. They provide food, water and shelter for these species - whether they are breeding and resident locally or using forest cover to help them move across the landscape. This diversity of species includes many that are considered to be species at risk. Furthermore, from a wildlife perspective, there is increasing evidence that the total forest cover in a given area is a major predictor of the persistence and size of bird populations, and it is possible or perhaps likely that this pattern extends to other flora and fauna groups. The overall effect of a decrease in forest cover on birds in fragmented landscapes is that certain species disappear and many of the remaining ones become rare, or fail to reproduce, while species adapted to more open and successional habitats, as well as those that are more tolerant to human-induced disturbances in general, are able to persist and in some cases thrive. Species with specialized-habitat requirements are most likely to be adversely affected. The overall pattern of distribution of forest cover, the shape, area and juxtaposition of remaining forest patches and the quality of forest cover also play major roles in determining how valuable forests will be to wildlife and people alike.
The current science generally supports minimum forest habitat requirements between 30 and 50 percent, with some limited evidence that the upper limit may be even higher, depending on the organism/species phenomenon under investigation or land-use/resource management planning regime being considered/used.
As shown in Figure 53, 25 percent of the Blueberry Creek catchment contains 693 hectares of upland forest and 285 hectares of lowland forest (treed swamps) versus the 47 percent of woodland cover in the Tay River subwatershed. This is less than the 30 percent of forest cover that is identified as the minimum threshold required to sustain forest birds according to the Guideline and which may only support less than one half of potential species richness and marginally healthy aquatic systems. When forest cover drops below 30 percent, forest birds tend to disappear as breeders across the landscape.
Figure 53 Woodland cover and forest interior in the Blueberry Creek catchment (2014)
4.2.1 Woodland (Patch) Size
According to the Ministry of Natural Resources’ Natural Heritage Reference Manual (Second Edition), larger woodlands are more likely to contain a greater diversity of plant and animal species and communities than smaller woodlands and have a greater relative importance for mobile animal species such as forest birds.
Bigger forests often provide a different type of habitat. Many forest birds breed far more successfully in larger forests than they do in smaller woodlots and some rely heavily on forest interior conditions. Populations are often healthier in regions with more forest cover and where forest fragments are grouped closely together or connected by corridors of natural habitat. Small forests support small numbers of wildlife. Some species are “area-sensitive” and tend not to inhabit small woodlands, regardless of forest interior conditions. Fragmented habitat also isolates local populations, especially small mammals, amphibians and reptiles with limited mobility. This reduces the healthy mixing of genetic traits that helps populations survive over the long run (Conserving the Forest Interior. Ontario Extension Notes, 2000).
The Environment Canada Guideline also notes that for forest plants that do not disperse broadly or quickly, preservation of some relatively undisturbed large forest patches is needed to sustain them because of their restricted dispersal abilities and specialized habitat requirements and to ensure continued seed or propagation sources for restored or regenerating areas nearby.
The Natural Heritage Reference Manual continues by stating that a larger size also allows woodlands to support more resilient nutrient cycles and food webs and to be big enough to permit different and important successional stages to co-exist. Small, isolated woodlands are more susceptible to the effects of blowdown, drought, disease, insect infestations, and invasions by predators and non-indigenous plants. It is also known that the viability of woodland wildlife depends not only on the characteristics of the woodland in which they reside, but also on the characteristics of the surrounding landscape where the woodland is situated. Additionally, the percentage of forest cover in the surrounding landscape, the presence of ecological barriers such as roads, the ability of various species to cross the matrix surrounding the woodland and the proximity of adjacent habitats interact with woodland size in influencing the species assemblage within a woodland.
In the Blueberry Creek catchment (in 2014), sixty-four (49 percent) of the 130 woodland patches are very small, being less than one hectare in size. Another 54 (42 percent) of the woodland patches ranging from one to less than 20 hectares in size tend to be dominated by edge-tolerant bird species. The remaining 12 (nine percent of) woodland patches range between 21 and 125 hectares in size. Ten of these patches contain woodland between 20 and 100 hectares and may support a few area-sensitive species and some edge intolerant species, but will be dominated by edge tolerant species.
Conversely, two (two percent) of the 273 woodland patches in the drainage area exceed the 100 plus hectare size needed to support most forest dependent, area sensitive birds and are large enough to support approximately 60 percent of edge-intolerant species. No patch tops 200 hectares, which according to the Environment Canada Guideline will support 80 percent of edge-intolerant forest bird species (including most area sensitive species) that prefer interior forest habitat conditions.
Table 10 presents a comparison of woodland patch size in 2008 and 2014 along with any changes that have occurred over that time. A decrease (of 5 hectares) has been observed in the overall woodland patch area between the two reporting periods with most change occurring in the one to 10 woodland patch size class range.
Table 10 Woodland patches in the Blueberry Creek catchment (2008 and 2014)
Woodland Patch Size Range (ha)
Woodland* Patches
Patch Change
2008
2014
2008 to 2014
Number
Area
Number
Area
Number
Area
Count
%
Ha
%
Count
%
Ha
%
Count
Ha
Less than 1
64
49
23
2
64
49
23
2
1 to 20
56
42
286
29
54
42
282
29
-2
-4
20 to 50
7
5
233
24
7
5
232
24
-1
50 to 100
3
2
210
21
3
2
210
21
100 to 200
2
2
231
24
2
2
231
24
Totals
132
100
983
100
130
100
978
100
-2
-5
*Includes treed swamps
4.2.2 Woodland (Forest) Interior Habitat
The forest interior is habitat deep within woodlands. It is a sheltered, secluded environment away from the influence of forest edges and open habitats. Some people call it the “core” or the “heart” of a woodland. The presence of forest interior is a good sign of woodland health, and is directly related to the woodland’s size and shape. Large woodlands with round or square outlines have the greatest amount of forest interior. Small, narrow woodlands may have no forest interior conditions at all. Forest interior habitat is a remnant natural environment, reminiscent of the extensive, continuous forests of the past. This increasingly rare forest habitat is now a refuge for certain forest-dependent wildlife; they simply must have it to survive and thrive in a fragmented forest landscape (Conserving the Forest Interior. Ontario Extension Notes, 2000).
The Natural Heritage Reference Manual states that woodland interior habitat is usually defined as habitat more than 100 metres from the edge of the woodland and provides for relative seclusion from outside influences along with a moister, more sheltered and productive forest habitat for certain area sensitive species. Woodlands with interior habitat have centres that are more clearly buffered against the edge effects of agricultural activities or more harmful urban activities than those without.
In the Blueberry Creek catchment (in 2014), the 273 woodland patches contain 18 forest interior patches (Figure 53) that occupy three percent (136 ha.) of the catchment land area (which is less than the five percent of interior forest in the Tay River subwatershed). This is below the ten percent figure referred to in the Environment Canada Guideline that is considered to be the minimum threshold for supporting edge intolerant bird species and other forest dwelling species in the landscape.
Most patches (14) have less than 10 hectares of interior forest, nine of which have small areas of interior forest habitat less than one hectare in size. The remaining four patches contain interior forest between 11 and 57 hectares in area. Between 2008 and 2014, there was no change in the number of woodland patches containing interior habitat in the catchment over the six year period (Table 11).
Table 11 Woodland interior in the Blueberry Creek catchment (2008 and 2014)
Woodland Interior Habitat Size Range (ha)
Woodland Interior
Interior Change
2008
2014
2008 to 2014
Number
Area
Number
Area
Number
Area
Count
Percent
Ha
Percent
Count
Percent
Ha
Percent
Count
Ha
Less than 1
9
50
3
2
9
50
3
2
1 to 10
5
28
16
12
5
28
16
12
10 to 30
2
11
23
17
2
11
23
17
30 to 50
1
5.5
37
27
1
5.5
37
27
50 to 100
1
5.5
57
42
1
5.5
57
42
Totals
18
100
136
100
18
100
136
100
4.3 Wetland Cover
Wetlands are habitats forming the interface between aquatic and terrestrial systems. They are among the most productive and biologically diverse habitats on the planet. By the 1980s, according to the Natural Heritage Reference Manual, 68 percent of the original wetlands south of the Precambrian Shield in Ontario had been lost through encroachment, land clearance, drainage and filling.
Wetlands perform a number of important ecological and hydrological functions and provide an array of social and economic benefits that society values. Maintaining wetland cover in a watershed provides many ecological, economic, hydrological and social benefits that are listed in the Reference Manual and which may include:
contributing to the stabilization of shorelines and to the reduction of erosion damage through the mitigation of water flow and soil binding by plant roots
mitigating surface water flow by storing water during periods of peak flow (such as spring snowmelt and heavy rainfall events) and releasing water during periods of low flow (this mitigation of water flow also contributes to a reduction of flood damage)
contributing to an improved water quality through the trapping of sediments, the removal and/or retention of excess nutrients, the immobilization and/or degradation of contaminants and the removal of bacteria
providing renewable harvesting of timber, fuel wood, fish, wildlife and wild rice
contributing to a stable, long-term water supply in areas of groundwater recharge and discharge
providing a high diversity of habitats that support a wide variety of plants and animals
acting as “carbon sinks” making a significant contribution to carbon storage
providing opportunities for recreation, education, research and tourism
Historically, the overall wetland coverage within the Great Lakes basin exceeded 10 percent, but there was significant variability among watersheds and jurisdictions, as stated in the Environment Canada Guideline. In the Rideau Valley Watershed, it has been estimated that pre-settlement wetland cover averaged 35 percent using information provided by Ducks Unlimited Canada (2010) versus the 21 percent of wetland cover existing in 2014 derived from DRAPE imagery analysis.
Figure 54 Wetland cover in the Blueberry Creek catchment (2014)
This decline in wetland cover is also evident in the Blueberry Creek catchment (as seen in Figure 54 and summarized in Table 12), where wetland was reported to cover 65 percent of the area prior to settlement, as compared to 39 percent in 2014. This represents a 38 percent loss of historic wetland cover. To maintain critical hydrological, ecological functions along with related recreational and economic benefits provided by these wetland habitats in the catchment, a “no net loss” of currently existing wetlands should be employed to ensure the continued provision of tangible benefits accruing from them to landowners and surrounding communities.
Table 12 Wetland cover in the Blueberry Creek catchment (Historic to 2014)
Wetland Cover
Pre-settlement
2008
2014
Change - Historic to 2014
Area
Area
Area
Area
Ha
Percent
Ha
Percent
Ha
Percent
Ha
Percent
Blueberry Creek
2534
65
1560
39
1561
39
-973
-38
Tay River
n/a
n/a
15280
19
15330
19
n/a
n/a
Rideau Valley
134115
35
n/a
n/a
82076
21
-52039
-39
4.4 Shoreline Cover
The riparian or shoreline zone is that special area where the land meets the water. Well-vegetated shorelines are critically important in protecting water quality and creating healthy aquatic habitats, lakes and rivers. Natural shorelines intercept sediments and contaminants that could impact water quality conditions and harm fish habitat in streams. Well established buffers protect the banks against erosion, improve habitat for fish by shading and cooling the water and provide protection for birds and other wildlife that feed and rear young near water. A recommended target (from the Environment Canada Guideline) is to maintain a minimum 30 metre wide vegetated buffer along at least 75 percent of the length of both sides of rivers, creeks and streams.
Figure 55 shows the extent of the ‘Natural’ vegetated riparian zone (predominantly wetland/woodland features) and ‘Other’ anthropogenic cover (crop/pastureland, roads/railways, settlements) along a 30-metre-wide area of land along both sides of the shoreline of the many unnamed watercourses (including headwater streams) found in the Blueberry Creek catchment.
Figure 55 Natural and other riparian land cover in the Blueberry Creek catchment (2014)
This analysis shows that the riparian zone in the Blueberry Creek catchment is composed of wetland (55 percent), woodland (19 percent), crop and pastureland (19 percent), settlement (four percent), transportation (two percent), meadow-thicket and aggregate (less than one percent). Along the many watercourses (including headwater streams) flowing into Blueberry Creek, the riparian buffer is composed of wetland (47 percent), crop and pastureland (25 percent), woodland (24 percent), settlement areas (three percent) and roads (one percent). Along Blueberry Creek itself, the riparian zone is composed of wetland (82 percent), woodland (six percent), settlement (six percent), crop and pastureland (three percent), transportation (two percent) and meadow-thicket (less than one percent).
Additional statistics for the Blueberry Creek catchment are presented in Tables 13, 14 and 15 and show that there has been very little to no change in shoreline cover from 2008 to 2014.
Table 13 Riparian land cover in the Blueberry Creek catchment (2008 vs. 2014)
Riparian Land Cover
2008
2014
Change - 2008 to 2014
Area
Area
Area
Ha.
Percent
Ha.
Percent
Ha.
Percent
Wetland
150.15
55.38
150.15
55.38
0.00
0.00
> Unevaluated
(65.85)
(24.29)
(65.85)
(24.29)
(0.00)
(0.00)
>Evaluated
(84.30)
(31.09)
(84.30)
(31.09)
(0.00)
(0.00)
Woodland
53.24
19.64
53.07
19.57
-0.17
-0.07
Crop & Pasture
53.08
19.58
53.08
19.58
0.18
0.00
Settlement
10.01
3.69
10.19
3.76
0.18
0.07
Transportation
4.26
1.57
4.26
1.57
0.00
0.00
Meadow-Thicket
0.32
0.12
0.32
0.12
0.00
0.00
Aggregates
0.09
0.03
0.09
0.03
0.00
0.00
Table 14 Riparian land cover along Blueberry Creek (2008 vs. 2014)
Riparian Land Cover
2008
2014
Change - 2008 to 2014
Area
Area
Area
Ha.
Percent
Ha.
Percent
Ha.
Percent
Wetland
56.11
82.31
56.11
82.31
0.00
0.00
> Unevaluated
21.01
30.82
21.01
30.82
0.00
0.00
>Evaluated
35.1
51.49
35.1
51.49
0.00
0.00
Woodland
4.38
6.43
4.38
6.43
0.00
0.00
Settlement
3.89
5.7
3.89
5.7
0.00
0.00
Crop & Pasture
2.12
3.12
2.12
3.12
0.00
0.00
Transportation
1.44
2.11
1.44
2.11
0.00
0.00
Meadow-Thicket
0.23
0.34
0.23
0.34
0.00
0.00
Table 15 Riparian land cover along streams in the Blueberry Creek Catchment (2008 vs. 2014)
5.0 Blueberry Creek Catchment: Stewardship and Water Resources Protection
The RVCA and its partners are working to protect and enhance environmental conditions in the Tay River Watershed. Figure 56 shows the location of all stewardship projects completed in the Blueberry Creek catchment.
Figure 56 Stewardship site locations in the Blueberry Creek catchment
5.1 Rural Clean Water
The Rural Clean Water Program provides technical and financial assistance to farmers and other rural landowners, to aid in the implementation of projects that protect water quality. Funding is granted to those projects that support best management practices for application in the protection and improvement of surface and ground water resources. The program also supports climate change adaptation and low impact development projects as well as educating rural landowners about environmental stewardship of private property. Examples of supported projects include livestock exclusion fencing, controlled tile drainage, cover crops, erosion control, well related projects, and many more. For a list of eligible projects and to apply for funding, see Rural Clean Water.
In the Blueberry Creek catchment from 2011 to 2016, one septic system repair, one well decommissioning, one well replacement, one well upgrade and one education initiative were completed; prior to this, three septic system repairs, three well upgrades, one well decommissioning, one livestock fencing project, one windbreak/buffer project and one education initiative had been completed. When combined, these projects are keeping 2.4 kilograms of Phosphorus out of our lakes, rivers and streams every year. Total value of all 15 projects is $72,414 with $18,661 of that amount funded through grant dollars from the RVCA.
5.2 Private Land Forestry
Forest cover and tree planting continues to be one of the most widely supported strategies to improve our environment. The many benefits of forest cover include carbon sequestration, flood mitigation and water quality improvement as well as providing wildlife habitat.
Through the RVCA's Trees for Tomorrow Program (and its predecessors), 2,000 trees were planted at one site from 2011 to 2016; prior to this, 1,800 trees were planted at four sites. In total, 3,800 trees have been planted resulting in the reforestation of two hectares. Total value of all five projects in the Blueberry Creek catchment is $9,532 with $7,354 of that amount coming from fundraising sources. For more information about the Program and landowner eligibility, please see the following: Tree Planting in the Rideau Valley Watershed and Trees for Tomorrow.
5.3 Shoreline Naturalization
Though the RVCA’s Shoreline Naturalization Program , landowners (private and public property owners) have naturalized more than 2.3 km of shoreline in the Tay Watershed by planting over 10,563 native trees and shrubs at 96 sites since 2008. In the Blueberry Creek Catchment, 73 native trees and shrubs have been planted along shoreline with a total project value of $1,168. In 2013, new trees, shrubs and wildflowers were added to the naturalization demonstration garden at the Tay Valley Township municipal office on Harper Road.
5.4 Valley, Stream, Wetland and Hazard Lands
The Blueberry Creek catchment covers 39.1 square kilometres with 17.4 square kilometres (or 44.4 percent) of the drainage area being within the regulation limit of Ontario Regulation 174/06 (Figure 57), giving protection to wetland areas and river or stream valleys that are affected by flooding and erosion hazards.
Wetlands occupy 15.6 square kilometres (or 39.8 percent) of the catchment. Of these wetlands, 13.2 square kilometres (or 84.6 percent) are designated as provincially significant and included within the RVCA regulation limit. This leaves the remaining 2.4 square kilometres (or 15.4 percent) of wetlands in the catchment outside the regulated area limit.
Of the 45.9 kilometres of stream in the catchment, regulation limit mapping has been plotted along 19.6 kilometers of streams (representing 42.7 percent of all streams in the catchment). Some of these regulated streams (14.6 km) flow through regulated wetlands; the remaining five kilometres of regulated streams are located outside of those wetlands. Plotting of the regulation limit on the remaining 26.3 kilometres (or 57.3 percent) of streams requires identification of flood and erosion hazards and valley systems.
Within those areas of the Blueberry Creek catchment subject to the regulation (limit), efforts (have been made and) continue through RVCA planning and regulations input and review to manage the impact of development (and other land management practices) in areas where “natural hazards” are associated with rivers, streams, valley lands and wetlands. For areas beyond the regulation limit, protection of the catchment’s watercourses is only provided through the “alteration to waterways” provision of the regulation.
Figure 57 Regulated natural features/hazards and Intake Protection Zones in the Blueberry Creek catchment
5.5 Vulnerable Drinking Water Areas
The Town of Perth’s municipal drinking water Intake Protection Zone (IPZ), specifically IPZ-2 with a vulnerability score of 8 and 9 is found within the Blueberry Creek catchment (Figure 57). As per the Mississippi-Rideau Source Protection Plan, policies may affect future development within these areas. Under Section 59 of the Clean Water Act, 2006, future applications under the Building Code and the Planning Act may be screened by the Mississippi-Rideau Risk Management Office. Depending on the proposed activity, additional requirements or restrictions may apply. For more information, please contact the Mississippi-Rideau Risk Management Office at (613) 692-3571.
In addition, the Mississippi-Rideau Source Protection Plan has mapped the central part of the Blueberry Creek catchment as within a Significant Groundwater Recharge Area and identified all of the catchment as a Highly Vulnerable Aquifer. This means that the nature of the overburden (thin soils, fractured bedrock) does not provide a high level of protection for the underlying groundwater making the aquifer more vulnerable to contaminants released on the surface. Highly Vulnerable Aquifers characterise 89% of the Region and are considered moderate to low drinking water threats with certain policies that apply; mainly policies regarding waste disposal. All property owners are encouraged to use best management practices to protect sources of municipal drinking water. For more information on source protection best management practices, please visit Protecting Your Drinking Water.
6.0 Blueberry Creek Catchment: Accomplishments/Activities
Achievements noted by the Friends of the Tay Watershed Association (FoTW) are indicated by an asterisk.
Development
The Town of Perth Official Plan Amendment (2009) has generally changed the land use designation in the northwest quadrant of the Town of Perth (area of the Town that is north of Highway 7, east of Highway 511 and south of the Blueberry Marsh) from Commercial Highway to Residential. This has required the annexation of approximately 30 hectares of land from Drummond/North Elmsley Township and the need to undertake an infrastructure master plan (initiated in 2010) to provide direction for the servicing of these lands for water, wastewater, stormwater and transportation. The Environmental Assessment for the area was competed in 2016 with input from the RVCA being incorporated into the overall master design.
In-stream/Fish Habitat
1.5 kilometres of Blueberry Creek have been surveyed and 11 headwaters are sampled once every six years by the RVCA using the Ontario Stream Assessment Protocol.
Shoreline Naturalization
Seventy-three native trees and shrubs have been planted along shoreline in the Blueberry Creek catchment with services provided by the RVCA Shoreline Naturalization Program.
Tree Planting
3,800 trees have been planted at five sites in the Blueberry Creek catchment by the RVCA Private Land Forestry Program, resulting in the reforestation of two hectares.
Water Quality
Since 2012, one monitoring site on Blueberry Creek is sampled yearly by the RVCA for 22 parameters, six times a year, to assess surface chemistry water quality conditions.
Since 2011, one Ontario Benthic Biomonitoring Network site on Blueberry Creek is sampled by the RVCA in the spring and fall of each year with three replicates, to assess instream biological water quality conditions.
Fifteen Rural Clean Water Program projects were completed by the RVCA Rural Clean Water Program.
Waterway Planning and Management
The Tay Watershed Management Plan (2002) brought together a diverse group of watershed stakeholders to exchange information and opinions on the challenges facing the watershed. This forum focused the community on the need for managing the Tay Watershed, requiring positive cooperation amongst a range of stakeholders and helped develop a foundation of data and information on the watershed and resources against which later developments and trends are being measured and decisions are being made.
The Plan also led to the formation of the Friends of the Tay Watershed Association, who have been instrumental in implementing 20 of 24 management plan recommendations. In the opinion of the Association, one of the most significant measures of success for the water protection activities carried out in the Tay watershed is that there has never been a serious environmental pollution incident that threatened the area’s drinking water or its recreational waterbodies. To this day, the Friends of the Tay Watershed remain committed to preserving and enhancing the health of the Tay River watershed through their work.*
Issues noted by the Friends of the Tay Watershed Association (FoTW) are indicated by an asterisk.
Headwaters/In-stream Habitat/Shorelines
Blueberry Creek catchment watercourses (including Blueberry Creek) have 74 percent of the total length of their shoreline composed of natural vegetation). This is below the recommended 30 metre wide, naturally vegetated shoreline buffer target to be aimed for along 75 percent of the length of the catchment’s watercourses (see Section 4.4 of this report).
Blueberry Creek catchment headwater and tributary streams (excluding Blueberry Creek) have 71 percent of the total length of their shoreline composed of natural vegetation. This is below the recommended 30 metre wide, naturally vegetated shoreline buffer target to be aimed for along 75 percent of the length of the catchment’s watercourses (see Section 4.4 of this report).
Five of eleven sampled headwater stream sites have been modified (two are channelized; three are ditched)(see Section 3.4.2 of this report).
Land Cover
Land cover has changed across the catchment (2008 to 2014) largely as a result of an increase in the area of settlement (9 ha.) and aggregate extraction (3 ha.) and loss of woodland (6 ha.) and crop and pastureland (6 ha.)(see Section 4.1 of this report).
Wetlands have declined by 38 percent since European pre-settlement and now cover 39 percent (1561 ha.) of the catchment (in 2014). Fifteen percent (246 ha.) of these wetlands remain unevaluated/unregulated and are vulnerable to drainage and land clearing activities in the absence of any regulatory and planning controls that would otherwise protect them for the many important hydrological, social, biological and ecological functions/services/values they provide to landowners and the surrounding community (see Section 4.3 of this report).
Woodlands cover 25 percent of the catchment, which is less than the 30 percent of forest cover that is identified as the minimum threshold for sustaining forest birds and other woodland dependent species (see Section 4.2 of this report).
Water Levels
Stream flows (high, low and base) and water levels are unrecorded along Blueberry Creek.
Water Quality
Blueberry Creeksurface chemistry water quality rating is Fair to Good at the Christie Lake Road crossing. The score at this site is largely influenced by continuous, high nutrient concentrations for TKN and occassional, elevated TP concentrations along with occassional metal (Aluminium) exceedances (see Section 2.1 of this report).
Blueberry Creek instream biological water quality conditions range from Poor to Fair at the Christie Lake Road crossing. Samples are dominated with benthic invertebrate species that are moderately tolerant and tolerant to high organic pollution levels (see Section 3.3.1 of this report).
8.0 Blueberry Creek Catchment: Actions/Opportunities
Aquatic Habitat/Fisheries
Educate waterfront property owners about fish habitat requirements, spawning timing and near-shore and in-water activities that can disturb or destroy fish habitat and spawning sites.
Work with various partners, including Drummond/North Elmsley Township, landowners, the Friends of the Tay Watershed Association, Tay Valley Township and the Town of Perth on fish habitat enhancement projects in the Tay River watershed, building off of new knowledge and the recommendations as described in the report "Fish Habitat of the Tay River Watershed: Existing Conditions and Opportunities for Enhancement" (2002) prepared by MNR, RVCA, Parks Canada, and DFO.
Development
Ensure that the final recommendations of the Perth Infrastructure Master Plan are implemented such that the natural hazard and natural heritage issues within the planning area are addressed through site specific planning approvals and infrastructure servicing.
Work with approval authorities (Drummond/North Elmsley Township, Lanark County, Leeds Grenville and Lanark District Health Unit, Mississippi Rideau Septic System Office, RVCA, Tay Valley Township and Town of Perth) and landowners to consistently implement current land use planning and development policies for water quality and shoreline protection adjacent to Blueberry Creek and headwater streams in the catchment (i.e., a minimum 30 metre development setback from water).
Explore ways and means to more effectively implement and enforce conditions of land-use planning and development approval to achieve net environmental gains (particularly with respect to rehabilitating or protecting naturally vegetated shorelines and water quality).
Encourage Committees of Adjustment to take advantage of technical and environmental information and recommendations forthcoming from planning and environmental professionals.
Ongoing education and dialogue regarding the regulatory floodplain, its implementation and the effect it has on development continues to represent an opportunity to assist the public in understanding the importance of planning, which respects this natural hazard.
Municipalities in the Tay Watershed are encouraged to strengthen natural heritage and water resources official plan policies and zoning provisions (pertaining to water setbacks, frontage and naturalized shorelines and wetland protection) where deemed appropriate.
Work with Drummond/North Elmsley Township, Lanark County, Tay Valley Township, Town of Perth and agencies to ensure that development approvals around lakes and along watercourses take into consideration the protection of fish habitat (including the near-shore nursery and spawning habitat).
Utilize RVCA subwatershed and catchment reports to help develop, revise and implement official plan policies to protect surface water resources and the natural environment (including woodlands, wetlands and shoreline cover).
Land Cover
Consider reforestation of the Blueberry Creek catchment to raise the current level of forest cover (at 25 percent) above the recommended 30 percent minimum threshold that is needed to sustain woodland dependent species and woodland biodiversity on the landscape. Reaching this target will also help to improve the capacity of the forests in the catchment to reduce flooding and water-borne soil erosion, store more carbon and dampen the effects of the changing climate. Take advantage of the RVCA Trees for Tomorrow Program to achieve this on idle and/or marginal land.
Establish RVCA regulation limits around the 15 percent (246 ha.) of wetlands in the catchment that are unevaluated. Doing this will help protect landowners from natural hazards including mitigating surface water flow by storing water during periods of peak flow (such as spring snowmelt and heavy rainfall events) and releasing water during periods of low flow (this mitigation of water flow reduces flood damage), as well as contributing to the stabilization of shorelines and to the reduction of soil erosion damage through water flow mitigation and plant soil binding/retention.
Shorelines
Take advantage of the RVCA Shoreline Naturalization Program to re-naturalize altered creek and stream shoreline identified in this report as “Unnatural Riparian Land Cover". Target shoreline restoration at sites shown in orange on the Riparian Land Cover map (see Figure 55 in Section 4.4 of this report). Concentrate stewardship efforts along the headwater and tributary streams of Blueberry Creek in the catchment, which have 71 percent of the total length of their shoreline composed of natural vegetation (this is below the recommended 30 metre wide, naturally vegetated shoreline buffer target to be aimed for along 75 percent of the length of the catchment’s watercourses). Other stewardship opportunities in the catchment may be determined based on septic system inspections and surface water quality monitoring results.
Promote the use of bioengineering methods (using native shrub/tree planting, fascines, live stakes) as a shoreline erosion mitigation measure as well as a cost effective alternative to shoreline hardening (with rip rap, armour stone, gabion baskets, walls).
Educate landowners about the value and importance of natural shorelines and property best management practices with respect to shoreline use and development, septic system installation and maintenance and shoreline vegetation retention and enhancement (Drummond/North Elmsley Township, Leeds Grenville and Lanark District Health Unit, Mississippi Rideau Septic System Office, RVCA, Tay Valley Township and Town of Perth).
Water Quality
Consider further investigation of the Fair to Good surface chemistry water quality rating and Poor to Fairinstream biological water quality rating on BlueberryCreek as part of a review of RVCA's Baseline and Benthic Invertebrate surface water quality monitoring.
Offer funding provided by the RVCA Rural Clean Water Program to landowners with potential projects that could improve water quality on Blueberry Creek and its tributaries (e.g., livestock fencing, septic system repair/replacement and streambank erosion control/stabilisation).
Educate waterfront property owners about septic system care by providing information about sewage system maintenance (i.e., when to pump out septic systems and holding talks) through initiatives such as the Septic Savvy Workshop and services provided by the Mississippi Rideau Septic System Office.
Reduce pollutant loading to Blueberry Creek through education about the application of shoreline, stormwater and agricultural best management practices; also consider using low impact development (LID) methods to improve the quality and reduce the amount of stormwater runoff directly reaching the river ecosystem. This will be particularly beneficial in areas with extensive impervious surfaces (i.e., asphalt, concrete, buildings, and severely compacted soils) or on sensitive shoreline properties (with steep slopes/banks, shallow/impermeable soils).
The RVCA produces individual reports for 14 catchments in the Tay River subwatershed. Using data collected and analyzed by the RVCA through its watershed monitoring and land cover classification programs, surface water quality and in-stream conditions are reported for the Tay River, Tay Watershed lakes and Tay tributaries along with a summary of environmental conditions for the surrounding countryside every six years, which includes analysis of data collected through the programs along with local information provided by stakeholders up to 2017.
This information is used to better understand the effects of human activity on our water resources, allows us to better track environmental change over time and helps focus watershed management actions where they are needed the most to help sustain the ecosystem services (cultural, aesthetic and recreational values; provisioning of food, fuel and clean water; regulation of erosion/natural hazard protection and water purification; supporting nutrient/water cycling and habitat provision) provided by the catchment’s lands and forests and waters (Millennium Ecosystem Assessment 2005).
The following sections of this report are a compilation of that work for the Bobs and Crow Lake catchments.
Table of Contents: Bobs and Crow Lake Catchments Report
The Bobs and Crow Lake catchments reside within part of the physiographic region known as the Algonquin Highlands. In the Tay River subwatershed, this ancient and hilly geologic region is made up of such Precambrian rocks as marble, conglomerates, and dark or colour banded granite-like rocks. A veneer of glacial drift (glacial till, sand etc.) overlies the bedrock.
Drainage Area
Bobs Lake Catchment: 132 square kilometers; occupies 16 percent of the Tay River subwatershed; three percent of the Rideau Valley watershed.
Crow Lake Catchment: 51 square kilometers; occupies six percent of the Tay River subwatershed; one percent of the Rideau Valley watershed.
Stream Length
Bobs Lake Catchment: All tributaries (including headwater streams) 324 km.
Crow Lake Catchment: All tributaries (including headwater streams) 132 km.
1.2 Vulnerable Areas
Aquifer Vulnerability
Bobs Lake Catchment: Mississippi-Rideau Source Water Protection program has mapped several small parts of this catchment as Significant Groundwater Recharge Areas and all of the catchment as a Highly Vulnerable Aquifer (HVA). There are no Well-Head Protection Areas in the catchment.
Crow Lake Catchment: Mississippi-Rideau Source Water Protection program did not identify any Significant Groundwater Recharge Areas and mapped all of the catchment as a Highly Vulnerable Aquifer (HVA). There are no Well-Head Protection Areas in the catchment.
Wetland Hydrology
A watershed model developed by the RVCA in 2009 was used to study the hydrologic function of wetlands in the Rideau Valley Watershed, including those found in the Bobs and Crow Lake catchments.
1.3 Conditions at a Glance
Aggregates
Bobs Lake Catchment: Three aggregate licenses within the catchment along with some sand and gravel areas of secondary and tertiary significance.
Crow Lake Catchment: One aggregate license within the catchment.
Fish Community/Thermal Regime
Bobs Lake Catchment: Warm, cool and cold water recreational and baitfish fishery with five species observed in Davern Creek during 2016. The fish community has not been sampled extensively along streams and headwater drainage features in the Bobs Lake catchment.
Crow Lake Catchment: Warm, cool and cold water recreational and baitfish fishery. The fish community has not been sampled along streams and headwater drainage features in the Crow Lake catchment.
Headwater Drainage Features
Bobs Lake Catchment: Predominantly natural and wetland features with two features having mixed modifications and six features have been straightened, historically.
Crow Lake Catchment: Predominantly natural and wetland features with only one feature with anthropogenic modifications.
Land Cover Type (2014) - Bobs Lake Catchment
Bobs Lake Catchment
Woodland
Water
Wetland
Crop-Pasture
Meadow-Thicket
Settlement
Transportation
Percent
50
25
13
4
3
2
2
Land Cover Type (2014) - Crow Lake Catchment
Crow Lake Catchment
Woodland
Wetland
Water
Meadow-Thicket
Crop-Pasture
Settlement
Transportation
Percent
60
18
12
4
2
2
2
Land Cover Change (2008 to 2014) - Bobs Lake Catchment
Bobs Lake Catchment
Woodland
Meadow-Thicket
Crop-Pasture
Wetland
Settlement
Water
Transportation
Hectares
-20
-5
-1
+15
+5
+4
+2
Land Cover Change (2008 to 2014) - Crow Lake Catchment
Crow Lake Catchment
Woodland
Wetland
Settlement
Hectares
-6
+5
+2
Shoreline Cover Type: Bobs Lake Catchment (30 m. riparian area; 2014)
Catchment
Percent
Bobs Lake
Percent
Streams
Percent
Woodland
56
Woodland
79
Wetland
46
Wetland
32
Settlement
14
Woodland
44
Settlement
5
Transportation
3
Crop-Pasture
4
Crop-Pasture
3
Wetland
2
Meadow-Thicket
3
Transportation
2
Crop-Pasture
1
Transportation
2
Meadow-Thicket
2
Meadow-Thicket
1
Settlement
1
Shoreline Cover Type: Crow Lake Catchment (30 m. riparian area; 2014)
Catchment
Percent
Crow Lake
Percent
Streams
Percent
Woodland
56
Woodland
65
Woodland
51
Wetland
35
Settlement
21
Wetland
42
Settlement
3
Transportation
7
Meadow-Thicket
3
Meadow-Thicket
3
Wetland
4
Transportation
2
Transportation
2
Crop-Pasture
2
Crop-Pasture
1
Crop-Pasture
1
Meadow-Thicket
1
Settlement
1
Significant Natural Features
Bobs Lake Catchment
Doran Lake Provincially Significant Wetland
Green Bay Non-Provincially Significant Wetland
Maberly Bog Area of Natural and Scientific Interest, Life Science Regional Candidate
Michael's Creek Marsh Provincially Significant Wetland
Species at Risk (Elemental Occurrence)
Status
Bobs Lake Catchment
Endangered
Northern Myotis
---
---
---
---
Threatened
Blanding's Turtle
Bobolink
Cerulean Warbler
Eastern Meadowlark
Eastern Whip-poor-will
Special Concern
Bald Eagle
Common Five-lined Skink
Louisiana Waterthrush
Snapping Turtle
---
Status
Crow Lake Catchment
Endangered
Northern Myotis
---
---
---
Threatened
Bobolink
Eastern Meadowlark
Eastern Whip-poor-will
---
Special Concern
Eastern Milksnake
Eastern Ribbonsnake
Peregrine Falcon
Snapping Turtle
Water Quality (Surface Chemistry) for the Protection of Aquatic Life
Bobs Lake
Bob Lake
Bobs Lake
Bobs Lake
Bobs Lake
Bobs Lake
Bobs Lake
Bobs Lake
Crow Lake
Rock Lake
Buck Bay
Central Narrows
East Basin
Green Bay
Mill Bay
Mud Bay
Norris Bay
West Basin
Fair to Very Good
Fair to Good
Fair to Very Good
Good to Very Good
Poor to Good
Fair to Very Good
Fair to Good
Fair to Very Good
Good to Very Good
Fair to Very Good
Water Wells
Bobs Lake Catchment: Approximately 610 operational private water wells in the Bobs Lake catchment. Groundwater uses are mainly domestic but also include livestock, public and commercial uses.
Crow Lake Catchment: Approximately 140 operational private water wells in the Crow Lake catchment. Groundwater uses are mainly domestic but also include livestock and commercial uses.
1.4 Catchment Care
Environmental Management
The Greater Bobs and Crow Lake Association prepared the Stewardship Plan for Bobs and Crow Lakes (2007) to provide a summary of what is known about the Bobs and Crow Lake catchments along with the community’s vision for the lakes and a list of its main concerns and actions to address them.
Development in, and adjacent to, the Doran Lake and Michael's Creek Marsh Provincially Significant Wetlands along with the Green Bay Non-Provincially Significant Wetland in the Bobs Lake catchment is subject to Ontario Regulation 174-06 (entitled “Development, Interference with Wetlands and Alterations to Shorelines and Watercourses”) that protects the hydrologic function of the wetland and also protects landowners and their property from natural hazards (flooding, fluctuating water table, unstable soils) associated with them.
Bobs Lake catchment: One Environmental Compliance Approval was sought for a private sewage works.
Crow Lake catchment: One Environmental Compliance Approval was sought for a campground sewage works.
Environmental Monitoring
Chemical surface (in-stream/lake) water quality collection by the RVCA since 2003 (see Section 2 of this report).
Bobs Lake catchment: Thirty-nine drainage feature assessments were conducted by the RVCA in 2016 at road crossings in the catchment. The protocol measures zero, first and second order headwater drainage features and is a rapid assessment method characterizing the amount of water, sediment transport, and storage capacity within headwater drainage features (see Section 3.2 of this report).
Crow Lake catchment: Twenty-two drainage feature assessments were conducted by the RVCA in 2016 at road crossings in the catchment. The protocol measures zero, first and second order headwater drainage features and is a rapid assessment method characterizing the amount of water, sediment transport, and storage capacity within headwater drainage features. (see Section 3.3 of this report).
Classification of Bobs and Crow Lake catchment land cover types derived by the RVCA from colour aerial photography that was acquired during the spring of 2008 and 2014 (see Section 4.1 of this report).
The Mississippi Rideau Septic System Office has conducted 149 mandatory septic system inspections and 2 voluntary septic system re-inspections on 119 properties around Bobs Lake from 2004 to 2017 (see Section 5.5 of this report).
Groundwater chemistry information is available from the Ontario Geological Survey for one well (#13-AG-048) in the Bobs Lake catchment.
Stewardship
Bobs Lake catchment: Thirty-one stewardship projects were completed by landowners with assistance from the RVCA (see Section 5 of this report).
Crow Lake catchment: Sixteen stewardship projects were completed by landowners with assistance from the RVCA (see Section 5 of this report).
2.0 Bobs and Crow Lake Catchments: Water Quality Conditions
Surface water quality conditions are monitored by the Rideau Valley Conservation Authority’s (RVCA) Watershed Watch Program, which monitors watershed lakes to assess nutrient concentrations, water clarity, dissolved oxygen availability and pH. Figure 2 shows the locations of monitoring sites in the Bobs Lake catchment and Figure 3 shows the locations of monitoring sites in the Crow Lake catchment.
Figure 2 Water quality monitoring sites on Bobs and Rock Lakes
Figure 3 Water quality monitoring sites on Crow Lake
Water Quality Rating in the Bobs Lake Catchment
"Poor" indicates that water quality is frequently threatened or impaired with conditions that often depart from natural or desirable levels. A "Fair" rating indicates that water quality is usually protected but is occasionally threatened or impaired; conditions sometimes depart from natural or desirable levels. A rating of "Good" indicates that only a minor degree of threat or impairment is observed and conditions rarely depart from natural or desirable levels. ” Very Good” describes water quality as protected with virtual absence of threat or impairment; conditions are very close to natural or pristine levels. Each parameter is evaluated against established guidelines to determine water quality conditions. Those parameters that frequently exceed guidelines are presented below. Data has been analyzed over the 2006-2017 period for general trends and conditions. Table 1 shows the overall rating for the monitored surface water quality sites within the catchment and Table 2 outlines the Water Quality Index (WQI) scores and their corresponding ratings.
Table 1 Water Quality Index ratings for Bobs and Rock Lakes
Site
Location
2006-2008
2009-2011
2012-2014
2015-2017
DP1
Bobs Lake-Buck Bay
Good (88)
Fair (65)
Fair (77)
Very Good (100)
DP1
Bobs Lake-Green Bay
Good (88)
Good (88)
Very Good (100)
Good (88)
DP1
Bobs Lake-West Basin
Very Good (100)
Fair (77)
Good (88)
Very Good (100)
DP1
Bobs Lake-Mud Bay
Good (88)
Fair (65)
Fair (77)
Very Good (100)
DP1
Bobs Lake-Norris Bay
Good (88)
Good (88)
Fair (77)
Good (88)
DP1/DP3
Bobs Lake-East Basin/Long Bay
Good (88)
Fair (77)
Fair (77)
Good (88)
DP1
Bobs Lake-Central Narrows
Good (88)
Fair (77)
Fair (77)
Good (88)
DP1
Bobs Lake-Mill Bay
Poor (59)
Poor (48)
Good (88)
Fair (76)
DP1
Rock Lake
Very Good (100)
Good (88)
Fair (65)
Very Good (100)
Table 2 Water Quality Index ratings and corresponding index scores (RVCA terminology, original WQI category names in brackets)
Rating
Index Score
Very Good (Excellent)
95-100
Good
80-94
Fair
65-79
Poor (Marginal)
45-64
Very Poor (Poor)
0-44
2.1 Bobs Lake Water Quality
Surface water quality conditions in Bobs Lake have been monitored by RVCA’s Watershed Watch Program since 2006. Data from the deep point sites (DP1 & DP3) has been used to calculate the WQI ratings for Bobs Lake. In most basins (of which there are nine in Bobs Lake that are monitored), conditions were influenced by moderate nutrient concentrations, good oxygen availability and clear water. The following discussion explains how each of the monitored water quality parameters contributes to the water quality in each basin.
This report also considers data from additional shoreline sites that are monitored around the lake. These sites have not been included in the calculation of the CCME WQI rating, as they are not monitored with the same frequency as the deep point site. However, they do provide important information on water quality conditions in the near shore areas. For locations of shoreline sites please see Figure 2.
2.1.1 Bobs Lake: Buck Bay Water Quality
2.1.1.1 Buck Bay Nutrients
Total phosphorus (TP) is used as a primary indicator of excessive nutrient loading and contributes to abundant aquatic vegetation growth and depleted dissolved oxygen levels. The Provincial Water Quality Objective (PWQO) is used as the TP Guideline and states that in lakes, concentrations greater than 0.020 mg/l indicate an excessive amount of TP within the water column. Concentrations below 0.010 mg/l are generally considered to be minimal and unlikely to have problems associated with nutrient loading. Total Kjeldahl nitrogen (TKN) is used as a secondary indicator of nutrient loading. RVCA uses a guideline of 0.500 mg/l to assess TKN within surface waters1.
Nutrients at the Buck Bay Deep Point
TP and TKN sampling results collected by the RVCA are presented in Figures 3 to 6. Variability has occurred in the sampled TP concentrations at this site (Figure 3 and 4), however no significant trend2 was observed in the 2006-2017 dataset. Eighty-nine percent of samples analyzed for TP were less than the TP guideline and the average concentration was 0.013 mg/l (Table 3). TKN concentration also showed variability and an overall decline in concentrations was observed (Figures 5 and 6). Ninety-three percent of reported results were below the TKN guideline and the average TKN concentration was 0.362 mg/l (Table 3).
Figure 3 Total phosphorous sampling results at deep point site (DP1) on Buck Bay, 2006-2017
Figure 4 Average total phosphorus results at the deep point site (DP1) on Buck Bay, 2006-2017.
Figure 5 Total Kjeldahl nitrogen sampling results at deep point site (DP1) on Buck Bay, 2006-2017
Figure 6 Average total Kjeldahl nitrogen sampling results at the deep point site (DP1) on Buck Bay, 2006-2017.
Table 3 Summary of nutrient results for Buck Bay over the monitoring period, 2006-2017.
Total Phosphorous 2006-2017
Site
Average (mg/l)
Below Guideline
No. Samples
DP1
0.013
89%
44
Total Kjeldahl Nitrogen 2006-2017
Site
Average (mg/l)
Below Guideline
No. Samples
DP1
0.362
93%
44
Overall, the data presented indicates that nutrient concentrations may be considered moderate with few instances of exceedance in the mid-lake, deep water site on Buck Bay.
Nutrients around Buck Bay
The average nutrient concentrations at monitored shoreline sites around the lake vary from year to year (Figures 7 and 8). Please note that in the 2006-2017 monitoring period only site A was sampled yearly; sites B, C and D were sampled in 2008 and 2013.
Average total phosphorous concentrations are below the TP guideline at all sites for all years monitored. The opposite is true for average TKN concentrations that exceed the guideline at all monitored sites. Site A is in a busy area near the entrance to Buck Bay from West Basin where increased boat traffic and sediment disturbance may contribute to the elevated results.
Figure 7 Average total phosphorous concentrations at shoreline monitoring sites on Buck Bay, 2006-2017.
Figure 8 Average total Kjeldahl nitrogen concentrations at shoreline monitoring sites on Buck Bay, 2006-2017
Summary of Buck Bay Nutrients
Buck Bay nutrient concentrations are generally below the guidelines, with few exceedances. It is possible that occasional problems with nutrient enrichment (i.e. algal blooms or excessive plant growth) may be observed in shallow, sheltered bays.
Efforts such as the diversion of runoff and enhanced shoreline buffers are important to continue to protect and enhance water quality and reduce future nutrient increases. This is particularly important for roadways and dwellings that boarder the lake. Nutrient exceedances may be partially attributed to the natural aging of a lake and basin characteristics. All residents can help minimize their impact on the lake by reducing nutrient inputs through practices such as proper maintenance of septic systems, keeping shorelines natural and using phosphate free soaps and detergents. Promotion of sound stewardship and protection around lake are important to maintain and protect water quality conditions into the future.
2.1.1.2 Buck Bay Water Clarity
Water clarity is measured using a Secchi disk during each deep point sample. Table 4 summarizes the recorded depths with an average depth of 4.7 m and shows that all readings have exceeded the minimum PWQO of 2 m indicating that algae in the water column is not at excessive levels (good water clarity). Less than 2 m will indicate overproduction in a lake or significant inputs to the water column that are limiting light availability. Figure 9 shows that no individual reading has been below the guideline and measured depths range from 2.1 m to 7.25 m. No trend was observed within the 2006-2017 data set, indicating that Secchi depths have not changed significantly over this period.
Table 4 Summary of Secchi depths recorded at the deep point (DP1) on Buck Bay, 2006-2017.
Secchi 2006-2017
Site
Average (m)
Above Guideline
No. Samples
DP1
4.7
100%
42
Figure 9 Recorded Secchi depths at the deep point site (DP1) on Buck Bay, 2006-2017.
Summary of Buck Bay Water Clarity
Waters in Buck Bay are very clear and sufficient sunlight is able to penetrate the water column to support aquatic life and provide sufficient visibility for safe recreational use (boating, swimming).
2.1.1.3 Buck Bay Fish Habitat
Two other factors, dissolved oxygen/temperature and pH were also assessed to provide an overall sense of the health of Buck Bay from a fish habitat perspective.
2.1.1.3.1 Buck Bay Dissolved Oxygen and Temperature
The red bars in Figure 10 show the depths where suitable conditions exist for warm water fish species (temperature less than 25°C and dissolved oxygen greater than 4 mg/l) at the deep point site. The vertical axis represents the total lake depth at each site where the profile is taken. Suitable conditions typically decline throughout the summer to about 11 m of the water column. Overall, no significant change was noted in conditions through the 2006-2017 period.
Figure 10. Depths suitable for warm water fish species at the deep point site (DP1) on Buck Lake, 2006-2017.
2.1.1.3.2 Buck Bay pH
pH is a basic water quality parameter used to assess the acidity of water, an important factor for aquatic life. Figure 11 shows monitored pH values over the 2006-2017 period.
Figure 11. pH concentrations at the deep point site (DP1) on Buck Bay, 2006-2017.
The majority of samples for both time periods were within guidelines established by the Canadian Council of Minister's of the Environment which state that pH should be between 6.5 and 9 to protect aquatic life (Table 5). Surface water’s that are found to be more alkaline (higher pH) are common in many regions of the Tay River subwatershed and can generally be attributed to the geology rather than anthropogenic activities. Biological activities such as increased photosynthesis from algal blooms and plant growth may also influence pH.
Table 5 Summary of pH results at the deep point site (DP1) on Buck Bay, 2006-2017
pH 2006-2017
Site
Average (mg/l)
Within Guideline
No. Samples
DP1
7.9
97%
38
Summary of Water Quality for Fish Habitat in Buck Bay
Overall the water chemistry data at the deep point describes suitable habitat conditions for fish species such as bass, walleye and pike. There is some evidence that the warming of the water column in the late summer/fall and limited oxygen availability at deeper depths may minimize the amount of habitat for some more sensitive species. pH conditions are within the end of the range recommended for the protection of aquatic life. Overall, the data indicates a healthy environment for aquatic species.
2.1.1.4 Buck Bay E. Coli
E. coli is sampled at monitored shoreline sites twice each sampling season. E. coli data was not used in the calculations of the WQI rating for the lake due to differences in sampling frequency and site locations, the results are summarized in Table 6. Throughout the 2006-2017 period 97 percent of samples were below the E. coli guideline of 100 colony forming units (CFU) per 100 ml set by the PWQO; across the lake the count at the geometric mean3 was 6 CFU/100ml (Table 6).
Table 6 Summary of E. coli results for Buck Bay, 2006-2017
E. coli 2006-2017
Site
Geometric mean (CFU/100ml)
Below Guideline
No. Samples
A-D
6
97%
39
Figure 12 show the distribution of counts across all shoreline sites. Site A is the only site monitored each year and typically has minimal counts and indicates that bacterial pollution should not be a concern. All sites fell well below the guideline of 100 CFU/100ml.
Figure 12 Geometric mean of shoreline sites monitored on Buck Bay, 2006-2017
Summary of Buck Bay Bacterial Contamination
The results presented above provide evidence that bacterial contamination is not a significant concern in Buck Bay and the water should be safe for recreational use such as swimming and boating.
2.1.2 Bobs Lake: Green Bay Water Quality
2.1.2.1 Green Bay Nutrients
Total phosphorus (TP) is used as a primary indicator of excessive nutrient loading and contributes to abundant aquatic vegetation growth and depleted dissolved oxygen levels. The Provincial Water Quality Objective (PWQO) is used as the TP Guideline and states that in lakes, concentrations greater than 0.020 mg/l indicate an excessive amount of TP within the water column. Concentrations below 0.010 mg/l are generally considered to be minimal and unlikely to have problems associated with nutrient loading. Total Kjeldahl nitrogen (TKN) is used as a secondary indicator of nutrient loading. RVCA uses a guideline of 0.500 mg/l to assess TKN within surface waters.
Nutrients at the Green Bay Deep Point
TP and TKN sampling results collected by the RVCA are presented in Figures 13 to 16. Variability has occurred in the sampled TP concentrations at this site (Figure 13 and 14), however no significant trend was observed in the 2006-2017 dataset. TP results for Green Bay are consistently low, all samples analyzed for TP were less than the TP guideline and the average concentration was 0.009 mg/l (Table 7). TKN concentration also showed variability; however, similar to TP results no trend was observed (Figures 15 and 16). Ninety-five percent of reported results were below the TKN guideline and the average TKN concentration was 0.314 mg/l (Table 7).
Figure 13 Total phosphorus samples results at the deep point site (DP1) on Green Bay, 2006-2017
Figure 14 Average total phosphorus results at the deep point site (DP1) on Green Bay, 2006-2017.
Figure 15 Total Kjeldahl nitrogen sampling results at deep point site (DP1) on Green Bay, 2006-2017
Figure 16 Average total Kjeldahl nitrogen results at the deep point site (DP1) on Green Bay, 2006-2017.
Table 7 Summary of nutrient results for Green Bay over the monitoring period, 2006-2017.
Total Phosphorous 2006-2017
Site
Average (mg/l)
Below Guideline
No. Samples
DP1
0.009
100%
44
Total Kjeldahl Nitrogen 2003-2008
Site
Average (mg/l)
Below Guideline
No. Samples
DP1
0.314
95%
44
Overall, the data presented indicates that nutrient concentrations may be considered very low with few instances of exceedance in the mid-lake, deep water site on Green Bay.
Nutrients around Green Bay
The average nutrient concentrations at monitored shoreline sites around the lake vary from year to year (Figures 17 and 18). Please note that in the 2006-2017 monitoring period only sites D, F, and H were sampled yearly; sites A, B, C, E, G and I were sampled in 2008 and 2013.
Average total phosphorous concentrations are below the TP guideline at all sites; site D tends to have elevated results relative to other sites though results can still be considered low to moderate (Figure 17). Average TKN concentrations were also below the guideline at all monitored sites; as with TP concentrations, TKN is also slightly elevated at site D relative to other monitored sites (Figure 18). Site D is in a shallow portion of the bay in close proximity to a roadway, it is possible that runoff from this road is contributing to elevated nutrient concentrations at this site.
Figure 17 Average total phosphorous concentrations at shoreline monitoring sites on Green Bay, 2006-2017.
Figure 18 Average total Kjeldahl nitrogen concentrations at shoreline monitoring sites on Green Bay, 2006-2017.
Summary of Green Bay Nutrients
Green Bay nutrient concentrations are generally below the guidelines, with very instances of elevated results. It is possible that occasional problems with nutrient enrichment (i.e. algal blooms or excessive plant growth) may be observed in shallow, sheltered bays or following periods of heavy runoff.
Green Bay nutrient concentrations are generally below the guidelines, with very instances of elevated results. It is possible that occasional problems with nutrient enrichment (i.e. algal blooms or excessive plant growth) may be observed in shallow, sheltered bays or following periods of heavy runoff.
Efforts such as the diversion of runoff and enhanced shoreline buffers are important to continue to protect and enhance water quality and reduce future nutrient increases. This is particularly important for roadways and dwellings that boarder the lake. Nutrient exceedances may be partially attributed to the natural aging of a lake and basin characteristics. All residents can help minimize their impact on the lake by reducing nutrient inputs through practices such as proper maintenance of septic systems, keeping shorelines natural and using phosphate free soaps and detergents. Promotion of sound stewardship and protection around lake are important to maintain and protect water quality conditions into the future.
2.1.2.2 Green Bay Water Clarity
Water clarity is measured using a Secchi disk during each deep point sample. Table 8 summarizes the recorded depths with an average depth of 5.1 m and shows that all readings have exceeded the minimum PWQO of 2m indicating that algae in the water column is not at excessive levels (good water clarity). Less than 2 m will indicate overproduction in a lake or significant inputs to the water column that are limiting light availability. Figure 19 shows that no individual reading has been below the guideline and measured depths range from 2.9 m to 7.9 m. No trend was observed within the 2006-2017 data set, indicating that Secchi depths have not change significantly over this period.
Table 8 Summary of Secchi depths recorded at the deep point (DP1) on Green Bay, 2006-2017.
Secchi 2006-2017
Site
Average (m)
Above Guideline
No. Samples
DP1
5.1
100%
41
Figure 19 Recorded Secchi depths at the deep point site (DP1) on Green Bay, 2006-2017.
Summary of Green Bay Water Clarity
Waters in Green Bay are very clear and sufficient sunlight is able to penetrate the water column to support aquatic life and provide sufficient visibility for safe recreational use (boating, swimming).
2.1.2.3 Green Bay Fish Habitat
Two other factors, dissolved oxygen/temperature and pH were also assessed to provide an overall sense of the health of Green Bay from a fish habitat perspective.
2.1.2.3.1 Green Bay Dissolved Oxygen and Temperature
The red bars in Figure 20 show the depths where suitable conditions exist for warm water fish species (temperature less than 25°C and dissolved oxygen greater than 4 mg/l) at the deep point site. The vertical axis represents the total lake depth at each site where the profile is taken. Suitable conditions typically decline throughout the summer to about 21 m of the water column. Overall, no significant change was noted in conditions through the 2006-2017 period.
Figure 20 Depths suitable for warm water fish species at the deep point site (DP1) on Green Bay, 2006-2017.
2.1.2.3.2 Green Bay pH
pH is a basic water quality parameter used to assess the acidity of water, an important factor for aquatic life. Figure 21 shows monitored pH values over the 2006-2017 period.
Figure 21 pH concentrations at the deep point sites (DP1) on Green Bay, 2006-2017.
The majority of samples (95%, table 9) for both time periods were within guidelines established by the Canadian Council of Minister's of the Environment which state that pH should be between 6.5 and 9 to protect aquatic life. Surface water’s that are found to be more alkaline (higher pH) are common in many regions of the Tay River subwatershed and can generally be attributed to the geology rather than anthropogenic activities. Biological activities such as increased photosynthesis from algal blooms and plant growth may also influence pH.
Table 9 Summary of pH results at the deep point site (DP1) on Green Bay 2006-2017
pH 2006-2017
Site
Average (mg/l)
Within Guideline
No. Samples
DP1
8.2
95%
38
Summary of Water Quality for Fish Habitat in Green Bay
Overall the water chemistry data at the deep point describes suitable habitat conditions for fish species such as bass, walleye and pike. There is some evidence that the warming of the water column in the late summer/fall and limited oxygen availability at deeper depths may minimize the amount of habitat for some more sensitive species. pH conditions are within the end of the range recommended for the protection of aquatic life. Overall, the data indicates a healthy environment for aquatic species.
2.1.2.4 Green Bay E. Coli
E. coli is sampled at monitored shoreline sites twice each sampling season. E. coli data was not used in the calculations of the WQI rating for the lake due to differences in sampling frequency and site locations, the results are summarized in Table 10. Throughout the 2006-2017 period 99 percent of samples were below the E. coli guideline of 100 colony forming units (CFU) per 100 ml set by the PWQO; across the lake the count at the geometric mean was only 3 CFU/100ml (Table 10).
Table 10 Summary of E. coli results for Green Bay, 2006-2017
E. coli 2006-2017
Site
Geometric mean (CFU/100ml)
Below Guideline
No. Samples
A-I
3
99%
79
Figure 22 Geometric mean of shoreline sites monitored on Green Bay, 2006-2017
Figure 22 shows the distribution of counts across all shoreline sites. All sites fall well below the guideline of 100 CFU/100ml; site F does have elevated results relative to other monitored locations. However, counts have been variable from year to year and as previously noted the geometric mean in any year does not exceed the guideline, therefore these results do not indicate reason for concern. Given the proximity of agricultural lands to this site it is possible that runoff from livestock or manure application may be contributing to the occasional periods of elevated results. Improving natural shoreline cover, buffers and fencing along this shore may help reduce runoff from surrounding land uses.
Summary of Green Bay Bacterial Contamination
The results presented above provide evidence that bacterial contamination is not a significant concern in Green Bay and the water should be safe for recreational use such as swimming and boating.
2.1.3 Bobs Lake: West Basin Water Quality
2.1.3.1 West Basin Nutrients
Total phosphorus (TP) is used as a primary indicator of excessive nutrient loading and contributes to abundant aquatic vegetation growth and depleted dissolved oxygen levels. The Provincial Water Quality Objective (PWQO) is used as the TP Guideline and states that in lakes, concentrations greater than 0.020 mg/l indicate an excessive amount of TP within the water column. Concentrations below 0.010 mg/l are generally considered to be minimal and unlikely to have problems associated with nutrient loading. Total Kjeldahl nitrogen (TKN) is used as a secondary indicator of nutrient loading. RVCA uses a guideline of 0.500 mg/l to assess TKN within surface waters.
Nutrients at the West Basin Deep Point
TP and TKN sampling results collected by the RVCA are presented in Figures 23 to 26. Variability has occurred in the sampled TP concentrations at this site (Figure 23 and 24), however no significant trend was observed in the 2006-2017 dataset. TP results for West Basin may be considered minimal, 96 percent of samples analyzed for TP were less than the TP guideline and the average concentration was 0.010 mg/l (Table 11). TKN concentration also showed variability; however similar to TP results no trend was observed (Figures 25 and 26). Ninety-three percent of reported results were below the TKN guideline and the average TKN concentration was 0.360 mg/l (Table 11).
Figure 23 Total phosphorus sampling results at deep point site (DP1) in the West Basin, 2006-2017
Figure 24 Average total phosphorus results at the deep point site (DP1) in the West Basin, 2006-2017.
Figure 25 Total Kjeldahl nitrogen sampling results at deep point site (DP1) in the West Basin, 2006-2017
Figure 26 Average total Kjeldahl nitrogen results at the deep point site (DP1) in the West Basin, 2006-2017.
Table 11 Summary of nutrient results for West Basin over the monitoring period, 2006-2017.
Total Phosphorous 2006-2017
Site
Average (mg/l)
Below Guideline
No. Samples
DP1
0.010
96%
45
Total Kjeldahl Nitrogen 2006-2017
Site
Average (mg/l)
Below Guideline
No. Samples
DP1
0.360
93%
45
Overall, the data presented indicates that nutrient concentrations may be considered very low with few instances of elevated samples in the mid-lake, deep water site in the West Basin.
Nutrients around West Basin
The average nutrient concentrations at monitored shoreline sites around the lake vary from year to year (Figures 27 and 28). Please note that in the 2006-2017 monitoring period only sites A and B were sampled yearly; sites C, D, E, F, G, and H were sampled in 2008 and 2013, site K was sampled in 2008, 2013, 2015 and 2017.
Average total phosphorous concentrations are below the TP guideline at the majority of sites with instances of elevated concentrations at sites B and K (Figure 27). Average TKN concentrations were also below the guideline at all monitored sites; as with TP results elevated concentrations are also observed at sites B and K (Figure 28). Both of these sites are located at inflow locations and it is possible that runoff from surrounding areas is contributing to elevated concentrations.
Figure 27 Average total phosphorous concentrations at shoreline monitoring sites on West Basin, 2006-2017.
Figure 28 Average total Kjeldahl nitrogen concentrations at shoreline monitoring sites on West Basin, 2006-2017.
Summary of West Basin Nutrients
West Basin nutrient concentrations are generally below the guidelines, with few samples having elevated results. It is possible that occasional problems with nutrient enrichment (i.e. algal blooms or excessive plant growth) may be observed in shallow, sheltered bays or following periods of heavy runoff.
Efforts such as the diversion of runoff and enhanced shoreline buffers are important to continue to protect and enhance water quality and reduce future nutrient increases. This is particularly important for roadways and dwellings that boarder the lake. Nutrient exceedances may be partially attributed to the natural aging of a lake and basin characteristics. All residents can help minimize their impact on the lake by reducing nutrient inputs through practices such as proper maintenance of septic systems, keeping shorelines natural and using phosphate free soaps and detergents. Promotion of sound stewardship and protection around lake and throughout the catchment are important to maintain and protect water quality conditions into the future.
2.1.3.2 West Basin Water Clarity
Water clarity is measured using a Secchi disk during each deep point sample. Table 12 summarizes the recorded depths with an average depth of 4.2 m and shows that all readings have exceeded the minimum PWQO of 2m indicating that algae in the water column is not at excessive levels (good water clarity). Less than 2 m will indicate overproduction in a lake or significant inputs to the water column that are limiting light availability. Figure 29 shows that no individual reading has been below the guideline and measured depths range from 2.8 m to 6 m. No trend was observed within the 2006-2017 data set, indicating that Secchi depths have not change significantly over this period.
Table 12 Summary of Secchi depths recorded at the deep point (DP1) on West Basin, 2006-2017.
Secchi 2006-2017
Site
Average (m)
Above Guideline
No. Samples
DP1
4.2
100%
44
Figure 29 Recorded Secchi depths at the deep point site (DP1) on West Basin, 2006-2017.
Summary of West Basin Water Clarity
Waters in West Basin are very clear and sufficient sunlight is able to penetrate the water column to support aquatic life and provide sufficient visibility for safe recreational use (boating, swimming).
2.1.3.3 West Basin Fish Habitat
Two other factors, dissolved oxygen/temperature and pH were also assessed to provide an overall sense of the health of West Basin from a fish habitat perspective.
2.1.3.3.1 West Basin Dissolved Oxygen and Temperature
The red bars in Figure 30 show the depths where suitable conditions exist for warm water fish species (temperature less than 25°C and dissolved oxygen greater than 4 mg/l) at the deep point site. The vertical axis represents the total lake depth at each site where the profile is taken. Suitable conditions typically decline throughout the late summer/fall to about 17 m of the water column. Overall, no significant change was noted in conditions through the 2006-2017 period.
Figure 30 Depths suitable for warm water fish species at the deep point site (DP1) on West Basin, 2006-2017.
2.3.3.3.2 West Basin pH
pH is a basic water quality parameter used to assess the acidity of water, an important factor for aquatic life. Figure 31 shows monitored pH values over the 2006-2017 period.
Figure 31 pH concentrations at the deep point sites (DP1) on West Basin, 2006-2017.
All samples (100%, table 13) were within guidelines established by the Canadian Council of Minister's of the Environment which state that pH should be between 6.5 and 9 to protect aquatic life. A slight decline was noted in pH values. Anthropogenic and biological activities such as increased photosynthesis from algal blooms and plant growth may act to influence pH.
Table 13 Summary of pH results at the deep point site (DP1) on West Basin, 2006-2017
pH 2006-2017
Site
Average (mg/l)
Within Guideline
No. Samples
DP1
8.00
100%
39
Summary of Water Quality for Fish Habitat in West Basin
Overall the water chemistry data at the deep point describes suitable habitat conditions for fish species such as bass, walleye and pike. There is some evidence that the warming of the water column in the late summer/fall and limited oxygen availability at deeper depths may minimize the amount of habitat for some more sensitive species. pH conditions are within the range recommended for the protection of aquatic life. Overall, the data indicates a healthy environment for aquatic species.
2.1.3.4 West Basin E. Coli
E. coli is sampled at monitored shoreline sites twice each sampling season. E. coli data was not used in the calculations of the WQI rating for the lake due to differences in sampling frequency and site locations, the results are summarized in Table 14. Throughout the 2006-2017 period 97 percent of samples were below the E. coli guideline of 100 colony forming units (CFU) per 100 ml set by the PWQO; across the lake the count at the geometric mean was 7 CFU/100ml (Table 14).
Table 14 Summary of E. coli results for West Basin, 2006-2017
E. coli 2006-2017
Site
Geometric mean (CFU/100ml)
Below Guideline
No. Samples
A-K
7
97%
78
Figure 32 Geometric mean of shoreline sites monitored on West Basin, 2006-2017
Figure 32 shows the distribution of counts across all shoreline sites. All sites fell well below the guideline of 100 CFU/100ml, site B does have elevated results relative to other monitored locations. However, counts have been variable from year to year and as previously noted the geometric mean in any year does not exceed the guideline. This same site also had elevated nutrient concentrations and is the inflow from Eagle Creek, it may be beneficial to examine if possible sources of nutrient/bacterial contamination could be minimized at this site to protect existing conditions and prevent against future deterioration.
Summary of West Basin E. Coli
The results presented above provide evidence that bacterial contamination is not a significant concern in West Basin and the water should be safe for recreational use such as swimming and boating.
2.1.4 Bobs Lake: Norris Bay Water Quality
2.1.4.1 Norris Bay Nutrients
Total phosphorus (TP) is used as a primary indicator of excessive nutrient loading and contributes to abundant aquatic vegetation growth and depleted dissolved oxygen levels. The Provincial Water Quality Objective (PWQO) is used as the TP Guideline and states that in lakes, concentrations greater than 0.020 mg/l indicate an excessive amount of TP within the water column. Concentrations below 0.010 mg/l are generally considered to be minimal and unlikely to have problems associated with nutrient loading. Total Kjeldahl nitrogen (TKN) is used as a secondary indicator of nutrient loading. RVCA uses a guideline of 0.500 mg/l to assess TKN within surface waters.
Nutrients at the Norris Bay Deep Point
TP and TKN sampling results collected by the RVCA are presented in Figures 33 to 36. Variability has occurred in the sampled TP concentrations at this site (Figure 33 and 34), however no significant trend was observed in the 2006-2017 dataset. TP results for Norris Bay are very low, 95 percent of samples analyzed for TP were less than the TP guideline and the average concentration was 0.011mg/l (Table 15). TKN concentration also showed variability; however similar to TP results no trend was observed (Figures 35 and 36). Ninety-eight percent of reported results were below the TKN guideline and the average TKN concentration was 0.344 mg/l (Table 15).
Figure 33 Total phosphorus sampling results at deep point site (DP1) on Norris Bay, 2006-2017
Figure 34 Average total phosphorus results at the deep point site (DP1) on Norris Bay, 2006-2017.
Figure 35 Total Kjeldahl nitrogen sampling results at deep point site (DP1) on Norris Bay, 2006-2017
Figure 36 Average total Kjeldahl nitrogen results at the deep point site (DP1) on Norris Bay, 2006-2017.
Table 15 Summary of nutrient results for Norris Bay over the monitoring period, 2006-2017.
Total Phosphorous 2006-2017
Site
Average (mg/l)
Below Guideline
No. Samples
DP1
0.011
95%
43
Total Kjeldahl Nitrogen 2006-2017
Site
Average (mg/l)
Below Guideline
No. Samples
DP1
0.344
98%
43
Overall, the data presented indicates that nutrient concentrations may be considered very low with few instances of elevated samples in the deep water site in Norris Bay.
Nutrients around Norris Bay
The average nutrient concentrations at monitored shoreline sites around the lake vary from year to year (Figures 37 and 38). Please note that in the 2006-2017 shoreline sites A, B, C and D were only sampled in 2008 and 2013.
Average total phosphorous concentrations are below the TP guideline at all sites withe the exception of site A in both monitoring years (Figure 37), this site is out the outlet of the lake and elevated concentrations may result from increased loading periods. Average TKN concentrations were below the guideline at all monitored sites in 2008; in 2013 average results exceeded the guideline at all sites except C.
Figure 37 Average total phosphorous concentrations at shoreline monitoring sites on Norris Bay, 2006-2017.
Figure 38 Average total Kjeldahl nitrogen concentrations at shoreline monitoring sites on Norris Bay, 2006-2017.
Summary of Norris Bay Nutrients
Nutrient concentrations in Norris Bay are inconsistent, and results have had variability between the two monitoring years. It is possible that occasional problems with nutrient enrichment (i.e. algal blooms or excessive plant growth) may be observed in shallow, sheltered bays or following periods of heavy runoff.
Norris Bay includes the outlet to the lake it has increased potential for nutrient loading. Efforts such as the diversion of runoff and enhanced shoreline buffers are important to continue to protect and enhance water quality and reduce future nutrient increases. It is particularly important for roadways and dwellings that boarder the lake. Nutrient exceedances may be partially attributed to the natural aging of a lake and basin characteristics. All residents can help minimize their impact on the lake by reducing nutrient inputs through practices such as proper maintenance of septic systems, keeping shorelines natural and using phosphate free soaps and detergents. Promotion of sound stewardship and protection around lake and throughout the catchment are important to maintain and protect water quality conditions into the future.
2.1.4.2 Norris Bay Water Clarity
Water clarity is measured using a Secchi disk during each deep point sample. Table 16 summarizes the recorded depths with an average depth of 4.5 m and shows that all readings have exceeded the minimum PWQO of 2m indicating that algae in the water column is not at excessive levels (good water clarity). Less than 2 m will indicate overproduction in a lake or significant inputs to the water column that are limiting light availability. Figure 39 shows that no individual reading has been below the guideline and measured depths range from 2.5 m to 7.5 m. No trend was observed within the 2006-2017 data set, indicating that Secchi depths have not change significantly over this period.
Table 16 Summary of Secchi depths recorded at the deep point (DP1) on Norris Bay, 2006-2017.
Secchi 2006-2017
Site
Average (m)
Above Guideline
No. Samples
DP1
4.5
100%
41
Figure 39 Recorded Secchi depths at the deep point site (DP1) on Norris Bay, 2006-2017.
Summary of Norris Bay Water Clarity
Waters in Norris Bay are very clear and sufficient sunlight is able to penetrate the water column to support aquatic life and provide sufficient visibility for safe recreational use (boating, swimming).
2.1.4.3 Norris Bay Fish Habitat
Two other factors, dissolved oxygen/temperature and pH were also assessed to provide an overall sense of the health of Norris Bay from a fish habitat perspective.
2.1.4.3.1 Norris Bay Dissolved Oxygen and Temperature
The red bars in Figure 40 show the depths where suitable conditions exist for warm water fish species (temperature less than 25°C and dissolved oxygen greater than 4 mg/l) at the deep point site. The vertical axis represents the total lake depth at each site where the profile is taken. Suitable conditions typically decline throughout the late summer to about 7.5 m of the water column, habitat conditions were very limited in 2007, 2010 and 2015. Overall, no significant change was noted in conditions through the 2006-2017 period.
Figure 40 Depths suitable for warm water fish species at the deep point site (DP1) on Norris Bay, 2006-2017.
2.1.4.3.2 Norris Bay pH
pH is a basic water quality parameter used to assess the acidity of water, an important factor for aquatic life. Figure 41 shows monitored pH values over the 2006-2017 period.
Figure 41 pH concentrations at the deep point sites (DP1) on Norris Bay, 2006-2017.
All samples (100%, table 17) were within guidelines established by the Canadian Council of Minister's of the Environment which state that pH should be between 6.5 and 9 to protect aquatic life. A slight decline was noted in pH values. Anthropogenic and biological activities such as increased photosynthesis from algal blooms and plant growth may act to influence pH.
Table 17 Summary of pH results at the deep point site (DP1) on Norris Bay, 2006-2017
pH 2006-2017
Site
Average (mg/l)
Within Guideline
No. Samples
DP1
8.0
100%
34
Summary of Water Quality for Fish Habitat in Norris Bay
Overall the water chemistry data at the deep point describes suitable habitat conditions for fish species such as bass, walleye and pike. There is some evidence that the warming of the water column in the late summer and limited oxygen availability at deeper depths may minimize the amount of habitat for some more sensitive species. pH conditions are within the range recommended for the protection of aquatic life. Overall, the data indicates a healthy environment for aquatic species.
2.1.4.4 Norris Bay E. Coli
E. coli is sampled at monitored shoreline sites twice each sampling season. E. coli data was not used in the calculations of the WQI rating for the lake due to differences in sampling frequency and site locations, the results are summarized in Table 18. Throughout the 2006-2017 period 82 percent of samples were below the E. coli guideline of 100 colony forming units (CFU) per 100 ml set by the PWQO; across the lake the count at the geometric mean was 9 CFU/100ml (Table 18).
Table 18 Summary of E. coli results for Norris Bay, 2006-2017
E. coli 2006-2017
Site
Geometric mean (CFU/100ml)
Below Guideline
No. Samples
A-D
9
82%
11
Figure 42 Geometric mean of shoreline sites monitored on Norris Bay, 2006-2017
Figure 42 shows the distribution of counts across all shoreline sites. Site A and B have shown to have higher counts, which just meet or exceed the E. coli guideline, site B does have elevated results relative to other monitored locations. However, monitoring at the sites on Norris Bay has been infrequent, and given the limited number of samples it is difficult to make a conclusion on bacterial counts. Consideration should be given to increasing the frequency of monitoring at these sites, particularly A and B.
Summary of Norris Bay Bacterial Contamination
The results presented above provide evidence that bacterial contamination is not a significant concern at site C on Norris Bay and the water should be safe for recreational use such as swimming and boating. More data is required to assess bacterial concentrations at sites A, B and D.
2.1.5. Bobs Lake: East Basin/Long Bay
2.1.5.1 East Basin/Long Bay Nutrients
Total phosphorus (TP) is used as a primary indicator of excessive nutrient loading and contributes to abundant aquatic vegetation growth and depleted dissolved oxygen levels. The Provincial Water Quality Objective (PWQO) is used as the TP Guideline and states that in lakes, concentrations greater than 0.020 mg/l indicate an excessive amount of TP within the water column. Concentrations below 0.010 mg/l are generally considered to be minimal and unlikely to have problems associated with nutrient loading. Total Kjeldahl nitrogen (TKN) is used as a secondary indicator of nutrient loading. RVCA uses a guideline of 0.500 mg/l to assess TKN within surface waters.
Nutrients at the East Basin/Long Bay Deep Points
TP and TKN sampling results collected by the RVCA are presented in Figures 43 to 46. Variability has occurred in the sampled TP concentrations at this site (Figure 43 and 44), a slight decline in TP concentrations was observed in the 2006-2017 dataset. TP results for East Basin/Long Bay are very low, 94 percent of samples analyzed for TP were less than the TP guideline and the average concentration was 0.010 mg/l (Table 19). TKN concentration also showed variability; no trend was observed in TKN concentratons (Figures 45 and 46). Ninety-five percent of reported results were below the TKN guideline and the average TKN concentration was 0.345 mg/l (Table 19).
Figure 43 Total phosphorus sampling results at the deep point sites (DP1 and DP3) in East Basin and Long Bay, 2006-2017
Figure 44 Average total phosphorus results at the deep point sites (DP1 and DP3) on East Basin and Long Bay, 2006-2017.
Figure 45 Total Kjeldahl nitrogen sampling results at the deep point sites (DP1 and DP3) in East Bain and Long Bay, 2006-2017.
Figure 46 Average total Kjeldahl nitrogen results at the deep point sites (DP1 and DP3) on East Basin and Long Bay, 2006-2017.
Table 19 Summary of nutrient results for East Basin and Long Bay over the monitoring period, 2006-2017.
Total Phosphorous 2006-2017
Site
Average (mg/l)
Below Guideline
No. Samples
DP1
0.010
94%
86
Total Kjeldahl Nitrogen 2006-2017
Site
Average (mg/l)
Below Guideline
No. Samples
DP1
0.345
95%
86
Overall, the data presented indicates that nutrient concentrations may be considered very low with few instances of elevated samples in the deep water site in Norris Bay.
Nutrients around East Basin/Long Bay
The average nutrient concentrations at monitored shoreline sites around the lake vary from year to year (Figures 47 and 48). Please note that in the 2006-2017 shoreline sites A, C, E and F were only sampled in 2008 and 2013, sites B and D were sampled each year.
Average total phosphorous concentrations are below the TP guideline at all sites withe the exception of site B in 2009 (Figure 47), this site is at the mouth of a small creek that flows into the lake, temporary elevated concentrations may have resulted from a period of high runoff. Average TKN concentrations were below the guideline at all monitored sites with the exception of site B also in 2009 and site D in 2014 (Figure 48). Site D is in a small bay with wetland influences, nitrogen rich soils are associated with wetlands and are likely contributing to elevated concentrations at this site.
Figure 47 Average total phosphorous concentrations at shoreline monitoring sites on East Basin/Long Bay, 2006-2017.
Figure 48 Average total Kjeldahl nitrogen concentrations at shoreline monitoring sites on East Basin/Long Bay, 2006-2017.
Summary of East Basin/Long Bay Nutrients
Nutrient concentrations in East Basin/Long Bay are generally below guidelines with few exceedances. There is evidence of periods of elevated nutrients and sites B and D, but as elevated concentrations are not observed every year it is likely that this are isolated events. It is possible that occasional problems with nutrient enrichment (i.e. algal blooms or excessive plant growth) may be observed in both these shallow, sheltered bays or following periods of heavy runoff.
Efforts such as the diversion of runoff and enhanced shoreline buffers are important to continue to protect and enhance water quality and reduce future nutrient increases. For instance the close proximity of a road way near site B increases the potential for runoff. Nutrient exceedances may be partially attributed to the natural aging of a lake and basin characteristics. All residents can help minimize their impact on the lake by reducing nutrient inputs through practices such as proper maintenance of septic systems, keeping shorelines natural and using phosphate free soaps and detergents. Promotion of sound stewardship and protection around lake and throughout the catchment are important to maintain and protect water quality conditions into the future.
2.1.5.2 East Basin/Long Bay Water Clarity
Water clarity is measured using a Secchi disk during each deep point sample. Table 20 summarizes the recorded depths with an average depth of 4.7 m and shows that all readings have exceeded the minimum PWQO of 2m indicating that algae in the water column is not at excessive levels (good water clarity). Less than 2 m will indicate overproduction in a lake or significant inputs to the water column that are limiting light availability. Figure 49 shows that no individual reading has been below the guideline and measured depths range from 2.3 m to 7.5 m. No trend was observed within the 2006-2017 data set, indicating that Secchi depths have not change significantly over this period.
Table 20 Summary of Secchi depths recorded at the deep point sites (DP1 and DP3) on East Basin/Long Bay, 2006-2017.
Secchi 2006-2017
Site
Average (m)
Above Guideline
No. Samples
DP1
4.7
100%
83
Figure 49 Recorded Secchi depths at the deep point sites (DP1 and DP3) on East Basin/Long Bay, 2006-2017.
Summary of East Basin/Long Bay Water Clarity
Waters in East Basin/Long Bay are very clear and sufficient sunlight is able to penetrate the water column to support aquatic life and provide sufficient visibility for safe recreational use (boating, swimming).
2.1.5.3 East Basin/Long Bay Fish Habitat
Two other factors, dissolved oxygen/temperature and pH were also assessed to provide an overall sense of the health of East Basin/Long Bay from a fish habitat perspective.
2.1.5.3.1 East Basin/Long Bay Dissolved Oxygen and Temperature
The red bars in Figure 50 show the depths where suitable conditions exist for warm water fish species (temperature less than 25°C and dissolved oxygen greater than 4 mg/l) at the deep point site. The vertical axis represents the total lake depth at each site where the profile is taken. Suitable conditions typically decline throughout the late summer to about 8 m of the water column, habitat conditions were very limited in 2009 and 2010. Through the 2006-2017 period and increasing trend was observed in dissolved oxygen concentrations.
Figure 50 Depths suitable for warm water fish species at the deep point sites (DP1 and DP3) on East Basin/Long Bay, 2006-2017.
2.1.5.3.2 East Basin/Long Bay pH
pH is a basic water quality parameter used to assess the acidity of water, an important factor for aquatic life. Figure 51 shows monitored pH values over the 2006-2017 period.
Figure 51 pH concentrations at the two deep point sites (DP1 and DP3) on East Basin/Long Bay, 2006-2017.
The majority of samples (97%, table 21) were within guidelines established by the Canadian Council of Minister's of the Environment which state that pH should be between 6.5 and 9 to protect aquatic life. A slight decline was noted in pH values. Anthropogenic and biological activities such as increased photosynthesis from algal blooms and plant growth may act to influence pH.
Table 21 Summary of pH results at the two deep point sites (DP1 and DP3) on East Basin/Long Bay, 2006-2017
pH 2006-2017
Site
Average (mg/l)
Within Guideline
No. Samples
DP1
7.9
97%
33
Summary of Water Quality for Fish Habitat in East Basin/Long Bay
Overall the water chemistry data at the deep point describes suitable habitat conditions for fish species such as bass, walleye and pike. There is some evidence that the warming of the water column in the late summer and limited oxygen availability at deeper depths may minimize the amount of habitat for some more sensitive species. pH conditions are within the range recommended for the protection of aquatic life. Overall, the data indicates a healthy environment for aquatic species.
2.1.5.4 East Basin/Long Bay E. Coli
E. coli is sampled at monitored shoreline sites twice each sampling season. E. coli data was not used in the calculations of the WQI rating for the lake due to differences in sampling frequency and site locations, the results are summarized in Table 22. Throughout the 2006-2017 period 100 percent of samples were below the E. coli guideline of 100 colony forming units (CFU) per 100 ml set by the PWQO; across the lake the count at the geometric mean was 6 CFU/100ml (Table 22).
Table 22 Summary of E. coli results for East Basin/Long Bay, 2006-2017
E. coli 2006-2017
Site
Geometric mean (CFU/100ml)
Below Guideline
No. Samples
A-F
6
100%
50
Figure 52 Geometric mean of shoreline sites monitored on East Basin/Long Bay, 2006-2017
Figure 52 shows the distribution of counts across all shoreline sites. Sites B and D are monitored each year, while sites A, C, E and F were only monitored in 2008 and 2013, results at all sites were well below the guideline.
Summary of East Basin/Long Bay Bacterial Contamination
The results presented above provide evidence that bacterial contamination is not a significant concern in East Basin/Long Bay and the water should be safe for recreational use such as swimming and boating.
2.1.6 Bobs Lake: Central Narrows Water Quality
2.1.6.1 Central Narrows Nutrients
Total phosphorus (TP) is used as a primary indicator of excessive nutrient loading and contributes to abundant aquatic vegetation growth and depleted dissolved oxygen levels. The Provincial Water Quality Objective (PWQO) is used as the TP Guideline and states that in lakes, concentrations greater than 0.020 mg/l indicate an excessive amount of TP within the water column. Concentrations below 0.010 mg/l are generally considered to be minimal and unlikely to have problems associated with nutrient loading. Total Kjeldahl nitrogen (TKN) is used as a secondary indicator of nutrient loading. RVCA uses a guideline of 0.500 mg/l to assess TKN within surface waters.
Nutrients at the Central Narrows Deep Point
TP and TKN sampling results collected by the RVCA are presented in Figures 53 to 56. Variability has occurred in the sampled TP concentrations at this site (Figure 53 and 54), however there has been no significant increase or decrease in sampled concentrations. TP results for Central Narrows are low, 89 percent of samples analyzed for TP were less than the TP guideline and the average concentration was 0.011 mg/l (Table 23). TKN concentration also showed variability; as with TP concentration no trend was observed for this parameter (Figures 55 and 56). Ninety-three percent of reported results were below the TKN guideline and the average TKN concentration was 0.352 mg/l (Table 23).
Figure 53 Total phosphorus sampling results at the deep point site (DP1) in Central Narrows, 2006-2017
Figure 54 Average total phosphorus results at the deep point site (DP1) in Central Narrows
Figure 55 Total Kjeldahl nitrogen sampling results at the deep point site (DP1) in Central Narrows, 2006-2017.
Figure 56 Average total Kjeldahl nitrogen results at the deep point site (DP1) on Central Narrows, 2006-2017.
Table 23 Summary of nutrient results for Central Narrows over the monitoring period, 2006-2017.
Total Phosphorous 2006-2017
Site
Average (mg/l)
Below Guideline
No. Samples
DP1
0.011
89%
44
Total Kjeldahl Nitrogen 2006-2017
Site
Average (mg/l)
Below Guideline
No. Samples
DP1
0.352
93%
44
Overall, the data presented indicates that nutrient concentrations may be considered very low with few instances of elevated samples in the deep water site in Central Narrows.
Nutrients around Central Narrows
The average nutrient concentrations at the monitored shoreline sites around the lake vary from year to year (Figures 57 and 58). Please note that there is only one site, A, monitored in this basin. Sampling is completed every fifth year, therefore data is only available from 2008 and 2013 within the 2006-2017 period.
Average total phosphorous concentrations were below the TP guideline in both monitoring years (Figure 57). The TP concentrations was higher in 2013 compared to 2008, however given the limited data it is not possible to say if if this is indicative of a significant change. Average TKN concentrations were below the guideline in both sampling years and concentrations were fairly comparable (Figure 58). Given that deep point nutrient concentrations have not shown any significant changes and samples at site A have been below guidelines, nutrient enrichment does not appear to be a concern in the nearshore area of Central Narrows.
Figure 57 Average total phosphorous concentrations at the shoreline monitoring site in Central Narrows, 2006-2017.
Figure 58 Average total Kjeldahl nitrogen concentrations at the shoreline monitoring sites in Central Narrows, 2006-2017.
Summary of Central Narrows Nutrients
Nutrient concentrations in Central Narrows are generally below guidelines with few exceedances. There have been some instances of elevated nutrients at the deep point, but are inconsistent and do not point to a trend of increasing nutrient concentrations. It is possible that occasional problems with nutrient enrichment (i.e. algal blooms or excessive plant growth) may be observed in shallow, sheltered bays or following periods of heavy runoff.
Efforts such as the diversion of runoff and enhanced shoreline buffers are important to continue to protect and enhance water quality and reduce future nutrient increases. Nutrient exceedances may be partially attributed to the natural aging of a lake and basin characteristics. All residents can help minimize their impact on the lake by reducing nutrient inputs through practices such as proper maintenance of septic systems, keeping shorelines natural and using phosphate free soaps and detergents. Promotion of sound stewardship and protection around lake and throughout the catchment are important to maintain and protect water quality conditions into the future.
2.1.6.2 Central Narrows Water Clarity
Water clarity is measured using a Secchi disk during each deep point sample. Table 24 summarizes the recorded depths with an average depth of 4.3 m and shows that all readings have exceeded the minimum PWQO of 2m indicating that algae in the water column is not at excessive levels (good water clarity). Less than 2 m will indicate overproduction in a lake or significant inputs to the water column that are limiting light availability. Figure 59 shows that no individual reading has been below the guideline and measured depths range from 2.8 m to 6 m. No trend was observed within the 2006-2017 data set, indicating that Secchi depths have not change significantly over this period.
Table 24 Summary of Secchi depths recorded at the deep point site (DP1) in Central Narrows, 2006-2017.
Secchi 2006-2017
Site
Average (m)
Above Guideline
No. Samples
DP1
4.3
100%
35
Figure 59 Recorded Secchi depths at the deep point site (DP1) on Central Narrows, 2006-2017.
Summary of Central Narrows Water Clarity
Waters in Central Narrows are very clear and sufficient sunlight is able to penetrate the water column to support aquatic life and provide sufficient visibility for safe recreational use (boating, swimming).
2.1.6.3 Central Narrows Fish Habitat
Two other factors, dissolved oxygen/temperature and pH were also assessed to provide an overall sense of the health of Central Narrows from a fish habitat perspective.
2.1.6.3.1 Central Narrows Dissolved Oxygen and Temperature
The red bars in Figure 60 show the depths where suitable conditions exist for warm water fish species (temperature less than 25°C and dissolved oxygen greater than 4 mg/l) at the deep point site. The vertical axis represents the total lake depth at each site where the profile is taken. Suitable conditions typically decline throughout the late summer/fall to approximately 10m of the water column, habitat conditions were very limited in 2009. Through the 2006-2017 period there was no significant change in habitat conditions (dissolved oxygen/temperature).
Figure 60 Depths suitable for warm water fish species at the deep point site (DP1) on Central Narrows, 2006-2017.
2.1.6.3.2 Central Narrows pH
pH is a basic water quality parameter used to assess the acidity of water, an important factor for aquatic life. Figure 61 shows monitored pH values over the 2006-2017 period.
Figure 61 pH concentrations at the two deep point site (DP1) in Central Narrows, 2006-2017.
The majority of samples (97%, Table 25) were within guidelines established by the Canadian Council of Minister's of the Environment which state that pH should be between 6.5 and 9 to protect aquatic life. A slight decline was noted in pH values. Anthropogenic and biological activities such as increased photosynthesis from algal blooms and plant growth may act to influence pH.
Table 25 Summary of pH results at the two deep point site (DP1) in Central Narrows, 2006-2017
pH 2006-2017
Site
Average (mg/l)
Within Guideline
No. Samples
DP1
7.96
97%
33
Summary of Water Quality in Central Narrows for Fish habitat
Overall the water chemistry data at the deep point describes suitable habitat conditions for fish species such as bass, walleye and pike. There is some evidence that the warming of the water column in the late summer and limited oxygen availability at deeper depths may minimize the amount of habitat for some more sensitive species. pH conditions are within the range recommended for the protection of aquatic life. Overall, the data indicates a healthy environment for aquatic species.
2.1.6.4 Central Narrows E. Coli
E. coli is sampled at monitored shoreline sites twice each sampling season. E. coli data was not used in the calculations of the WQI rating for the lake due to differences in sampling frequency and site locations, the results are summarized in Table 26. As previously noted the site A is the only shoreline site monitored in this basin and is limited to results from 2008 and 2013. The results indicate that 100 percent of samples were below the E. coli guideline of 100 colony forming units (CFU) per 100 ml set by the PWQO; across the lake the count at the geometric mean was 2.5 CFU/100ml (Table 26).
Table 26 Summary of E. coli results for Central Narrows, 2006-2017
E. coli 2006-2017
Site
Geometric mean (CFU/100ml)
Below Guideline
No. Samples
A
2.5
100%
4
Figure 62 Geometric mean of shoreline sites monitored in Central Narrows, 2006-2017
Figure 62 shows the distribution of counts across all shoreline sites. Please note that results are based on a minimal number of samples (Table 26), all results were well below the guideline.
Summary of Central Narrows Bacterial Contamination
The results presented above provide evidence that bacterial contamination is not a significant concern in Central Narrows and the water should be safe for recreational use such as swimming and boating.
2.1.7 Bobs Lake: Mill Bay Water Quality
2.1.7.1 Mill Bay Nutrients
Total phosphorus (TP) is used as a primary indicator of excessive nutrient loading and contributes to abundant aquatic vegetation growth and depleted dissolved oxygen levels. The Provincial Water Quality Objective (PWQO) is used as the TP Guideline and states that in lakes, concentrations greater than 0.020 mg/l indicate an excessive amount of TP within the water column. Concentrations below 0.010 mg/l are generally considered to be minimal and unlikely to have problems associated with nutrient loading. Total Kjeldahl nitrogen (TKN) is used as a secondary indicator of nutrient loading. RVCA uses a guideline of 0.500 mg/l to assess TKN within surface waters.
Nutrients at the Mill Bay Deep Points
TP and TKN sampling results collected by the RVCA are presented in Figures 63 to 66. Variability has occurred in the sampled TP concentrations at this site with particularly high average concentrations were observed in 2006 and 2016, it appears that in both these years elevated results were due to a single sample that is uncharacteristically high (Figure 63 and 64). Overall, there has been no significant increase or decrease in sampled concentrations. TP results for Mill Bay are typically low, 85 percent of samples analyzed for TP were less than the TP guideline and the average concentration was 0.016 mg/l (Table 27). TKN concentration also showed variability; as with TP concentration no trend was observed for this parameter (Figures 65 and 66). Seventy-four percent of reported results were below the TKN guideline and the average TKN concentration was 0.439 mg/l (Table 27).
Figure 63 Total phosphorus sampling results at the deep point site (DP1) in Mill Bay, 2006-2017.
Figure 64 Average total phosphorus results at the deep point site (DP1) in Mill Bay, 2006-2017.
Figure 65 Total Kjeldahl nitrogen sampling results at the deep point site (DP1) in Mill Bay, 2006-2017.
Figure 66 Average total Kjeldahl nitrogen results at the deep point site (DP1) in Mill Bay, 2006-2017.
Table 27 Summary of nutrient results for Mill Bay over the monitoring period, 2006-2017.
Total Phosphorous 2006-2017
Site
Average (mg/l)
Below Guideline
No. Samples
DP1
0.016
85%
39
Total Kjeldahl Nitrogen 2006-2017
Site
Average (mg/l)
Below Guideline
No. Samples
DP1
0.439
74%
39
Overall, the data presented indicates that nutrient concentrations may be considered low with occasional reports of elevated samples at the deep water site on Mill Bay.
Nutrients around Mill Bay
The average nutrient concentrations at the monitored shoreline sites around the lake vary from year to year (Figures 67 and 68). Please note that there are only two sites monitored in this basin, A and B. Yearly sampling is completed at site B and every fifth year at site A; therefore data is only available from 2008 and 2013 for site A within the 2006-2017 period.
Average total phosphorous concentrations are inconsistent at site B, and exceeded the guideline in 2012 and 2013, concentrations have been lower in subsequent years (Figure 67). All results at site A have been below the guideline. Average TKN concentrations typically exceed the guideline (Figure 68). This may be the result of inflow from wetlands, re-suspension of nutrients in the shallow bay and runoff from developed shorelines.
Figure 67 Average total phosphorous concentrations at the shoreline monitoring site in Mill Bay, 2006-2017.
Figure 68 Average total Kjeldahl nitrogen concentrations at the shoreline monitoring sites in Mill Bay, 2006-2017.
Summary of Mill Bay Nutrients
Nutrient concentrations in Mill Bay are generally below guidelines with elevated concentrations being more common at monitored shoreline sites. It is possible that occasional problems with nutrient enrichment (i.e. algal blooms or excessive plant growth) may be observed in shallow, sheltered bays or following periods of heavy runoff.
Efforts such as the diversion of runoff and enhanced shoreline buffers are important to continue to protect and enhance water quality and reduce future nutrient increases. Nutrient exceedances may be partially attributed to the natural aging of a lake and basin characteristics. All residents can help minimize their impact on the lake by reducing nutrient inputs through practices such as proper maintenance of septic systems, keeping shorelines natural and using phosphate free soaps and detergents. Promotion of sound stewardship and protection around lake and throughout the catchment are important to maintain and protect water quality conditions into the future.
2.1.7.2 Mill Bay Water Clarity
Water clarity is measured using a Secchi disk during each deep point sample. Table 28 summarizes the recorded depths with an average depth of 3.3 m and shows that all readings have exceeded the minimum PWQO of 2m indicating that algae in the water column is not at excessive levels (good water clarity). Less than 2 m will indicate overproduction in a lake or significant inputs to the water column that are limiting light availability. Figure 69 shows that no individual reading has been below the guideline and measured depths range from 2.3 m to 5 m. No trend was observed within the 2006-2017 data set, indicating that Secchi depths have not change significantly over this period.
Table 28 Summary of Secchi depths recorded at the deep point site (DP1) on Mill Bay, 2006-2017.
Secchi 2006-2017
Site
Average (m)
Above Guideline
No. Samples
DP1
3.3
100%
35
Figure 69 Recorded Secchi depths at the deep point site (DP1) on Mill Bay, 2006-2017.
Summary of Mill Bay Water Clarity
Waters in Mill Bay are very clear and sufficient sunlight is able to penetrate the water column to support aquatic life and provide sufficient visibility for safe recreational use (boating, swimming).
2.1.7.3 Mill Bay Fish Habitat
Two other factors, dissolved oxygen/temperature and pH were also assessed to provide an overall sense of the health of Mill Bay from a fish habitat perspective.
2.1.7.3.1 Mill Bay Dissolved Oxygen and Temperature
The red bars in Figure 70 show the depths where suitable conditions exist for warm water fish species (temperature less than 25°C and dissolved oxygen greater than 4 mg/l) at the deep point site. The vertical axis represents the total lake depth at each site where the profile is taken. Suitable conditions typically exist to about 3m within the water column. Through the 2006-2017 period there was no significant change in habitat conditions (dissolved oxygen/temperature).
Figure 70 Depths suitable for warm water fish species at the deep point site (DP1) on Mill Bay, 2006-2017.
2.1.7.3.2 Mill Bay pH
pH is a basic water quality parameter used to assess the acidity of water, an important factor for aquatic life. Figure 71 shows monitored pH values over the 2006-2017 period.
Figure 71 pH concentrations at the deep point site (DP1) in Mill Bay, 2006-2017.
The majority of samples (97%, table 29) were within guidelines established by the Canadian Council of Minister's of the Environment which state that pH should be between 6.5 and 9 to protect aquatic life. No significant change was observed in pH results over the 2006-2017 period.
Table 29 Summary of pH results at the deep point site (DP1) in Mill Bay, 2006-2017
pH 2006-2017
Site
Average (mg/l)
Within Guideline
No. Samples
DP1
8.3
97%
34
Summary of Water Quality for Fish Habitat in Mill Bay
Overall the water chemistry data at the deep point describes suitable habitat conditions for fish species such as bass, walleye and pike. There is some evidence that the warming of the water column in the late summer and limited oxygen availability at deeper depths may minimize the amount of habitat for some more sensitive species. pH conditions are within the range recommended for the protection of aquatic life. Overall, the data indicates a healthy environment for aquatic species.
2.1.7.4 Mill Bay E. Coli
E. coli is sampled at monitored shoreline sites twice each sampling season. E. coli data was not used in the calculations of the WQI rating for the lake due to differences in sampling frequency and site locations, the results are summarized in Table 30. The results indicate that 100 percent of samples were below the E. coli guideline of 100 colony forming units (CFU) per 100 ml set by the PWQO; across the lake the count at the geometric mean was 3.6 CFU/100ml (Table 30)
Table 30 Summary of E. coli results for Mill Bay, 2006-2017
E. coli 2006-2017
Site
Geometric mean (CFU/100ml)
Below Guideline
No. Samples
A-B
3.6
100%
24
Figure 72 Geometric mean of shoreline sites monitored in Mill Bay, 2006-2017
Figure 72 shows the distribution of counts across all shoreline sites. Please note that results are based on a minimal number of samples (Table 30), all results were well below the guideline.
Summary of Mill Bay Bacterial Contamination
The results presented above provide evidence that bacterial contamination is not a significant concern in Mill Bay and the water should be safe for recreational use such as swimming and boating.
2.1.8 Bobs Lake: Mud Bay Water Quality
2.1.8.1 Mud Bay Nutrients
Total phosphorus (TP) is used as a primary indicator of excessive nutrient loading and contributes to abundant aquatic vegetation growth and depleted dissolved oxygen levels. The Provincial Water Quality Objective (PWQO) is used as the TP Guideline and states that in lakes, concentrations greater than 0.020 mg/l indicate an excessive amount of TP within the water column. Concentrations below 0.010 mg/l are generally considered to be minimal and unlikely to have problems associated with nutrient loading. Total Kjeldahl nitrogen (TKN) is used as a secondary indicator of nutrient loading. RVCA uses a guideline of 0.500 mg/l to assess TKN within surface waters.
Nutrients at the Mud Bay Deep Point
TP and TKN sampling results collected by the RVCA are presented in Figures 73 to 76. Variability has occurred in the sampled TP concentrations at this site with particularly high samples observed in 2010, 2011 and 2013. Though these results provide an example of occasional exceedances, yearly average concentrations are below guidelines and there has been no significant trend detected (Figure 73 and 74). Overall, TP results for Mud Bay are typically low, 88 percent of samples analyzed for TP were less than the TP guideline and the average concentration was 0.013 mg/l (Table 31). TKN concentration also showed variability; as with TP concentration no trend was observed for this parameter (Figures 75 and 76). Ninety-five percent of reported results were below the TKN guideline and the average TKN concentration was 0.355 mg/l (Table 31).
Figure 73 Total phosphorus sampling results at the deep point site (DP1) in Mud Bay, 2006-2017.
Figure 74 Average total phosphorus results at the deep point site (DP1) in Mud Bay, 2006-2017.
Figure 75 Total Kjeldahl nitrogen sampling results at the deep point site (DP1) in Mud Bay, 2006-2017.
Figure 76 Average total Kjeldahl nitrogen results at the deep point site (DP1) in Mud Bay, 2006-2017.
Table 31 Summary of nutrient results for Mud Bay over the monitoring period, 2006-2017.
Total Phosphorous 2006-2017
Site
Average (mg/l)
Below Guideline
No. Samples
DP1
0.013
88%
43
Total Kjeldahl Nitrogen 2006-2017
Site
Average (mg/l)
Below Guideline
No. Samples
DP1
0.355
95%
42
Overall, the data presented indicates that nutrient concentrations may be considered low with occasional reports of elevated samples at the deep water site on Mud Bay.
Nutrients around Mud Bay
The average nutrient concentrations at most monitored shoreline sites around the lake vary from year to year (Figures 77 and 78). Please note that site B is the only shoreline site monitored yearly in Mud Bay. Sites A, C and D are monitored every fifth year; therefore data is only available from 2008 and 2013 for site within the 2006-2017 period. The exception to this is site A which was monitored in 2006.
Average total phosphorous concentrations are inconsistent at site B and are typically greater than TP concentrations at other sites, though have not exceeded the guideline (Figure 77). Average TKN concentrations reflect a similar pattern to TP concentrations and all average concentrations are below the guideline (Figure 78).
Figure 77 Average total phosphorous concentrations at the shoreline monitoring site in Mud Bay, 2006-2017.
Figure 78 Average total Kjeldahl nitrogen concentrations at the shoreline monitoring sites in Mud Bay, 2006-2017.
Summary of Mud Bay Nutrients
Nutrient concentrations in Mud Bay are generally below guidelines with elevated concentrations being more common at monitored shoreline sites. It is possible that occasional problems with nutrient enrichment (i.e. algal blooms or excessive plant growth) may be observed in shallow, sheltered bays or following periods of heavy runoff.
Efforts such as the diversion of runoff and enhanced shoreline buffers are important to continue to protect and enhance water quality and reduce future nutrient increases. Nutrient exceedances may be partially attributed to the natural aging of a lake and basin characteristics. All residents can help minimize their impact on the lake by reducing nutrient inputs through practices such as proper maintenance of septic systems, keeping shorelines natural and using phosphate free soaps and detergents. Promotion of sound stewardship and protection around lake and throughout the catchment are important to maintain and protect water quality conditions into the future.
2.1.8.2 Mud Bay Water Clarity
Water clarity is measured using a Secchi disk during each deep point sample. Table 32 summarizes the recorded depths with an average depth of 4.7 m and shows that all readings have exceeded the minimum PWQO of 2m indicating that algae in the water column is not at excessive levels (good water clarity). Less than 2 m will indicate overproduction in a lake or significant inputs to the water column that are limiting light availability. Figure 79 shows that no individual reading has been below the guideline and measured depths have been variable ranging from 2.6 m to 8 m. Overall, no trend was observed within the 2006-2017 data set, indicating that Secchi depths have not change significantly over this period.
Table 32 Summary of Secchi depths recorded at the deep point site (DP1) on Mud Bay, 2006-2017.
Secchi 2006-2017
Site
Average (m)
Above Guideline
No. Samples
DP1
4.7
100%
40
Figure 79 Recorded Secchi depths at the deep point site (DP1) on Mud Bay, 2006-2017.
Summary of Mud Bay Nutrients
Waters in Mud Bay are very clear and sufficient sunlight is able to penetrate the water column to support aquatic life and provide sufficient visibility for safe recreational use (boating, swimming).
2.1.8.3 Mud Bay Fish Habitat
Two other factors, dissolved oxygen/temperature and pH were also assessed to provide an overall sense of the health of Mud Bay from a fish habitat perspective.
2.1.8.3.1 Mud Bay Dissolved Oxygen and Temperature
The red bars in Figure 80 show the depths where suitable conditions exist for warm water fish species (temperature less than 25°C and dissolved oxygen greater than 4 mg/l) at the deep point site. The vertical axis represents the total lake depth at each site where the profile is taken. Suitable conditions typically exist to about 6m within the water column. In 2007, 2010 and 2011 measurements in the late summer showed very limited conditions. Overall, through the 2006-2017 period there was no significant change in habitat conditions (dissolved oxygen/temperature).
Figure 80 Depths suitable for warm water fish species at the deep point site (DP1) on Mud Bay, 2006-2017.
2.1.8.3.2 Mud Bay pH
pH is a basic water quality parameter used to assess the acidity of water, an important factor for aquatic life. Figure 81 shows monitored pH values over the 2006-2017 period.
Figure 81. pH concentrations at the deep point site (DP1) in Mud Bay, 2006-2017.
All samples (Table 33) were within guidelines established by the Canadian Council of Minister's of the Environment which state that pH should be between 6.5 and 9 to protect aquatic life. No significant change was observed in pH results over the 2006-2017 period.
Table 33 Summary of pH results at the deep point site (DP1) in Mud Bay, 2006-2017
pH 2006-2017
Site
Average (mg/l)
Within Guideline
No. Samples
DP1
8.1
100%
34
Summary of Water Quality in Mud Bay for Fish Habitat
Overall the water chemistry data at the deep point describes suitable habitat conditions for warm water fish. There is some evidence that the warming of the water column in the late summer that may minimize the amount of habitat for some more sensitive species. pH conditions are within the range recommended for the protection of aquatic life. Overall, the data indicates a healthy environment for aquatic species.
2.1.8.4 Mud Bay E. Coli
E. coli is sampled at monitored shoreline sites twice each sampling season. E. coli data was not used in the calculations of the WQI rating for the lake due to differences in sampling frequency and site locations, the results are summarized in Table 34. The results indicate that 100 percent of samples were below the E. coli guideline of 100 colony forming units (CFU) per 100 ml set by the PWQO; across the lake the count at the geometric mean was 3.0 CFU/100ml (Table 34)
Table 34 Summary of E. coli results for Mud Bay, 2006-2017
E. coli 2006-2017
Site
Geometric mean (CFU/100ml)
Below Guideline
No. Samples
A-D
3
100%
27
Figure 82 Geometric mean of shoreline sites monitored in Mud Bay, 2006-2017
Figure 82 shows the distribution of counts across all shoreline sites. Please note that results are based on a minimal number of samples (Table 34), all results were well below the guideline.
Summary of Mud Bay Bacterial Contamination
The results presented above provide evidence that bacterial contamination is not a significant concern in Mud Bay and the water should be safe for recreational use such as swimming and boating.
2.2 Rock Lake Water Quality
2.2.1 Rock Lake Nutrients
Total phosphorus (TP) is used as a primary indicator of excessive nutrient loading and contributes to abundant aquatic vegetation growth and depleted dissolved oxygen levels. The Provincial Water Quality Objective (PWQO) is used as the TP Guideline and states that in lakes, concentrations greater than 0.020 mg/l indicate an excessive amount of TP within the water column. Concentrations below 0.010 mg/l are generally considered to be minimal and unlikely to have problems associated with nutrient loading. Total Kjeldahl nitrogen (TKN) is used as a secondary indicator of nutrient loading. RVCA uses a guideline of 0.500 mg/l to assess TKN within surface waters.
Nutrients at the Rock Lake Deep Points
TP and TKN sampling results collected by the RVCA are presented in Figures 83 to 86. Concentrations have shown some variability from year to year, but overall the sample mean has been well below the guideline, there has been no significant trend in TP based on sampling results (Figure 83 and 84). Overall, TP results for Mud Bay are very low, 95 percent of samples analyzed for TP were less than the TP guideline and the average concentration was 0.009 mg/l (Table 35). TKN results showed a declining trend in concentrations (Figures 85 and 86). Ninety-eight percent of reported results were below the TKN guideline and the average TKN concentration was 0.343 mg/l (Table 35).
Figure 83 Total phosphorus sampling results at the deep point site (DP1) in Rock Lake, 2006-2017.
Figure 84 Average total phosphorus results at the deep point site (DP1) in Rock Lake 2006-2017.
Figure 85 Total Kjeldahl nitrogen sampling results at the deep point site (DP1) in Rock Lake, 2006-2017.
Figure 86 Average total Kjeldahl nitrogen results at the deep point site (DP1) in Rock Lake 2006-2017.
Table 35 Summary of nutrient results for Rock Lake over the monitoring period, 2006-2017.
Total Phosphorous 2006-2017
Site
Average (mg/l)
Below Guideline
No. Samples
DP1
0.009
95%
44
Total Kjeldahl Nitrogen 2003-2008
Site
Average (mg/l)
Below Guideline
No. Samples
DP1
0.343
98%
44
Overall, the data presented indicates that nutrient concentrations may be considered minimal with very few instances of elevated samples at the deep water site on Rock Lake.
Summary of Rock Lake Nutrients
Nutrient concentrations in Rock Lake are below guidelines with elevated concentrations being very rare. It is possible that occasional problems with nutrient enrichment (i.e. algal blooms or excessive plant growth) may be observed in shallow, sheltered bays or following periods of heavy runoff.
Efforts such as the diversion of runoff and enhanced shoreline buffers are important to continue to protect and enhance water quality and reduce future nutrient increases. Nutrient exceedances may be partially attributed to the natural aging of a lake and basin characteristics. All residents can help minimize their impact on the lake by reducing nutrient inputs through practices such as proper maintenance of septic systems, keeping shorelines natural and using phosphate free soaps and detergents. Promotion of sound stewardship and protection around lake and throughout the catchment are important to maintain and protect water quality conditions into the future.
2.2.2 Rock Lake Water Clarity
Water clarity is measured using a Secchi disk during each deep point sample. Table 36 summarizes the recorded depths with an average depth of 4.1 m and shows that all readings have exceeded the minimum PWQO of 2m indicating that algae in the water column is not at excessive levels (good water clarity). Less than 2 m will indicate overproduction in a lake or significant inputs to the water column that are limiting light availability. Figure 87 shows that no individual reading has been below the guideline and measured depths have been variable ranging from 2.5 m to 6.5 m. Overall, no trend was observed within the 2006-2017 data set, indicating that Secchi depths have not change significantly over this period.
Table 36 Summary of Secchi depths recorded at the deep point site (DP1) on Rock Lake, 2006-2017.
Secchi 2006-2017
Site
Average (m)
Above Guideline
No. Samples
DP1
4.1
100%
40
Figure 87 Recorded Secchi depths at the deep point site (DP1) on Rock Lake, 2006-2017.
Summary of Rock Lake Water Clarity
Waters in Rock Lake are very clear and sufficient sunlight is able to penetrate the water column to support aquatic life and provide sufficient visibility for safe recreational use (boating, swimming).
2.2.3 Rock Lake Fish Habitat
Two other factors, dissolved oxygen/temperature and pH were also assessed to provide an overall sense of the health of Rock Lake from a fish habitat perspective.
2.2.3.1 Rock Lake Dissolved Oxygen and Temperature
The red bars in Figure 88 show the depths where suitable conditions exist for warm water fish species (temperature less than 25°C and dissolved oxygen greater than 4 mg/l) at the deep point site. The vertical axis represents the total lake depth at each site where the profile is taken. Suitable conditions typically exist to about 24m within the water column. Through the 2006-2017 period there was no significant change in habitat conditions (dissolved oxygen/temperature).
Figure 88 Depths suitable for warm water fish species at the deep point site (DP1) on Rock Lake, 2006-2017.
2.2.3.2 Rock Lake pH
pH is a basic water quality parameter used to assess the acidity of water, an important factor for aquatic life. Figure 89 shows monitored pH values over the 2006-2017 period.
Figure 89. pH concentrations at the deep point site (DP1) in Rock Lake, 2006-2017.
The majority of samples (95%, table 37) were within guidelines established by the Canadian Council of Minister's of the Environment which state that pH should be between 6.5 and 9 to protect aquatic life. No significant change was observed in pH results over the 2006-2017 period.
Table 37 Summary of pH results at the deep point site (DP1) in Rock Lake, 2006-2017
pH 2006-2017
Site
Average (mg/l)
Within Guideline
No. Samples
DP1
7.4
95%
37
Summary of Water Quality for Fish Habitat in Rock Lake
Overall the water chemistry data at the deep point describes suitable habitat conditions for fish species such as bass, walleye and pike. There is some evidence that the warming of the water column in the late summer that may minimize the amount of habitat for some more sensitive species. pH conditions are within the range recommended for the protection of aquatic life. Overall, the data indicates a healthy environment for aquatic species.
2.3 Crow Lake Water Quality
Surface water quality conditions in Crow Lake have been monitored by RVCA’s Watershed Watch Program since 2003. Data from the deep point sites (DP1) have been used to calculate the WQI rating for Crow Lake, which averaged “Good-Very Good” over the 2006-2017 period (Table 38). Low nutrient concentrations, good oxygen availability and clear water all influenced this rating. The following discussion explains how each of the monitored water quality parameters contributes to the lake’s water quality.
This report also considers data from 10 additional shoreline sites that are monitored around the lake. These sites have not been included in the calculation of the CCME WQI rating, as they are not monitored with the same frequency as the deep point site. However, they do provide important information on water quality conditions in the near shore areas. For locations of the deep point and shoreline sites (A-J) please see Figure 3.
Table 38 Water Quality Index rating for Crow Lake
Site
Location
2006-2008
2009-2011
2012-2014
2015-2017
DP1
Crow Lake
Good (88)
Fair (65)
Good (88)
Very Good (100)
2.3.1 Crow Lake Nutrients
Total phosphorus (TP) is used as a primary indicator of excessive nutrient loading and contributes to abundant aquatic vegetation growth and depleted dissolved oxygen levels. The Provincial Water Quality Objective (PWQO) is used as the TP Guideline and states that in lakes, concentrations greater than 0.020 mg/l indicate an excessive amount of TP within the water column. Concentrations below 0.010 mg/l are generally considered to be minimal and unlikely to have problems associated with nutrient loading.
Total Kjeldahl nitrogen (TKN) is used as a secondary indicator of nutrient loading. RVCA uses a guideline of 0.500 mg/l to assess TKN[1] within surface waters.
Nutrients at the Crow Lake Deep Point
TP and TKN sampling results collected by the RVCA are presented in Figures 90 to 93. Some variability has occurred in the sampled TP concentrations at this site (Figure 90 and 91), no significant trend[2] was observed in the 2006-2017 dataset. Ninety-three percent of samples analyzed for TP were less than the TP guideline and the average concentration was 0.010 mg/l (Table 39). TKN concentration also showed variability as with TP concentrations no significant change was observed (Figures 92 and 93). Ninety-five percent of reported results were below the TKN guideline and the average TKN concentration was very low at 0.298 mg/l (Table 39).
Figure 90 Total phosphorous sampling results at deep point site on Crow Lake, 2006-2017.
Figure 91 Average total phosphorous results at deep point site on Crow Lake, 2006-2017.
Figure 92 Total Kjeldahl nitrogen sampling results at deep point site on Crow Lake, 2006-2017
Figure 93 Average total Kjeldahl nitrogen sampling results at the deep point site on Crow Lake, 2006-2017
Table 39 Summary of nutrient results for Crow Lake over the monitoring period, 2006-2017.
Total Phosphorous 2006-2017
Site
Average (mg/l)
Below Guideline
No. Samples
DP1
0.010
93%
44
Total Kjeldahl Nitrogen 2006-2017
Site
Average (mg/l)
Below Guideline
No. Samples
DP1
0.298
95%
44
Overall, the data presented indicates that nutrient concentrations may be considered low with very few exceedances in the mid-lake, deep water site on Crow Lake.
Nutrients around Crow Lake
The average nutrient concentrations at monitored shoreline sites around the lake vary from year to year (Figures 94 and 95). Please note that in the 2006-2017 monitoring period sites A, E and J were monitored yearly; while sites B, C, D, F, G, H and I were only sampled in 2008 and 2013.
Average total phosphorous concentrations are below the TP guideline at all of the sites, with the exception of site E in 2007 (Figure 94); all subsequent results are below the guideline. Average TKN concentrations were also below the guideline at all sites (Figure 95).
Figure 94 Average total phosphorous concentrations at shoreline monitoring sites in Crow Lake, 2006-2017
Figure 95 Average total Kjeldahl nitrogen concentrations at shoreline monitoring sites in Crow Lake, 2006-2017
Summary of Crow Lake Nutrtients
Crow Lake nutrient concentrations are consistently below the guidelines, with very few exceedances. It is possible that occasional problems with nutrient enrichment (i.e. algal blooms or excessive plant growth) may be observed in some shallow, sheltered bays.
Efforts such as the diversion of runoff and enhanced shoreline buffers are important to continue to protect and enhance water quality, and reduce future nutrient increases-particularly in developed areas. Nutrient exceedances may be partially attributed to the natural aging of a lake and basin characteristics. All residents can help minimize their impact on the lake by reducing nutrient inputs through practices such as proper maintenance of septic systems, keeping shorelines natural and using phosphate free soaps and detergents. Promotion of sound stewardship and protection around lake is important to maintain and protect water quality conditions into the future.
2.3.2 Crow Lake Water Clarity
Water clarity is measured using a Secchi disk during each deep point sample. Table 40 summarizes the recorded depths with an average depth of 5.1 m and shows that all readings have exceeded the minimum PWQO of 2 m; indicating that algae in the water column is not at excessive levels (good water clarity). Less than 2 m will indicate overproduction in a lake or significant inputs to the water column that are limiting light availability. Figure 96 shows that no individual reading has been below the guideline and measured depths range from 3.0 m to 7.2 m. No trend was observed in Secchi depths over the 2006-2017 data set.
Table 40 Summary of Secchi depths recorded at the deep point sites on Crow Lake, 2006-2017
Secchi 2006-2017
Site
Average (m)
Above Guideline
No. Samples
DP1
5.1
100%
42
Figure 96 Recorded Secchi depths at the deep point sites on Crow Lake, 2006-2017
Summary of Crow Lake Water Clarity
Waters in Crow Lake are generally clear and sufficient sunlight is able to penetrate the water column to support aquatic life and provide sufficient visibility for safe recreational use (boating, swimming).
2.3.3 Crow Lake Fish Habitat
Two other factors, dissolved oxygen/temperature and pH were also assessed to provide an overall sense of the health of Crow Lake from a fish habitat perspective.
2.3.3.1 Crow Lake Dissolved Oxygen and Temperature
The red bars in Figure 97 show the depths where suitable conditions exist for warm water fish species (temperature less than 25°C and dissolved oxygen greater than 4 mg/l) at the deep point site. The vertical axis represents the total lake depth at each site where the profile is taken. Suitable conditions typically were observed over the monitoring periods to about 20m of the water column. Overall, no significant change was noted in conditions through the 2006-2017 period.
Figure 97 Depths suitable for warm water fish species on Crow Lake, 2006-2017.
2.3.3.2 Crow Lake pH
All samples were within guidelines established by the Canadian Council of Minister's of the Environment which state that pH should be between 6.5 and 9 to protect aquatic life (Table 41, Figure 98). Surface water’s that are found to be more alkaline (higher pH) are common in many regions of the Tay River subwatershed and can generally be attributed to the geology rather than anthropogenic activities. Biological activities such as increased photosynthesis from algal blooms and plant growth may also influence pH. A slight declining trend was observed throughout the 2006-2017 period.
Figure 98 pH concentrations at the deep point site on Crow Lake, 2006-2017
Table 41 Summary of pH results at the deep point site on Crow Lake, 2006-2017
pH 2006-2017
Site
Average (mg/l)
Within Guideline
No. Samples
DP1
8.02
100%
37
Summary of Water Quality for Fish Habitat in Crow Lake
Overall the water chemistry data at the deep point describes suitable habitat conditions for fish species such as bass, walleye and pike. pH conditions are within the range recommended for the protection of aquatic life. Overall, the data indicates a healthy environment for aquatic species.
2.3.4 Crow Lake E. Coli
E. coli is sampled at monitored shoreline sites twice each sampling season. E. coli data was not used in the calculations of the WQI rating for the lake due to differences in sampling frequency and site locations. E. coli data has been summarized in Table 42.
Throughout the 2006-2017 period 100 percent of samples collected by RVCA were below the E. coli guideline of 100 colony forming units (CFU) per 100 ml set by the PWQO; across the lake the count at the geometric mean was 3 CFU/100ml (Table 42). This provides support that there is little indication of bacterial contamination around the lake. Figure 99 show the distribution of counts across all shoreline sites, all of which fall well below the guideline of 100 CFU/100ml.
Table 42 Summary of E. coli results for Crow Lake, 2006-2017
E. coli 2006-2017
Site
Geometric mean (CFU/100ml)
Below Guideline
No. Samples
A-J
3
100%
103
Figure 99 Geometric mean of shoreline sites monitored on Crow Lake, 2006-2017
Summary of Crow Lake Bacterial Contamination
The results presented above indicate that bacterial contamination is not a significant concern in Crow Lake and the water should be safe for recreational use such as swimming and boating.
[1] No Ontario guideline for TKN is presently available; however, waters not influenced by excessive organic inputs typically range from 0.100 to 0.500 mg/l, Environment Canada (1979) Water Quality Sourcebook, A Guide to Water Quality Parameters, Inland Waters Directorate, Water Quality Branch, Ottawa, Canada
[2]Trends in the data were assessed using the Mann-Kendall trend test and Sens slope statistic.
[3]A type of mean or average, which indicates the central tendency or typical value of a set of numbers by using the product of their values (as opposed to the arithmetic mean which uses their sum). It is often used to summarize a variable that varies over several orders of magnitude, such as E. coli counts.
3.0 Bobs and Crow Lake Catchments: Riparian Conditions
3.1 Bobs Lake: Aquatic Habitat
3.1.1 Groundwater
Groundwater discharge areas can influence stream temperature, contribute nutrients, and provide important stream habitat for fish and other biota. During stream surveys, indicators of groundwater discharge are noted when observed. Indicators include: springs/seeps, watercress, iron staining, significant temperature change and rainbow mineral film. Figure 100 shows areas where one or more of the above groundwater indicators were observed during headwater assessments.
Figure 100 Groundwater indicators observed in the Bobs Lake catchment
3.1.2 Fish Community
The Bobs Lake catchment is classified as a mixed community of warm and cool water recreational and baitfish fishery (Figure 101). The fish community has not been sampled extensively in the Bobs Lake catchment.
Figure 101 Fish sampling locations in the Bobs Lake catchment
Table 43 contains a list of species observed in the watershed.
Table 43 Fish species observed in the Bobs Lake catchment
Fish Species
Scientific Name
Fish code
Historical
2016
bluntnose minnow
Pimephales notatus
BnMin
X
brassy minnow
Hybognathus hankinsoni
BrMin
X
brook stickleback
Culaea inconstans
BrSti
X
X
brown bullhead
Ameiurus nebulosus
BrBul
X
carps and minnows
Cyprinidae
CA_MI
X
common shiner
Luxilus cornutus
CoShi
X
creek chub
Semotilus atromaculatus
CrChu
X
fallfish
Semotilus corporalis
Fallf
X
fathead minnow
Pimephales promelas
FhMin
X
finescale dace
Phoxinus neogaeus
FsDac
X
iowa darter
Etheostoma exile
IoDar
X
lake trout
Salvelinus namaycush
LaTro
X
largemouth bass
Micropterus salmoides
LmBas
X
logperch
Percina caprodes
Logpe
X
micropterus sp.
Micropterus sp.
MicSp
X
northern pike
Esox lucius
NoPik
X
northern redbelly dace
Chrosomus eos
NRDac
X
pumpkinseed
Lepomis gibbosus
Pumpk
X
X
rock bass
Ambloplites rupestris
RoBas
X
smallmouth bass
Micropterus dolomieu
SmBas
X
walleye
Sander vitreus
Walle
X
white sucker
Catostomus commersonii
WhSuc
X
yellow bullhead
Ameiurus natalis
YeBul
X
yellow perch
Perca flavescens
YePer
X
TOTAL Species
21
5
3.1.3 Migratory Obstructions
Migratory obstructions represent limitations to fish dispersal within a system and may restrict access to important spawning and rearing habitat. Migratory obstructions can be natural or manmade, and they can be permanent or seasonal. Figure 102 shows that the Bobs Lake catchment area had eight perched culverts and one dam at the time of the survey in 2016.
Figure 102 Migratory obstructions in the Bobs Lake catchment
3.1.4 Riparian Restoration
Figure 103 depicts the locations of various riparian restoration opportunities as a result of observations made during the headwater drainage feature surveys.
Figure 103 Riparian restoration opportunities in the Bobs Lake catchment
3.2 Bobs Lake Catchment: Headwater Drainage Feature Assessment
3.2.1 Headwaters Sampling Locations
The RVCA Stream Characterization program assessed Headwater Drainage Features for the Bobs Lake catchment in 2016. This protocol measures zero, first and second order headwater drainage features (HDF). It is a rapid assessment method characterizing the amount of water, sediment transport, and storage capacity within headwater drainage features (HDF). RVCA is working with other Conservation Authorities and the Ministry of Natural Resources and Forestry to implement the protocol with the goal of providing standard datasets to support science development and monitoring of headwater drainage features. An HDF is a depression in the land that conveys surface flow. Additionally, this module provides a means of characterizing the connectivity, form and unique features associated with each HDF (OSAP Protocol, 2013). In 2016 the program sampled 39 sites at road crossings in the Bobs Lake catchment area (Figure 104).
Figure 104 Location of the headwater sampling sites in the Bobs Lake catchment
3.2.2 Headwater Feature Type
The headwater sampling protocol assesses the feature type in order to understand the function of each feature. The evaluation includes the following classifications: defined natural channel, channelized or constrained, multi-thread, no defined feature, tiled, wetland, swale, roadside ditch and pond outlet. By assessing the values associated with the headwater drainage features in the catchment area we can understand the ecosystem services that they provide to the watershed in the form of hydrology, sediment transport, and aquatic and terrestrial functions. The headwater drainage features in the Bobs Lake catchment are predominantly natural and wetland features. Figure 105 shows the feature type of the primary feature at the sampling locations.
Figure 105 Headwater feature types in the Bobs Lake catchment
3.2.3 Headwater Feature Flow
The observed flow condition within headwater drainage features can be highly variable depending on timing relative to the spring freshet, recent rainfall, soil moisture, etc. Flow conditions are assessed in the spring and in the summer to determine if features are perennial and flow year round, if they are intermittent and dry up during the summer months or if they are ephemeral systems that do not flow regularly and generally respond to specific rainstorm events or snowmelt. Flow conditions in headwater systems can change from year to year depending on local precipitation patterns. Figure 106 shows the observed flow condition at the sampling locations in the Bobs Lake catchment in 2016.
Figure 106 Headwater feature flow conditions in the Bobs Lake catchment
A spring photo of the headwater sample site in the Bobs Lake catchment located on Green Bay Road
A summer photo of the headwater sample site in the Bobs Lake catchment located on Green Bay Road
3.2.4 Feature Channel Modifications
Channel modifications were assessed at each headwater drainage feature sampling location. Modifications include channelization, dredging, hardening and realignments. The Bobs Lake catchment area had a majority of features with no channel modifications observed, two locations had mixed modifications and six had been historically dredged or channelized. Figure 107 shows the channel modifications observed at the sampling locations for the Bobs Lake catchment.
Figure 107 Headwater feature channel modifications in the Bobs Lake catchment
3.2.5 Headwater Feature Vegetation
Headwater feature vegetation evaluates the type of vegetation that is found within the drainage feature. The type of vegetation within the channel influences the aquatic and terrestrial ecosystem values that the feature provides. For some types of headwater features the vegetation within the feature plays a very important role in flow and sediment movement and provides wildlife habitat. The following classifications are evaluated no vegetation, lawn, wetland, meadow, scrubland and forest. Figure 108 depicts the dominant vegetation observed at the sampled headwater sites in the Bobs Lake catchment.
Figure 108 Headwater feature vegetation types in the Bobs Lake catchment
3.2.6 Headwater Feature Riparian Vegetation
Headwater riparian vegetation evaluates the type of vegetation that is found along the adjacent lands of a headwater drainage feature. The type of vegetation within the riparian corridor influences the aquatic and terrestrial ecosystem values that the feature provides to the watershed. Figure 109 depicts the type of riparian vegetation observed at the sampled headwater sites in the Bobs Lake catchment. The majority of the headwater drainage features are classified as having natural riparian vegetation with eleven features having altered vegetation.
Figure 109 Headwater feature riparian vegetation types in the Bobs Lake catchment
3.2.7 Headwater Feature Sediment Deposition
Assessing the amount of recent sediment deposited in a channel provides an index of the degree to which the feature could be transporting sediment to downstream reaches (OSAP, 2013). Evidence of excessive sediment deposition might indicate the requirement to follow up with more detailed targeted assessments upstream of the site location to identify potential best management practices to be implemented. Sediment deposition ranged from none to substantial for the headwater sites sampled in the Bobs Lake catchment area. Figure 110 depicts the degree of sediment deposition observed at the sampled headwater sites in the Bobs Lake catchment. Sediment deposition conditions ranged from no sediment deposition to substantial levels of deposition.
Figure 110 Headwater feature sediment deposition in the Bobs Lake catchment
3.2.8 Headwater Feature Upstream Roughness
Feature roughness will provide a measure of the amount of materials within the bankfull channel that could slow down the velocity of water flowing within the headwater feature (OSAP, 2013). Materials on the channel bottom that provide roughness include vegetation, woody Structure and boulders/cobble substrates. Roughness can provide benefits in mitigating downstream erosion on the headwater drainage feature and the receiving watercourse by reducing velocities. Roughness also provides important habitat conditions for aquatic organisms. Figure 111 shows that the feature roughness conditions at the sampling locations in the Bobs Lake catchment were highly variable ranging from minimal to extreme roughness conditions.
Figure 111 Headwater feature roughness in the Bobs Lake catchment
3.3 Crow Lake Catchment: Headwater Drainage Features Assessment
3.3.1 Headwater Sampling Locations
The RVCA Stream Characterization program assessed Headwater Drainage Features for the Crow Lake catchment in 2016. This protocol measures zero, first and second order headwater drainage features (HDF). It is a rapid assessment method characterizing the amount of water, sediment transport, and storage capacity within headwater drainage features (HDF). RVCA is working with other Conservation Authorities and the Ministry of Natural Resources and Forestry to implement the protocol with the goal of providing standard datasets to support science development and monitoring of headwater drainage features. An HDF is a depression in the land that conveys surface flow. Additionally, this module provides a means of characterizing the connectivity, form and unique features associated with each HDF (OSAP Protocol, 2013). In 2016 the program sampled 22 sites at road crossings in the Crow Lake catchment area (Figure 112).
Figure 112 Location of the headwater sampling site in the Crow Lake catchment
3.3.2 Headwater Feature Type
The headwater sampling protocol assesses the feature type in order to understand the function of each feature. The evaluation includes the following classifications: defined natural channel, channelized or constrained, multi-thread, no defined feature, tiled, wetland, swale, roadside ditch and pond outlet. By assessing the values associated with the headwater drainage features in the catchment area we can understand the ecosystem services that they provide to the watershed in the form of hydrology, sediment transport, and aquatic and terrestrial functions. The headwater drainage features in the Crow Lake catchment are predominantly natural and wetland features. Figure 113 shows the feature type of the primary feature at the sampling locations.
Figure 113 Headwater feature types in the Crow Lake catchment
3.3.3 Headwater Feature Flow
The observed flow condition within headwater drainage features can be highly variable depending on timing relative to the spring freshet, recent rainfall, soil moisture, etc. Flow conditions are assessed in the spring and in the summer to determine if features are perennial and flow year round, if they are intermittent and dry up during the summer months or if they are ephemeral systems that do not flow regularly and generally respond to specific rainstorm events or snowmelt. Flow conditions in headwater systems can change from year to year depending on local precipitation patterns. Figure 114 shows the observed flow condition at the sampling locations in the Crow Lake catchment in 2016.
Figure 114 Headwater feature flow conditions in the Crow Lake catchment
A spring photo of the headwater sample site in the Crow Lake catchment located on Oak Bluffs Road
A summer photo of the headwater sample site in the Crow Lake catchment located on Oak Bluffs Road
3.3.4 Headwater Feature Channel Modifications
Channel modifications were assessed at each headwater drainage feature sampling location. Modifications include channelization, dredging, hardening and realignments. The Crow Lake catchment area had a majority of features with no channel modifications observed, only one location had mixed modifications. Figure 115 shows the channel modifications observed at the sampling locations for the Crow Lake catchment.
Figure 115 Headwater feature channel modifications in the Crow Lake catchment
3.3.5 Headwater Feature Vegetation
Headwater feature vegetation evaluates the type of vegetation that is found within the drainage feature. The type of vegetation within the channel influences the aquatic and terrestrial ecosystem values that the feature provides. For some types of headwater features the vegetation within the feature plays a very important role in flow and sediment movement and provides wildlife habitat. The following classifications are evaluated no vegetation, lawn, wetland, meadow, scrubland and forest. Figure 116 depicts the dominant vegetation observed at the sampled headwater sites in the Crow Lake catchment.
Figure 116 Headwater feature vegetation types in the Crow Lake catchment
3.3.6 Headwater Feature Riparian Vegetation
Headwater riparian vegetation evaluates the type of vegetation that is found along the adjacent lands of a headwater drainage feature. The type of vegetation within the riparian corridor influences the aquatic and terrestrial ecosystem values that the feature provides to the watershed. Figure 117 depicts the type of riparian vegetation observed at the sampled headwater sites in the Crow Lake catchment. The majority of the headwater drainage features are classified as having natural riparian vegetation with only four features having altered vegetation typically in the form of ornamental grass or agricultural crops in the riparian zone.
Figure 117 Headwater feature riparian vegetation types in the Crow Lake catchment
3.3.7 Headwater Feature Sediment Deposition
Assessing the amount of recent sediment deposited in a channel provides an index of the degree to which the feature could be transporting sediment to downstream reaches (OSAP, 2013). Evidence of excessive sediment deposition might indicate the requirement to follow up with more detailed targeted assessments upstream of the site location to identify potential best management practices to be implemented. Sediment deposition ranged from none to substantial for the headwater sites sampled in the Crow Lake catchment area. Figure 118 depicts the degree of sediment deposition observed at the sampled headwater sites in the Crow Lake catchment. Sediment deposition conditions ranged from no sediment deposition to moderate.
Figure 118 Headwater feature sediment deposition in the Crow Lake catchment
3.3.8 Headwater Feature Upstream Roughness
Feature roughness will provide a measure of the amount of materials within the bankfull channel that could slow down the velocity of water flowing within the headwater feature (OSAP, 2013). Materials on the channel bottom that provide roughness include vegetation, woody Structure and boulders/cobble substrates. Roughness can provide benefits in mitigating downstream erosion on the headwater drainage feature and the receiving watercourse by reducing velocities. Roughness also provides important habitat conditions for aquatic organisms. Figure 119 shows that the feature roughness conditions at the sampling locations in the Crow Lake catchment were highly variable ranging from minimal to extreme.
Figure 119 Headwater feature roughness in the Crow Lake catchment
Land cover and any change in coverage that has occurred over a six year period is summarized for the Bobs and Crow Lake catchments using spatially continuous vector data representing the catchment during the spring of 2008 and 2014. This dataset was developed by the RVCA through heads-up digitization of 20cm DRAPE ortho-imagery at a 1:4000 scale and details the surrounding landscape using 10 land cover classes.
4.1.1 Bobs LakeCatchment Land Cover/Change
As shown in Table 44 and Figure 1a, the dominant land cover type in 2014 is woodland.
Table 44 Land cover in the Bobs Lake catchment (2008 vs.2014)
Land Cover
2008
2014
Change - 2008 to 2014
Area
Area
Area
Ha
Percent
Ha
Percent
Ha
Percent
Woodland*
6562
50
6542
50
-20
Water
3234
25
3238
25
4
Wetland**
1774
13
1789
13
15
>Evaluated
(324)
(2)
(324)
(2)
(0)
(0)
>Unevaluated
(1450)
(11)
(1465)
(11)
(15)
(0)
Crop and Pasture
569
4
568
4
-1
Meadow-Thicket
399
3
394
3
-5
Settlement
315
2
320
2
5
Transportation
327
2
329
2
2
Aggregate
20
<1
20
<1
* Does not include treed swamps ** Includes treed swamps
From 2008 to 2014, there was an overall change of 33 hectares (from one land cover class to another). Most of the change in the Bobs Lake catchment is a result of woodland reverting to wetland and being converted to settlement (Figure 120).
Figure 120 Land cover change in the Bobs Lake catchment (2008 to 2014)
Table 45 provides a detailed breakdown of all land cover change that has taken place in the Bobs Lake catchment between 2008 and 2014.
Table 45 Land cover change in the Bobs Lake catchment (2008 to 2014)
Change - 2008 to 2014
Land Cover
Area
Ha.
Percent
Woodland to Unevaluated Wetland
13.4
40.8
Woodland to Settlement
6.1
18.6
Settlement to Unevaluated Wetland
3.8
11.7
Meadow-Thicket to Woodland
1.9
5.9
Meadow-Thicket to Unevaluated Wetland
1.7
5.3
Woodland to Transportation
1.4
4.2
Meadow-Thicket to Settlement
1.1
3.3
Crop and Pasture to Settlement
1
3
Meadow-Thicket to Transportation
0.6
1.9
Unevaluated Wetland to Settlement
0.6
1.7
Woodland to Crop and Pasture
0.5
1.5
Crop and Pasture to Unevaluated Wetland
0.4
1.3
Crop and Pasture to Woodland
0.2
0.7
4.1.2 Crow LakeCatchment Change
As shown in Table 46 and Figure 1b, the dominant land cover type in 2014 is woodland.
Table 46 Land cover (2008 vs. 2014) in the Crow Lake catchment
Land Cover
2008
2014
Change - 2008 to 2014
Area
Area
Area
Ha
Percent
Ha
Percent
Ha
Percent
Woodland*
3054
60
3048
60
-6
Wetland **
886
18
891
18
5
1
>Unevaluated
886
18
891
18
5
1
Water
584
12
584
12
Meadow-Thicket
207
4
207
4
Crop and Pasture
124
2
124
2
Settlement
107
2
109
2
2
Transportation
101
2
101
2
Aggregate
2
<1
2
<1
* Does not include treed swamps ** Includes treed swamps
From 2008 to 2014, there was an overall change of six hectares (from one land cover class to another). Most of the change in the Crow Lake catchment is a result of woodland reverting to wetland (Figure 121).
Figure 121 Land cover change in the Crow Lake catchment (2008 to 2014)
Table 47 provides a detailed breakdown of all land cover change that has taken place in the Crow Lake catchment between 2008 and 2014.
Table 47 Land cover change in the Crow Lake catchment (2008 to 2014)
Land Cover
Change - 2008 to 2014
Area
Ha.
Percent
Wooded Area to Unevaluated Wetland
4.2
74
Crop and Pasture to Settlement
0.8
14
Wooded Area to Settlement
0.7
12
4.2 Woodland Cover
In the Environment Canada Guideline (Third Edition) entitled “How Much Habitat Is Enough?” (hereafter referred to as the “Guideline”) the opening narrative under the Forest Habitat Guidelines section states that prior to European settlement, forest was the predominant habitat in the Mixedwood Plains ecozone. The remnants of this once vast forest now exist in a fragmented state in many areas (including the Rideau Valley watershed) with woodland patches of various sizes distributed across the settled landscape along with higher levels of forest cover associated with features such as the Frontenac Axis (within the on-Shield areas of the Rideau Lakes and Tay River subwatersheds). The forest legacy, in terms of the many types of wildlife species found, overall species richness, ecological functions provided and ecosystem complexity is still evident in the patches and regional forest matrices (found in the Tay River subwatershed and elsewhere in the Rideau Valley watershed). These ecological features are in addition to other influences which forests have on water quality and stream hydrology including reducing soil erosion, producing oxygen, storing carbon along with many other ecological services that are essential not only for wildlife but for human well-being.
The Guideline also notes that forests provide a great many habitat niches that are in turn occupied by a great diversity of plant and animal species. They provide food, water and shelter for these species - whether they are breeding and resident locally or using forest cover to help them move across the landscape. This diversity of species includes many that are considered to be species at risk. Furthermore, from a wildlife perspective, there is increasing evidence that the total forest cover in a given area is a major predictor of the persistence and size of bird populations, and it is possible or perhaps likely that this pattern extends to other flora and fauna groups. The overall effect of a decrease in forest cover on birds in fragmented landscapes is that certain species disappear and many of the remaining ones become rare, or fail to reproduce, while species adapted to more open and successional habitats, as well as those that are more tolerant to human-induced disturbances in general, are able to persist and in some cases thrive. Species with specialized-habitat requirements are most likely to be adversely affected. The overall pattern of distribution of forest cover, the shape, area and juxtaposition of remaining forest patches and the quality of forest cover also play major roles in determining how valuable forests will be to wildlife and people alike.
The current science generally supports minimum forest habitat requirements between 30 and 50 percent, with some limited evidence that the upper limit may be even higher, depending on the organism/species phenomenon under investigation or land-use/resource management planning regime being considered/used.
Bobs Lake Catchment
As shown in Figure 122, 50 percent of the Bobs Lake catchment contains 6542 hectares of upland forest and 49 hectares of lowland forest (treed swamps) versus the 47 percent of woodland cover in the Tay River subwatershed. This is greater than the 30 percent of forest cover that is identified as the minimum threshold required to sustain forest birds according to the Guideline and which may only support less than one half of potential species richness and marginally healthy aquatic systems. When forest cover drops below 30 percent, forest birds tend to disappear as breeders across the landscape.
Figure 122 Woodland cover and forest interior in the Bobs Lake catchment (2014)
Crow Lake Catchment
As shown in Figure 123, 61 percent of the Crow Lake catchment contains 3048 hectares of upland forest and 26 hectares of lowland forest (treed swamps) versus the 47 percent of woodland cover in the Tay River subwatershed. This is greater than the 30 percent of forest cover that is identified as the minimum threshold required to sustain forest birds according to the Guideline and which may only support less than one half of potential species richness and marginally healthy aquatic systems. When forest cover drops below 30 percent, forest birds tend to disappear as breeders across the landscape.
Figure 123 Woodland cover and forest interior in the Crow Lake catchment (2014)
4.2.1 Woodland (Patch) Size
According to the Ministry of Natural Resources’ Natural Heritage Reference Manual (Second Edition), larger woodlands are more likely to contain a greater diversity of plant and animal species and communities than smaller woodlands and have a greater relative importance for mobile animal species such as forest birds.
Bigger forests often provide a different type of habitat. Many forest birds breed far more successfully in larger forests than they do in smaller woodlots and some rely heavily on forest interior conditions. Populations are often healthier in regions with more forest cover and where forest fragments are grouped closely together or connected by corridors of natural habitat. Small forests support small numbers of wildlife. Some species are “area-sensitive” and tend not to inhabit small woodlands, regardless of forest interior conditions. Fragmented habitat also isolates local populations, especially small mammals, amphibians and reptiles with limited mobility. This reduces the healthy mixing of genetic traits that helps populations survive over the long run (Conserving the Forest Interior. Ontario Extension Notes, 2000).
The Environment Canada Guideline also notes that for forest plants that do not disperse broadly or quickly, preservation of some relatively undisturbed large forest patches is needed to sustain them because of their restricted dispersal abilities and specialized habitat requirements and to ensure continued seed or propagation sources for restored or regenerating areas nearby.
The Natural Heritage Reference Manual continues by stating that a larger size also allows woodlands to support more resilient nutrient cycles and food webs and to be big enough to permit different and important successional stages to co-exist. Small, isolated woodlands are more susceptible to the effects of blowdown, drought, disease, insect infestations, and invasions by predators and non-indigenous plants. It is also known that the viability of woodland wildlife depends not only on the characteristics of the woodland in which they reside, but also on the characteristics of the surrounding landscape where the woodland is situated. Additionally, the percentage of forest cover in the surrounding landscape, the presence of ecological barriers such as roads, the ability of various species to cross the matrix surrounding the woodland and the proximity of adjacent habitats interact with woodland size in influencing the species assemblage within a woodland.
Bobs Lake Catchment
In the Bobs Lake catchment (in 2014), three hundred and twenty-six (54 percent) of the 609 woodland patches are very small, being less than one hectare in size. Another 225 (37 percent) of the woodland patches ranging from one to less than 20 hectares in size tend to be dominated by edge-tolerant bird species. The remaining 58 (nine percent of) woodland patches range between 20 and 809 hectares in size. Forty-three of these patches contain woodland between 20 and 100 hectares and may support a few area-sensitive species and some edge intolerant species, but will be dominated by edge tolerant species.
Conversely, 15 (two percent) of the 609 woodland patches in the drainage area exceed the 100 plus hectare size needed to support most forest dependent, area sensitive birds and are large enough to support approximately 60 percent of edge-intolerant species. Six patches top 200 hectares, which according to the Environment Canada Guideline will support 80 percent of edge-intolerant forest bird species (including most area sensitive species) that prefer interior forest habitat conditions.
Table 48 presents a comparison of woodland patch size in 2008 and 2014 along with any changes that have occurred over that time. A decrease (of 20 hectares) has been observed in the overall woodland patch area between the two reporting periods with most change occurring in the 50 to 100 woodland patch size class range.
Table 48 Woodland patches in the Bobs Lake catchment (2008 and 2014)
Woodland Patch Size Range (ha)
Woodland* Patches
Patch Change
2008
2014
2008 to 2014
Number
Area
Number
Area
Number
Area
Count
Percent
Ha
Percent
Count
Percent
Ha
Percent
Count
Ha
Less than 1
317
53
120
2
326
54
121
2
9
1
1 to 20
222
37
936
14
225
37
953
14
3
17
20 to 50
30
5
969
15
30
5
968
15
-1
50 to 100
13
2
975
15
13
2
952
14
-23
100 to 200
9
2
1321
20
9
1
1319
20
-2
Greater than 200
6
1
2290
34
6
1
2278
35
-12
Totals
597
100
6611
100
609
100
6591
100
12
-20
*Includes treed swamps
Crow Lake Catchment
In the Crow Lake catchment (in 2014), one hundred and four (54 percent) of the 191 woodland patches are very small, being less than one hectare in size. Another 66 (34 percent) of the woodland patches ranging from one to less than 20 hectares in size tend to be dominated by edge-tolerant bird species. The remaining 21 (12 percent of) woodland patches range between 21 and 599 hectares in size. Twelve of these patches contain woodland between 20 and 100 hectares and may support a few area-sensitive species and some edge intolerant species, but will be dominated by edge tolerant species.
Conversely, nine (five percent) of the 191 woodland patches in the drainage area exceed the 100 plus hectare size needed to support most forest dependent, area sensitive birds and are large enough to support approximately 60 percent of edge-intolerant species. Four patches top 200 hectares, which according to the Environment Canada Guideline will support 80 percent of edge-intolerant forest bird species (including most area sensitive species) that prefer interior forest habitat conditions.
Table 49 presents a comparison of woodland patch size in 2008 and 2014 along with any changes that have occurred over that time. A decrease (of five hectares) has been observed in the overall woodland patch area between the two reporting periods with most change occurring in the greater than 200 woodland patch size class range.
Table 49 Woodland patches in the Crow Lake catchment (2008 and 2014)
Woodland Patch Size Range (ha)
Woodland* Patches
Patch Change
2008
2014
2008 to 2014
Number
Area
Number
Area
Number
Area
Count
Percent
Ha
Percent
Count
Percent
Ha
Percent
Count
Ha
Less than 1
102
54
31
1
104
54
31
1
2
1 to 20
65
34
348
11
66
34
348
11
1
20 to 50
9
5
244
8
9
5
244
8
50 to 100
3
2
229
7
3
2
229
7
100 to 200
5
3
699
23
5
3
698
23
-1
Greater than 200
4
2
1529
50
4
2
1525
50
-4
Totals
188
100
3080
100
191
100
3075
100
3
-5
*Includes treed swamps
4.2.2 Woodland (Forest) Interior Habitat
The forest interior is habitat deep within woodlands. It is a sheltered, secluded environment away from the influence of forest edges and open habitats. Some people call it the “core” or the “heart” of a woodland. The presence of forest interior is a good sign of woodland health, and is directly related to the woodland’s size and shape. Large woodlands with round or square outlines have the greatest amount of forest interior. Small, narrow woodlands may have no forest interior conditions at all. Forest interior habitat is a remnant natural environment, reminiscent of the extensive, continuous forests of the past. This increasingly rare forest habitat is now a refuge for certain forest-dependent wildlife; they simply must have it to survive and thrive in a fragmented forest landscape (Conserving the Forest Interior. Ontario Extension Notes, 2000).
The Natural Heritage Reference Manual states that woodland interior habitat is usually defined as habitat more than 100 metres from the edge of the woodland and provides for relative seclusion from outside influences along with a moister, more sheltered and productive forest habitat for certain area sensitive species. Woodlands with interior habitat have centres that are more clearly buffered against the edge effects of agricultural activities or more harmful urban activities than those without.
Bobs Lake Catchment
In the Bobs Lake catchment (in 2014), the 609 woodland patches contain 76 forest interior patches (Figure 122) that occupy seven percent (646 ha.) of the catchment land area (which is greater than the five percent of interior forest in the Tay River subwatershed). This is below the ten percent figure referred to in the Environment Canada Guideline that is considered to be the minimum threshold for supporting edge intolerant bird species and other forest dwelling species in the landscape.
Most patches (58) have less than 10 hectares of interior forest, 27 of which have small areas of interior forest habitat less than one hectare in size. The remaining 18 patches contain interior forest between 11 and 78 hectares in area. Between 2008 and 2014, the greatest change in woodland interior patch area has taken place in the 50 to 100 hectare range (Table 50), suggesting an increase in forest fragmentation over the six year period.
Table 50 Woodland interior in the Bobs Lake catchment (2008 and 2014)
Woodland Interior Habitat Size Range (ha)
Woodland Interior
Interior Change
2008
2014
2008 to 2014
Number
Area
Number
Area
Number
Area
Count
Percent
Ha
Percent
Count
Percent
Ha
Percent
Count
Ha
Less than 1
27
36
7
1
27
36
7
1
1 to 10
31
41
102
16
31
41
101
16
-1
10 to 30
10
13
165
25
11
14
194
30
1
29
30 to 50
4
5
137
21
4
5
155
24
18
50 to 100
4
5
241
37
3
4
189
29
-1
-52
Totals
76
100
652
100
76
100
646
100
-6
Crow Lake Catchment
In the Crow Lake catchment (in 2014), the 191 woodland patches contain 35 forest interior patches (Figure 123) that occupy four percent (196 ha.) of the catchment land area (which is less than the five percent of interior forest in the Tay River subwatershed). This is below the ten percent figure referred to in the Environment Canada Guideline that is considered to be the minimum threshold for supporting edge intolerant bird species and other forest dwelling species in the landscape.
Most patches (27) have less than 10 hectares of interior forest, fifteen of which have small areas of interior forest habitat less than one hectare in size. The remaining eight patches contain interior forest between 11 and 32 hectares in area. Between 2008 and 2014, there was an overall loss of two hectares of interior forest habitat in the catchment (Table 51).
Table 51 Woodland interior in the Crow Lake catchment (2008 and 2014)
Woodland Interior Habitat Size Range (ha)
Woodland Interior
Interior Change
2008
2014
2008 to 2014
Number
Area
Number
Area
Number
Area
Count
Percent
Ha
Percent
Count
Percent
Ha
Percent
Count
Ha
Less than 1
15
43
5
3
15
43
5
3
1 to 10
12
34
46
23
12
34
46
23
10 to 30
7
20
114
57
7
20
113
58
-1
30 to 50
1
3
33
17
1
3
32
16
-1
Totals
35
100
198
100
35
100
196
100
-2
*Includes treed swamps
4.3 Wetland Cover
Wetlands are habitats forming the interface between aquatic and terrestrial systems. They are among the most productive and biologically diverse habitats on the planet. By the 1980s, according to the Natural Heritage Reference Manual, 68 percent of the original wetlands south of the Precambrian Shield in Ontario had been lost through encroachment, land clearance, drainage and filling.
Wetlands perform a number of important ecological and hydrological functions and provide an array of social and economic benefits that society values. Maintaining wetland cover in a watershed provides many ecological, economic, hydrological and social benefits that are listed in the Reference Manual and which may include:
contributing to the stabilization of shorelines and to the reduction of erosion damage through the mitigation of water flow and soil binding by plant roots
mitigating surface water flow by storing water during periods of peak flow (such as spring snowmelt and heavy rainfall events) and releasing water during periods of low flow (this mitigation of water flow also contributes to a reduction of flood damage)
contributing to an improved water quality through the trapping of sediments, the removal and/or retention of excess nutrients, the immobilization and/or degradation of contaminants and the removal of bacteria
providing renewable harvesting of timber, fuel wood, fish, wildlife and wild rice
contributing to a stable, long-term water supply in areas of groundwater recharge and discharge
providing a high diversity of habitats that support a wide variety of plants and animals
acting as “carbon sinks” making a significant contribution to carbon storage
providing opportunities for recreation, education, research and tourism
Historically, the overall wetland coverage within the Great Lakes basin exceeded 10 percent, but there was significant variability among watersheds and jurisdictions, as stated in the Environment Canada Guideline. In the Rideau Valley Watershed, it has been estimated that pre-settlement wetland cover averaged 35 percent using information provided by Ducks Unlimited Canada (2010) versus the 21 percent of wetland cover existing in 2014 derived from DRAPE imagery analysis.
Bobs Lake Catchment
Reliable, pre-settlement wetland cover data is unavailable for the Bobs Lake catchment; however, data for the years 2008 and 2014 is available and shows that wetland cover remains largely unchanged at 14 percent in 2014 (as shown in Figure 124 and indicated in Table 52). To maintain critical hydrological, ecological functions along with related recreational and economic benefits provided by these wetland habitats in the catchment, a “no net loss” of currently existing wetlands should be employed to ensure the continued provision of tangible benefits accruing from them to landowners and surrounding communities.
Figure 124 Wetland cover in the Bobs Lake catchment (2014)
Table 52 Wetland cover in the Bobs Lake catchment (2014)
Wetland Cover
Pre-settlement
2008
2014
Change - Historic to 2014
Area
Area
Area
Area
Ha
Percent
Ha
Percent
Ha
Percent
Ha
Percent
Bobs Lake
n/a
n/a
1774
13
1789
14
n/a
n/a
Tay River
n/a
n/a
15280
19
15330
19
n/a
n/a
Rideau Valley
134115
35
n/a
n/a
82076
21
-52039
-39
Crow Lake Catchment
Reliable, pre-settlement wetland cover data is unavailable for the Crow Lake catchment; however, data for the years 2008 and 2014 is available and shows that wetland cover remains largely unchanged at 18 percent in 2014 (as indicated in Table 53 and shown in Figure 125). To maintain critical hydrological, ecological functions along with related recreational and economic benefits provided by these wetland habitats in the catchment, a “no net loss” of currently existing wetlands should be employed to ensure the continued provision of tangible benefits accruing from them to landowners and surrounding communities.
Figure 125 Wetland cover in the Crow Lake catchment (2014)
Table53 Wetland cover in the Crow Lake catchment (2014)
Wetland Cover
Pre-settlement
2008
2014
Change - Historic to 2014
Area
Area
Area
Area
Ha
Percent
Ha
Percent
Ha
Percent
Ha
Percent
Crow Lake
n/a
n/a
886
17
891
18
n/a
n/a
Tay River
n/a
n/a
15280
19
15330
19
n/a
n/a
Rideau Valley
134115
35
n/a
n/a
82076
21
-52039
-39
4.4 Shoreline Cover
The riparian or shoreline zone is that special area where the land meets the water. Well-vegetated shorelines are critically important in protecting water quality and creating healthy aquatic habitats, lakes and rivers. Natural shorelines intercept sediments and contaminants that could impact water quality conditions and harm fish habitat in streams. Well established buffers protect the banks against erosion, improve habitat for fish by shading and cooling the water and provide protection for birds and other wildlife that feed and rear young near water. A recommended target (from the Environment Canada Guideline) is to maintain a minimum 30 metre wide vegetated buffer along at least 75 percent of the length of both sides of rivers, creeks and streams.
Bobs Lake Catchment
Figure 126 shows the extent of the ‘Natural’ vegetated riparian zone (predominantly wetland/woodland features) and ‘Other’ anthropogenic cover (crop/pastureland, roads/railways, settlements) along a 30-metre-wide area of land around Bobs Lake, other lakes and along both sides of the shoreline of the many unnamed watercourses (including headwater streams) found in the Bobs Lake catchment.
Figure 126 Natural and other riparian land cover in the Bobs Lake catchment (2014)
This analysis shows that the Bobs Lake catchment riparian buffer is composed of woodland (56 percent), wetland (32 percent), settlement (five percent), crop and pastureland (three percent), transportation (two percent) and meadow-thicket (two percent). Along the many watercourses (including headwater streams) flowing into Bobs Lake, the riparian buffer is composed of wetland (46 percent), woodland (44 percent), crop and pastureland (four percent), meadow-thicket (three percent), roads (two percent), and settlement areas (one percent).
Around Bobs Lake itself, the shoreline buffer is dominated by woodland (79 percent) and cottages, houses and camps (14 percent) with the remainder comprised of roads (three percent), wetlands (two percent) and crop and pastureland (one percent) along with meadow-thicket (one percent).
Additional statistics for the Bobs Lake catchment and Bobs Lake itself are presented in Tables 54 to 56 and show that there has been little change in shoreline cover from 2008 to 2014.
Table 54 Riparian land cover in the Bobs Lake catchment (2008 vs. 2014)
Riparian Land Cover
2008
2014
Change - 2008 to 2014
Area
Area
Area
Ha.
Percent
Ha.
Percent
Ha.
Percent
Woodland
1194.32
56.36
1190.62
56.18
-3.70
-0.18
Wetland
663.25
31.29
669.16
31.57
5.91
0.28
> Unevaluated
(592.22)
(27.94)
(598.13)
(28.22)
(5.91)
(0.28)
> Evaluated
(71.03)
(3.35)
(71.03)
(3.35)
(0.00)
(0.00)
Settlement
102.68
4.85
101.59
4.79
-1.09
-0.06
Crop & Pasture
60.64
2.86
60.58
2.86
-0.06
0.00
Transportation
49.65
2.34
49.75
2.35
0.10
0.01
Meadow-Thicket
48.67
2.3
47.51
2.24
-1.16
-0.06
Table 55 Riparian land cover around Bobs Lake (2008 vs. 2014)
Riparian Land Cover
2008
2014
Change - 2008 to 2014
Area
Area
Area
Ha.
Percent
Ha.
Percent
Ha.
Percent
Woodland
439.02
78.61
438.11
78.45
-0.91
-0.16
Wetland
13.32
2.39
13.44
2.41
0.12
0.02
> Unevaluated
(12.84)
(2.30)
(12.96)
(2.32)
(0.12)
(0.02)
> Evaluated
(0.48)
(0.09)
(0.48)
(0.09)
(0.00)
(0.00)
Settlement
79.34
14.21
80.13
14.35
0.79
0.14
Transportation
17.67
3.17
17.67
3.17
0.00
0.00
Meadow-Thicket
4.64
0.83
4.64
0.83
0.00
0.00
Crop & Pasture
4.44
0.80
4.44
0.80
0.00
0.00
Table 56 Riparian land cover along streams in the Bobs Lake catchment (2008 vs. 2014)
Riparian Land Cover
2008
2014
Change - 2008 to 2014
Area
Area
Area
Ha.
Percent
Ha.
Percent
Ha.
Percent
Wetland
604.74
45.19
610.53
45.63
5.79
0.44
> Unevaluated
(536.11)
(40.06)
(541.90)
(40.50)
(5.79)
(0.44)
>Evaluated
(68.63)
(5.13)
(68.63)
(5.13)
(0.00)
(0.00)
Woodland
591.56
44.21
588.77
44.00
-2.79
-0.21
Crop & Pasture
54.45
4.07
54.39
4.06
-0.06
-0.01
Meadow-Thicket
39.10
2.92
37.94
2.84
-1.16
-0.08
Transportation
29.28
2.19
29.39
2.20
0.11
0.01
Settlement
18.99
1.42
17.10
1.28
-1.89
-0.14
Crow Lake Catchment
Figure 127 shows the extent of the ‘Natural’ vegetated riparian zone (predominantly wetland/woodland features) and ‘Other’ anthropogenic cover (crop/pastureland, roads/railways, settlements) along a 30-metre-wide area of land around Crow Lake, other lakes and along both sides of the shoreline of the many unnamed watercourses (including headwater streams) found in the Crow Lake catchment.
Figure 127 Natural and other riparian land cover in the Crow Lake catchment
This analysis shows that the riparian zone in the Crow Lake catchment is composed of woodland (56 percent), wetland (35 percent), meadow-thicket (three percent), settlement (three percent), roads (two percent) and crop and pastureland (one percent).
Along the many watercourses (including headwater streams) flowing into Beaver, Crow, Sucler and Victoria Lake, the riparian buffer is composed of woodland (51 percent), wetland (42 percent), meadow-thicket (three percent), roads (two percent), settlement areas (one percent) and crop and pastureland (one percent).
Around Crow Lake itself, the shoreline buffer is dominated by woodland (65 percent) and cottages, houses and camps (21 percent) with the remainder comprised of roads (seven percent), wetlands (four percent), crop and pastureland (two percent) and meadow-thicket (one percent).
Additional statistics for the Crow Lake catchment are presented in Tables 57 to 59 and show that there has been little change in shoreline cover from 2008 to 2014.
Table 57 Riparian land cover (2008 vs. 2014) in the Crow Lake catchment
Riparian Land Cover
2008
2014
Change - 2008 to 2014
Area
Area
Area
Ha.
Percent
Ha.
Percent
Ha.
Percent
Woodland
456
56
455
56
-1
Wetland
284
35
285
35
1
> Unevaluated
(284)
(35)
(285)
(35)
(1)
(0)
Meadow-Thicket
26
3
26
3
Settlement
23
3
23
3
Transportation
16
2
16
2
Crop & Pasture
7
1
7
1
Table 58 Riparian land cover (2008 vs. 2014) around Crow Lake
Riparian Land Cover
2008
2014
Change - 2008 to 2014
Area
Area
Area
Ha.
Percent
Ha.
Percent
Ha.
Percent
Woodland
37.37
65.01
37.37
65.01
0.00
0.00
Settlement
12.25
21.31
12.30
21.41
0.10
0.10
Transportation
3.77
6.57
3.77
6.57
0.00
0.00
Wetland
2.10
3.66
2.10
3.66
0.00
0.00
> Unevaluated
(2.10)
(3.66)
(2.10)
(3.66)
(0.00)
(0.00)
Crop & Pasture
1.37
2.40
1.32
2.30
-0.10
-0.10
Meadow-Thicket
0.60
1.06
0.60
1.06
0.00
0.00
Table 59 Riparian land cover (2008 vs. 2014) along streams in the Crow Lake Catchment
5.0 Bobs and Crow Lake Catchments: Stewardship and Water Resources Protection
The RVCA and its partners are working to protect and enhance environmental conditions in the Tay River Watershed. Figure 128 shows the location of all stewardship projects completed in the Bobs Lake catchment and Figure 129 shows the location of all stewardship projects completed in the Crow Lake catchment.
Figure 128 Stewardship site locations in the Bobs Lake catchment
Figure 129 Stewardship site locations in the Crow Lake catchment
5.1 Rural Clean Water
The Rural Clean Water Program provides technical and financial assistance to farmers and other rural landowners, to aid in the implementation of projects that protect water quality. Funding is granted to those projects that support best management practices for application in the protection and improvement of surface and ground water resources. The program also supports climate change adaptation and low impact development projects as well as educating rural landowners about environmental stewardship of private property. Examples of supported projects include livestock exclusion fencing, controlled tile drainage, cover crops, erosion control, well related projects, and many more. For a list of eligible projects and to apply for funding, see Rural Clean Water.
In the Bobs Lake Catchment from 2011 to 2016, four erosion control projects, four windbreaks/buffers, and two septic system repairs were completed; prior to this, three septic system repairs, two erosion control projects and one windbreak/buffer had been completed. When combined, these projects are keeping 4.84 kilograms of Phosphorus out of our lakes, rivers and streams every year. Total value of all 16 projects is $93,593 with $25,868 of that amount funded through grant dollars from the RVCA.
In the Crow Lake Catchment from 2011 to 2016, five windbreaks/buffers and three erosion control projects were completed; prior to this, one septic system repairs was completed. When combined, these projects are keeping 37.46 kilograms of Phosphorus out of our lakes, rivers and streams each year. Total value of all nine projects is $24,859 with $12,996 of that amount funded through grant dollars from the RVCA.
5.2 Private Land Forestry
Forest cover and tree planting continues to be one of the most widely supported strategies to improve our environment. The many benefits of forest cover include carbon sequestration, flood mitigation and water quality improvement as well as providing wildlife habitat.
Through the RVCA's Trees for Tomorrow Program, 27,550 trees have been planted in the Bobs Lake Catchment at three sites from 2011 to 2016; prior to this, no trees have been planted in the catchment with the program's assistance. This has resulted in the reforestation of 14 hectares at a total project value of $58,992 with $52,767 of that amount coming from fundraising sources.
An additional 10 butternut trees were planted through the RVCA Butternut Recovery Program in the Bobs Lake Catchment as part of efforts to introduce healthy seedlings from tolerant butternuts into various locations across Eastern Ontario.
In the Crow Lake Catchment prior to 2005, 500 trees were planted for a total project value of $500. No other trees have been planted since then using the services of the Trees for Tomorrow Program.
Natural shoreline buffers rich in native plants are critically important to protecting the health of our lakes, rivers and streams. Shoreline vegetation protects water quality and aquatic habitat by intercepting potentially harmful contaminants such as nutrients, pollutants and sediment, regulating water temperatures, slowing runoff and providing important fish and wildlife habitat. Natural shorelines also help improve climate change resiliency by increasing flood storage and providing protection from erosion during extreme weather events.
Though the RVCA’s Shoreline Naturalization Program, landowners (private and public property owners) have naturalized more than 2.3 km of shoreline in the Tay Watershed by planting over 10,563 native trees and shrubs at 96 sites since 2008. A number of these projects have been undertaken in partnership with community groups like the Greater Bobs and Crow Lakes Association.
In the Bobs Lake Catchment, a total of 1034 native trees and shrubs have been planted along 260 metres of shoreline at an average buffer width of three metres for a total project value of $8,081.
In the Crow Lake Catchment, a total of 446 native trees and shrubs have been planted along 147 metres of shoreline at an average buffer width of four metres for a total project value of $5,284.
5.4 Septic System Re-inspection
Septic system re-inspection is provided by the RVCA through the Mississippi Rideau Septic System Office at the request of South Frontenac and Tay Valley Townships.
Since 2004, the service has performed 151 mandatory and voluntary septic system re-inspections on 119 properties in the Bobs Lake catchment, of which, one hundred and forty-nine mandatory inspections were conducted on 117 properties around Bobs Lake in Tay Valley Township along with other two voluntary re-inspections on two properties in the Township of South Frontenac.
Remedial/maintenance work (i.e. pump outs and baffle replacements that generally do not require a permit) was recommended for 27 of those inspections; two more inspections resulted in additional information being supplied to landowners and one other inspection identified the need for a septic system replacement.
5.5 Valley, Stream, Wetland and Hazard Lands
The Bobs Lake Catchment covers 132 square kilometres with 9.3 square kilometres (or seven percent) of the drainage area being within the regulation limit of Ontario Regulation 174/06 (Figure 130), giving protection to wetland areas and river or stream valleys that are affected by flooding and erosion hazards.
Wetlands occupy 11 square kilometres (or 21 percent) of the catchment. Of these wetlands, two square kilometres (or 18 percent) are designated as provincially significant and included within the RVCA regulation limit. This leaves the remaining 9 sq. km (or 82 percent) of wetlands in the catchment outside the regulated area limit.
Of the 324.3 kilometres of stream in the catchment, regulation limit mapping has been plotted along 22.8 kilometers of streams (representing seven percent of all streams in the catchment). Some of these regulated streams (16.4 km) flow through regulated wetlands; the remaining 6.4 kilometres of regulated streams are located outside of those wetlands. Plotting of the regulation limit on the remaining 301.5 kilometres (or 93 percent) of streams requires identification of flood and erosion hazards and valley systems.
Within those areas of the Bobs Lake catchment subject to the regulation (limit), efforts (have been made and) continue through RVCA planning and regulations input and review to manage the impact of development (and other land management practices) in areas where “natural hazards” are associated with rivers, streams, valley lands and wetlands. For areas beyond the regulation limit, protection of the catchment’s watercourses is only provided through the “alteration to waterways” provision of the regulation.
Figure 130 Regulated natural features and hazards in the Bobs Lake catchment
The Crow Lake Catchment covers 50.7 square kilometres and contains 18 square kilometres of wetland along with 131.9 kilometres of stream. None of these natural features are subject to the regulation limit of Ontario Regulation 174/06 (Figure 78) for the protection of wetland areas and river or stream valleys that are affected by flooding and erosion hazards.
For areas where no regulation limit exists, protection of the catchment’s watercourses is provided through the “alteration to waterways” provision of the regulation.
Figure 131 Regulated natural features and hazards in the Crow Lake catchment
5.6 Vulnerable Drinking Water Areas
Mississippi-Rideau Source Water Protection Program has mapped several small areas of the Bobs Lake Catchment as a Significant Groundwater Recharge Area and all of the catchment as a Highly Vulnerable Aquifer (HVA). This means that the nature of the overburden (thin soils, fractured bedrock) does not provide a high level of protection for the underlying groundwater making the aquifer more vulnerable to contaminants released on the surface. There are no Well-Head Protection Areas in the catchment.
Mississippi-Rideau Source Water Protection Program has not mapped any area of the Crow Lake Catchment as a Significant Groundwater Recharge Area. It has, however, mapped all of the catchment as a Highly Vulnerable Aquifer (HVA). This means that the nature of the overburden (thin soils, fractured bedrock) does not provide a high level of protection for the underlying groundwater making the aquifer more vulnerable to contaminants released on the surface. There are no Well-Head Protection Areas in the catchment.
The Mississippi-Rideau Source Protection Plan includes policies that focus on the protection of groundwater region-wide due to the fact that most of the region, which encompasses the Mississippi and Rideau watersheds, is considered Highly Vulnerable Aquifer. For detailed maps and policies that have been developed to protect drinking water sources, visit the Mississippi-Rideau Source Protection Region website.
6.0 Bobs and Crow Lake Catchments: Accomplishments
Developed by the Greater Bobs and Crow Lakes Association and its partners, the Stewardship Plan for Bobs and Crow Lakes (2007) provides information on many aspects of the lake environment, as well as issues of concern and actions to be taken to maintain and improve the long-term health of the lakes. The following list includes some of the accomplishments of the Bobs and Crow Lakes Association and residents that have implications for the well-being of the land and water resources of the lake ecosystem. Specific achievements of the Bobs and Crow Lake communities are indicated by an asterisk.
Bobs and Crow Lake Catchment Health
Shoreline Naturalization
1034 native trees and shrubs have been planted at 18 project sites on Bobs Lake by the RVCA’s Shoreline Naturalization Program at an average buffer width of three metres along 260 metres of shoreline.
446 native trees and shrubs have been planted at seven project sites on Crow Lake by the RVCA’s Shoreline Naturalization Program at an average buffer width of four metres along 147 metres of shoreline.
Tree Planting
27,550 trees have been planted at three sites in the Bobs Lakecatchment by the RVCA Private Land Forestry Program, resulting in the reforestation of 14 hectares.
500 trees have been planted at one site in the Crow Lakecatchment by the RVCA Private Land Forestry Program.
Water Levels
Surface water flows and levels at the new Bolingbroke Dam on Bobs Lake will be better monitored as a result of input from the Greater Bobs and Crow Lakes Association. This information will enhance the management of the water control structure so that it will be better aligned with Parks Canada's established rule curve for this reservoir lake of the Rideau Canal.*
Water Quality
Bobs Lake, Crow Lake and Rock Lake are each sampled yearly by the RVCA for five parameters, four times a year to assess surface chemistry water quality conditions.
Ten Rural Clean Water projects were completed in the Bobs Lake catchment by the RVCA Rural Clean Water Program.
Eight Rural Clean Water projects were completed in the Crow Lake catchment by the RVCA Rural Clean Water Program.
Township of Central Frontenac will implement a septic re-inspection program (mandatory/voluntary) in 2019. The service is to be provided by the Mississippi-Rideau Septic System Office.
Bobs and Crow Lake Catchment Habitat
In-stream Habitat
39 headwaters sites were sampled by the RVCA's Stream Characterization Program.
Greater Bobs and Crow Lakes Association Leadership
Lake Planning
The Stewardship Plan for Bobs and Crow Lakes (2007) was published in March 2007. Since then, projects and issues related to the aim of the Plan have been discussed annually at the Lake Association’s Annual General Meeting, which is to 1) identify the qualities that make the area such a desirable place for people to live or visit and the challenges that put those qualities at risk 2) recommend a series of actions that will help to ensure the sustainability of the lakes, the lands, the natural ecosystem and the way of life that we value and 3) serve as a reference and guide to support continued activity for the stewardship of the lakes.*
As of 2017, the Bobs and Crow Lake Association and its Foundation has been partnering with the RVCA to provide additional program support to landowners interested in naturalizing their shoreline, protecting their shoreline from erosion and repairing septic systems.
Liaison with Other Lake Associations
The Greater Bobs and Crow Lakes Association continues to liaise with other local lake associations through its participation in the Lake Networking Group.*
7.0 Bobs and Crow Lake Catchments: Challenges/Issues
Developed by the Greater Bobs and Crow Lakes Association and its partners, the Stewardship Plan for Bobs and Crow Lakes (2007) provides information on many aspects of the lake environment, as well as issues of concern identified by the lake community that could threaten the long-term health of the lakes. The following list includes some of those identified issues that have implications for the land and water resources of the lake ecosystem. Specific issues noted by the lake community are indicated by an asterisk.
Development
Municipal jurisdiction is split between the three area municipalities (South/Central Frontenac and Tay Valley), which has created some inconsistencies in land use policies and zoning requirements and the ability to implement a comprehensive septic re-inspection program.*
There are numerous valid mining claims which are a significant cause for concern for local residents, particularly as it relates to property rights and the impact of mining activity on wildlife habitat and water quality.*
Waterfront property development is occurring primarily through the transformation of traditional, seasonal cottages into larger year-round dwellings. This transition is taking place either through re-development of an existing cottage lot or incremental alterations (additions, sleeping cabins, gazebos, decks, sheds, boat houses, garages, lawns, shoreline modifications, docks), all of which may put additional stress on the sensitive shoreline zone and the lake along with potential, added septic system loading.
Many waterfront properties contain existing non-conforming dwellings with respect to minimum water frontage and lot area and are often located within 30 metres of the water that require minor variances for expansion and/or reconstruction of dwellings where standard development setbacks from water are difficult to achieve. In these cases, of which there are many, staff at South/Central Frontenac and Tay Valley Townships and the Conservation Authority often meet with resistance and push back when attempts are made to implement standards for development setbacks, vegetated shorelines and septic systems.
Monitoring implementation of conditions of planning and regulatory approvals is challenging due to a lack of resources.
Headwaters/In-water Habitat/Shorelines
Crow Lakehas 70 percent of its shoreline composed of natural vegetation. This is below the 75 percent target that is recommended by experts for the protection of the catchment’s waterbodies and watercourses, 30 metres back from the shoreline of streams, rivers and lakes (see Section 4.4 of this report).
Bobs and Crow Lake benefit from considerable lengths of natural shoreline. However many waterfront properties (particularly those in Buck/Mud/Long Bay and Crow Lake Village) have significant lengths of shoreline that are ornamental (see Section 4.4 of this report).
Bobs Lake has seen a small increase in the area of settlement (0.79 ha.) along its shoreline between 2008 and 2014, due primarily to a loss of woodland (see Section 4.4 of this report).
Crow Lake has seen a small increase in the area of settlement (0.10 ha.) along its shoreline between 2008 and 2014, due primarily to a loss of crop and pastureland (see Section 4.4 of this report).
Five of 39 sampled headwater sites in the Bobs Lake catchment have been modified (four are channelized, one is a roadside ditch)(see Section 3.2.2 of this report).
One of 22 sampled headwater sites in the Crow Lake catchment has been modified (i.e., is a roadside ditch)(see Section 3.3.2 of this report).
Littoral zone mapping identifying substrate type, vegetation and habitat features along with opportunities for shoreline enhancement is unavailable for Bobs and Crow Lake.
Land Cover
Bobs Lake catchment land cover has changed (2008 to 2014) as a result of an increase in the area of wetland (15 ha.), settlement (5 ha.), water (4 ha.) and transportation infrastructure (2 ha.) and a loss of woodland (20 ha.), meadow-thicket (5 ha.) and crop and pastureland (1 ha.)(see Section 4.1.1 of this report).
Crow Lake catchment land cover has changed (2008 to 2014) as a result of an increase in the area of wetland (5 ha.) and settlement (2 ha.) and loss of woodland (6 ha.)(see Section 4.1.2 of this report).
Wetlands cover 13 percent (1789 ha.) of the Bobs Lake catchment and 18 percent (891 ha.) of the Crow Lake catchment. Eighty-two percent (1465 ha.) of the Bobs Lake catchment wetlands along with one hundred percent (891 ha.) of the Crow Lake catchment wetlands remain unevaluated and unregulated and although they are not under imminent threat from development activity, they do remain vulnerable to drainage and land clearing activities in the absence of any regulatory and planning controls that would otherwise protect them for the many important hydrological, social, biological and ecological functions/services/values they provide to landowners and the surrounding community (see Section 4.3 of this report).
Water Levels
Greater Bobs and Crow Lakes Association has been concerned for many years about the operational management of the water control structure on Bobs Lake (locally known as the Bolingbroke Dam). Refurbishment of that structure (now taking place) should include a review of past water level practices guided by the Bobs Lake rule curve to better inform future operations.*
Water Quality
Bobs Lakesurface chemistry water quality rating ranges from Poor to Very Good at the nine deep point monitoring sites on the lake (see Section 2.1 of this report).
Crow Lake surface chemistry water quality does not exhibit any sampling concerns (see Section 2.3 of this report).
Rock Lake surface chemistry water quality rating ranges from Fair to Very Good. The score at this site is largely influenced by occasional high nutrient concentrations, bacterial pollution and metal (aluminum) exceedances (see Section 2.2 of this report).
Bobs and Crow Lake catchmentinstream biological water quality conditions are unavailable due to unsuitable benthic invertebrate sample locations.
Thirty (of 151) mandatory and voluntary septic system inspections conducted from 2004 to 2017 on Bobs Lakein South Frontenac and Tay Valley Townships revealed the need for remedial work on 27 septic systems, a septic replacement on another system along with more information to be supplied to an additional two landowners about their septic systems. Those properties with concerns are identified in the yearly report submitted by the Mississippi Rideau Septic System Office to the Townships.
No septic system re-inspection program (mandatory or voluntary) exists for Crow Lake.
8.0 Bobs and Crow Lake Catchments: Actions/Opportunities
Developed by the Greater Bobs and Crow Lakes Association and its partners, the Stewardship Plan for Bobs and Crow Lakes (2007) provides information on many aspects of the lake environment, as well as actions to be taken to maintain and improve the long-term health of the lakes. The following list includes some of those identified actions that have implications for the well-being of the land and water resources of the lake ecosystem. Specific actions noted by the Bobs Lake community are indicated by an asterisk.
Bobs and Crow Lake Catchments Health
Development
Work with approval authorities (Central Frontenac Township, Frontenac County, Kingston Frontenac Lennox and Addington Health Unit, Mississippi Rideau Septic System Office, RVCA, South Frontenac and Tay Valley Townships) and waterfront property owners (including the Greater Bobs and Crow Lakes Association and Rock Lake community) to consistently implement current land use planning and development policies for water quality and shoreline protection adjacent to Bobs and Crow Lake and headwater streams in the catchment (i.e., a minimum 30 metre development setback from water).
Explore ways and means to more effectively enforce and implement conditions of land-use planning and development approval to achieve net environmental gains (particularly with respect to rehabilitating or protecting naturally vegetated shorelines and water quality).
Encourage Committees of Adjustment to take advantage of technical and environmental information and recommendations forthcoming from planning and environmental professionals.
Municipalities in the Tay Watershed are encouraged to strengthen natural heritage and water resources official plan policies and zoning provisions (pertaining to water setbacks, frontage and naturalized shorelines and wetland protection) where deemed appropriate.
Work with Central Frontenac Township, Frontenac County, South Frontenac and Tay Valley Townships and agencies to ensure that development approvals around lakes and along watercourses take into consideration the protection of fish habitat (including the near-shore nursery and spawning habitat).
Municipal and agency planners together with development proponents are to use the 2014 Site Evaluation Guidelines to inform decision-making about the application of development setbacks on lots with shallow soils/bedrock, steep slopes and sparse vegetation cover along with the use of the appropriate, development related, best management practices.
Utilize RVCA subwatershed and catchment reports to help develop/revise official plan policies to protect surface water resources and the natural environment (including woodlands, wetlands and shoreline cover).
Use 1:100 year flood elevation information now available for Bobs Lake as an additional factor to be considered when assessing development setbacks at the shoreline and protecting property owners from flood hazards.
Establish RVCA regulation limits around the 82 percent (1465 ha.) of wetlands in the Bobs Lake catchment along with the 100 hundred percent (891 ha.) of wetlands in the Crow Lake catchment catchment that are unevaluated. Doing this will help protect landowners from natural hazards including mitigating surface water flow by storing water during periods of peak flow (such as spring snowmelt and heavy rainfall events) and releasing water during periods of low flow (this mitigation of water flow reduces flood damage), as well as contributing to the stabilisation of shorelines and to the reduction of soil erosion damage through water flow mitigation and plant soil binding/retention.
Shorelines
Take advantage of the RVCA Shoreline Naturalization Program to re-naturalize altered creek, lake and stream shoreline identified in this report as “Unnatural Riparian Land Cover". Concentrate stewardship efforts on Bobs and Crow Lakes waterfront properties shown in orange on the Riparian Land Cover map (see Figures 126/127 in Section 4.4 of this report).Other stewardship opportunities in the catchment may be determined based on septic system inspections and surface water quality monitoring results.
Promote the use of bioengineering methods (using native shrub/tree planting, fascines, live stakes) as a shoreline erosion mitigation measure as well as a cost effective alternative to shoreline hardening (with rip rap, armour stone, gabion baskets, walls)
Educate landowners about the value and importance of headwater drainage features, natural shorelines and waterfront property best management practices with respect to shoreline use and development, septic system installation and maintenance and shoreline vegetation retention and enhancement (Central Frontenac Township, Frontenac County, Greater Bobs and Crow Lakes Association, Kingston Frontenac Lennox and Addington Health Unit, Mississippi-Rideau Septic System Office, Rock Lake community, RVCA, South Frontenac and Tay Valley Townships).
Water Quality
Greater Bobs and Crow Lakes Association will work with the Township of South Frontenac to establish a septic system re-inspection program on Bobs and Crow Lake along with an associated educational program.*
Consider further investigation of the Poor to Very Goodsurface chemistry water quality rating on Bobs Lake as part of a review of RVCA's Watershed Watch, Baseline and Benthic Invertebrate surface water quality monitoring.
Offer funding provided by the RVCA Rural Clean Water Program to landowners with potential projects that could improve water quality on Bobs and Crow Lakes and their tributaries (e.g., livestock fencing, septic system repair/replacement and streambank erosion control/stabilisation). Concentrate efforts at septic systems requiring remedial work or replacement, including the 28 identified as needing additional maintenance/remedial/replacement work since 2004.
Educate waterfront property owners about septic system care by providing information about sewage system maintenance (i.e., when to pump out septic systems and holding talks) through initiatives such as the Septic Savvy Workshop and services provided by the Mississippi Rideau Septic System Office.
Reduce pollutant loadings to Bobs Lake through education about the application of shoreline, stormwater and agricultural best management practices; also consider using low impact development (LID) methods to improve the quality and reduce the amount of stormwater runoff directly reaching the lake ecosystem. This will be particularly beneficial in areas with extensive impervious surfaces (i.e., asphalt, concrete, buildings, and severely compacted soils) or on sensitive waterfront properties (with steep slopes/banks, shallow/impermeable soils).
Bobs and Crow Lake Catchments Habitat
Aquatic Habitat/Fisheries/Wildlife
Increase boating enforcement in established high hazard areas (e.g. narrows, environmentally sensitive areas like wildlife and fish nesting sites and high density population areas) and post signage in sensitive shoreline and wetland habitats to discourage intrusion by personal watercraft.*
Educate waterfront property owners about: 1) fish habitat requirements, spawning timing and near-shore and in-water activities that can disturb or destroy fish habitat and spawning sites 2) the causes of excessive algae and aquatic vegetation growth (see the RVCA publication entitled Algae and Aquatic Plant Educational Manual) and 3) healthy lake ecosystems and associated water level fluctuations in a natural environment.
Greater Bobs and Crow Lakes Association Leadership
Lake Planning
The Greater Bobs and Crow Lakes Association is leading the coordination of the implementation of the recommendations of the Stewardship Plan for Bobs and Crow Lakes (2007).
Consider a ten-year review of the Stewardship Plan for Bobs and Crow Lakes (2007).
Use the information contained in the Tay River Subwatershed Report 2017 and Bobs Lake Catchment Report 2017 to assist with implementation of the Bobs and Crow Lakes Stewardship Plan (2007) and an update to it.
Water Levels
Surface water flows and levels at the new Bolingbroke Dam on Bobs Lake will be better monitored as a result of input from the Greater Bobs and Crow Lakes Association. This information will help to ensure that management of the water control structure will more closely align with Parks Canada's existing rule curve (and any subsequent revisions to it) for this reservoir lake of the Rideau Canal.*
Continue dialogue with the Parks Canada - Rideau Canal Office (RCO) and others to ensure that water levels are managed in a manner that balances fish and wildlife habitat needs within the riparian zone along with recreational and aesthetic uses of Bobs Lake, while recognizing the need to maintain downstream water levels and accommodate other uses of the lake. Establish an education and communications program about managing water levels so that people are aware of the possibilities and limitations inherent in the operation of the new Bolingbroke Dam.*
Figure 1 Land cover in the Christie Lake catchment
The RVCA produces individual reports for 14 catchments in the Tay River subwatershed. Using data collected and analyzed by the RVCA through its watershed monitoring and land cover classification programs, surface water quality and in-stream conditions are reported for the Tay River, Tay Watershed lakes and Tay tributaries along with a summary of environmental conditions for the surrounding countryside every six years.
This information is used to better understand the effects of human activity on our water resources, allows us to better track environmental change over time and helps focus watershed management actions where they are needed the most to help sustain the ecosystem services (cultural, aesthetic and recreational values; provisioning of food, fuel and clean water; regulation of erosion/natural hazard protection and water purification; supporting nutrient/water cycling and habitat provision) provided by the catchment’s lands and forests and waters (Millennium Ecosystem Assessment 2005).
The following sections of this report are a compilation of that work for the Christie Lake catchment.
65 square kilometres; occupies eight percent of the Tay River subwatershed; one percent of the Rideau Valley watershed.
Geology/Physiography
Christie Lake Catchment resides within part of the physiographic region known as the Algonquin Highlands. In the Tay River subwatershed, this ancient and hilly geologic region is made up of such Precambrian rocks as marble, conglomerates, and dark or colour banded granite-like rocks. A veneer of glacial drift (glacial till, sand etc.) overlies the bedrock.
Municipal Coverage
Rideau Lakes Township: (<1 km2; 0.5% of catchment)
Tay Valley Township: (65 km2; 99.5% of catchment)
Stream Length
All tributaries (including headwater streams): 194 km
1.2 Vulnerable Areas
Aquifer Vulnerability
Mississippi-Rideau Source Water Protection program has mapped only two very small parts of this catchment as a Significant Groundwater Recharge Areas and all of the catchment as a Highly Vulnerable Aquifer (HVA). There are no Well-Head Protection Areas in the catchment.
Wetland Hydrology
A watershed model developed by the RVCA in 2009 was used to study the hydrologic function of wetlands in the Rideau Valley Watershed, including those found in the Christie Lake catchment.
1.3 Conditions at a Glance
Aggregates
There are three aggregate licenses within the catchment along with some sand and gravel areas and secondary and tertiary significance.
Fish Community/Thermal Regime
Warm and cool water recreational and baitfish fishery with 22 species observed in the Tay River (Bolingbroke to Christie Lake) during 2016.
Headwater Drainage Features
Dominated by wetland and natural features with minimal modifications.
Instream/Riparian Habitat
Tay River (Bolingbroke to Christie Lake): Moderate to high habitat complexity observed throughout the reaches of the system within the catchment. Dissolved oxygen conditions for the Tay River varied along the system for both warm and coolwater species.
Land Cover Change (2008 to 2014)
Catchment
Woodland
Crop-Pasture
Settlement
Wetland
Hectares
-2
-1
+2
+1
Land Cover Type (2014)
Catchment
Woodland
Water
Wetland
Crop-Pasture
Transportation
Meadow-Thicket
Settlement
Percent
57
17
14
4
3
3
2
Shoreline Cover Type (30 m. riparian area; 2014)
Catchment
%
Christie Lake
%
Davern Lake
%
Farren Lake
%
Little Silver Lake
%
Woodland
59
Woodland
63
Woodland
63
Woodland
66
Woodland
81
Wetland
31
Settlement
27
Wetland
29
Settlement
31
Settlement
13
Settlement
4
Wetland
5
Settlement
7
Wetland
2
Wetland
4
Crop-Pasture
2
Transportation
5
Transportation
1
Transportation
1
Transportation
2
Transportation
2
---
---
---
---
---
---
---
---
Meadow-Thicket
2
---
---
---
---
---
---
---
---
O'Brien Lake
%
Rainbow Lake
%
Davern Creek
%
Tay River
%
Streams
%
Woodland
81
Woodland
80
Wetland
68
Wetland
55
Woodland
57
Settlement
12
Settlement
11
Woodland
27
Woodland
25
Wetland
37
Wetland
5
Wetland
9
Crop-Pasture
2
Crop-Pasture
11
Crop-Pasture
2
Transportation
1
---
---
Transportation
2
Settlement
5
Transportation
2
Meadow-Thicket
<1
---
---
Meadow-Thicket
1
Transportation
2
Meadow-Thicket
2
--
---
---
---
---
Aggregate
2
---
---
Significant Natural Features
Christie Lake Provincially Significant Wetland.
Christie Lake Regional Candidate Area of Natural and Scientific Interest, Life Science.
Maberly Bog Regional Candidate Area of Natural and Scientific Interest, Life Science.
Species at Risk (Elemental Occurrence)
Status
Species at Risk
Endangered
Northern Myotis
---
---
---
Threatened
Blanding's Turtle
Bobolink
Eastern Meadowlark
Least Bittern
Special Concern
Eastern Milksnake
Eastern Musk Turtle
Eastern Ribbonsnake
Snapping Turtle
Water Quality for the Protection of Aquatic Life
Water Quality Source
Christie Lake
Davern Lake
Farren Lake
Little Silver Lake
O'Brien Lake
Rainbow Lake
Tay River
Surface Chemistry
Good to Very Good
Good to Very Good
Fair to Good
Fair
Fair to Very Good
Fair to Good
Good to Very Good
Instream Biological
---
---
---
---
---
---
Good
Tay River: Benthic invertebrate samples are dominated by species that are sensitive to high organic pollution levels.
Water Wells
Approximately 290 operational private water wells in the Christie Lake catchment. Groundwater uses are mainly domestic but also include livestock and public water supplies.
Wetland Cover
Wetlands are reported to have covered 15 percent of the Grants Creek catchment prior to European settlement, as compared to 14 percent (or 9.0 square kilometres) of the area in 2014. This represents a four percent (or 0.4 square kilometre) loss of historic wetland cover. Fourteen percent of the remaining wetlands are regulated leaving 87 percent (or 7.8 square kilometers) unregulated.
1.4 Catchment Care
Environmental Management
The Christie Lake Association prepared the Christie Lake State of the Lake Report (2009), 2011 Lake Stewardship Guideline (2011) and Christie Lake Brochure (a planned 5 year update of the Lake Stewardship Guide); Farren Lake Property Owners' Association has prepared the Farren Lake State of the Lake Report (2009); Little Silver and Rainbow Lakes Property Owners Association has prepared the Little Silver and Rainbow Lake Stewardship Plan (2018). These plans and reports provide a summary of what is known about Christie Lake, Farren Lake and Little Silver and Rainbow Lakes, along with each lake community’s vision for their lakes and a list of each lake's main concerns and actions to address them.
Development along the Tay River (at its outlet from Christie Lake) is subject to Ontario Regulation 174-06 (entitled “Development, Interference with Wetlands and Alterations to Shorelines and Watercourses”) that protects landowners and their property from natural hazards (flooding, fluctuating water table, unstable soils) associated with them.
Two Environmental Compliance Approvals in the catchment were sought for a camp sewage works and a waste management site.
Environmental Monitoring
Chemical surface (in-stream/lake) water quality collection by the RVCA since 2003 (see Section 2 of this report).
Benthic invertebrate (aquatic insect), surface (in-stream) water quality collection by the RVCA in the Tay River since 2005 (see Section 3.3.1 of this report).
Fish survey and stream characterization survey by the RVCA on the Tay River in 2017 taking measurements and recording observations on instream habitat, bank stability, other attributes and preparing a temperature profile (see Section 3 of this report).
Twenty-nine drainage feature assessments were conducted by the RVCA in 2016 at road crossings in the catchment. The protocol measures zero, first and second order headwater drainage features and is a rapid assessment method characterizing the amount of water, sediment transport, and storage capacity within headwater drainage features (see Section 3.4 of this report).
Classification of Christie Lake catchment land cover classes using data acquired during the spring of 2008 and 2014 from colour aerial photography (see Section 4.1 of this report).
The Mississippi Rideau Septic System Office has conducted 342 mandatory septic system re-inspections around Christie and Farren Lake, 126 mandatory and voluntary septic system re-inspections on Little Silver, Rainbow and Silver Lake and 42 voluntary re-inspections around Davern Lake, O'Brien Lake and along the Tay River reach in the catchment, from 2004 to 2017 (see Section 5.5 of this report).
Provincial groundwater level and chemistry data is available from a PGMN well located near the shore of Christie Lake (W252).
Stewardship
Thirty-nine stewardship projects were completed by landowners with assistance from the RVCA (see Section 5 of this report).
2.0 Christie Lake Catchment: Water Quality Conditions
Surface water quality conditions in the Christie Lake catchment are monitored by the Rideau Valley Conservation Authority’s (RVCA) Watershed Watch Program and Baseline Water Quality Monitoring Program. Watershed Watch monitors watershed lakes to assess nutrient concentrations, water clarity, dissolved oxygen availability and pH. The baseline water quality program focuses on streams; data is collected for 22 parameters including nutrients (total phosphorus, total Kjeldahl nitrogen and ammonia), E. coli, metals (like aluminum and copper) and additional chemical/physical parameters (such as alkalinity, chlorides, pH and total suspended solids). Figure 2 shows the locations of monitoring sites in the catchment.
Figure 2 Water quality monitoring sites in the Christie Lake catchment
Water Quality Rating in the Christie Lake Catchment
The water quality ratings scored high across this catchment and range from "Fair to Very Good" (Table 1); with a rating of "Fair” in Little Silver Lake, "Fair to Good" in Farren and Rainbow Lakes, "Fair to Very Good" in O’Brien Lake and “Good to Very Good” in Christie and Davern Lakes. At the two monitoring sites on the Tay River (TAY-16 and TAY-15), water quality rated as “Very Good” and “Good to Very Good” respectively.
All ratings are determined using by the Canadian Council of Ministers of the Environment (CCME) Water Quality Index. A "Fair" rating indicates that water quality is usually protected but is occasionally threatened or impaired; conditions sometimes depart from natural or desirable levels. A rating of "Good" indicates that only a minor degree of threat or impairment is observed and conditions rarely depart from natural or desirable levels. “Very Good indicates water quality is protected with a virtual absence of threat or impairment; conditions are very close to natural or pristine levels.”
Each water quality parameter is evaluated against established guidelines to determine water quality conditions. Those parameters that frequently exceed guidelines are presented below. Data has been analyzed over the 2006-2017 period for general trends and conditions. Table 1 shows the overall rating for the monitored surface water quality sites within the catchment and Table 2 outlines the Water Quality Index (WQI) scores and their corresponding ratings.
Table 1 Water Quality Index ratings for the Christie Lake Catchment
Site
Location
2006-2008
2009-2011
2012-2014
2015-2017
DP1
Christie Lake
Good (88)
Very Good (100)
Very Good (100)
Good (88)
DP1
Davern Lake
Very Good (100)
Fair (75)
Good (88)
Good (88)
DP1
Farren Lake
Fair (77)
Very Good (100)
Very Good (100)
Good (88)
DP1/DP3
Little Silver Lake
Fair (76)
Fair (65)
Fair (76)
Fair (77)
DP1
O'Brien Lake
Very Good (100)
Fair (76)
Fair (65)
Very Good (100)
DP1
Rainbow Lake
Fair (75)
Fair (76)
Fair (75)
Good (85)
TAY-16
Tay River at Bolingbroke
Good (91)
Very Good (97)
Very Good (100)
Very Good (100)
TAY-15
Tay R. at Christie L. outlet
Good (91)
Good (94)
Very Good (100)
Very Good (100)
Table 2 Water Quality Index ratings and corresponding index scores (RVCA terminology, original WQI category names in brackets)
Rating
Index Score
Very Good (Excellent)
95-100
Good
80-94
Fair
65-79
Poor (Marginal)
45-64
Very Poor (Poor)
0-44
2.1 Little Silver Lake Water Quality
Surface water quality conditions in Little Silver Lake have been monitored by RVCA’s Watershed Watch Program since 2006. Data from the deep point sites (DP1 and DP3) have been used to calculate the WQI rating for Little Silver Lake, which averaged “Fair” over the 2006-2017 period (Table 1). Moderate nutrient concentrations, good oxygen availability and clear water all influenced this rating. The following discussion explains how each of the monitored water quality parameters contributes to the lake’s water quality.
This report also considers data from seven additional shoreline sites that are monitored around the lake. These sites have not been included in the calculation of the CCME WQI rating, as they are not monitored with the same frequency as the deep point site. However, they do provide important information on water quality conditions in the near shore areas. For locations of shoreline sites (A-H), please see Figure 2.
2.1.1 Little Silver Lake Nutrients
Total phosphorus (TP) is used as a primary indicator of excessive nutrient loading and contributes to abundant aquatic vegetation growth and depleted dissolved oxygen levels. The Provincial Water Quality Objective (PWQO) is used as the TP Guideline and states that in lakes, concentrations greater than 0.020 mg/l indicate an excessive amount of TP within the water column.
Total Kjeldahl nitrogen (TKN) is used as a secondary indicator of nutrient loading. RVCA uses a guideline of 0.500 mg/l to assess TKN[1]within surface waters.
Nutrients at the Little Silver Lake Deep Points
TP and TKN sampling results collected by the RVCA are presented in Figures 3 to 6. Some variability has occurred in the sampled TP concentrations at this site (Figures 3 and 4), and a decreasing trend[2] was observed in the 2006-2017 data set. Eighty-seven percent of samples analyzed for TP were less than the TP guideline and the average concentration was 0.014 mg/l (Table 3). TKN concentration also showed variability though no significant change was observed (Figures 5 and 6). Eighty-nine percent of reported results were below the TKN guideline and the average TKN concentration was 0.379 mg/l (Table 3).
Figure 3 Total phosphorous sampling results at deep point sites (DP1 and DP3) on Little Silver Lake, 2006-2017
Figure 4 Average total phosphorous results at deep point sites (DP1 and DP3) on Little Silver Lake, 2006-2017
Figure 5 Total Kjeldahl nitrogen sampling results at deep point sites (DP1 and DP3) on Little Silver Lake, 2006-2017
Figure 6 Average total Kjeldahl nitrogen results at deep point sites (DP1 and DP3) on Little Silver Lake, 2006-2017
Table 3 Summary of nutrient results for Little Silver Lake, 2006-2017.
Total Phosphorous 2006-2017
Site
Average (mg/l)
Below Guideline
No. Samples
DP1/DP3
0.014
87%
87
Total Kjeldahl Nitrogen 2006-2017
Site
Average (mg/l)
Below Guideline
No. Samples
DP1/DP3
0.379
89%
88
Overall, the data presented indicates that nutrient concentration may be considered low with occasional exceedances in the mid-lake, deep water sites on Little Silver Lake.
Nutrients around Little Silver Lake
The average nutrient concentrations at monitored shoreline sites around the lake vary from year to year (Figures 7 and 8). Please note that in the 2006-2017 monitoring period sites A, E and F were monitored yearly; while sites B, C, D and G were only sampled in 2006, 2011 and 2016.
Average total phosphorous concentrations are below the TP guideline at all sites (Figure 7), as are the average total Kjeldahl nitrogen concentrations for the TKN guideline at all sites (Figure 8).
Figure 7 Average total phosphorous concentrations at shoreline monitoring sites in Little Silver Lake, 2006-2017
Figure 8 Average total Kjeldahl nitrogen concentrations at shoreline monitoring sites in Little Silver Lake, 2006-2017
Summary of Little Silver Lake Nutrients
Little Silver Lake nutrient concentrations are generally below the guidelines, with few exceedances. It is possible that occasional problems with nutrient enrichment (i.e. algal blooms or excessive plant growth) may be observed in shallow, sheltered bays.
Efforts such as the diversion of runoff and enhanced shoreline buffers are important to continue to protect and enhance water quality, and reduce future nutrient increases. Nutrient exceedances may be partially attributed to the natural aging of a lake and basin characteristics. All residents can help minimize their impact on the lake by reducing nutrient inputs through practices such as proper maintenance of septic systems, keeping shorelines natural and using phosphate free soaps and detergents. Promotion of sound stewardship and protection around lake is important to maintain and protect water quality conditions into the future.
2.1.2 Little Silver Lake Water Clarity
Water clarity is measured using a Secchi disk during each deep point sample. Table 4 summarizes the recorded depths with an average depth of 4.7 m and shows that most (96% of) readings have exceeded the minimum PWQO of 2 m indicating that algae in the water column are not at excessive levels (good water clarity). Less than 2 m will indicate overproduction in a lake or significant inputs to the water column that are limiting light availability. Figure 9 shows that no individual reading has been below the guideline and measured depths range from 2.5 m to 8.0 m. A decreasing trend was observed within the 2006-2017 data set, indicating that Secchi depths have been reduced over this period.
Table 4 Summary of Secchi depths recorded at the deep point sites on Little Silver Lake, 2006-2017
Secchi 2006-2017
Site
Average (m)
Above Guideline
No. Samples
DP1/DP3
4.7
96%
83
Figure 9 Recorded Secchi depths at the deep point sites (DP1/DP3) on Little Silver Lake, 2006-2017
Summary of Little Silver Lake Water Clarity
Waters in Little Silver Lake are generally clear and sufficient sunlight is able to penetrate the water column to support aquatic life and provide sufficient visibility for safe recreational use (boating, swimming).
2.1.3 Little Silver Lake Fish Habitat
Two other factors, dissolved oxygen/temperature and pH were also assessed to provide an overall sense of the health of Little Silver Lake from a fish habitat perspective.
2.1.3.1 Little Silver Lake Dissolved Oxygen and Temperature
The red bars in Figure 10 show the depths where suitable conditions exist for warm water fish species (temperature less than 25°C and dissolved oxygen greater than 4 mg/l) at the deep point site. The vertical axis represents the total lake depth. Suitable conditions typically decline throughout the summer to about 6m of the water column. In late 2016, habitat conditions were notably low due to the warming of the water column. Overall, no significant change was noted in conditions through the 2006-2017 period.
Figure 10 Depths suitable for warm water fish species at the deep point sites (DP1 and DP3) on Little Silver Lake, 2006-2017.
2.1.3.2 Little Silver Lake pH
pH is a basic water quality parameter used to assess the acidity of water, an important factor for aquatic life. Figure 11 shows the monitored pH values over the 2006-2017 period.
Figure 11 pH concentrations at the deep point sites (DP1 and DP3) on Little Silver Lake, 2006-2017
The majority of samples (99%) for both time periods were within guidelines established by the Canadian Council of Minister's of the Environment which state that pH should be between 6.5 and 9 to protect aquatic life (Table 5, Figure 11). Surface water’s that are found to be more alkaline (higher pH) are common in many regions of the Tay River subwatershed and can generally be attributed to the geology rather than anthropogenic activities. Biological activities such as increased photosynthesis from algal blooms and plant growth may also influence pH.
Table 5 Summary of pH results at the deep point sites (DP1 and DP3) on Little Silver Lake, 2006-2017.
pH 2006-2017
Site
Average (mg/l)
Within Guideline
No. Samples
DP1/DP3
7.9
99%
76
Summary of Water Quality for Fish Habitat in Little Silver Lake
Overall the water chemistry data at the deep point describes suitable habitat conditions for fish species such as bass, walleye and pike. pH conditions are within the range recommended for the protection of aquatic life. Overall, the data indicates a healthy environment for aquatic species.
2.1.4 Little Silver Lake E. Coli
E. coli is sampled at monitored shoreline sites twice each sampling season. E. coli data was not used in the calculations of the WQI rating for the lake due to differences in sampling frequency and site locations. E. coli data has been summarized in Table 6.
Throughout the 2006-2017 period 100 percent of samples collected by RVCA were below the E. coli guideline of 100 colony forming units (CFU) per 100 ml set by the PWQO; across the lake the count at the geometric mean was 3 CFU/100ml (Table 6). This provides support that there is little indication of bacterial contamination around the lake. Figure 12 show the distribution of counts across all shoreline sites. All sites fell well below the guideline of 100 CFU/100ml.
Table 6 Summary of E. coli results for Little Silver Lake, 2006-2017
E. coli 2006-2017
Site
Geometric mean (CFU/100ml)
Below Guideline
No. Samples
A-G
3
100%
103
Figure 12 Geometric mean of E.coli counts at shoreline sites monitored on Little Silver Lake, 2006-2017
Summary of Little Silver Lake Bacterial Contamination
The results presented above indicate that bacterial contamination is not a significant concern in Little Silver Lake and the water should be safe for recreational use such as swimming and boating.
2.2 Rainbow Lake Water Quality
Surface water quality conditions in Rainbow have been monitored by RVCA’s Watershed Watch Program since 2006. Data from the deep point sites (DP1) have been used to calculate the WQI rating for Rainbow Lake, which averaged “Fair to Good” over the 2006-2017 period (Table 1). Moderate nutrient concentrations, good oxygen availability and clear water all influenced this rating. The following discussion explains how each of the monitored water quality parameters contributes to the lake’s water quality.
This report also considers data from two additional shoreline sites that are monitored around the lake. These sites have not been included in the calculation of the CCME WQI rating, as they are not monitored with the same frequency as the deep point site. However, they do provide important information on water quality conditions in the near shore areas. For locations of shoreline sites (A and B), please see Figure 2.
2.2.1 Rainbow Lake Nutrients
Total phosphorus (TP) is used as a primary indicator of excessive nutrient loading and contributes to abundant aquatic vegetation growth and depleted dissolved oxygen levels. The Provincial Water Quality Objective (PWQO) is used as the TP Guideline and states that in lakes, concentrations greater than 0.020 mg/l indicate an excessive amount of TP within the water column.
Total Kjeldahl nitrogen (TKN) is used as a secondary indicator of nutrient loading. RVCA uses a guideline of 0.500 mg/l to assess TKN[1]within surface waters.
Nutrients at the Rainbow Lake Deep Point
TP and TKN sampling results collected by the RVCA are presented in Figures 13 to 16. Fluctuations in TP concentrations are common, with the majority of results below the guideline (Figures 13 and 14); a decreasing trend[2] in TP concentrations was observed in the 2006-2017 data set. A similar decline was also observed in Little Silver Lake which receives Rainbow Lake's outflow. Eighty-two percent of samples analyzed for TP were less than the TP guideline and the average concentration was 0.015 mg/l (Table 7). TKN concentrations also showed variability and no significant change was observed (Figures 15 and 16). Fifty-one percent of reported results were below the TKN guideline and the average TKN concentration was 0.488 mg/l (Table 7).
Figure 13 Total phosphorous sampling results at deep point site (DP1) on Rainbow Lake, 2006-2017
Figure 14 Average total phosphorous results at deep point site (DP1) on Rainbow Lake, 2006-2017
Figure 15 Total Kjeldahl nitrogen sampling results at deep point site (DP1) on Rainbow Lake, 2006-2017
Figure 16 Average total Kjeldahl nitrogen results at deep point site (DP1) on Rainbow Lake, 2006-2017
Table 7 Summary of nutrient results for Rainbow Lake, 2006-2017.
Total Phosphorous 2006-2017
Site
Average (mg/l)
Below Guideline
No. Samples
DP1
0.015
82%
49
Total Kjeldahl Nitrogen 2006-2017
Site
Average (mg/l)
Below Guideline
No. Samples
DP1
0.488
51%
49
Overall, the data presented indicates that nutrient concentrations may be considered low with occasional exceedances in the mid-lake, deep water sites on Rainbow Lake. Elevated TKN concentrations can likely be attributed to the influence of surrounding wetlands that drain into the lake, as well as influence of nutrient rich sediments in this very shallow waterbody.
Nutrients around Rainbow Lake
The average nutrient concentrations at monitored shoreline sites around the lake have varied from year to year (Figures 17 and 18). Please note that in the 2006-2017 monitoring period, only site A was monitored yearly; site B was sampled in 2006, 2011, 2016 and 2017.
Average total phosphorous concentrations are below the TP guideline at site B during the monitored years (Figure 17). Site A had elevated results in 2006 and 2011, however all subsequent yearly results have been below the guideline. Average TKN concentrations have exceeded or approach the guideline frequently at site A, while results at site B are below the guideline for each year of data (Figure 18).
Figure 17 Average total phosphorous concentrations at shoreline monitoring sites in Rainbow Lake, 2006-2017
Figure 18 Average total phosphorous concentrations at shoreline monitoring sites in Rainbow Lake, 2006-2017
Summary of Rainbow Lake Nutrients
Rainbow Lake nutrient data shows that elevated levels of TKN are common in this waterbody. As previously noted Rainbow Lake is a shallow water body and these elevated concentrations can likely be attributed to wetland characteristics and the influence of nutrient rich sediments on the surface water. It is possible that occasional problems with nutrient enrichment (i.e. algal blooms or excessive plant growth) may be observed in shallow, sheltered bays.
Efforts such as the diversion of runoff and enhanced shoreline buffers are important to continue to protect and enhance water quality, and reduce future nutrient increases. Nutrient exceedances may be partially attributed to the natural aging of a lake and basin characteristics. All residents can help minimize their impact on the lake by reducing nutrient inputs through practices such as proper maintenance of septic systems, keeping shorelines natural and using phosphate free soaps and detergents. Promotion of sound stewardship and protection around lake is important to maintain and protect water quality conditions into the future.
2.2.2 Rainbow Lake Water Clarity
Water clarity is measured using a Secchi disk during each deep point sample. Table 8 summarizes the recorded depths with an average depth of 3.3 m and shows that all readings have exceeded the minimum PWQO of 2 m indicating that algae in the water column is not at excessive levels (good water clarity). Less than 2 m will indicate overproduction in a lake or significant inputs to the water column that are limiting light availability. Figure 19 shows that no individual reading has been below the guideline and measured depths range from 2.1 m to 5.0 m. No significant change was noted in Secchi depth over the 2006-2017 period.
Table 8 Summary of Secchi depths recorded at the deep point site (DP1) on Rainbow Lake, 2006-2017
Secchi 2006-2017
Site
Average (m)
Above Guideline
No. Samples
DP1
3.3
100%
44
Figure 19 Recorded Secchi depths at the deep point site (DP1) on Rainbow Lake, 2006-2017
Summary of Rainbow Lake Water Clarity
Waters in Rainbow Lake are clear and sufficient sunlight is able to penetrate the water column to support aquatic life and provide sufficient visibility for safe recreational use (boating, swimming).
2.2.3 Rainbow Lake Fish Habitat
Two other factors, dissolved oxygen/temperature and pH were also assessed to provide an overall sense of the health of Rainbow Lake from a fish habitat perspective.
2.2.3.1 Rainbow Lake Dissolved Oxygen and Temperature
The red bars in Figure 20 show the depths where suitable conditions exist for warm water fish species (temperature less than 25°C and dissolved oxygen greater than 4 mg/l) at the deep point site. The vertical axis represents the total lake depth at each site where the profile is taken. Suitable conditions typically decline throughout the summer to about 2m-3.5m of the water column. In late 2016, habitat conditions were notably low due to the warming of the water column. Overall, no significant change was noted in conditions through the 2006-2017 period.
Figure 20 Depths suitable for warm water fish species at the deep point site (DP1 ) on Rainbow Lake, 2006-2017.
2.2.3.2 Rainbow Lake pH
pH is a basic water quality parameter used to assess the acidity of water, an important factor for aquatic life. Figure 21 shows monitored pH values over the 2006-2017 period.
Figure 21 pH concentrations at the deep point site (DP1) on Rainbow Lake, 2006-2017
All samples for pH are within guidelines established by the Canadian Council of Minister's of the Environment which state that pH should be between 6.5 and 9 to protect aquatic life (Table 9, Figure 21). Surface water’s that are found to be more alkaline (higher pH) are common in many regions of the Tay River subwatershed and can generally be attributed to the geology rather than anthropogenic activities. Biological activities such as increased photosynthesis from algal blooms and plant growth may also influence pH.
Table 9 Summary of pH results at the deep point site (DP1) on Rainbow Lake, 2006-2017.
pH 2006-2017
Site
Average (mg/l)
Within Guideline
No. Samples
DP1
7.8
100%
42
Summary of Water Quality for Fish Habitat in Rainbow Lake
Overall the water chemistry data at the deep point describes suitable habitat conditions for warm water fish species, though these can become limited during warm periods. pH conditions are within the range recommended for the protection of aquatic life. Overall, the data indicates a healthy environment for aquatic species.
2.2.4 Rainbow Lake E. Coli
E. coli is sampled at monitored shoreline sites twice each sampling season. E. coli data was not used in the calculations of the WQI rating for the lake due to differences in sampling frequency and site locations. E. coli data has been summarized in Table 10.
Throughout the 2006-2017 period, 100 percent of samples collected by RVCA were below the E. coli guideline of 100 colony forming units (CFU) per 100 ml set by the PWQO; across the lake the count at the geometric mean was 6 CFU/100ml (Table 10). This provides support that there is little indication of bacterial contamination around the lake. Figure 22 shows the distribution of counts across all shoreline sites. All sites fell well below the guideline of 100 CFU/100ml.
Table 10 Summary of E. coli results for Rainbow Lake, 2006-2017
E. coli 2006-2017
Site
Geometric mean (CFU/100ml)
Below Guideline
No. Samples
A-B
6
100%
34
Figure 22 Geometric mean of E.coli counts at shoreline sites monitored on Rainbow Lake, 2006-2017
Summary of Rainbow Lake Bacterial Contamination
The results presented above indicate that bacterial contamination is not a significant concern in Rainbow Lake and the water should be safe for recreational use such as swimming and boating.
2.3 Farren Lake Water Quality
Surface water quality conditions in Farren have been monitored by RVCA’s Watershed Watch Program since 2001. Data from the deep point site (DP1) have been used to calculate the WQI rating for Farren Lake, which averaged “Fair to Good” over the 2006-2017 period (Table 1). Moderate nutrient concentrations, good oxygen availability and clear water all influenced this rating. The following discussion explains how each of the monitored water quality parameters contributes to the lake’s water quality.
This report also considers data from six additional shoreline sites that are monitored around the lake. These sites have not been included in the calculation of the CCME WQI rating, as they are not monitored with the same frequency as the deep point site. However, they do provide important information on water quality conditions in the near shore areas. For locations of shoreline sites (A-F), please see Figure 2.
2.3.1 Farren Lake Nutrients
Total phosphorus (TP) is used as a primary indicator of excessive nutrient loading and contributes to abundant aquatic vegetation growth and depleted dissolved oxygen levels. The Provincial Water Quality Objective (PWQO) is used as the TP Guideline and states that in lakes, concentrations greater than 0.020 mg/l indicate an excessive amount of TP within the water column.
Total Kjeldahl nitrogen (TKN) is used as a secondary indicator of nutrient loading. RVCA uses a guideline of 0.500 mg/l to assess TKN[1]within surface waters.
Nutrients at the Farren Lake Deep Point
TP and TKN sampling results collected by the RVCA are presented in Figures 23 to 26. While moderate fluctuations in TP concentrations have occurred (Figures 23 and 24), there was no significant trend observed in the 2006-2017 data set. Ninety-eight percent of samples analyzed for TP were less than the TP guideline and the average concentration was 0.009 mg/l (Table 11). TKN concentration also showed variability though no significant change was observed (Figures 25 and 26). Ninety-eight percent of reported results were below the TKN guideline and the average TKN concentration was 0.336 mg/l (Table 11).
Figure 23 Total phosphorous sampling results at deep point site (DP1) on Farren Lake, 2006-2017
Figure 24 Average total phosphorous results at deep point site (DP1) on Farren Lake, 2006-2017
Figure 25 Total Kjeldahl nitrogen sampling results at deep point site (DP1) on Farren Lake, 2006-2017
Figure 26 Average total Kjeldahl nitrogen results at deep point site (DP1) on Farren Lake, 2006-2017
Table 11 Summary of nutrient results for Farren Lake, 2006-2017.
Total Phosphorous 2006-2017
Site
Average (mg/l)
Below Guideline
No. Samples
DP1
0.009
98%
45
Total Kjeldahl Nitrogen 2006-2017
Site
Average (mg/l)
Below Guideline
No. Samples
DP1
0.336
98%
45
Overall, the data presented indicates that nutrient concentration may be considered low with very limited instances of elevated concentrations in the mid-lake, deep water sites on Farren Lake.
Nutrients around Farren Lake
The average nutrient concentrations at monitored shoreline sites around the lake have varied from year to year (Figures 27 and 28). Please note that in the 2006-2017 monitoring period only sites B, D and E were monitored yearly; sites A, C and F were sampled in 2006, 2011 and 2016.
Average total phosphorous concentrations are below the TP guideline at all sites during the monitored years (Figure 27). Average TKN concentrations were generally below the guideline, with the exception of site E in 2011 and 2017 (Figure 28).
Figure 27 Average total phosphorous concentrations at shoreline monitoring sites in Farren Lake, 2006-2017
Figure 28 Average total Kjeldahl nitrogen concentrations at shoreline monitoring sites in Farren Lake, 2006-2017
Summary of Farren Lake Nutrients
Farren Lake nutrient data shows that elevated levels of nutrients are not a concern in Farren Lake, with the exception of occasional elevated results at site E. It is possible that occasional problems with nutrient enrichment (i.e. algal blooms or excessive plant growth) may be observed in shallow, sheltered bays.
Efforts such as the diversion of runoff and enhanced shoreline buffers are important to continue to protect and enhance water quality, and reduce future nutrient increases. Nutrient exceedances may be partially attributed to the natural aging of a lake and basin characteristics. All residents can help minimize their impact on the lake by reducing nutrient inputs through practices such as proper maintenance of septic systems, keeping shorelines natural and using phosphate free soaps and detergents. Promotion of sound stewardship and protection around lake is important to maintain and protect water quality conditions into the future.
2.3.2 Farren Lake Water Clarity
Water clarity is measured using a Secchi disk during each deep point sample. Table 12 summarizes the recorded depths with an average depth of 5.4 m and shows that all readings have exceeded the minimum PWQO of 2 m indicating that algae in the water column are not at excessive levels (good water clarity). Less than 2 m will indicate overproduction in a lake or significant inputs to the water column that are limiting light availability. Figure 29 shows that no individual reading has been below the guideline and measured depths range from 2.1 m to 8.8 m. A significant decrease was noted in Secchi depth over the 2006-2017 period.
Table 12 Summary of Secchi depths recorded at the deep point site (DP1) on Farren Lake, 2006-2017
Secchi 2006-2017
Site
Average (m)
Above Guideline
No. Samples
DP1
5.4
100%
42
Figure 29 Recorded Secchi depths at the deep point site (DP1) on Farren Lake, 2006-2017
Summary of Farren Lake Water Clarity
Waters in Farren Lake are clear and sufficient sunlight is able to penetrate the water column to support aquatic life and provide sufficient visibility for safe recreational use (boating, swimming).
2.3.3 Farren Lake Fish Habitat
Two other factors, dissolved oxygen/temperature and pH were also assessed to provide an overall sense of the health of Farren Lake from a fish habitat perspective.
2.3.3.1 Farren Lake Dissolved Oxygen and Temperature
The red bars in Figure 30 show the depths where suitable conditions exist for warm water fish species (temperature less than 25°C and dissolved oxygen greater than 4 mg/l) at the deep point site. The vertical axis represents the total lake depth where the profile is taken. Suitable conditions typically decline throughout the summer to about 12 m of the water column. Overall, no significant change was noted in conditions through the 2006-2017 period.
Figure 30 Depths suitable for warm water fish species at the deep point site (DP1 ) on Farren Lake, 2006-2017.
2.3.3.2 Farren Lake pH
The majority of samples are within guidelines established by the Canadian Council of Ministers of the Environment, which state that pH should be between 6.5 and 9 to protect aquatic life (Table 13, Figure 31). Surface water’s that are found to be more alkaline (higher pH) are common in many regions of the Tay River subwatershed and can generally be attributed to the geology rather than anthropogenic activities. Biological activities such as increased photosynthesis from algal blooms and plant growth may also influence pH.
Figure 31 pH concentrations at the deep point site (DP1) on Farren Lake, 2006-2017
Table 13 Summary of pH results at the deep point site (DP1) on Farren Lake, 2006-2017.
pH 2006-2017
Site
Average (mg/l)
Within Guideline
No. Samples
DP1
8.3
97%
37
Summary of Water Quality for Fish Habitat in Farren Lake
Overall the water chemistry data at the deep point describes suitable habitat conditions for warm water fish species, though these can become limited during warm periods. pH conditions are within the range recommended for the protection of aquatic life. Overall, the data indicates a healthy environment for aquatic species.
2.3.4 Farren Lake E. Coli
E. coli is sampled at monitored shoreline sites twice each sampling season. E. coli data was not used in the calculations of the WQI rating for the lake due to differences in sampling frequency and site locations. E. coli data has been summarized in Table 14.
Throughout the 2006-2017 period 100 percent of samples collected by RVCA were below the E. coli guideline of 100 colony forming units (CFU) per 100 ml set by the PWQO; across the lake the count at the geometric mean was 2 CFU/100ml (Table 14). This provides support that there is little indication of bacterial contamination around the lake. Figure 32 show the distribution of counts across all shoreline sites. All sites fell well below the guideline of 100 CFU/100ml.
Table 14 Summary of E. coli results for Farren Lake, 2006-2017
E. coli 2006-2017
Site
Geometric mean (CFU/100ml)
Below Guideline
No. Samples
A-F
2
100%
93
Figure 32 Geometric mean of E.coli counts at shoreline sites monitored on Farren Lake, 2006-2017
Summary of Farren Lake Bacterial Contamination
The results presented above indicate that bacterial contamination is not a significant concern in Farren Lake and the water should be safe for recreational use such as swimming and boating.
2.4 O'Brien Lake Water Quality
Surface water quality conditions were first monitored in O'Brien Lake by RVCA’s Watershed Watch Program in 2001. Data from the deep point site (DP1) have been used to calculate the WQI rating for O'Brien Lake, which averaged “Fair to Very Good” over the 2006-2017 period (Table 1). Moderate nutrient concentrations, good oxygen availability and clear water all influenced this rating. The following discussion explains how each of the monitored water quality parameters contributes to the lake’s water quality.
This report also considers data from two additional shoreline sites that are monitored around the lake. These sites have not been included in the calculation of the CCME WQI rating, as they are not monitored with the same frequency as the deep point site. However, they do provide important information on water quality conditions in the near shore areas. For locations of shoreline sites (A and B), please see Figure 2.
2.4.1 O'Brien Lake Nutrients
Total phosphorus (TP) is used as a primary indicator of excessive nutrient loading and contributes to abundant aquatic vegetation growth and depleted dissolved oxygen levels. The Provincial Water Quality Objective (PWQO) is used as the TP Guideline and states that in lakes, concentrations greater than 0.020 mg/l indicate an excessive amount of TP within the water column.
Total Kjeldahl nitrogen (TKN) is used as a secondary indicator of nutrient loading. RVCA uses a guideline of 0.500 mg/l to assess TKN[1]within surface waters.
Nutrients at the O'Brien Lake Deep Point
TP and TKN sampling results collected by the RVCA are presented in Figures 33 to 36. While moderate fluctuations in TP concentrations have occurred (Figures 33 and 34), there was no significant trend observed in the 2006-2017 data set. Ninety-three percent of samples analyzed for TP were less than the TP guideline and the average concentration was 0.010 mg/l (Table 15). TKN concentration also showed variability though no significant change was observed (Figures 35 and 36). Ninety-three percent of reported results were below the TKN guideline and the average TKN concentration was 0.400 mg/l (Table 15).
Figure 33 Total phosphorous sampling results at deep point site (DP1) on O'Brien Lake, 2006-2017
Figure 34 Average total phosphorous results at deep point site (DP1) on O'Brien Lake, 2006-2017
Figure 35 Total Kjeldahl nitrogen sampling results at deep point site (DP1) on O'Brien Lake, 2006-2017
Figure 36 Average total Kjeldahl nitrogen results at deep point site (DP1) on O'Brien Lake, 2006-2017
Table 15 Summary of nutrient results for O'Brien Lake, 2006-2017.
Total Phosphorous 2006-2017
Site
Average (mg/l)
Below Guideline
No. Samples
DP1
0.010
93%
45
Total Kjeldahl Nitrogen 2006-2017
Site
Average (mg/l)
Below Guideline
No. Samples
DP1
0.400
93%
45
Overall, the data presented indicates that nutrient concentration may be considered low with very limited instances of elevated concentrations in the mid-lake, deep water sites in O'Brien Lake.
Nutrients around O'Brien Lake
The average nutrient concentrations at monitored shoreline sites around the lake have varied from year to year (Figures 37 and 38).
Average total phosphorous concentrations are below the TP guideline at all sites during the monitored years, with the exception of site B in 2009 (Figure 37). A sample of 0.031 mg/l in July of this year was collected and is responsible for the elevated results; TKN concentrations from this same sample also exceeded the guideline at 0.890 mg/l. With the exception of site B in 2009 and a slight exceedance in 2014, average TKN concentrations were generally below the guideline (Figure 38).
Figure 37 Average total phosphorous concentrations at shoreline monitoring sites in O'Brien Lake, 2006-2017
Figure 38 Average total Kjeldahl nitrogen concentrations at shoreline monitoring sites in O'Brien Lake, 2006-2017
Summary of O'Brien Lake Nutrients
O'Brien Lake nutrient data shows that elevated levels of nutrients are not of concern in O'Brien Lake, with the exception of occasional elevated results at site B. The isolated elevated sample may be the result of contamination during collection or may have been impacted by runoff following a rain event. It is possible that occasional problems with nutrient enrichment (i.e. algal blooms or excessive plant growth) may be observed in shallow bays such as that of site B.
Efforts such as the diversion of runoff and enhanced shoreline buffers are important to continue to protect and enhance water quality, and reduce future nutrient increases. Nutrient exceedances may be partially attributed to the natural aging of a lake and basin characteristics. All residents can help minimize their impact on the lake by reducing nutrient inputs through practices such as proper maintenance of septic systems, keeping shorelines natural and using phosphate free soaps and detergents. Promotion of sound stewardship and protection around lake is important to maintain and protect water quality conditions into the future.
2.4.2 O'Brien Lake Water Clarity
Water clarity is measured using a Secchi disk during each deep point sample. Table 16 summarizes the recorded depths with an average depth of 4.8 m and shows that all readings have exceeded the minimum PWQO of 2 m indicating that algae in the water column are not at excessive levels (good water clarity). Less than 2 m will indicate overproduction in a lake or significant inputs to the water column that are limiting light availability. Figure 39 shows that no individual reading has been below the guideline and measured depths range from 2.5 m to 8.3 m. No significant change was noted in Secchi depth over the 2006-2017 period.
Table 16 Summary of Secchi depths recorded at the deep point site (DP1) on O'Brien Lake, 2006-2017
Secchi 2006-2017
Site
Average (m)
Above Guideline
No. Samples
DP1
4.8
100%
44
Figure 39 Recorded Secchi depths at the deep point site (DP1) on O'Brien Lake, 2006-2017
Summary of O'Brien Lake Water Clarity
Waters in O'Brien Lake are clear and sufficient sunlight is able to penetrate the water column to support aquatic life and provide sufficient visibility for safe recreational use (boating, swimming).
2.4.3 O'Brien Lake Fish Habitat
Two other factors, dissolved oxygen/temperature and pH were also assessed to provide an overall sense of the health of O'Brien Lake from a fish habitat perspective.
2.4.3.1 O'Brien Lake Dissolved Oxygen and Temperature
The red bars in Figure 40 show the depths where suitable conditions exist for warm water fish species (temperature less than 25°C and dissolved oxygen greater than 4 mg/l) at the deep point site. The vertical axis represents the total lake depth at each site where the profile is taken. Suitable conditions typically decline throughout the summer to 6-8 m of the water column. Overall, no significant change was noted in conditions through the 2006-2017 period.
Figure 40 Depths suitable for warm water fish species at the deep point site (DP1 ) on O'Brien Lake, 2006-2017.
2.4.3.2 O'Brien Lake pH
All samples were within guidelines established by the Canadian Council of Minister's of the Environment which state that pH should be between 6.5 and 9 to protect aquatic life (Table 17, Figure 41). Surface water’s that are found to be more alkaline (higher pH) are common in many regions of the Tay River subwatershed and can generally be attributed to the geology rather than anthropogenic activities. Biological activities such as increased photosynthesis from algal blooms and plant growth may also influence pH.
Figure 41 pH concentrations at the deep point site (DP1) on O'Brien Lake, 2006-2017
Table 17 Summary of pH results at the deep point site (DP1) on O'Brien Lake, 2006-2017.
pH 2006-2017
Site
Average (mg/l)
Within Guideline
No. Samples
DP1
7.82
100%
37
Summary of Water Quality for Fish Habitat in O'Brien Lake
Overall the water chemistry data at the deep point describes suitable habitat conditions for warm water fish species, though these can become limited during warm periods. pH conditions are within the range recommended for the protection of aquatic life. Overall, the data indicates a healthy environment for aquatic species.
2.4.4 O'Brien Lake E. Coli
E. coli is sampled at monitored shoreline sites twice each sampling season. E. coli data was not used in the calculations of the WQI rating for the lake due to differences in sampling frequency and site locations. E. coli data has been summarized in Table 18.
Throughout the 2006-2017 period 100 percent of samples collected by RVCA were below the E. coli guideline of 100 colony forming units (CFU) per 100 ml set by the PWQO; across the lake the count at the geometric mean was 4 CFU/100ml (Table 18). This provides support that there is little indication of bacterial contamination around the lake. Figure 42 show the distribution of counts across all shoreline sites. All sites fell well below the guideline of 100 CFU/100ml.
Table 18 Summary of E. coli results for O'Brien Lake, 2006-2017
E. coli 2006-2017
Site
Geometric mean (CFU/100ml)
Below Guideline
No. Samples
A-B
4
100%
50
Figure 42 Geometric mean of E.coli counts at shoreline sites monitored on O'Brien Lake, 2006-2017
Summary of O'Brien Lake Bacterial Contamination
The results presented above indicate that bacterial contamination is not a significant concern in O'Brien Lake and the water should be safe for recreational use such as swimming and boating.
2.5 Christie Lake Water Quality
Surface water quality conditions were first monitored in Christie Lake by RVCA’s Watershed Watch Program in 2003. Data from the deep point site (DP1) have been used to calculate the WQI rating for Christie Lake, which averaged “Good to Very Good” over the 2006-2017 period (Table 1). Moderate nutrient concentrations, good oxygen availability and clear water all influenced this rating. The following discussion explains how each of the monitored water quality parameters contributes to the lake’s water quality.
This report also considers data from eight additional shoreline sites that are monitored around the lake. These sites have not been included in the calculation of the CCME WQI rating, as they are not monitored with the same frequency as the deep point site. However, they do provide important information on water quality conditions in the near shore areas. For locations of shoreline sites (A-H), please see Figure 2.
2.5.1 Christie Lake Nutrients
Total phosphorus (TP) is used as a primary indicator of excessive nutrient loading and contributes to abundant aquatic vegetation growth and depleted dissolved oxygen levels. The Provincial Water Quality Objective (PWQO) is used as the TP Guideline and states that in lakes, concentrations greater than 0.020 mg/l indicate an excessive amount of TP within the water column.
Total Kjeldahl nitrogen (TKN) is used as a secondary indicator of nutrient loading. RVCA uses a guideline of 0.500 mg/l to assess TKN[1]within surface waters.
Nutrients at the Christie Lake Deep Point
TP and TKN sampling results collected by the RVCA are presented in Figures 43 to 46. Minimal fluctuations in TP concentrations have occurred (Figures 43 and 44) and there was no significant trend observed in the 2006-2017 data set. All samples analyzed for TP were less than the TP guideline and the average concentration was 0.011 mg/l (Table 19). TKN concentration showed some variability though no significant change was observed (Figures 45 and 46). Ninety-five percent of reported results were below the TKN guideline and the average TKN concentration was 0.343 mg/l (Table 19).
Figure 43 Total phosphorous sampling results at deep point site (DP1) on Christie Lake, 2006-2017
Figure 44 Average total phosphorous results at deep point site (DP1) on Christie Lake, 2006-2017
Figure 45 Total Kjeldahl nitrogen sampling results at deep point site (DP1) on Christie Lake, 2006-2017
Figure 46 Average total Kjeldahl nitrogen results at deep point site (DP1) on Christie Lake, 2006-2017
Table 19 Summary of nutrient results for Christie Lake, 2006-2017.
Total Phosphorous 2006-2017
Site
Average (mg/l)
Below Guideline
No. Samples
DP1
0.011
100%
44
Total Kjeldahl Nitrogen 2006-2017
Site
Average (mg/l)
Below Guideline
No. Samples
DP1
0.343
95%
44
Overall, the data presented indicates that nutrient concentration may be considered low with very limited instances of elevated concentrations (TKN) in the mid-lake, deep water sites in Christie Lake
Nutrients around Christie Lake
The average nutrient concentrations at monitored shoreline sites around the lake have varied from year to year (Figures 47 and 48). Please note that sites A, E, F and H are monitored each year; while sites B, C, D and G were monitored in 2008 and 2013.
Sites A, E, and H have all had exceedances in various years though the bulk of monitoring results are well below the guideline (Figure 47). TKN concentrations are typically below the guideline, with the exception of samples collected in 2016 (Figure 48).
Figure 47 Average total phosphorous concentrations at shoreline monitoring sites on Christie Lake, 2006-2017
Figure 48 Average total Kjeldahl nitrogen concentrations at shoreline monitoring sites on Christie Lake, 2006-2017
Summary of Christie Lake Nutrients
Christie Lake nutrient data shows that elevated levels of nutrients are not of concern in this waterbody, with the exception of occasional elevated results at various sites. Elevated TKN samples in 2016 may be attributed to runoff following a rain event, as that summer was a period of very high rainfall. It is possible that occasional problems with nutrient enrichment (i.e. algal blooms or excessive plant growth) may be observed in sheltered shallow bays.
Efforts such as the diversion of runoff and enhanced shoreline buffers are important to continue to protect and enhance water quality, and reduce future nutrient increases. Nutrient exceedances may be partially attributed to the natural aging of a lake and basin characteristics. All residents can help minimize their impact on the lake by reducing nutrient inputs through practices such as proper maintenance of septic systems, keeping shorelines natural and using phosphate free soaps and detergents. Promotion of sound stewardship and protection around lake is important to maintain and protect water quality conditions into the future.
2.5.2 Christie Lake Water Clarity
Water clarity is measured using a Secchi disk during each deep point sample. Table 20 summarizes the recorded depths with an average depth of 6.2 m and shows that all readings have exceeded the minimum PWQO of 2 m indicating that algae in the water column are not at excessive levels (good water clarity). Less than 2 m will indicate overproduction in a lake or significant inputs to the water column that are limiting light availability. Figure 49 shows that no individual reading has been below the guideline and measured depths range from 3.2 m to 10.4 m. No significant change was noted in Secchi depth over the 2006-2017 period.
Table 20 Summary of Secchi depths recorded at the deep point site (DP1) on Christie Lake, 2006-2017
Secchi 2006-2017
Site
Average (m)
Above Guideline
No. Samples
DP1
6.2
100%
41
Figure 49 Recorded Secchi depths at the deep point site (DP1) on Christie Lake, 2006-2017
Summary of Christie Lake Water Clarity
Waters in Christie Lake are clear and sufficient sunlight is able to penetrate the water column to support aquatic life and provide sufficient visibility for safe recreational use (boating, swimming).
2.5.3 Christie Lake Fish Habitat
Two other factors, dissolved oxygen/temperature and pH were also assessed to provide an overall sense of the health of Christie Lake from a fish habitat perspective.
2.5.3.1 Christie Lake Dissolved Oxygen and Temperature
The red bars in Figure 50 show the depths where suitable conditions exist for warm water fish species (temperature less than 25°C and dissolved oxygen greater than 4 mg/l) at the deep point site. The vertical axis represents the total lake depth at each site where the profile is taken. Suitable conditions typically decline throughout the summer to a depth of approximately 10 m. Overall, no significant change was noted in conditions through the 2006-2017 period.
Figure 50 Depths suitable for warm water fish species at the deep point site (DP1 ) on Christie Lake, 2006-2017.
2.5.3.2 Christie Lake pH
All were within guidelines established by the Canadian Council of Minister's of the Environment which state that pH should be between 6.5 and 9 to protect aquatic life (Table 21, Fgure 51). Surface waters that are found to be more alkaline (higher pH) are common in many regions of the Tay River subwatershed and can generally be attributed to the geology rather than anthropogenic activities. Biological activities such as increased photosynthesis from algal blooms and plant growth may also influence pH. A declining trend was observed in pH concentrations.
Figure 51 pH concentrations at the deep point site (DP1) on Christie Lake, 2006-2017
Table 21 Summary of pH results at the deep point site (DP1) on Christie Lake, 2006-2017.
pH 2006-2017
Site
Average (mg/l)
Within Guideline
No. Samples
DP1
7.8
100%
39
Summary of Water Quality for Fish Habitat in Christie Lake
Overall the water chemistry data at the deep point describes suitable habitat conditions for warm water fish species, though these can become limited during warm periods. pH conditions are within the range recommended for the protection of aquatic life. Overall, the data indicates a healthy environment for aquatic species.
2.5.4 Christie Lake E. Coli
E. coli is sampled at monitored shoreline sites twice each sampling season. E. coli data was not used in the calculations of the WQI rating for the lake due to differences in sampling frequency and site locations. E. coli data has been summarized in Table 22.
Throughout the 2006-2017 period 100 percent of samples collected by RVCA were below the E. coli guideline of 100 colony forming units (CFU) per 100 ml set by the PWQO; across the lake the count at the geometric mean was 4 CFU/100ml (Table 18). This provides support that there is little indication of bacterial contamination around the lake. Figure 52 show the distribution of counts across all shoreline sites. All sites fell well below the guideline of 100 CFU/100ml.
Table 22 Summary of E. coli results for Christie Lake, 2006-2017
E. coli 2006-2017
Site
Geometric mean (CFU/100ml)
Below Guideline
No. Samples
A-H
4
100%
105
Figure 52 Geometric mean of E.coli counts at shoreline sites monitored on Christie Lake, 2006-2017
Summary of Christie Lake Bacterial Contamination
The results presented above indicate that bacterial contamination is not a significant concern in Christie Lake and the water should be safe for recreational use such as swimming and boating.
2.6 Davern Lake Water Quality
Surface water quality conditions were first monitored in Davern Lake by RVCA’s Watershed Watch Program in 2001. Data from the deep point site (DP1) have been used to calculate the WQI rating for Davern Lake, which averaged “Good to Very Good” over the 2006-2017 period (Table 1). Moderate nutrient concentrations, good oxygen availability and clear water all influenced this rating. The following discussion explains how each of the monitored water quality parameters contributes to the lake’s water quality.
This report also considers data from three additional shoreline sites that are monitored around the lake. These sites have not been included in the calculation of the CCME WQI rating, as they are not monitored with the same frequency as the deep point site. However, they do provide important information on water quality conditions in the near shore areas. For locations of shoreline sites (A-C), please see Figure 2.
2.6.1 Davern Lake Nutrients
Total phosphorus (TP) is used as a primary indicator of excessive nutrient loading and contributes to abundant aquatic vegetation growth and depleted dissolved oxygen levels. The Provincial Water Quality Objective (PWQO) is used as the TP Guideline and states that in lakes, concentrations greater than 0.020 mg/l indicate an excessive amount of TP within the water column. Concentrations below 0.010 mg/l are generally considered to be minimal and unlikely to have problems associated with nutrient loading.
Total Kjeldahl nitrogen (TKN) is used as a secondary indicator of nutrient loading. RVCA uses a guideline of 0.500 mg/l to assess TKN within surface waters.
Nutrients at the Davern Lake Deep Point
TP and TKN sampling results collected by the RVCA are presented in Figures 53 to 56. Variability has occurred in the sampled TP concentrations at this site (Figures 53 and 54), however no significant trend was observed in the 2006-2017 dataset. TP results for Davern Lake may be considered low, 98 percent of samples analyzed for TP were less than the TP guideline and the average concentration was 0.014 mg/l (Table 23). One extremely elevated result of 0.220 mg/l was observed on October 8, 2010; due to the significant difference in magnitude it is not shown in Figure 52, though the influence of this value can be see in the elevated average TP concentration for 2010 (Figure 54). TKN concentration also showed variability; however similar to TP results no trend was observed (Figures 55 and 56). Ninety-one percent of reported results were below the TKN guideline and the average TKN concentration was 0.416 mg/l (Table 23).
Figure 53 Total phosphorus sampling results at the deep point site (DP1) in Davern Lake, 2006-2017
Figure 54 Average total phosphorus results at the deep point site (DP1) in Davern Lake, 2006-2017.
Figure 55 Total Kjeldahl nitrogen sampling results at deep point site (DP1) in Davern Lake, 2006-2017
Figure 56 Average total Kjeldahl nitrogen results at the deep point site (DP1) in Davern Lake, 2006-2017.
Table 23 Summary of nutrient results for Davern Lake over the monitoring period, 2006-2017.
Total Phosphorous 2006-2017
Site
Average (mg/l)
Below Guideline
No. Samples
DP1
0.014
98%
45
Total Kjeldahl Nitrogen 2006-2017
Site
Average (mg/l)
Below Guideline
No. Samples
DP1
0.416
91%
45
Overall, the data presented indicates that nutrient concentrations may be considered low-moderate with few instances of elevated samples in the mid-lake, deep water site.
Nutrients around Davern Lake
The average nutrient concentrations at monitored shoreline sites around the lake vary from year to year (Figures 57 and 58).
Average total phosphorous concentrations are below the TP guideline at all sites (Figure 57). Average TKN concentrations were also typically below the guideline at all monitored sites; with the exception of elevated concentrations at site C in 2015 (Figure 58). At this site it was noted that abundant submergent vegetation was present and that the samples were taken at a natural shoreline with tall grasses.
Figure 57 Average total phosphorous concentrations at shoreline monitoring sites on Davern Lake, 2006-2017.
Figure 58 Average total Kjeldahl nitrogen concentrations at shoreline monitoring sites on Davern Lake, 2006-2017.
Summary of Davern Lake Nutrients
Davern Lake nutrient concentrations are generally below the guidelines, with few samples having elevated results. In the near shore area nutrient loading does not appear to be a concern with the exception of some elevated concentrations that have occurred at site C. Shoreline locations (at monitored sites and around the lake) should be examined to identify if potential sources of nutrient inputs can be reduced through methods such as the diversion or slowing of runoff and enhanced shoreline buffers.
Nutrient exceedances may be partially attributed to the natural aging of a lake and basin characteristics, which occurs as nutrient rich sediment from the surrounding landscape accumulates in the lake over time. Aging of the lake can be slowed with the help of all catchment residents by reducing nutrient inputs through practices such as proper maintenance of septic systems, keeping shorelines natural and using phosphate free soaps and detergents.
2.6.2 Davern Lake Water Clarity
Water clarity is measured using a Secchi disk during each deep point sample. Table 24 summarizes the recorded depths with an average depth of 4.4 m and shows that all readings have exceeded the minimum PWQO of 2m indicating that algae in the water column are not at excessive levels (good water clarity). Less than 2 m will indicate overproduction in a lake or significant inputs to the water column that are limiting light availability. Figure 59 shows that no individual reading has been below the guideline and measured depths range from 2.0 m to 6 m. A declining trend observed in Secchi depths over the 2006-2017 period, indicating that Secchi depths have been reduced over this period.
Table 24 Summary of Secchi depths recorded at the deep point (DP1) on Davern Lake, 2006-2017.
Secchi 2006-2017
Site
Average (m)
Above Guideline
No. Samples
DP1
4.4
100%
43
Figure 59 Recorded Secchi depths at the deep point site (DP1) on Davern Lake, 2006-2017.
Summary of Davern Lake Water Clarity
Waters in Davern Lake are clear and sufficient sunlight is able to penetrate the water column to support aquatic life and provide sufficient visibility for safe recreational use (boating, swimming).
2.6.3 Davern Lake Fish Habitat
Two other factors, dissolved oxygen/temperature and pH were also assessed to provide an overall sense of the health of Davern Lake from a fish habitat perspective.
2.6.3.1 Davern Lake Dissolved Oxygen and Temperature
The red bars in Figure 60 show the depths where suitable conditions exist for warm water fish species (temperature less than 25°C and dissolved oxygen greater than 4 mg/l) at the deep point site. The vertical axis represents the total lake depth at each site where the profile is taken. Suitable oxygen temperatures exist over an average depth of 15 m. There is typically a good proportion of the water column available for fish species; habitat conditions do become more limited in the late summer and fall due to depleted of oxygen at deeper depths. Oxygen is depleted in the bottom waters as vegetation matter sinks and undergoes the decaying process.
Figure 60 Depths suitable for warm water fish species at the deep point site (DP1) on Davern Lake, 2006-2017.
2.6.3.2 Davern Lake pH
pH is a basic water quality parameter used to assess the acidity of water, an important factor for aquatic life. Figure 61 shows monitored pH values over the 2006-2017 period.
Figure 61 pH concentrations at the deep point sites (DP1) on Davern Lake, 2006-2017.
All samples (100%, Table 25) were within guidelines established by the Canadian Council of Minister's of the Environment which state that pH should be between 6.5 and 9 to protect aquatic life. So significant change or trend was noted in pH values over the 2006-2017 period. Anthropogenic and biological activities such as increased photosynthesis from algal blooms and plant growth may act to influence pH.
Table 25 Summary of pH results at the deep point site (DP1) on Davern Lake, 2006-2017
pH 2006-2017
Site
Average (mg/l)
Within Guideline
No. Samples
DP1
8.3
100%
37
Summary of Water Quality for Fish Habitat in Davern Lake
Overall the water chemistry data at the deep point describes suitable habitat conditions for fish species such as bass, walleye and pike. There is some evidence that the warming of the water column in the late summer/fall and limited oxygen availability at deeper depths may minimize the amount of habitat for some more sensitive species. pH conditions are within the range recommended for the protection of aquatic life. Overall, the data indicates a healthy environment for aquatic species.
2.6.4 Davern Lake E. Coli
E. coli is sampled at monitored shoreline sites twice each sampling season. E. coli data was not used in the calculations of the WQI rating for the lake due to differences in sampling frequency and site locations, the results are summarized in Table 26. Throughout the 2006-2017 period 100 percent of samples were below the E. coli guideline of 100 colony forming units (CFU) per 100 ml set by the PWQO; across the lake the count at the geometric mean was 4 CFU/100ml (Table 26).
Table 26 Summary of E. coli results for Davern Lake, 2006-2017
E. coli 2006-2017
Site
Geometric mean (CFU/100ml)
Below Guideline
No. Samples
A-C
4
99%
73
Figure 62 shows the distribution of counts across all shoreline sites. All sites fell well below the guideline of 100 CFU/100ml.
Figure 62 Geometric mean of E.coli counts at shoreline sites monitored on Davern Lake, 2006-2017
Summary of Davern Lake Bacterial Contamination
The results presented above provide evidence that bacterial contamination is not a significant concern in Davern Lake and the water should be safe for recreational use such as swimming and boating.
2.7 Tay River Water Quality
Two sites along the Tay River in the Chrisite Lake catchment are monitored by the RVCA's Baseline Water Quality Monitoring Program (TAY-15, TAY-16; Figure 2). Analysis of the data is based on samples collected from 2006 to 2017. Table 1 shows water quality at the Bolingbroke site (TAY-16) to be “Very Good” and "Good to Very Good" at the Christie Lake outlet (Tay-15), as determined by the Canadian Council of Ministers of the Environment Water Quality Index (CCME WQI).
The scores at this site indicate favourable water quality conditions, with occasional instances of elevated nutrients and E. coli accounts. For more information on the CCME WQI, please see the Tay River Subwatershed Report. Only those parameters with exceedances that influenced the rating will be discussed in the following sections.
2.7.1 Tay River Nutrients
Total phosphorus (TP) is used as a primary indicator of excessive nutrient loading and may contribute to abundant aquatic vegetation growth and depleted dissolved oxygen levels. The Provincial Water Quality Objective (PWQO) is used as the TP Guideline and states that in streams concentrations greater than 0.030 mg/l indicate an excessive amount of TP.
Total Kjeldahl nitrogen (TKN) is used as a secondary indicator of nutrient loading. RVCA uses a guideline of 0.500 mg/l to assess TKN[1].
Tables 27 and 28 summarize average nutrient concentrations at the monitored sites on this reach of the Tay River and show the proportion of results that meet the guidelines.
Table 27 Summary of total phosphorus results for the Tay River in the Christie Lake catchment, 2006-2017.
Total Phosphorus 2006-2017
Site
Average (mg/l)
Below Guideline
No. Samples
TAY-16
0.012
100%
72
TAY-15
0.011
92%
72
Table 28 Summary of total Kjeldahl nitrogen results for the Tay River in the Christie Lake catchment, 2006-2017.
Total Kjeldahl Nitrogen 2006-2017
Site
Average (mg/l)
Below Guideline
No. Samples
TAY-16
0.394
97%
72
TAY-15
0.371
97%
72
Elevated TP results occurred very rarely at both TAY-16 and TAY-15 throughout the monitoring period; 100% of samples were below the guideline at site TAY-16 and 92% of samples at site TAY-15 (Figures 64 and 68); average concentrations were below the guidelines for each monthly sample (Figures 63 and 67). The average TP concentration was below the guideline at both sites, measuring 0.012 and 0.011 respectively (Table 27). A declining trend was observed in sampled TP concentrations at both sites over the 2006-2017 periods.
The majority of TKN results were also below the guideline (Figure 66 and 70). At site TAY-16, 97% of samples were below the guideline (Figure 66) as were the average monthly samples (Figure 65). At TAY-15, 97% of samples were below the guideline (Figure 70, Table 28) and as with the upstream site (TAY-16) all average concentrations were below the guideline (Figure 69, Table 28). A declining trend was observed in the TKN concentration was noted at site TAY-16, while there was no significant trend in concentrations at TAY-15.
Figure 63 Average monthly total phosphorus concentrations at site TAY-16 in the Tay River, 2006-2017
Figure 64 Distribution of total phosphorus concentrations at site TAY-16 in the Tay River, 2006-2017
Figure 65 Average monthly total Kjeldahl nitrogen concentrations at site TAY-16 in the Tay River, 2006-2017.
Figure 66 Distribution of total Kjeldahl nitrogen concentrations at site TAY-16 in the Tay River, 2006-2017
Figure 67 Average monthly total phosphorus concentrations at site TAY-15 in the Tay River, 2006-2017.
Figure 68 Distribution of total phosphorus concentrations at site TAY-15 in the Tay River, 2006-2017
Figure 69 Average monthly total Kjeldahl nitrogen concentrations at site TAY-15 in the Tay River, 2006-2017.
Figure 70 Distribution of total Kjeldahl nitrogen concentrations at site TAY-15 in the Tay River, 2006-2017
Summary of Tay River Nutrients
This sites along the Tay River have few instances of elevated nutrient concentrations. Overall, a declining trend in both total phosphorus and nitrogen was observed at the upstream site (TAY-16); this trend continued at the downstream site at the outlet to Christie Lake (TAY-15) for sampled TP concentrations. No change was noted in TKN concentrations. While nutrient enrichment is not an issue in this reach of the river, it is important to maintain and adopt good stewardship to ensure good water quality continues into the future. Best management practices such as minimizing storm water runoff, enhanced shoreline buffers, minimizing/discontinuing the use of fertilizers and restricting livestock access in both surrounding agricultural and developed areas can help to reduce additional nutrient enrichment within the Tay River.
2.7.2 Tay River E. coli
Escherichia coli (E. coli) is used as an indicator of bacterial pollution from human or animal waste; in elevated concentrations it can pose a risk to human health. The PWQO of 100 colony forming units/100 millilitres (CFU/100 ml) is used as a guideline. E. coli counts greater than this guideline indicate that bacterial contamination may be a problem within a waterbody.
Table 29 summarizes the geometric means[3] for the monitored sites on the Tay River and show the proportion of samples that meet the E. coli guideline of 100 CFU/100 ml. The results of the geometric mean with respect to the guideline for the 2006-2017 period are shown in Figures 71-74.
Table 29 Summary of E. coli results for the Tay River in the Christie Lake catchment, 2006-2017
E. coli 2006-2017
Site
Geometric Mean (CFU/100ml)
Below Guideline
No. Samples
TAY-16
10
100%
72
TAY-15
8
100%
72
E. coli counts at both sites show that there has been no significant trend in bacterial counts (Figures 72 and 74). At TAY-16 the count at the geometric mean was 10 (Table 29), and all results (100 percent) were below the E. coli guideline. Figure 71 shows that there are slight variations in the counts throughout the monitored seasons. Results at site TAY-15 are very similar to the upstream site, counts at the geometric mean were very low at 8 CFU/100ml (Table 29), with monthly means comparable across the monitoring period (Figure 73).
Figure 71 Geometric mean of monthly E. coli counts at TAY-16 in the Tay River, 2006-2017.
Figure 72 Distribution of E. coli counts at TAY-16 in the Tay River, 2006-2017
Figure 73 Geometric mean of monthly E. coli counts at TAY-15 in the Tay River, 2006-2017.
Figure 74 Distribution of E. coli counts at TAY-15 in the Tay River, 2006-2017
Summary of Tay River Bacterial Contamination
Bacterial contamination does not appear to be a significant concern in this reach of the Tay River. Best management practices such as enhancing shoreline buffers, limiting livestock access and minimizing runoff in both rural and developed areas can help to protect this reach of the Tay River into the future.
[1] No Ontario guideline for TKN is presently available; however, waters not influenced by excessive organic inputs typically range from 0.100 to 0.500 mg/l, Environment Canada (1979) Water Quality Sourcebook, A Guide to Water Quality Parameters, Inland Waters Directorate, Water Quality Branch, Ottawa, Canada
[2] Trends were determined using the Mann-Kendall trend test and Sens slope estimator
[3] A type of mean or average, which indicates the central tendency or typical value of a set of numbers by using the product of their values (as opposed to the arithmetic mean which uses their sum). It is often used to summarize a variable that varies over several orders of magnitude, such as E. coli counts.
The Stream Characterization Program evaluated 5.2 km of the Tay River in 2017 in the Christie Lake catchment. A total of 52 stream survey assessments were completed in the middle of June and July from Bolingbroke Dam to where the Tay River flows into Christie Lake. The Tay River watershed experienced high water levels along the Tay River and its tributaries. In addition many of the Tay watershed lakes also experienced prolonged high water levels including Christie Lake (see photo below). Several roads were temporarily closed due to flooding in the catchment.
Jordans Bridge at Christie Lake on May 12th, 2017
3.1 Tay River River Overbank Zone
3.1.1 Riparian Buffer Evaluation
The quality of the riparian area increases with the width, complexity and linear extent of its vegetation along a stream or creek. A complex riparian community consists of diverse plant species native to the site, with multiple age-classes providing vertical structural diversity along a watercourse.
Here is a list of watershed benefits from a healthy riparian buffer zone:
Reduces the amount of pollutants that reach the stream from surface runoff
Helps reduce and mitigates erosion
Provides a microclimate that is cooler during the summer months providing cooler water for aquatic organisms
Provides large wood structure from fallen trees and limbs that form instream cover, create pools, stabilize the streambed, and provide habitat for aquatic organisms
Provides organic material for stream biota that, among other functions, is the base of the food chain in lower order streams
Provides habitat for terrestrial insects that drop in the stream and become food for fish and travel corridors for other terrestrial animals
Dissipates energy during flood events
Often provides the only refuge areas for fish during out-of-bank flows (behind trees, stumps, and logs)
Figure 74 demonstrates the buffer conditions of the left and right banks separately. The Tay River had a buffer of greater than 30 meters along 90 percent of the left bank and 86 percent of the right bank.
Figure 74 Riparian Buffer Evaluation along the Tay River in the Christie Lake catchment
3.1.2 Riparian Buffer Alterations
Alterations within the riparian buffer were assessed within three distinct shoreline zones (0-5m, 5-15m, 15-30m), and evaluated based on the dominant vegetative community and/or land cover type (Figure 75). The riparian buffer zone along the Tay River was found to be dominated by forest, scrubland and wetland conditions. There were two areas that had altered riparian zone conditions along the Tay River.
Figure 75 Riparian buffer alterations along the Tay River in the Christie Lake catchment
3.1.3 Adjacent Land Use
The RVCA’s Stream Characterization Program identifies ten different land uses along the Tay River (Figure 76). Surrounding land use is considered from the beginning to end of the survey section (100m) and up to 100m on each side of the river. Land use outside of this area is not considered for the surveys but is nonetheless part of the subwatershed and will influence the river. Forest habitat was dominant at 96 percent; scrubland was found along 87 percent of the surveyed sections, wetland habitat was observed along 73 percent of the system and 17 percent meadow habitat was present along the Tay River. The remaining land use consisted of residential, pasture, abandoned agriculture, recreational and infrastructure in the form of road crossings.
Figure 76 Land Use along the Tay River in the Christie Lake catchment
3.2 Tay River Shoreline Zone
3.2.1 Instream Erosion
Stream erosion is the process by which water erodes and transports sediments, resulting in dynamic flows and diverse habitat conditions. Excessive erosion can result in drastic environmental changes, as habitat conditions, water quality and aquatic life are all negatively affected. Bank stability was assessed as the overall extent of each section with “unstable” shoreline conditions. These conditions are defined by the presence of significant exposed soils/roots, minimal bank vegetation, severe undercutting, slumping or scour and potential failed erosion measures. The majority of the Tay River had no erosion observed along the surveyed sections with a few small sections having low to moderate levels of erosion (Figure 77).
Figure 77 Erosion levels along the Tay River in the Christie Lake catchment
3.2.2 Undercut Stream Banks
Stream bank undercuts can provide excellent cover habitat for aquatic life, however excessive levels can be an indication of unstable shoreline conditions. Bank undercut was assessed as the overall extent of each surveyed section with overhanging bank cover present. Figure 78 shows that the Tay River had no observed undercut banks along the majority of the system, however there were several sections in the upper and middle reaches with low to moderate levels of undercut banks. Moderate levels were observed immediately downstream of the Bolingbroke dam.
Figure 78 Undercut stream banks along the Tay River in the Christie Lake catchment
3.2.3 Stream Shading
Grasses, shrubs and trees all contribute towards shading a stream. Shade is important in moderating stream temperature, contributing to food supply and helping with nutrient reduction within a stream. Stream cover is assessed as the total coverage area in each section that is shaded by overhanging shrubs/grasses and tree canopy, at greater than 1m above the water surface. Figure 79 shows low levels of stream shading along the majority of the Tay River in the middle and lower reaches, which is consistent with wide open wetland habitat conditions. There were several sections in the upper reaches, where the channel narrows, that had high to moderate levels of stream shading along the Tay River downstream of the Bolingbroke Dam.
Figure 79 Stream shading along the Tay River in the Christie Lake catchment
Tay River with high levels of stream shading, downstream of the Bolingbroke Dam
3.2.4 Instream Wood Structure
Forested shorelines provide essential complex habitat through the perpetual process of shoreline trees falling into the water. This continuous recruitment of trees creates a wood-based physical structure in the littoral zone that is common on natural systems. Insects, fish, amphibians, birds, and other animals have also evolved with this abundance of near shore wood and it is essential to their life cycles. With increased development along many waterways, forested lakeshores have been altered and wood-based physical structure in many waterways has been reduced. It is important to restore this essential habitat to aquatic ecosystems.
Shoreline Protection
Protects shorelines by providing a barrier from wind and wave erosion
Reduces sedimentation of the water caused by shoreline slumping due to bank erosion
Allows detritus to collect and settle on the lake or creek bed providing the substrate structure required for native aquatic vegetation to establish and outcompete invasive species
Food Source
Wood complexes are an important food source for invertebrates
Small fish feed on the abundance of invertebrates that are found around these structures
Larger fish, waterfowl and shorebirds all benefit from the abundance of invertebrates and small fish feeding around woody structures in the littoral zone
Cover
Cover from predators is essential for many fish and animals to successfully complete their life cycle
The nooks and crannies of wood complexes offer critters safety from predators while at the same time concentrating prey to make predators more efficient
Wood provides the structure on which many species must lay or attach their eggs, therefore these complexes provide quality spawning and nesting habitat
Diversity
Wood complexes in the littoral zone provide unique edge habitat along the shoreline
Edge habitats contain more species diversity and higher concentrations of species than the adjoining habitats themselves will have
Figure 80 shows that the majority of the Tay River had low levels of instream wood structure along the system. There were several stream survey sections in the middle reach which were characterized as having moderate levels of instream wood structure in the form of branches and trees along the system.
Figure 80 Instream wood structure along the Tay River in the Christie Lake catchment
3.2.5 Overhanging Wood Structure
Trees and branches that are less than one meter from the surface of the water are defined as overhanging. Overhanging wood structure provide a food source, nutrients and shade which helps to moderate instream water temperatures. Figure 81 shows the system is highly variable with no overhanging branches and trees where the river is wide and is dominated by wetland habitat to areas that have high levels of overhanging wood structure along the Tay River.
Figure 81 Overhanging wood structure along the Tay River in the Christie Lake catchment
3.2.6 Anthropogenic Alterations
Stream alterations are classified based on specific functional criteria associated with the flow conditions, the riparian buffer and potential human influences. Figure 82 shows ninety-two percent of the Tay River remains “unaltered” with no anthropogenic alterations. Eight percent of the Tay River was classified as natural with minor anthropogenic changes. The alterations along the Tay River were in the form of shoreline modifications and road crossings. There were no sections that were classified as being altered and highly altered.
Figure 82 Anthropogenic alterations along the Tay River in the Christie Lake catchment
3.3 Tay River Instream Aquatic Habitat
3.3.1 Benthic Invertebrates
Freshwater benthic invertebrates are animals without backbones that live on the stream bottom and include crustaceans such as crayfish, molluscs and immature forms of aquatic insects. Benthos represent an extremely diverse group of aquatic animals and exhibit wide ranges of responses to stressors such as organic pollutants, sediments and toxicants, which allows scientists to use them as bioindicators. As part of the Ontario Benthic Biomonitoring Network (OBBN), the RVCA has been collecting benthic invertebrates at the Crow Lake Road site since 2003. Monitoring data is analyzed for each sample site and the results are presented using the Family Biotic Index, Family Richness and percent Ephemeroptera, Plecoptera and Trichoptera.
OBBN site, replicate number 3 at the Crow Lake Road
Hilsenhoff Family Biotic Index
The Hilsenhoff Family Biotic Index (FBI) is an indicator of organic and nutrient pollution and provides an estimate of water quality conditions for each site using established pollution tolerance values for benthic invertebrates. FBI results for the Christie Lake - Tay River catchment at the Crow Lake Road sample location is summarized by year. “Good” to “Excellent” water quality conditions were observed at the Tay River sample location (Figure 83) using a grading scheme developed by Conservation Authorities in Ontario for benthic invertebrates.
Figure 83 Hilsenhoff Family Biotic Index at the Crow Lake Road sample location
Family Richness
Family Richness measures the health of the community through its diversity and increases with increasing habitat diversity suitability and healthy water quality conditions. Family Richness is equivalent to the total number of benthic invertebrate families found within a sample. The Crow Lake Road location is reported to have “Fair” family richness (Figure 84).
Figure 84 Family Richness at the Crow Lake Road sample location
EPT
Ephemeroptera (Mayflies), Plecoptera (Stoneflies), and Trichoptera (Caddisflies) are species considered to be very sensitive to poor water quality conditions. High abundance of these organisms is generally an indication of good water quality conditions at a sample location. The community structure is typically dominated by species that are sensitive to poor water quality conditions. As a result, the EPT indicates that the Christie Lake - Tay River sample location is reported to have “Good” water quality (Figure 85) during the reporting periods.
Figure 85 EPT on the Tay River at the Crow Lake Road sample location
Summary of Water Quality for Benthic Invertebrates in the Tay River
Overall, the Tay River site in the Christie Lake catchment from a benthic invertebrate perspective is considered “Good” as the samples are dominated with species that are sensitive to high organic pollution levels.
3.3.2 Habitat Complexity
Habitat complexity is a measure of the overall diversity of habitat types and features within a stream. Streams with high habitat complexity support a greater variety of species niches, and therefore contribute to greater diversity. Factors such as substrate, flow conditions (pools, riffles) and cover material (vegetation, wood structure, etc.) all provide crucial habitat to aquatic life. Habitat complexity is assessed based on the presence of boulder, cobble and gravel substrates, as well as the presence of instream wood structure.
Moderate to high habitat complexity was identified for the Tay River in the catchment (Figure 86). Regions with increased habitat complexity were observed throughout the reaches of the system within the catchment.
Figure 86 Habitat complexity along the Tay River in the Christie Lake catchment
3.3.3 Instream Substrate
Diverse substrate is important for fish and benthic invertebrate habitat because some species have specific substrate requirements and for example will only reproduce on certain types of substrate. The absence of diverse substrate types may limit the overall diversity of species within a stream. Substrate conditions were highly diverse along the Tay River with most substrate types being recorded at various locations along the system (Figure 87). The dominant substrate type observed for each section surveyed along the Tay River is shown in Figure 88.
Figure 87 Instream substrate along the Tay River in the Christie Lake catchment
Figure 88 shows the dominant substrate type along the Tay River in the Christie Lake catchment
3.3.4 Instream Morphology
Pools and riffles are important habitat features for aquatic life. Riffles are fast flowing areas characterized by agitation and overturn of the water surface. Riffles thereby play a crucial role in contributing to dissolved oxygen conditions and directly support spawning for some fish species. They are also areas that support high benthic invertebrate populations which are an important food source for many aquatic species. Pools are characterized by minimal flows, with relatively deep water and winter/summer refuge habitat for aquatic species. Runs are moderately shallow, with unagitated surfaces of water and areas where the thalweg (deepest part of the channel) is in the center of the channel. Figure 89 shows that the Tay River is variable; 94 percent of sections recorded runs, 29 percent pools and 23 percent riffles. Figure 90 shows where the riffle habitat areas were observed along the Tay River.
Figure 89 Instream morphology along the Tay River in the Christie Lake catchment
Figure 90 Instream riffle habitat along the Tay River in the Christie Lake catchment
3.3.5 Vegetation Type
Instream vegetation provides a variety of functions and is a critical component of the aquatic ecosystem. Aquatic plants promote stream health by:
Providing direct riparian/instream habitat
Stabilizing flows reducing shoreline erosion
Contributing to dissolved oxygen through photosynthesis
Maintaining temperature conditions through shading
For example, emergent plants along the shoreline can provide shoreline protection from wave action and important rearing habitat for species of waterfowl. Submerged plants provide habitat for fish to find shelter from predator fish while they feed. Floating plants such as water lilies shade the water and can keep temperatures cool while reducing algae growth. Narrow leaved emergents were observed in 96 percent of sections, submerged plants and robust emergents were both present in 87 percent of the survey sections, 73 percent of sections contained algae, 69 percent floating plants and 58 percent broad leaved emergents. Figure 91 depicts the plant community structure for the Tay River. Figure 92 shows the dominant vegetation type observed for each section surveyed along the Tay River in the Christie Lake catchment.
Figure 91 Vegetation type along the Tay River in the Christie Lake catchment
Figure 92 Dominant vegetation type along the Tay River in the Christie Lake catchment
3.3.6 Instream Vegetation Abundance
Instream vegetation is an important factor for a healthy stream ecosystem. Vegetation helps to remove contaminants from the water, contributes oxygen to the stream, and provides habitat for fish and wildlife. Too much vegetation can also be detrimental. Figure 93 demonstrates that the Tay River had normal to common levels of vegetation recorded at 29 and 42 percent of stream surveys. Extensive levels of vegetation were observed in 54 percent of the surveyed sections and were consistent with areas dominated by the invasive aquatic plant known as European frogbit; while thirteen percent of sections had no vegetation in areas.
Figure 93 Instream vegetation abundance along the Tay River in the Christie Lake catchment
3.3.7 Invasive Species
Invasive species can have major implications on streams and species diversity. Invasive species are one of the largest threats to ecosystems throughout Ontario and can out compete native species, having negative effects on local wildlife, fish and plant populations. Ninety percent of the sections surveyed along the Tay River in the Christie Lake catchment had invasive species. The invasive species observed were European frogbit, banded mystery snail, purple loosestrife and common/glossy buckthorn. Invasive species abundance (i.e. the number of observed invasive species per section) was assessed to determine the potential range/vector of many of these species (Figure 94).
Figure 94 Invasive species abundance along the Tay River in the Christie Lake catchment
3.3.8 Water Chemistry
During the stream characterization survey, a YSI probe is used to collect water chemistry information. Dissolved oxygen (DO), specific conductivity (SPC) and pH are measured at the start and end of each section.
3.3.8.1 Dissolved Oxygen
Dissolved oxygen is a measure of the amount of oxygen dissolved in water. The Canadian Environmental Quality Guidelines of the Canadian Council of Ministers of the Environment (CCME) suggest that for the protection of aquatic life the lowest acceptable dissolved oxygen concentration should be 6 mg/L for warmwater biota and 9.5 mg/L for coldwater biota (CCME, 1999). Figure 95 shows that the dissolved oxygen in Tay River supports warmwater and in certain locations coldwater biota along the system. The average dissolved oxygen level observed within Christie Lake - Tay River catchment was 9.2mg/L which meets the recommended level for warm and cool water biota.
Figure 95 Dissolved oxygen ranges along the Tay River in the Christie Lake catchment
3.3.8.2 Conductivity
Conductivity in streams is primarily influenced by the geology of the surrounding environment, but can vary drastically as a function of surface water runoff. Currently there are no CCME guideline standards for stream conductivity; however readings which are outside the normal range observed within the system are often an indication of unmitigated discharge and/or stormwater input. The average conductivity observed within the Tay River was 138.7 µs/cm. Figure 96 shows the conductivity readings for the Tay River in the Christie Lake catchment.
Figure 96 Specific conductivity ranges in the Tay River in the Christie Lake catchment
3.3.8.3 pH
Based on the PWQO for pH, a range of 6.5 to 8.5 should be maintained for the protection of aquatic life. Average pH values along the Tay River were 7.94 thereby meeting the provincial standard (Figure 97).
Figure 97 pH ranges along the Tay River in the Christie Lake catchment
3.3.8.4 Oxygen Saturation (%)
Oxygen saturation is measured as the ratio of dissolved oxygen relative to the maximum amount of oxygen that will dissolve based on the temperature and atmospheric pressure. Well oxygenated water will stabilize at or above 100% saturation, however the presence of decaying matter/pollutants can drastically reduce these levels. Oxygen input through photosynthesis has the potential to increase saturation above 100% to a maximum of 500%, depending on the productivity level of the environment. In order to represent the relationship between concentration and saturation, the measured values have been summarized into 6 classes:
Figure 98 portrays dissolved oxygen conditions in the upper reach of the Tay River and system variability from Bobs Lake to Christie Lake.
Figure 98 A bivariate assessment of dissolved oxygen concentration (mg/L) and saturation (%) in the Tay River in the Christie Lake catchment
3.3.8.5 Specific Conductivity Assessment
Specific conductivity (SPC) is a standardized measure of electrical conductance, collected at or corrected to a water temperature of 25⁰C. SPC is directly related to the concentration of ions in water, and is commonly influenced by the presence of dissolved salts, alkalis, chlorides, sulfides and carbonate compounds. The higher the concentration of these compounds, the higher the conductivity. Common sources of elevated conductivity include storm water, agricultural inputs and commercial/industrial effluents.
In order to summarize the conditions observed, SPC levels were evaluated as either normal, moderately elevated or highly elevated. These categories correspond directly to the degree of variation (i.e. standard deviation) at each site relative to the average across the system.
Normal levels were maintained in the middle reaches of the Tay River, however there were moderately elevated areas in the upper and lower reaches (Figure 99). One section had high conductivity levels observed in the upper reach and was consistent with an area with stream bank erosion observations.
Figure 99 Relative specific conductivity levels along the Tay River in the Christie Lake catchment
3.3.9 Thermal Regime
Many factors can influence fluctuations in stream temperature, including springs, tributaries, precipitation runoff, discharge pipes and stream shading from riparian vegetation. Water temperature is used along with the maximum air temperature (using the Stoneman and Jones method) to classify a watercourse as either warm water, cool water or cold water. Figure 100 shows where the thermal sampling sites were located on the Tay River in the Christie Lake catchment. Analysis of the data collected indicates that the Tay River is classified as a warm water system (Figure 101).
Figure 100 Temperature logger locations along the Tay River in the Christie Lake catchment
Figure 101 Temperature logger data for the sites along the Tay River in the Christie Lake catchment
Each point on the graph represents a temperature that meets the following criteria:
Sampling dates between July 1st and September 7th
Sampling date is preceded by two consecutive days above 24.5 °C, with no rain
Water temperatures are collected at 4pm
Air temperature is recorded as the max temperature for that day
3.3.10 Groundwater
Groundwater discharge areas can influence stream temperature, contribute nutrients, and provide important stream habitat for fish and other biota. During stream surveys, indicators of groundwater discharge are noted when observed. Indicators include: springs/seeps, watercress, iron staining, significant temperature change and rainbow mineral film. Figure 102 shows areas where one or more of the above groundwater indicators were observed during stream surveys and headwater assessments.
Figure 102 Groundwater indicators observed in the Christie Lake catchment
3.3.11 Fish Community
The Tay River Christie Lake catchment is classified as a mixed community of warm and cool water recreational and baitfish fishery with 22 species observed. Table 30 contains a list of species identified in the watershed and Figure 103 shows the location of those observations.
Table 30 Fish species observed in the Christie Lake catchment
Fish Species
Scientific Name
Fish code
Historical
2017
banded killifish
Fundulus diaphanus
BaKil
X
black crappie
Pomoxis nigromaculatus
BlCra
X
bluegill
Lepomis macrochirus
Blueg
X
X
bluntnose minnow
Pimephales notatus
BnMin
X
brown bullhead
Ameiurus nebulosus
BrBul
X
burbot
Lota lota
Burbo
X
central mudminnow
Umbra limi
CeMud
X
common shiner
Luxilus cornutus
CoShi
X
creek chub
Semotilus atromaculatus
CrChu
X
fallfish
Semotilus corporalis
Fallf
X
golden shiner
Notemigonus crysoleucas
GoShi
X
hornyhead chub
Nocomis biguttatus
HhChu
X
largemouth bass
Micropterus salmoides
LmBas
X
logperch
Percina caprodes
Logpe
X
micropterus sp.
Micropterus sp.
MicSp
X
northern pike
Esox lucius
NoPik
X
northern redbelly dace
Chrosomus eos
NRDac
X
pumpkinseed
Lepomis gibbosus
Pumpk
X
X
redhorse sp.
Moxostoma sp.
MoxSp
X
rock bass
Ambloplites rupestris
RoBas
X
X
smallmouth bass
Micropterus dolomieu
SmBas
X
spottail shiner
Notropis hudsonius
StShi
X
sunfish family
Lepomis sp.
LepSp
X
X
walleye
Sander vitreus
Walle
X
yellow perch
Perca flavescens
YePer
X
X
TOTAL Species
22
8
Figure 103 Fish Community sampling observations along the Tay River in 2017
RVCA fish sampling site on the Tay River
3.3.12 Migratory Obstructions
It is important to know locations of migratory obstructions because these can prevent fish from accessing important spawning and rearing habitat. Migratory obstructions can be natural or man-made, and they can be permanent or seasonal. Figure 104 shows that Christie Lake catchment had six perched culverts and one dam on headwater drainage features within the catchment. The Bolingbroke Dam at the outlet of Bobs Lake is located immediately upstream of where the surveys were completed along the Tay River.
Figure 104 Migratory obstructions in the Christie Lake catchment
3.3.13 Beaver Dams
Overall beaver dams create natural changes in the environment. Some of the benefits include providing habitat for wildlife, flood control, and silt retention. Additional benefits come from bacterial decomposition of woody material used in the dams which removes excess nutrient and toxins. Beaver dams can also result in flooding of agricultural lands and may be potential barriers to fish migration. Two beaver dams were identified on headwater drainage features in the Christie Lake catchment at the time of the survey (Figure 105).
Figure 105 Beaver Dam type and locations in the Christie Lake catchment
3.3.14 Riparian Restoration
Figure 106 depicts the locations of riparian restoration opportunities as a result of observations made during the stream survey. Several riparian planting opportunities were identified in the Christie Lake catchment.
Figure 106 Riparian restoration opportunities along the Tay River in the Christie Lake catchment
3.4 Headwater Drainage Feature Assessment
3.4.1 Headwaters Sampling Locations
The RVCA Stream Characterization program assessed Headwater Drainage Features for the Christie Lake - Tay River catchment in 2016. This protocol measures zero, first and second order headwater drainage features (HDF). It is a rapid assessment method characterizing the amount of water, sediment transport, and storage capacity within headwater drainage features (HDF). RVCA is working with other Conservation Authorities and the Ministry of Natural Resources and Forestry to implement the protocol with the goal of providing standard datasets to support science development and monitoring of headwater drainage features. An HDF is a depression in the land that conveys surface flow. Additionally, this module provides a means of characterizing the connectivity, form and unique features associated with each HDF (OSAP Protocol, 2013). In 2016 the program sampled 29 sites at road crossings in the Christie Lake catchment area (Figure 107).
Figure 107 Location of the headwater sampling sites in the Christie Lake catchment
3.4.2 Headwater Feature Type
The headwater sampling protocol assesses the feature type in order to understand the function of each feature. The evaluation includes the following classifications: defined natural channel, channelized or constrained, multi-thread, no defined feature, tiled, wetland, swale, roadside ditch and pond outlet. By assessing the values associated with the headwater drainage features in the catchment area we can understand the ecosystem services that they provide to the watershed in the form of hydrology, sediment transport, and aquatic and terrestrial functions. The headwater drainage features in the Christie Lake catchment are dominated by natural and wetland features. Figure 108 shows the feature type of the primary feature at the sampling locations.
Figure 108 Headwater feature types in the Christie Lake catchment
3.4.3 Headwater Feature Flow
The observed flow condition within headwater drainage features can be highly variable depending on timing relative to the spring freshet, recent rainfall, soil moisture, etc. Flow conditions are assessed in the spring and in the summer to determine if features are perennial and flow year round, if they are intermittent and dry up during the summer months or if they are ephemeral systems that do not flow regularly and generally respond to specific rainstorm events or snowmelt. Flow conditions in headwater systems can change from year to year depending on local precipitation patterns. Even though the subwatershed was in a drought condition in 2016 most features were flowing in the summer months. Figure 109 shows the observed flow condition at the sampling locations in the Christie Lake catchment.
Figure 109 Headwater feature flow conditions in the Christie Lake catchment
A spring photo of the headwater sample site in the Christie Lake catchment located on Hanna Road
A summer photo of the headwater sample site in the Christie Lake catchment located on Hanna Road
3.4.4 Feature Channel Modifications
Channel modifications were assessed at each headwater drainage feature sampling location. Modifications include channelization, dredging, hardening and realignments. The Christie Lake catchment area had a majority of features with no channel modifications observed, two sites as having been historically dredged/channelized and two locations had mixed modifications. Figure 110 shows the channel modifications observed at the sampling locations in the catchment.
Figure 110 Headwater feature channel modifications in the Christie Lake catchment
3.4.5 Headwater Feature Vegetation
Headwater feature vegetation evaluates the type of vegetation that is found within the drainage feature. The type of vegetated within the channel influences the aquatic and terrestrial ecosystem values that the feature provides. For some types of headwater features the vegetation within the feature plays a very important role in flow and sediment movement and provides wildlife habitat. Figure 111 depicts the dominant vegetation observed at the sampled headwater sites in the Christie Lake catchment.
Figure 111 Headwater feature vegetation types in the Christie Lake catchment
3.4.6 Headwater Feature Riparian Vegetation
Headwater riparian vegetation evaluates the type of vegetation that is found along the adjacent lands of a headwater drainage feature. The type of vegetation within the riparian corridor influences the aquatic and terrestrial ecosystem values that the feature provides to the watershed. Figure 112 sepicts the type of riparian vegetation observed at the sampled headwater sites in the Christie Lake catchment.
Figure 112 Headwater feature riparian vegetation types in the Christie Lake catchment
3.4.7 Headwater Feature Sediment Deposition
Assessing the amount of recent sediment deposited in a channel provides an index of the degree to which the feature could be transporting sediment to downstream reaches (OSAP, 2013). Evidence of excessive sediment deposition might indicate the requirement to follow up with more detailed targeted assessments upstream of the site location to identify potential best management practices to be implemented. Sediment deposition ranged from none to substantial for the headwater sites sampled in the catchment. Figure 113 depicts the degree of sediment deposition observed at the sampled headwater sites in the Christie Lake catchment. Sediment deposition conditions ranged from no sediment deposition to extensive.
Figure 113 Headwater feature sediment deposition in the Christie Lake catchment
3.4.8 Headwater Feature Upstream Roughness
Feature roughness will provide a measure of the amount of materials within the bankfull channel that could slow down the velocity of water flowing within the headwater feature (OSAP, 2013). Materials on the channel bottom that provide roughness include vegetation, woody debris and structure and boulders/cobble substrates. Roughness can provide benefits in mitigating downstream erosion on the headwater drainage feature and the receiving watercourse by reducing velocities. Roughness also provides important habitat conditions for aquatic organisms. Figure 114 shows the feature roughness conditions at the sampling locations in the Christie Lake catchment were highly variable ranging from minimal to extreme.
Figure 114 Headwater feature roughness in the Christie Lake catchment
Land cover and any change in coverage that has occurred over a six year period is summarized for the Chrisitie Lake catchment using spatially continuous vector data representing the catchment during the spring of 2008 and 2014. This dataset was developed by the RVCA through heads-up digitization of 20cm DRAPE ortho-imagery at a 1:4000 scale and details the surrounding landscape using 10 land cover classes.
4.1 Christie LakeCatchment Land Cover/Change
As shown in Table 31 and Figure 1, the dominant land cover type in 2014 is woodland.
Table 31 Land cover in the Christie Lake catchment (2008 vs. 2014)
Land Cover
2008
2014
Change - 2008 to 2014
Area
Area
Area
Ha
Percent
Ha
Percent
Ha
Percent
Woodland*
3699
57
3697
57
-2
Water
1109
17
1109
17
Wetland **
904
14
905
14
1
>Evaluated
(120)
(2)
(120)
(2)
(0)
(0)
>Unevaluated
(784)
(12)
(785)
(12)
(1)
(0)
Crop and Pasture
296
4
295
4
-1
Transportation
193
3
193
3
Meadow-Thicket
168
3
168
3
Settlement
153
2
155
2
2
Aggregate
11
<1
11
<1
* Does not include treed swamps ** Includes treed swamps
From 2008 to 2014, there was an overall change of four hectares (from one land cover class to another). Most of the change in the Christie Lake catchment is a result of crop and pastureland and woodland being converted to settlement along with woodland reverting to wetland (Figure 115).
Figure 115 Land cover change in the Christie Lake catchment (2008 to 2014)
Table 32 provides a detailed breakdown of all land cover change that has taken place in the Christie Lake catchment between 2008 and 2014.
Table 32 Land cover change in the Christie Lake catchment (2008 to 2014)
Land Cover
Change - 2008 to 2014
Area
Ha.
Percent
Woodland to Settlement
1
26.4
Crop and Pasture to Settlement
0.8
21.1
Woodland to Unevaluated Wetland
0.5
13.8
Woodland to Crop and Pasture
0.4
11.1
Crop and Pasture to Unevaluated Wetland
0.3
9.7
Unevaluated Wetland to Settlement
0.2
5.9
Meadow-Thicket to Unevaluated Wetland
0.2
5.7
Woodland to Transportation
0.2
5.4
Unevaluated Wetland to Transportation
<0.1
0.9
4.2 Woodland Cover
In the Environment Canada Guideline (Third Edition) entitled “How Much Habitat Is Enough?” (hereafter referred to as the “Guideline”) the opening narrative under the Forest Habitat Guidelines section states that prior to European settlement, forest was the predominant habitat in the Mixedwood Plains ecozone. The remnants of this once vast forest now exist in a fragmented state in many areas (including the Rideau Valley watershed) with woodland patches of various sizes distributed across the settled landscape along with higher levels of forest cover associated with features such as the Frontenac Axis (within the on-Shield areas of the Rideau Lakes and Tay River subwatersheds). The forest legacy, in terms of the many types of wildlife species found, overall species richness, ecological functions provided and ecosystem complexity is still evident in the patches and regional forest matrices (found in the Tay River subwatershed and elsewhere in the Rideau Valley watershed). These ecological features are in addition to other influences which forests have on water quality and stream hydrology including reducing soil erosion, producing oxygen, storing carbon along with many other ecological services that are essential not only for wildlife but for human well-being.
The Guideline also notes that forests provide a great many habitat niches that are in turn occupied by a great diversity of plant and animal species. They provide food, water and shelter for these species - whether they are breeding and resident locally or using forest cover to help them move across the landscape. This diversity of species includes many that are considered to be species at risk. Furthermore, from a wildlife perspective, there is increasing evidence that the total forest cover in a given area is a major predictor of the persistence and size of bird populations, and it is possible or perhaps likely that this pattern extends to other flora and fauna groups. The overall effect of a decrease in forest cover on birds in fragmented landscapes is that certain species disappear and many of the remaining ones become rare, or fail to reproduce, while species adapted to more open and successional habitats, as well as those that are more tolerant to human-induced disturbances in general, are able to persist and in some cases thrive. Species with specialized-habitat requirements are most likely to be adversely affected. The overall pattern of distribution of forest cover, the shape, area and juxtaposition of remaining forest patches and the quality of forest cover also play major roles in determining how valuable forests will be to wildlife and people alike.
The current science generally supports minimum forest habitat requirements between 30 and 50 percent, with some limited evidence that the upper limit may be even higher, depending on the organism/species phenomenon under investigation or land-use/resource management planning regime being considered/used.
As shown in Figure 116, 57 percent of the Christie Lake catchment contains 3697 hectares of upland forest and 35 hectares of lowland forest (treed swamps) versus the 47 percent of woodland cover in the Tay River subwatershed. This is greater than the 30 percent of forest cover that is identified as the minimum threshold required to sustain forest birds according to the Guideline and which may only support less than one half of potential species richness and marginally healthy aquatic systems. When forest cover drops below 30 percent, forest birds tend to disappear as breeders across the landscape.
Figure 116 Woodland cover and forest interior in the Christie Lake catchment (2014)
4.2.1 Woodland (Patch) Size
According to the Ministry of Natural Resources’ Natural Heritage Reference Manual (Second Edition), larger woodlands are more likely to contain a greater diversity of plant and animal species and communities than smaller woodlands and have a greater relative importance for mobile animal species such as forest birds.
Bigger forests often provide a different type of habitat. Many forest birds breed far more successfully in larger forests than they do in smaller woodlots and some rely heavily on forest interior conditions. Populations are often healthier in regions with more forest cover and where forest fragments are grouped closely together or connected by corridors of natural habitat. Small forests support small numbers of wildlife. Some species are “area-sensitive” and tend not to inhabit small woodlands, regardless of forest interior conditions. Fragmented habitat also isolates local populations, especially small mammals, amphibians and reptiles with limited mobility. This reduces the healthy mixing of genetic traits that helps populations survive over the long run (Conserving the Forest Interior. Ontario Extension Notes, 2000).
The Environment Canada Guideline also notes that for forest plants that do not disperse broadly or quickly, preservation of some relatively undisturbed large forest patches is needed to sustain them because of their restricted dispersal abilities and specialized habitat requirements and to ensure continued seed or propagation sources for restored or regenerating areas nearby.
The Natural Heritage Reference Manual continues by stating that a larger size also allows woodlands to support more resilient nutrient cycles and food webs and to be big enough to permit different and important successional stages to co-exist. Small, isolated woodlands are more susceptible to the effects of blowdown, drought, disease, insect infestations, and invasions by predators and non-indigenous plants. It is also known that the viability of woodland wildlife depends not only on the characteristics of the woodland in which they reside, but also on the characteristics of the surrounding landscape where the woodland is situated. Additionally, the percentage of forest cover in the surrounding landscape, the presence of ecological barriers such as roads, the ability of various species to cross the matrix surrounding the woodland and the proximity of adjacent habitats interact with woodland size in influencing the species assemblage within a woodland.
In the Christie Lake catchment (in 2014), one hundred and fifty-six (56 percent) of the 281 woodland patches are very small, being less than one hectare in size. Another 103 (37 percent) of the woodland patches ranging from one to less than 20 hectares in size tend to be dominated by edge-tolerant bird species. The remaining 22 (seven percent of) woodland patches range between 20 and 1458 hectares in size. Sixteen of these patches contain woodland between 20 and 100 hectares and may support a few area-sensitive species and some edge intolerant species, but will be dominated by edge tolerant species.
Conversely, six (two percent) of the 281 woodland patches in the drainage area exceed the 100 plus hectare size needed to support most forest dependent, area sensitive birds and are large enough to support approximately 60 percent of edge-intolerant species. Three patches top 200 hectares, which according to the Environment Canada Guideline will support 80 percent of edge-intolerant forest bird species (including most area sensitive species) that prefer interior forest habitat conditions.
Table 33 presents a comparison of woodland patch size in 2008 and 2014 along with any changes that have occurred over that time. A small decrease (of three hectares) has been observed in the overall woodland patch area between the two reporting periods with most change occurring in the 20 to 50 woodland patch size class range.
Table 33 Woodland patches in the Christie Lake catchment (2008 and 2014)
Woodland Patch Size Range (ha)
Woodland* Patches
Patch Change
2008
2014
2008 to 2014
Number
Area
Number
Area
Number
Area
Count
Percent
Ha
Percent
Count
Percent
Ha
Percent
Count
Ha
Less than 1
153
56
49
2
156
56
49
1
3
1 to 20
99
36
533
14
103
37
554
15
4
21
20 to 50
13
5
382
10
12
4
360
10
-1
-22
50 to 100
4
1
305
8
4
1
304
8
-1
100 to 200
3
1
454
12
3
1
454
12
Greater than 200
3
1
2012
54
3
1
2011
54
-1
Totals
275
100
3735
100
281
100
3732
100
6
-3
*Includes treed swamps
4.2.2 Woodland (Forest) Interior Habitat
The forest interior is habitat deep within woodlands. It is a sheltered, secluded environment away from the influence of forest edges and open habitats. Some people call it the “core” or the “heart” of a woodland. The presence of forest interior is a good sign of woodland health, and is directly related to the woodland’s size and shape. Large woodlands with round or square outlines have the greatest amount of forest interior. Small, narrow woodlands may have no forest interior conditions at all. Forest interior habitat is a remnant natural environment, reminiscent of the extensive, continuous forests of the past. This increasingly rare forest habitat is now a refuge for certain forest-dependent wildlife; they simply must have it to survive and thrive in a fragmented forest landscape (Conserving the Forest Interior. Ontario Extension Notes, 2000).
The Natural Heritage Reference Manual states that woodland interior habitat is usually defined as habitat more than 100 metres from the edge of the woodland and provides for relative seclusion from outside influences along with a moister, more sheltered and productive forest habitat for certain area sensitive species. Woodlands with interior habitat have centres that are more clearly buffered against the edge effects of agricultural activities or more harmful urban activities than those without.
In the Christie Lake catchment (in 2014), the 281 woodland patches contain 37 forest interior patches (Figure 47) that occupy seven percent (469 ha.) of the catchment land area (which is greater than the five percent of interior forest in the Tay River Subwatershed). This is below the ten percent figure referred to in the Environment Canada Guideline that is considered to be the minimum threshold for supporting edge intolerant bird species and other forest dwelling species in the landscape.
Most patches (30) have less than 10 hectares of interior forest, seventeen of which have small areas of interior forest habitat less than one hectare in size. The remaining seven patches contain interior forest between 10 and 127 hectares in area. Between 2008 and 2014, there was no change in the number of woodland patches containing interior habitat (Table 34).
Table 34 Woodland interior in the Christie Lake catchment (2008 and 2014)
Woodland Interior Habitat Size Range (ha)
Woodland Interior
Interior Change
2008
2014
2008 to 2014
Number
Area
Number
Area
Number
Area
Count
Percent
Ha
Percent
Count
Percent
Ha
Percent
Count
Ha
Less than 1
17
46
4
1
17
46
4
1
1 to 10
13
35
57
12
13
35
57
12
10 to 30
3
8
56
12
3
8
56
12
30 to 50
1
3
40
8
1
3
40
8
50 to 100
2
5
135
29
2
5
135
29
Greater than 100
1
3
177
38
1
3
177
38
Totals
37
100
469
100
37
100
469
100
4.3 Wetland Cover
Wetlands are habitats forming the interface between aquatic and terrestrial systems. They are among the most productive and biologically diverse habitats on the planet. By the 1980s, according to the Natural Heritage Reference Manual, 68 percent of the original wetlands south of the Precambrian Shield in Ontario had been lost through encroachment, land clearance, drainage and filling.
Wetlands perform a number of important ecological and hydrological functions and provide an array of social and economic benefits that society values. Maintaining wetland cover in a watershed provides many ecological, economic, hydrological and social benefits that are listed in the Reference Manual and which may include:
contributing to the stabilization of shorelines and to the reduction of erosion damage through the mitigation of water flow and soil binding by plant roots
mitigating surface water flow by storing water during periods of peak flow (such as spring snowmelt and heavy rainfall events) and releasing water during periods of low flow (this mitigation of water flow also contributes to a reduction of flood damage)
contributing to an improved water quality through the trapping of sediments, the removal and/or retention of excess nutrients, the immobilization and/or degradation of contaminants and the removal of bacteria
providing renewable harvesting of timber, fuel wood, fish, wildlife and wild rice
contributing to a stable, long-term water supply in areas of groundwater recharge and discharge
providing a high diversity of habitats that support a wide variety of plants and animals
acting as “carbon sinks” making a significant contribution to carbon storage
providing opportunities for recreation, education, research and tourism
Historically, the overall wetland coverage within the Great Lakes basin exceeded 10 percent, but there was significant variability among watersheds and jurisdictions, as stated in the Environment Canada Guideline. In the Rideau Valley Watershed, it has been estimated that pre-settlement wetland cover averaged 35 percent using information provided by Ducks Unlimited Canada (2010) versus the 21 percent of wetland cover existing in 2014 derived from DRAPE imagery analysis.
Figure 117 Wetland cover in the Christie Lake catchment (2014)
A less severe decline in wetland cover is evident in the Christie Lake catchment (as seen in Figure 117 and summarized in Table 35), where wetland was reported to cover 15 percent of the area prior to settlement, as compared to 14 percent in 2014. This represents a four percent loss of historic wetland cover. To maintain critical hydrological, ecological functions along with related recreational and economic benefits provided by these wetland habitats in the catchment, a “no net loss” of currently existing wetlands should be employed to ensure the continued provision of tangible benefits accruing from them to landowners and surrounding communities.
Table 35 Wetland cover in the Christie Lake catchment (Historic to 2014)
Wetland Cover
Pre-settlement
2008
2014
Change - Historic to 2014
Area
Area
Area
Area
Ha
Percent
Ha
Percent
Ha
Percent
Ha
Percent
Christie Lake
943
15
904
14
905
14
-38
-4
Tay River
n/a
n/a
15280
19
15330
19
n/a
n/a
Rideau Valley
134115
35
n/a
n/a
82076
21
-52039
-39
4.4 Shoreline Cover
The riparian or shoreline zone is that special area where the land meets the water. Well-vegetated shorelines are critically important in protecting water quality and creating healthy aquatic habitats, lakes and rivers. Natural shorelines intercept sediments and contaminants that could impact water quality conditions and harm fish habitat in streams. Well established buffers protect the banks against erosion, improve habitat for fish by shading and cooling the water and provide protection for birds and other wildlife that feed and rear young near water. A recommended target (from the Environment Canada Guideline) is to maintain a minimum 30 metre wide vegetated buffer along at least 75 percent of the length of both sides of rivers, creeks and streams.
Figure 118 shows the extent of the ‘Natural’ vegetated riparian zone (predominantly wetland/woodland features) and ‘Other’ anthropogenic cover (crop/pastureland, roads/railways, settlements) along a 30-metre-wide area of land around Christie, Davern, Farren, Little Silver, O'Brien and Rainbow Lakes and along both sides of the shoreline of the Tay River and the many unnamed watercourses (including headwater streams) found in the Christie Lake catchment.
Figure 118 Natural and other riparian land cover in the Christie Lake catchment (2014)
This analysis shows that the Christie Lake catchment riparian buffer is composed of woodland (59 percent), wetland (31 percent), settlement areas (four percent), crop and pastureland (two percent), roads (two percent), meadow-thicket (two percent) and aggregates (less than one percent). Along the many watercourses (including headwater streams) flowing into Christie, Davern, Farren, Little Silver, O'Brien, Rainbow Lakes and the Tay River, the riparian buffer is composed of woodland (57 percent), wetland (37 percent), crop and pastureland (two percent), meadow-thicket (two percent), roads (two percent), settlement areas and aggregates (less than one percent).
Around Christie Lake itself, the shoreline buffer is dominated by woodland (63 percent) and cottages, houses and camps (27 percent) with the remainder comprised of wetland (five percent) and roads (five percent). Similarly, the shoreline buffer around Farren Lake is dominated by woodland (66 percent) and cottages and houses (31 percent) with the remainder comprised of roads (two percent) and wetland (one percent). Around Little Silver Lake, shoreline is dominated by woodland (81 percent) and cottages and houses (13 percent) with the remainder comprised of wetland (four percent) and roads (two percent). Around O'Brien Lake, the shoreline buffer is dominated by woodland (81 percent) and cottages and houses (12 percent) with the remainder comprised of wetland (five percent), roads (one percent) and meadow-thicket (less than one percent). Around Rainbow Lake, the shoreline buffer is dominated by woodland (80 percent) with the remainder comprised of cottages and houses (11 percent) and wetland (nine percent). Around Davern Lake, the shoreline buffer is dominated by woodland (63 percent) and wetland (29 percent) with the remainder comprised of cottages and houses (seven percent) and roads (one percent). Along the two reaches of the Tay River flowing through the catchment, the riparain zone is comprised of wetland (55 percent), woodland (25 percent), crop and pastureland (11 percent), settlement (five percent), roads (two percent) and aggregates (two percent).
Additional statistics for the Christie Lake catchment are presented in Tables 36 to 45 and show that there has been very little to no change in shoreline cover from 2008 to 2014.
Table 36 Riparian land cover in the Christie Lake catchment (2008 vs. 2014)
Riparian Land Cover
2008
2014
Change - 2008 to 2014
Area
Area
Area
Ha.
Percent
Ha.
Percent
Ha.
Percent
Woodland
703.48
59.25
703.09
59.22
-0.39
-0.03
Wetland
364.71
30.72
364.91
30.74
0.20
0.02
> Unevaluated
(329.71)
(27.77)
(329.91)
(27.79)
(0.20)
(0.02)
> Evaluated
(35.00)
(2.95)
(35.00)
(2.95)
(0.00)
(0.00)
Settlement
48.99
4.13
49.34
4.16
0.35
0.03
Crop & Pasture
26.12
2.20
25.82
2.17
-0.30
-0.03
Transportation
23.16
1.95
23.29
1.96
0.13
0.01
Meadow-Thicket
19.79
1.67
19.79
1.67
0.00
0.00
Aggregates
0.98
0.08
0.98
0.08
0.00
0.00
Table 37 Riparian land cover around Christie Lake (2008 vs. 2014)
Riparian Land Cover
2008
2014
Change - 2008 to 2014
Area
Area
Area
Ha.
Percent
Ha.
Percent
Ha.
Percent
Woodland
53.64
63.17
53.49
63.00
-0.15
-0.17
Settlement
22.75
26.8
22.86
26.93
0.11
0.13
Wetland
4.53
5.34
4.56
5.38
0.03
0.04
> Unevaluated
(4.27)
(5.03)
(4.30)
(5.07)
(0.03)
(0.04)
> Evaluated
(0.26)
(0.31)
(0.26)
(0.31)
(0.00)
(0.00)
Transportation
3.98
4.69
3.98
4.69
0.00
0.00
Table 38 Riparian land cover around Davern Lake (2008 vs. 2014)
Riparian Land Cover
2008
2014
Change - 2008 to 2014
Area
Area
Area
Ha.
Percent
Ha.
Percent
Ha.
Percent
Woodland
8.55
62.57
8.55
62.57
0.00
0.00
Wetland
3.98
29.17
3.98
29.17
0.00
0.00
> Unevaluated
(3.98)
(29.17)
(3.98)
(29.17)
(0.00)
(0.00)
Settlement
1.01
7.41
1.01
7.41
0.00
0.00
Transportation
0.11
0.85
0.11
0.85
0.00
0.00
Table 39 Riparian land cover around Farren Lake (2008 vs. 2014)
Riparian Land Cover
2008
2014
Change - 2008 to 2014
Area
Area
Area
Ha.
Percent
Ha.
Percent
Ha.
Percent
Woodland
20.52
66.12
20.48
65.97
-0.04
-0.15
Settlement
9.41
30.31
9.45
30.46
0.04
0.15
Wetland
0.44
1.44
0.44
1.44
0.00
0.00
> Unevaluated
(0.44)
(1.44)
(0.44)
(1.44)
(0.00)
(0.00)
Transportation
0.65
2.12
0.65
2.12
0.00
0.00
Table 40 Riparian land cover around Little Silver Lake (2008 vs. 2014)
Riparian Land Cover
2008
2014
Change - 2008 to 2014
Area
Area
Area
Ha.
Percent
Ha.
Percent
Ha.
Percent
Woodland
25.07
80.96
25.07
80.96
0.00
0.00
Settlement
4.01
12.96
4.01
12.96
0.00
0.00
Wetland
1.39
4.52
1.39
4.52
0.00
0.00
> Unevaluated
(1.39)
(4.52)
(1.39)
(4.52)
(0.00)
(0.00)
Transportation
0.48
1.57
0.48
1.57
0.00
0.00
Table 41 Riparian land cover around O'Brien Lake (2008 vs. 2014)
Riparian Land Cover
2008
2014
Change - 2008 to 2014
Area
Area
Area
Ha.
Percent
Ha.
Percent
Ha.
Percent
Woodland
18.34
81.12
18.34
81.12
0.00
0.00
Settlement
2.77
12.28
2.77
12.28
0.00
0.00
Wetland
1.14
5.05
1.14
5.05
0.00
0.00
> Unevaluated
(1.14)
(5.05)
(1.14)
(5.05)
(0.00)
(0.00)
Transportation
0.29
1.31
0.29
1.31
0.00
0.00
Meadow-Thicket
0.05
0.24
0.05
0.24
0.00
0.00
Table 42 Riparian land cover around Rainbow Lake (2008 vs. 2014)
Riparian Land Cover
2008
2014
Change - 2008 to 2014
Area
Area
Area
Ha.
Percent
Ha.
Percent
Ha.
Percent
Woodland
7.73
80.04
7.73
80.04
0.00
0.00
Settlement
1.05
10.96
1.05
10.96
0.00
0.00
Wetland
0.86
9.00
0.86
9.00
0.00
0.00
> Unevaluated
(0.86)
(9.00)
(0.86)
(9.00)
(0.00)
(0.00)
Table 43 Riparian land cover along the Tay River in the Christie Lake catchment (2008 vs. 2014)
Riparian Land Cover
2008
2014
Change - 2008 to 2014
Area
Area
Area
Ha.
Percent
Ha.
Percent
Ha.
Percent
Wetland
26.28
55.24
26.28
55.24
0.00
0.00
> Unevaluated
(6.30)
(13.24)
(6.30)
(13.24)
(0.00)
(0.00)
> Evaluated
(19.98)
(42.00)
(19.98)
(42.00)
(0.00)
(0.00)
Woodland
11.92
25.06
11.92
25.06
0.00
0.00
Crop and Pasture
5.05
10.62
5.05
10.62
0.00
0.00
Settlement
2.24
4.71
2.24
4.71
0.00
0.00
Transportation
1.18
2.50
1.18
2.50
0.00
0.00
Aggregate
0.88
1.86
0.88
1.86
0.00
0.00
Table 44 Riparian land cover along Davern Creek in the Christie Lake catchment (2008 vs. 2014)
Riparian Land Cover
2008
2014
Change - 2008 to 2014
Area
Area
Area
Ha.
Percent
Ha.
Percent
Ha.
Percent
Wetland
29.17
67.49
29.17
67.49
0.00
0.00
> Unevaluated
(29.17)
(67.49)
(29.17)
67.49
0.00
0.00
Woodland
11.75
27.19
11.75
27.19
0.00
0.00
Crop and Pasture
1.04
2.41
1.04
2.41
0.00
0.00
Transportation
0.74
1.73
0.74
1.73
0.00
0.00
Meadow-Thicket
0.47
1.11
0.47
1.11
0.00
0.00
Settlement
0.03
0.07
0.03
0.07
0.00
0.00
Table 45 Riparian land cover along streams in the Christie Lake Catchment (2008 vs. 2014)
5.0 Christie Lake Catchment: Stewardship and Water Resources Protection
The RVCA and its partners are working to protect and enhance environmental conditions in the Tay River Watershed. Figure 119 shows the location of all stewardship projects completed in the Christie Lake catchment.
Figure 119 Stewardship site locations in the Christie Lake catchment
5.1 Rural Clean Water
The Rural Clean Water Program provides technical and financial assistance to farmers and other rural landowners, to aid in the implementation of projects that protect water quality. Funding is granted to those projects that support best management practices for application in the protection and improvement of surface and ground water resources. The program also supports climate change adaptation and low impact development projects as well as educating rural landowners about environmental stewardship of private property. Examples of supported projects include livestock exclusion fencing, controlled tile drainage, cover crops, erosion control, well related projects, and many more. For a list of eligible projects and to apply for funding, see Rural Clean Water.
In the Christie Lake catchment from 2011 to 2016, six septic system repairs, one well upgrade, one well decommissioning and one livestock fencing project were completed; prior to this, four septic system repairs, one well decommissioning, one well replacement and one well upgrade had been completed. When combined, these projects are keeping 46.77 kilograms of Phosphorus out of our lakes, rivers and streams every year. Total value of all 16 projects is $121,097 with $16,781 of that amount funded through grant dollars from the RVCA.
5.2 Private Land Forestry
Forest cover and tree planting continues to be one of the most widely supported strategies to improve our environment. The many benefits of forest cover include carbon sequestration, flood mitigation and water quality improvement as well as providing wildlife habitat.
Through the RVCA's Trees for Tomorrow Program (and its predecessors), 10,550 trees were planted at two sites from 2011 to 2016; prior to this, 1,000 trees were planted at one other site. In total, 11,550 trees have been planted resulting in the reforestation of six hectares. Total project value of all three projects in the Christie Lake catchment is $23,189 with $18,786 of that amount coming from fundraising sources. For more information about the Program and landowner eligibility, please see the following: Tree Planting in the Rideau Valley Watershed and Trees for Tomorrow.
An additional 20 butternut trees were planted through the RVCA Butternut Recovery Program as part of efforts to introduce healthy seedlings from tolerant butternuts into various locations across Eastern Ontario.
5.3 Shoreline Naturalization
Natural shoreline buffers rich in native plants are critically important to protecting the health of our lakes, rivers and streams. Shoreline vegetation protects water quality and aquatic habitat by intercepting potentially harmful contaminants such as nutrients, pollutants and sediment, regulating water temperatures, slowing runoff and providing important fish and wildlife habitat. Natural shorelines also help improve climate change resiliency by increasing flood storage and providing protection from erosion during extreme weather events.
Though the RVCA’s Shoreline Naturalization Program, landowners (private and public property owners) have naturalized more than 2.3 km of shoreline in the Tay Watershed by planting over 10,563 native trees and shrubs at 96 sites since 2008. The total value of these projects is $126,000.
In the Chrisite Lake catchment, a total of 1,669 native trees and shrubs have been planted along 582 metres of shoreline at an average buffer width of three metres for a total project value of $28,794.
A number of these projects have been undertaken in partnership with community groups. In 2009 and 2010, the RVCA partnered with the Christie Lake Association to distribute 500 native tree, shrubs and wildflowers to property owners around Christie Lake. In 2014 and 2015, a shoreline restoration project was completed at Camp Opemikon with volunteer assistance from Scouts Canada. Site conditions before and after planting are shown in the photos below.
Camp Opimekon shoreline preparation, before planting
Camp Opimekon naturalized shoreline, after planting
5.4 Fish Habitat Improvement
Since 2013, the Christie Lake Association (CLA) has been placing artificial fish habitat along selected shorelines around Christie Lake. Often referred to as a “Fishsticks” program, it involves the placement of submerged trees along inactive or remote shorelines to provide enhanced aquatic habitat for a variety of fish species as well as other invertebrates, amphibians and reptiles. Trees that have fallen or were cut down by their owners are floated to secluded locations around the lake and anchored to rocks or trees on the shore. These trees slowly submerge to form great subsurface habitats.
In the summer and fall of 2015, the CLA began another fish habitat project to construct “Brushbundles” which are assembled and secured with wire or cable and then anchored and submerged on the bottom of the lake in areas deeper than five meters. The idea is to provide improved fish habitat, in particular a place for young-of–the-year to hang out and avoid predators, similar to the "Fishsticks" initiative. This work was carried out by keen volunteers from around Christie Lake and Venturer Scouts from Camp Opemikon. On five separate occasions, volunteers deployed bundles at 15 locations, mostly in the north and west sectors of the lake (Figure 120). Financial assistance to buy supplies was secured through a Fisheries and Oceans grant submitted in partnership with the Lanark County Stewardship Council, Watersheds Canada and the Rideau Valley Conservation Authority. A "Brushbundles" post effectiveness monitoring video was filmed by the RVCA on June 9, 2017 and shows the diversity of underwater flora and fauna resulting from the project.
Since 2004, the service has performed 510 mandatory and voluntary septic system re-inspections in the Christie Lake catchment.
Of the 342 re-inspections performed on Christie and Farren Lakes and 126 re-inspections conducted on Little Silver and Rainbow Lakes, remedial/maintenance work (i.e. pump outs and baffle replacements that generally do not require a permit) was advocated for 126 septic systems, septic system replacements required at another nine properties along with 15 additional landowners requesting more information about their septic systems.
Another 42 re-inspections were carried out on Davern and O'Brien Lakes as well as on properties along the Tay River. Three septic systems required remedial/maintenance work, three more landowners needed information about their septic systems and none of the inspections identified the need to replace any of the existing systems.
5.6 Valley, Stream, Wetland and Hazard Lands
The Christie Lake catchment covers 65.3 square kilometres with 0.5 square kilometres (or 0.8 percent) of the drainage area being within the regulation limit of Ontario Regulation 174/06 (Figure 121), giving protection to wetland areas and river or stream valleys that are affected by flooding and erosion hazards.
Wetlands occupy nine square kilometres (or 13.7 percent) of the catchment. Of these wetlands, 1.2 square kilometres (or 13 percent) are designated as provincially significant (Christie Lake Wetland) and not included within the RVCA regulation limit. All wetlands in the catchment are outside the regulated area limit administered by the Rideau Valley Conservation Authority..
Of the 194 kilometres of stream in the catchment, regulation limit mapping has been plotted along 1.5 kilometers of streams (representing less than one percent of all streams in the catchment). Plotting of the regulation limit on the remaining 92.5 kilometres (or 99 percent) of streams requires identification of flood and erosion hazards and valley systems.
Within those areas of the Christie Lake catchment subject to the regulation (limit), efforts (have been made and) continue through RVCA planning and regulations input and review to manage the impact of development (and other land management practices) in areas where “natural hazards” are associated with rivers, streams, valley lands and wetlands. For areas beyond the regulation limit, protection of the catchment’s watercourses is only provided through the “alteration to waterways” provision of the regulation.
Figure 121 Regulated natural features and hazards in the Christie Lake catchment
5.7 Vulnerable Drinking Water Areas
Mississippi-Rideau Source Water Protection Program has mapped only two small areas of the Christie Lake catchment as a Significant Groundwater Recharge Areas and all of the catchment as a Highly Vulnerable Aquifer. This means that the nature of the overburden (thin soils, fractured bedrock) does not provide a high level of protection for the underlying groundwater making the aquifer more vulnerable to contaminants released on the surface. There are no Well-Head Protection Areas in the catchment.
The Mississippi-Rideau Source Protection Plan includes policies that focus on the protection of groundwater region-wide due to the fact that most of the region, which encompasses the Mississippi and Rideau watersheds, is considered Highly Vulnerable Aquifer. For detailed maps and policies that have been developed to protect drinking water sources, visit the Mississippi-Rideau Source Protection Region website.
Developed by the Christie Lake Association, the Farren Lake Property Owners' Association and the Little Silver and Rainbow Lakes Property Owners' Association and their partners, the Christie Lake State of the Lake Report (2009), 2011 Lake Stewardship Guideline (2011) and Christie Lake Brochure (a planned 5 year update of the Lake Stewardship Guide), Farren Lake State of the Lake Report (2009) and Little Silver and Rainbow Lake Stewardship Plan (2018) provide information on many aspects of the lake environment, as well as issues of concern and actions to be taken to maintain and improve the long-term health of the lake. The following list includes some of the accomplishments of the Christie Lake, Farren Lake, Little Silver-Rainbow Lake Associations and residents that have implications for the well-being of the land and water resources of the lake ecosystem. Specific achievements of the Christie, Farren, Little Silver-Rainbow and O'Brien Lake communities are indicated by an asterisk.
Christie Lake and Catchment Health
Septic Inspections
Mandatory septic system inspections for properties on Little Silver and Rainbow Lakes were approved by the Little Silver and Rainbow Lakes Property Owners Association at the 2016 AGM.*
Farren Lake properties are subject to a total septic system inspection of every home/cottage.*
510 septic system re-inspections have been conducted by the Mississippi Rideau Septic System Office as a service provided to Tay Valley Township.
Shoreline Planting
Christie Lake Association has and continues to encourage shoreline naturalization and the re-planting of shorelands with native species. Working with the RVCA and Watersheds Canada, complimentary native plants have been provided at events around Christie Lake such as the Welcome Back Wine and Cheese event and the CLA Annual General Meeting.*
1,669 native trees and shrubs have been planted at 20 project sites in the catchment by the RVCA’s Shoreline Naturalization Program at an average buffer width of three metres along 582 metres of shoreline.
Tree Planting
11,550 trees have been planted at three sites in the Christie Lake catchment by the RVCA Private Land Forestry Program, resulting in the reforestation of six hectares.
Water Levels
Christie Lake Association established a Water Level Committee in the Fall of 2017 - in the aftermath of the severe flooding experienced by Christie Lake residents during the summer of 2017 - to investigate fluctuating water levels on Christie Lake and liaise with agencies responsible for water level management and flood forecasting and warning along the Tay River.*
Water Quality
Water testing on Christie Lake in cooperation with RVCA has been ongoing for many years. Lake residents have assisted RVCA scientists by providing boats to facilitate sampling. Water sampling of inlet streams and creeks around Christie Lake and sampling for total phosphorous was conducted from 2004 until 2014 to assess influent quality.*
Sharing of water quality reports occurs between residents of O'Brien Lake.*
An interim control bylaw has been passed by Tay Valley Township putting a hold on development until a lake capacity study or other measures can be taken to address the factors contributng to the reported water quality on Farren Lake. The Township Council has been most co-operative on this and every other issue regarding water quality issues in Farren Lake.*
One Ontario Benthic Biomonitoring Network site is sampled yearly on the Tay River in the catchment with three replicates, monitored by the RVCA to assess instream biological water quality conditions.
Nine Rural Clean Water Program projects were completed by the RVCA.
Christie Lake, Davern Lake, Farren Lake, Little Silver Lake, O'Brien Lake and Rainbow Lake are each sampled by the RVCA for five parameters, four times a year along with one stream sampling site on the Tay River being sampled for 22 parameters, six times a year to assess surface chemistry water quality conditions.
Christie Lake and Catchment Habitat
Crown-owned Islands
Christie Lake Association worked with MNR to identify Crown-owned islands on the lake and post signs encouraging visitors to treat the islands with respect by applying good stewardship practices when using them.*
Fish and In-stream Habitat
Christie Lake Association has been placing artificial fish habitat along selected shorelines around Christie Lake since 2013. The Fishsticks program involves the placement of submerged trees along the shoreline of Christie Lake to provide enhanced aquatic habitat for a variety of fish species, as well as other invertebrates, amphibians and reptiles. Monitoring of the Fishsticks program's success was conducted by the RVCA in June of 2017 with underwater photos showing that the installed woody brush bundles are providing excellent fish habitat (see Section 5.4).*
5.2 kilometres of the Tay River in the catchment has been surveyed and 29 headwaters sites were sampled by the RVCA Stream Characterization Program.
Invasive Species
Invasive Species Testing Program has occurred on Christie and Little Silver and Rainbow Lakes in partnership with Ontario Federation of Anglers and Hunters.*
Ongoing exchange of invasive species information takes place between residents on O'Brien Lake.*
Loon Survey
Tracking of loons has been ongoing for years on portions of Christie Lake with enhancements in lake coverage having been undertaken over the last two years. This is part of attempts to raise Loon Awareness by enlisting volunteers to track loons and nesting success via the Canadian Lakes Loon Survey coordinated by Bird Studies Canada.*
Wetland Protection
Efforts by the Christie Lake Association and residents led to the re-designation of the Christie Lake Wetland from locally significant to provincially significant and mapping of its land-use status in the Tay Valley Township Official Plan (2016).
Lake Association Leadership
Lake Planning
The Farren Lake Property Owners' Association has been a key player in efforts to have all septic systems around Farren Lake inspected for operational deficiences. It has also been instrumental in convincing the Council of Tay Valley Township to restict future development on the lake until the water quality problem can be addressed.
The Christie Lake Association, the Farren Lake Property Owners' Association and the Little Silver and Rainbow Lakes Property Owners Association and their partners have been instrumental in preparing the following resource management plans to guide lake community activities: the Christie Lake State of the Lake Report (2009), Christie Lake Stewardship Guideline (2011) and 2015 Christie Lake Brochure (a planned 5 year update of the Lake Stewardship Guideline), Farren Lake State of the Lake Report (2009) and Little Silver and Rainbow Lake Stewardship Plan (2018).
Developed by the Christie Lake Association, the Farren Lake Property Owners' Association and the Little Silver and Rainbow Lakes Property Owners Association and their partners, the Christie Lake State of the Lake Report (2009), Christie Lake Stewardship Guideline (2011) and 2015 Christie Lake Brochure (a planned 5 year update of the Lake Stewardship Guide), Farren Lake State of the Lake Report (2009) and Little Silver and Rainbow Lake Stewardship Plan (2018) provide information on many aspects of the lake environment, as well as issues of concern identified by the lake community that could threaten the long-term health of the lake. The following list includes some of those identified issues that have implications for the water and land resources of the lake ecosystem. Specific issues noted by the lake community are indicated by an asterisk.
Development
Waterfront property development is occurring primarily through the transformation of traditional, seasonal cottages into larger year-round dwellings. This transition is taking place either through re-development of an existing cottage lot or incremental alterations (additions, sleeping cabins, gazebos, decks, sheds, boat houses, garages, lawns, docks), all of which may put additional stress on the protective, shoreline zone around the lake along with potential, added septic system loading.Theseconcerns have been noted on Farren and O'Brien Lakes with the conversion of cottages to homes and the lack of appropriate development setbacks from the lake.*
Many waterfront properties contain existing non-complying dwellings with respect to minimum water frontage and lot area and are often located within 30 metres of the water that require minor variances for expansion and/or reconstruction of dwellings where standard development setbacks from water are difficult to achieve. In these cases, of which there are many, staff at Tay Valley Township and the Conservation Authority often meet with resistance and push back when attempts are made to implement standards for development setbacks, vegetated shorelines and septic systems.
Monitoring implementation of conditions of planning and regulatory approvals is challenging due to a lack of resources.
Headwaters/In-water Habitat/Shorelines
Invasive species monitoring on Little Silver and Rainbow Lakes identified an incidence of zebra mussels in 2016.*
Major concern about the introduction of zebra mussels and eurasian milfoil into O'Brien Lake. Both are found in Christie and Farren Lakes, The likelihood of their spread to O'Brien Lake is compounded by lake residents allowing lake visitors to launch their personal watercraft from private property.*
Address the effect of boating (i.e., Seadoos) on the natural environment of O'Brien Lake, which is too small for this type of watercraft.*
Christie Lake has 68 percent of its shoreline composed of natural vegetation. This is below the 75 percent target that is recommended by experts for the catchment’s waterbodies, 30 metres back from the shoreline of streams, rivers and lakes (see Section 4.4 of this report).
Farren Lake has 67 percent of its shoreline composed of natural vegetation. This is below the 75 percent target that is recommended by experts for the catchment’s waterbodies, 30 metres back from the shoreline of streams, rivers and lakes (see Section 4.4 of this report).
A small increase in the area of settlement and roads (0.48 ha.) along the shoreline of Christie Lake has been detected between 2008 and 2014, due primarily to a loss of woodland (see Section 4.4 of this report).
One of twenty-nine sampled headwater sites in the catchment has been modified (i.e., channelized)(see Section 3.4.2 of this report).
Littoral zone mapping identifying substrate type, vegetation and habitat features along with opportunities for shoreline enhancement is unavailable for Christie, Davern, Farren, Little Silver,O'Brien and Rainbow Lakes.
Lake Planning
The Christie Lake Association 2009 State of the Lake Report, 2011 Lake Stewardship Guideline (LSG) and 2015 Christie Lake Brochure (a planned 5 year update of the Lake Stewardship Guide) have been consistent in identification of the lake community's seven core issues. Water Quality has always been at the top of the list while others have changed in priority. The following priorities reflect those issues as identified by the lake community in 2015: 1) Water Quality 2) Wildlife Conservation 3) Building a Sense of Community 4) Fisheries 5) Watercraft Safety 6) Shoreline Naturalization and 7) Development Pressures.*
Land Cover
Land cover has changed across the catchment (2008 to 2014) as a result of an increase in the area of settlement (2 ha.) and wetland (1 ha.) and loss of woodland (2 ha.) and crop and pastureland (1 ha)(see Section 4.1 of this report for more information)(see Section 4.1 of this report).
Wetlands have declined by four percent since European pre-settlement and now cover 14 percent (905 ha.) of the catchment (in 2014). Eighty-seven percent (785 ha.) of these wetlands remain unevaluated and unregulated and although they are not under imminent threat from development activity, they do remain vulnerable to drainage and land clearing activities in the absence of any regulatory and planning controls that would otherwise protect them for the many important hydrological, social, biological and ecological functions/services/values they provide to landowners and the surrounding community (see Section 4.3 of this report).
Water Levels
Christie Lake Association needs confirmation of the 1:100 year flood level on Christie Lake.*
Fluctuating water levels remain an issue for Christie Lake residents. This has been linked to the operation of the Bolingbroke Dam on Bobs Lake and as such, the Christie Lake Association questions the current rule curve for Bobs Lake.*
Water levels are a big concern on O'Brien Lake with a beaver dam controlling lake flows.*
Effort is required to maintain the beaver baffler system on Little Silver Lake to ensure good flow and avoid excessive high water levels without increasing the risk of very low levels with a consequential effect on the lake ecosystem.*
Water Quality
Farren and O'Brien Lakes are some of the smaller lakes in the Christie Lake catchment with many older cottages and aging septic systems built very close to their shorelines. Lake residents believe that these factors are largely responsible for the reported water quality problems, which presents a difficult problem for both lake communities and Tay Valley Township to address and what to do about it.*
No apparent surface chemistry water quality concerns in Christie and Davern Lake and on the Tay River within the catchment.
Farren Lake surface chemistry water quality rating ranges from Fair to Good (see Section 2.3 of this report for more information).
Little Silver Lake surface chemistry water quality rating is Fair (see Section 2.1 of this report for more information).
O'Brien Lake surface chemistry water quality rating ranges from Fair to Very Good (see Section 2.4 of this report for more information).
Rainbow Lake surface chemistry water quality rating ranges from Fair to Good (see Section 2.2 of this report for more information).
8.0 Christie Lake Catchment: Actions/Opportunities
Developed by the Christie Lake Association, Farren Lake Property Owners' Association and the Little Silver and Rainbow Lakes Property Owners Association and their partners, the Christie Lake State of the Lake Report (2009), Christie Lake Stewardship Guideline (2011) and Christie Lake Brochure (a planned 5 year update of the Lake Stewardship Guide), Farren Lake State of the Lake Report (2009) and Little Silver and Rainbow Lake Stewardship Plan (2018) provide information on many aspects of the lake environment, as well as actions to maintain and improve the long-term health of the lake. The following list includes some of those identified actions that have implications for the land and water resources of the lake ecosystem. Specific opportunities noted by the lake community are indicated by an asterisk.
Christie Lake and Catchment Health
Development
Work with approval authorities (Lanark County, Leeds Grenville and Lanark District Health Unit, Mississippi Rideau Septic System Office, RVCA and Tay Valley Township) and waterfront property owners including the Christie Lake, Farren Lake and Little Silver and Rainbow Lake Associations along with the Davern Lake and O'Brien Lake communities to consistently implement current land use planning and development policies for water quality and shoreline protection on Christie Lake, Davern Lake, Farren Lake, Little Silver and Rainbow Lakes and O'Brien Lake and the Tay River and headwater streams in the catchment (i.e., a minimum 30 metre development setback from water).
Explore ways and means to more effectively enforce and implement conditions of land-use planning and development approval to achieve net environmental gains (particularly with respect to rehabilitating or protecting naturally vegetated shorelines and water quality).
Encourage Committees of Adjustment to take advantage of technical and environmental information and recommendations forthcoming from planning and environmental professionals.
Municipalities in the Tay Watershed are encouraged to strengthen natural heritage and water resources official plan policies and zoning provisions (pertaining to water setbacks, frontage and naturalized shorelines and wetland protection) where deemed appropriate.
Work with Lanark County, Tay Valley Township and agencies to ensure that development approvals around lakes and along watercourses take into consideration the protection of fish habitat (including the near-shore nursery and spawning habitat).
Municipal and agency planners together with development proponents are to use the 2014 Site Evaluation Guidelines to inform decision-making about the application of development setbacks on lots with shallow soils/bedrock, steep slopes and sparse vegetation cover along with the use of the appropriate, development related, best management practices.
Utilize RVCA subwatershed and catchment reports to help develop/revise official plan policies to protect surface water resources and the natural environment (including woodlands, wetlands and shoreline cover).
Take advantage of the construction of the new Bolingbroke Dam to complete flood plain mapping of the entire length of the Tay River from Bobs Lake to Lower Rideau Lake. Use 1:100 year flood elevation information available for Christie Lake to complete this task for use in assessing development setbacks along the Christie Lake shoreline and protecting property owners from flood hazards.
Establish RVCA regulation limits around the 87 percent (785 ha.) of wetlands in the catchment that are unevaluated, as well as the Christie Lake Provincially Significant Wetland. Doing this will help protect landowners from natural hazards including mitigating surface water flow by storing water during periods of peak flow (such as spring snowmelt and heavy rainfall events) and releasing water during periods of low flow (this mitigation of water flow reduces flood damage), as well as contributing to the stabilization of shorelines and to the reduction of soil erosion damage through water flow mitigation and plant soil binding/retention.
Shorelines
Assess and approach waterfront property owners on Little Silver and Rainbow Lakes whose shorelines do not conform to RVCA riparian guidelines to see if remedial measures could be applied to improve conditions. Little Silver and Rainbow Lakes Property Owners Association can assist with this initiative by widely advertising the many resources available to achieve this.*
Take advantage of the RVCA Shoreline Naturalization Program to re-naturalize altered creek, lake and stream shoreline identified in this report as “Unnatural Riparian Land Cover". Concentrate stewardship efforts on Christie and Farren Lake waterfront properties shown in orange on the Riparian Land Cover map (see Figure 118 in Section 4.4 in this report).Other stewardship opportunities in the catchment may be determined based on septic system inspections and surface water quality monitoring results.
Promote the use of bioengineering methods (using native shrub/tree planting, fascines, live stakes) as a shoreline erosion mitigation measure as well as a cost effective alternative to shoreline hardening (with rip rap, armour stone, gabion baskets, walls)
Educate landowners about the value and importance of natural shorelines and property best management practices with respect to shoreline use and development, septic system installation and maintenance and, shoreline vegetation retention and enhancement (Christie Lake Association, Davern Lake community, Farren Lake Property Owners' Association, Lanark County, Leeds Grenville and Lanark District Health Unit, Little Silver and Rainbow Lakes Property Owners Association, Mississippi Rideau Septic System Office, O'Brien Lake community, RVCA and Tay Valley Township).
Water Levels
The Friends of the Tay Watershed Association has cooperated with the Greater Bobs and Crow Lakes Association, Christie Lake Association, RVCA and Parks Canada in seeking a practical solution to the operational management of the Bolingbroke Dam, and the discussion is ongoing. The replacement of the Bolingbroke Dam on Bobs Lake is scheduled to be completed in 2019, and as such, the Christie Lake Association recognizes this project as a major enhancement to the operational management of water levels on Christie Lake and along the Tay River. When completed, this project can act as a catalyst to address long-standing water level issues that Christie Lake residents have had for many years.*
A community response for the need to be able to better monitor water levels along the Tay system has been the development of the Tay Net (Tay Waterway Communication Network) over the past two years by the Friends of the Tay Watershed Association to provide early notice of significant changes in water levels. Tay Net is now developing it into a ‘Riverwatch’ program for the Tay waterway.*
Little Silver and Rainbow Lakes Property Owners Association will monitor water flow and levels on Little Silver Lake to assist with the task of improving the operational functionality of the beaver baffler located at its outflow.*
Water Quality
Consider further investigation of the 1) Fair to Good surface chemistry water quality rating on Farren and Rainbow Lakes; 2) Fair to Very Good surface chemistry water quality rating on O'Brien Lake and 3) Fair surface chemistry water quality rating on Little Silver Lake as part of a review of RVCA's Watershed Watch, Baseline and Benthic Invertebrate surface water quality monitoring.
Offer funding provided by the RVCA Rural Clean Water Program to landowners with potential projects that could improve water quality on Farren, Little Silver, O'Brien and Rainbow Lakes and their tributaries (e.g., livestock fencing, septic system repair/replacement and streambank erosion control/stabilisation). Concentrate efforts at septic systems requiring remedial work or replacement, including the 144 identified as needing additional maintenance/remedial/replacement work since 2004.
Educate waterfront property owners about septic system care by providing information about sewage system maintenance (i.e., when to pump out septic systems and holding talks) through initiatives such as the Septic Savvy Workshop and services provided by the Mississippi Rideau Septic System Office.
Reduce pollutant loading to Christie, Davern, Farren, Little Silver, O'Brien and Rainbow Lakes through education about the application of shoreline, stormwater and agricultural best management practices; also consider using low impact development (LID) methods to improve the quality and reduce the amount of stormwater runoff directly reaching the lake ecosystem. This will be particularly beneficial in areas with extensive impervious surfaces (i.e., asphalt, concrete, buildings, and severely compacted soils) or on sensitive waterfront properties (with steep slopes/banks, shallow/impermeable soils).
Christie Lake and Catchment Habitat
Aquatic Habitat/Fisheries/Wildlife
The Christie Lake Association is attempting to raise Loon Awareness by enlisting volunteers to track loons and nesting success via the Canadian Lakes Loon Survey coordinated by Bird Studies Canada. Tracking of loons has been ongoing for years on portions of the lake. Enhancements in lake coverage have been undertaken over the last two years. The Christie Lake Associationis also planning to construct and launch loon nesting platforms around Christie Lake in coming years.*
Post signs along O'Brien Lake Lanes about invasive species and educate lake residents and visitors about the effects of introducing invasive species (like zebra mussels and Eurasian milfoilinto O'Brien Lake along with the steps to be taken to stop their introduction when launching personal watercraft.*
Monitor and report on invasive aquatic species (like Eurasian water milfoil) in Little Silver and Rainbow Lake; continue monitoring zebra mussels and advise on precautions to take to avoid their transfer to the lakes.*
Educate waterfront property owners about: 1) fish habitat requirements, spawning timing and near-shore and in-water activities that can disturb or destroy fish habitat and spawning sites 2) the causes of excessive algae and aquatic vegetation growth (see the RVCA publication entitled Algae and Aquatic Plant Educational Manual) and 3) healthy lake ecosystems and associated water level fluctuations in a natural environment.
Lake Association Leadership
Lake Planning
The Christie Lake Association is leading the coordination of the implementation of the recommendations of the 2011 Christie Lake Stewardship Guideline (LSG) and 2015 Christie Lake Brochure.
The Farren Lake Property Owners' Association is leading the coordination of the implementation of the recommendations of the Farren Lake State of the Lake Report (2009).
The Little Silver and Rainbow Lakes Property Owners Association will lead the coordination of the implementation of the recommendations of the Little Silver and Rainbow Lake Stewardship Plan (2018).
Use the information contained in the Tay River Subwatershed Report 2017 and Christie Lake Catchment Report 2017 to assist with implementation of the Christie Lake Stewardship Guideline and Christie Lake Brochure, Farren Lake State of the Lake Report and Little Silver and Rainbow Lakes Stewardship Plan.
The RVCA produces individual reports for 14 catchments in the Tay River subwatershed. Using data collected and analyzed by the RVCA through its watershed monitoring and land cover classification programs, surface water quality and in-stream conditions are reported for the Tay River, Tay Watershed lakes and Tay tributaries along with a summary of environmental conditions for the surrounding countryside every six years, which includes analysis of data collected through the programs along with local information provided by stakeholders up to 2017.
This information is used to better understand the effects of human activity on our water resources, allows us to better track environmental change over time and helps focus watershed management actions where they are needed the most to help sustain the ecosystem services (cultural, aesthetic and recreational values; provisioning of food, fuel and clean water; regulation of erosion/natural hazard protection and water purification; supporting nutrient/water cycling and habitat provision) provided by the catchment’s lands and forests and waters (Millennium Ecosystem Assessment 2005).
The following sections of this report are a compilation of that work for the Eagle Lake catchment.
34 square kilometres; occupies four percent of the Tay River subwatershed; one percent of the Rideau Valley watershed.
Geology/Physiography
Eagle Creek catchment resides within part of the physiographic region known as the Algonquin Highlands. In the Tay River subwatershed, this ancient and hilly geologic region is made up of such Precambrian rocks as marble, conglomerates, and dark or colour banded granite-like rocks. A veneer of glacial drift (glacial till, sand etc.) overlies the bedrock. A geologic fault may run north-south through the eastern section of the catchment.
Municipal Coverage
Central Frontenac Township: (32 km2; 93% of catchment)
South Frontenac Township: (2 km2; 7% of catchment)
Stream Length
All tributaries (including headwater streams): 64 km
1.2 Vulnerable Areas
Aquifer Vulnerability
Mississippi-Rideau Source Water Protection program has mapped a small part of the catchment as a Significant Groundwater Recharge Areas and all of the catchment as a Highly Vulnerable Aquifer. There are no Well-Head Protection Areas in the catchment.
Wetland Hydrology
A watershed model developed by the RVCA in 2009 was used to study the hydrologic function of wetlands in the Rideau Valley Watershed, including those found in the Eagle Lake catchment.
1.3 Conditions at a Glance
Fish Community/Thermal Regime
Warm and cool water recreational and baitfish fishery with 16 species observed in Eagle Creek during 2016.
Headwater Drainage Features
All are natural and wetland features with the majority of them having no anthropogenic modifications.
Instream/Riparian Habitat
Eagle Creek: Low to high habitat complexity with increased habitat complexity observed in the middle and lower reach of the system within the catchment. Dissolved oxygen conditions are somewhat variable along the system with sections in the upper reach below the guideline to support warmwater biota, which can be typical of wetland habitats; however, sections in the middle and lower reaches are acceptable for warm/cool water species.
Land Cover Change (2008 to 2014)
Catchment
Woodland
Settlement
Hectares
-1
+1
Land Cover Type (2014)
Catchment
Woodland
Water
Wetland
Settlement
Crop-Pasture
Meadow-Thicket
Transportation
Percent
52
26
13
3
2
2
2
Shoreline Cover Type (30 m. riparian area; 2014)
Catchment
%
Eagle Lake
%
Eagle Creek
%
Leggat Lake
%
Streams*
%
Woodland
64
Woodland
83
Wetland
75
Woodland
79
Woodland
56
Wetland
27
Settlement
11
Woodland
20
Settlement
11
Wetland
38
Settlement
5
Wetland
4
Transportation
4
Wetland
7
Transportation
3
Transportation
2
Transportation
1
Settlement
1
Transportation
2
Crop-Pasture
1
Meadow-Thicket
1
Meadow-Thicket
1
---
---
Meadow-Thicket
1
Meadow-Thicket
1
Crop-Pasture
1
---
---
---
---
---
---
Settlement
1
*Excludes Eagle Creek
Species at Risk (Elemental Occurrence)
Status
Species at Risk
Threatened
Blanding's Turtle
Eastern Whip-poor-will
---
---
Special Concern
Eastern Milksnake
Eastern Ribbonsnake
Northern Map Turtle
Snapping Turtle
Water Quality for the Protection of Aquatic Life (2006 to 2017)
Water Quality Source
Eagle Lake
Eagle Creek
Leggat Lake
Surface Chemistry
Very Good
Fair to Good
Fair to Good
Instream Biological
---
Poor to Fair
---
Eagle Creek: Benthic invertebrate samples are more tolerant to high organic pollution levels during most years.
Water Wells
Approximately 120 operational private water wells in the Eagle Lake catchment. Groundwater uses are mainly domestic but also include livestock, public and commercial water supplies.
1.4 Catchment Care
Environmental Management
The Eagle Lake Property Owners' Association prepared the State of the Lake Report - Eagle Lake (2011) to provide a summary of what is known about the Eagle Lake catchment along with the community’s vision for the lake and a list of its main concerns and actions to address them. This has been followed up with the State of the Lake Report - Eagle Lake Update 2015.
One Environmental Compliance Approval was sought in the catchment for a camp sewage works.
Environmental Monitoring
Chemical surface (in-stream) water quality collection by the RVCA since 2003 (see Section 2 of this report).
Benthic invertebrate (aquatic insect) surface (in-stream) water quality collection by the RVCA since 2003 (see Section 3.3.1 of this report).
Fish survey and stream characterization survey on Eagle Creek by the RVCA in 2016 included taking measurements and recording observations on instream habitat, bank stability, other attributes and preparing a temperature profile (see Section 3 of this report).
Fourteen headwater drainage feature assessments were conducted by the RVCA in 2016 at road crossings in the catchment. The protocol measures zero, first and second order headwater drainage features and is a rapid assessment method characterizing the amount of water, sediment transport, and storage capacity within headwater drainage features (see Section 3.4 of this report).
Classification of Eagle Lake catchment land cover types derived by the RVCA from colour aerial photography that was acquired during the spring of 2008 and 2014 (see Section 4.1 of this report).
Groundwater chemistry information is available from the Ontario Geological Survey for one well (#13-AG-031) located in the catchment.
Stewardship
Five stewardship projects were completed by landowners with assistance from the RVCA (see Section 5 of this report).
2.0 Eagle Lake Catchment: Water Quality Conditions
Surface water quality conditions in the Eagle Lake catchment are monitored by the Rideau Valley Conservation Authority’s (RVCA) Watershed Watch Program and Baseline Water Quality Monitoring Program. Watershed Watch monitors watershed lakes to assess nutrient concentrations, water clarity, dissolved oxygen availability and pH. The baseline water quality program focuses on streams; data is collected for 22 parameters including nutrients (total phosphorus, total Kjeldahl nitrogen and ammonia), E. coli, metals (like aluminum and copper) and additional chemical/physical parameters (such as alkalinity, chlorides, pH and total suspended solids). Figure 2 shows the locations of monitoring sites in the catchment.
Figure 2 Water quality monitoring sites on Eagle Lake, Leggat Lake and Eagle Creek.
The water quality ratings scored high across this catchment and ranges from "Fair to Very Good" (Table 1). All ratings were determined by the Canadian Council of Ministers of the Environment (CCME) Water Quality Index.
A "Fair" rating indicates that water quality is usually protected but is occasionally threatened or impaired; conditions sometimes depart from natural or desirable levels. A rating of "Good" indicates that only a minor degree of threat or impairment is observed and conditions rarely depart from natural or desirable levels. “Very Good" indicates water quality is protected with a virtual absence of threat or impairment; conditions are very close to natural or pristine levels.
Each parameter is evaluated against established guidelines to determine water quality conditions. Those parameters that frequently exceed guidelines are presented below.
Data has been analyzed over the 2006-2017 period for general trends and conditions. Table 1 shows the overall rating for the monitored surface water quality sites within the catchment and Table 2 outlines the Water Quality Index (WQI) scores and their corresponding ratings.
Table 1 Water Quality Index ratings for the Eagle Lake Catchment
Site
Location
2006-2008
2009-2011
2012-2014
2015-2017
DP1
Eagle Lake
Very Good (100)
Fair (77)
Very Good (100)
Very Good (100)
DP1
Leggat Lake
Good (88)
Good (87)
Fair (77)
Fair (77)
EAG-01
Eagle Creek upstream of Bobs Lake
Fair (74)
Good (84)
Good (81)
Good (80)
Table 2 Water Quality Index ratings and corresponding index scores (RVCA terminology, original WQI category names in brackets)
Rating
Index Score
Very Good (Excellent)
95-100
Good
80-94
Fair
65-79
Poor (Marginal)
45-64
Very Poor (Poor)
0-44
2.1 Leggat Lake Water Quality
Surface water quality conditions in Leggat Lake have been monitored by RVCA’s Watershed Watch Program since 2006. Data from the deep point site (DP1) have been used to calculate the WQI rating for Leggat Lake, which averaged “Fair-Good” over the 2006-2017 period (Table 1). Low-moderate nutrient concentrations, generally good oxygen availability and clear water all influenced this rating. The following discussion explains how each of the monitored water quality parameters contributes to the lake’s water quality.
This report also considers data from eight additional shoreline sites that are monitored around the lake. These sites have not been included in the calculation of the CCME WQI rating, as they are not monitored with the same frequency as the deep point site. However, they do provide important information on water quality conditions in the near shore areas. For locations of shoreline sites (A-H) please see Figure 2.
2.1.1. Leggat Lake Nutrients
Total phosphorus (TP) is used as a primary indicator of excessive nutrient loading and contributes to abundant aquatic vegetation growth and depleted dissolved oxygen levels. The Provincial Water Quality Objective (PWQO) is used as the TP Guideline and states that in lakes, concentrations greater than 0.020 mg/l indicate an excessive amount of TP within the water column. Concentrations below 0.010 mg/l are generally considered to be minimal and unlikely to have problems associated with nutrient loading.
Total Kjeldahl nitrogen (TKN) is used as a secondary indicator of nutrient loading. RVCA uses a guideline of 0.500 mg/l to assess TKN[1] within surface waters.
Nutrients at the Leggat Lake Deep Point
TP and TKN sampling results collected by the RVCA are presented in Figures 3 to 6. Some variability has occurred in the sampled TP concentrations at this site though average annual concentrations were fairly consistent (Figure 3 and 4); no significant trend[2] was observed in the 2006-2017 data set. Ninety percent of samples analyzed for TP were less than the TP guideline and the average concentration was 0.012 mg/l (Table 3). TKN concentration also showed variability, as with TP concentrations no significant change was observed (Figures 5 and 6). Ninety-five percent of reported results were below the TKN guideline and the average TKN concentration was 0.342 mg/l (Table 3).
Overall, the data presented indicates that nutrient concentration may be considered low with few exceedances in the mid-lake, deep water site on Leggat Lake.
Figure 3 Total phosphorous sampling results at the deep point site (DP1) on Leggat Lake, 2006-2017
Figure 4 Average total phosphorous results at the deep point site (DP1) on Leggat Lake, 2006-2017
Figure 5 Total Kjeldahl nitrogen sampling results at the deep point site (DP1) on Leggat Lake, 2006-2017
Figure 6 Average total Kjeldahl nitrogen sampling results at deep point site (DP1) on Leggat Lake, 2006-2017
Table 3 Summary of nutrient results at the deep point site (DP1) on Leggat Lake, 2006-2017
Total Phosphorous 2006-2017
Site
Average (mg/l)
Below Guideline
No. Samples
DP1
0.012
90%
41
Total Kjeldahl Nitrogen 2006-2017
Site
Average (mg/l)
Below Guideline
No. Samples
DP1
0.342
95%
41
Nutrients around Leggat Lake
The average nutrient concentrations at monitored shoreline sites around the lake vary from year to year (Figures 7 and 8). Please note that in the 2006-2017 monitoring period sites A, B and E were monitored yearly; while sites C, D, F, G and H were only sampled in 2009 and 2014.
Average total phosphorous concentrations are below the TP guideline at all of sites, with the exception of site B in 2012 and 2014 (Figure 7). All subsequent results are well below the guideline at this site, and concentrations do not appear to be indicative of persistent problem. Average TKN concentrations were below the guideline at all sites (Figure 8).
Figure 7 Average total phosphorous concentrations at shoreline monitoring sites in Leggat Lake, 2006-2017
Figure 8 Average total Kjeldahl nitrogen concentrations at shoreline monitoring sites in Leggat Lake, 2006-2017
Summary of Leggat Lake Nutrients
Leggat Lake nutrient concentrations are general below the guidelines, with few exceedances. It is possible that occasional problems with nutrient enrichment (i.e. algal blooms or excessive plant growth) may be observed in some shallow, sheltered bays-such as site B.
Efforts such as the diversion of runoff and enhanced shoreline buffers are important to continue to protect and enhance water quality, and reduce future nutrient increases-particularly in developed areas. Nutrient exceedances may be partially attributed to the natural aging of a lake and basin characteristics. All residents can help minimize their impact on the lake by reducing nutrient inputs through practices such as proper maintenance of septic systems, keeping shorelines natural and using phosphate free soaps and detergents. Promotion of sound stewardship and protection around lake is important to maintain and protect water quality conditions into the future.
2.1.2 Leggat Lake Water Clarity
Water clarity is measured using a Secchi disk during each deep point sample. Table 4 summarizes the recorded depths with an average depth of 5.5 m and shows that all readings have exceeded the minimum PWQO of 2 m; indicating that algae in the water column is not at excessive levels (good water clarity). Less than 2 m will indicate overproduction in a lake or significant inputs to the water column that are limiting light availability. Figure 9 shows that no individual reading has been below the guideline and measured depths range from 3.0 m to 9 m. A declining trend was observed in Secchi depths over the 2006-2017 data set, meaning that clairity in the water column has been reduced through this period.
Table 4 Summary of Secchi depths recorded at the deep point site (DP1) on Leggat Lake, 2006-2017
Secchi 2006-2017
Site
Average (m)
Above Guideline
No. Samples
DP1
5.5
100%
45
Figure 9 Recorded Secchi depths at the deep point sites on Leggat Lake, 2006-2017
Summary of Leggat Lake Water Quality
Waters in Leggat Lake are generally clear and sufficient sunlight is able to penetrate the water column to support aquatic life and provide sufficient visibility for safe recreational use (boating, swimming).
2.1.3 Leggat Lake Fish Habitat
Two other factors, dissolved oxygen/temperature and pH were also assessed to provide an overall sense of the health of Leggat Lake from a fish habitat perspective.
2.1.3.1 Leggat Lake Dissolved Oxygen and Temperature
The red bars in Figure 10 show the depths where suitable conditions exist for warm water fish species (temperature less than 25°C and dissolved oxygen greater than 4 mg/l) at the deep point site. The vertical axis represents the total lake depth at each site where the profile is taken. Suitable conditions typically were observed over the monitoring periods to about 10 m of the water column. Periods of very limited conditions were observed in the summer of 2013 and 2015, due to very warm water temperatures in the upper portion of the water column and depleted oxygen conditions at the deeper depths. Overall, no significant change was noted in conditions through the 2006-2017 period.
Figure 10 Depths suitable for warm water fish species at the deep point site (DP1) on Leggat Lake, 2006-2017.
2.1.3.2 Leggat Lake pH
The majority of samples (Figure 11) were within guidelines established by the Canadian Council of Minister's of the Environment which state that pH should be between 6.5 and 9 to protect aquatic life (Table 5). Surface water’s that are found to be more alkaline (higher pH) are common in many regions of the Tay River subwatershed and can generally be attributed to the geology rather than anthropogenic activities. Biological activities such as increased photosynthesis from algal blooms and plant growth may also influence pH.
Figure 11 pH concentrations at the deep point site (DP1) on Leggat Lake, 2006-2017
Table 5 Summary of pH results at the deep point site (DP1) on Leggat Lake, 2006-2017.
pH 2006-2017
Site
Average (mg/l)
Within Guideline
No. Samples
DP1
7.7
98%
41
Summary of Water Quality for Fish Habitat In Leggat Lake
Overall the water chemistry data at the deep point describes suitable habitat conditions for fish species such as bass, walleye and pike. pH conditions are within the range recommended for the protection of aquatic life. Overall, the data indicates a healthy environment for aquatic species.
2.1.4 Leggat Lake E. Coli
E. coli is sampled at monitored shoreline sites twice each sampling season. E. coli data was not used in the calculations of the WQI rating for the lake due to differences in sampling frequency and site locations. E. coli data has been summarized in Table 6.
Throughout the 2006-2017 period 98 percent of samples collected by RVCA were below the E. coli guideline of 100 colony forming units (CFU) per 100 ml set by the PWQO; across the lake the count at the geometric mean was 4 CFU/100ml (Table 6). This provides support that there is little indication of bacterial contamination around the lake. Figure 12 show the distribution of counts across all shoreline sites. All sites fell well below the guideline of 100 CFU/100ml.
Table 6 Summary of E. coli results for Leggat Lake, 2006-2017.
E. coli 2006-2017
Site
Geometric mean (CFU/100ml)
Below Guideline
No. Samples
A-H
4
98%
101
Figure 12 E. coli counts at monitored shoreline sites on Leggat Lake, 2006-2017.
Summary of Leggat Lake Bacterial Contamination
The results presented above indicate that bacterial contamination is not a significant concern in Leggat Lake and the water should be safe for recreational use such as swimming and boating.The results presented above provide evidence that bacterial contamination is not a significant concern in Leggat Lake and the water should be safe for recreational use such as swimming and boating.
2.2 Eagle Lake Water Quality
Surface water quality conditions in Eagle Lake have been monitored by RVCA’s Watershed Watch Program since 2002. Data from the deep point site (DP1) have been used to calculate the WQI rating for Eagle Lake, which averaged “Very Good” over the 2006-2017 period (Table 1). Low nutrient concentrations, good oxygen availability and clear water all influenced this rating. The following discussion explains how each of the monitored water quality parameters contributes to the lake’s water quality.
This report also considers data from eight additional shoreline sites that are monitored around the lake. These sites have not been included in the calculation of the CCME WQI rating, as they are not monitored with the same frequency as the deep point site. However, they do provide important information on water quality conditions in the near shore areas. For locations of shoreline sites (A-K) please see Figure 2.
2.2.1 Eagle Lake Nutrients
Total phosphorus (TP) is used as a primary indicator of excessive nutrient loading and contributes to abundant aquatic vegetation growth and depleted dissolved oxygen levels. The Provincial Water Quality Objective (PWQO) is used as the TP Guideline and states that in lakes, concentrations greater than 0.020 mg/l indicate an excessive amount of TP within the water column. Concentrations below 0.010 mg/l are generally considered to be minimal and unlikely to have problems associated with nutrient loading.
Total Kjeldahl nitrogen (TKN) is used as a secondary indicator of nutrient loading. RVCA uses a guideline of 0.500 mg/l to assess TKN[1] within surface waters.
Nutrients at the Eagle Lake Deep Point
TP and TKN sampling results collected by the RVCA are presented in Figures 13 to 16. Some variability has occurred in the sampled TP concentrations at this site though average annual concentrations were fairly consistent (Figure 13 and 14); no significant trend[2] was observed in the 2006-2017 data set. Ninety-eight percent of samples analyzed for TP were less than the TP guideline and the average concentration was 0.008 mg/l (Table 7). TKN concentration also showed variability, as with TP concentrations no significant change was observed (Figures 15 and 16). All reported results were below the TKN guideline and the average TKN concentration was 0.297 mg/l (Table 7).
Overall, the data presented indicates that nutrient concentration may be considered low with few exceedances in the mid-lake, deep water site on Eagle Lake.
Figure 13 Total phosphorous sampling results at the deep point site (DP1) on Eagle Lake, 2006-2017
Figure 14 Average total phosphorous results at the deep point site (DP1) on Eagle Lake, 2006-2017
Figure 15 Total Kjeldahl nitrogen sampling results at the deep point site (DP1) on Eagle Lake, 2006-2017
Figure 16 Total Kjeldahl nitrogen sampling results at deep point site (DP1) on Eagle Lake, 2006-2017
Table 7 Summary of nutrient results at the deep point site (DP1) on Eagle Lake, 2006-2017
Total Phosphorous 2006-2017
Site
Average (mg/l)
Below Guideline
No. Samples
DP1
0.008
98%
43
Total Kjeldahl Nitrogen 2006-2017
Site
Average (mg/l)
Below Guideline
No. Samples
DP1
0.297
100%
44
Nutrients around Eagle Lake
The average nutrient concentrations at monitored shoreline sites around the lake vary from year to year (Figures 17 and 18). Please note that in the 2006-2017 monitoring period sites A, B, F and G were monitored yearly; while sites C, D, E, G, H , I and K were only sampled in 2007, 2012 and 2017.
Average total phosphorous concentrations are below the TP guideline at all of sites (Figure 17), and concentrations do not appear to be indicative of a persistent problem. Average TKN concentrations were below the guideline at all sites, with the exception of elevated instances at site F in 2006 and site B in 2008. In both cases neither site has had sustained periods of elevated concentrations (Figure 18).
Figure 17 Average total phosphorous concentrations at shoreline monitoring sites in Eagle Lake, 2006-2017
Figure 18 Average total Kjeldahl nitrogen concentrations at shoreline monitoring sites in Eagle Lake, 2006-2017
Summary of Eagle Lake Nutrients
Eagle Lake nutrient concentrations are general below the guidelines, with few exceedances. It is possible that occasional problems with nutrient enrichment (i.e. algal blooms or excessive plant growth) may be observed in some shallow, sheltered bays.
Efforts such as the diversion of runoff and enhanced shoreline buffers are important to continue to protect and enhance water quality, and reduce future nutrient increases-particularly in developed areas. Nutrient exceedances may be partially attributed to the natural aging of a lake and basin characteristics. All residents can help minimize their impact on the lake by reducing nutrient inputs through practices such as proper maintenance of septic systems, keeping shorelines natural and using phosphate free soaps and detergents. Promotion of sound stewardship and protection around lake is important to maintain and protect water quality conditions into the future.
2.2.2 Eagle Lake Water Clarity
Water clarity is measured using a Secchi disk during each deep point sample. Table 8 summarizes the recorded depths with an average depth of 5.0 m and shows that all readings have exceeded the minimum PWQO of 2 m; indicating that algae in the water column is not at excessive levels (good water clarity). Less than 2 m will indicate overproduction in a lake or significant inputs to the water column that are limiting light availability. Figure 19 shows that no individual reading has been below the guideline and measured depths range from 3.5 m to 9.5 m. No trend was observed in Secchi depths over the 2006-2017 data set.
Table 8 Summary of Secchi depths recorded at the deep point site (DP1) on Eagle Lake, 2006-2017
Secchi 2006-2017
Site
Average (m)
Above Guideline
No. Samples
DP1
5.0
100%
41
Figure 19 Recorded Secchi depths at the deep point site (DP1) on Eagle Lake, 2006-2017
Summary of Eagle Lake Water Clarity
Waters in Eagle Lake are generally clear and sufficient sunlight is able to penetrate the water column to support aquatic life and provide sufficient visibility for safe recreational use (boating, swimming).
2.2.3 Eagle Lake Fish Habitat
Two other factors, dissolved oxygen/temperature and pH were also assessed to provide an overall sense of the health of Eagle Lake from a fish habitat perspective.
2.2.3.1 Eagle Lake Dissolved Oxygen and Temperature
Warm-water Fish Community
The red bars in Figure 20 show the depths where suitable conditions exist for warm-water fish species (temperature less than 25°C and dissolved oxygen greater than 4 mg/l) at the deep point site. The vertical axis represents the total lake depth at each site where the profile is taken. Suitable conditions typically were observed throughout the water column in the spring and early summer, declining to about 15 m by late summer. Overall, no significant change was noted in conditions through the 2006-2017 period.
Figure 20 Depths suitable for warm water fish species at the deep point site (DP1) on Eagle Lake, 2006-2017
Cold-water Fish Community
Optimal habitat for adult Lake Trout has a dissolved oxygen concentration of 6 mg/l, although concentrations as low as 4 mg/l, can be tolerated. However, juvenile Lake Trout have a higher minimum dissolved oxygen requirement of 7 mg/l. Data taken at the deep point site on Eagle Lake from May to late July/early August indicate adequate habitat for both adult and juvenile Lake Trout. For the interval from August 14 to September 30, of the 34 dissolved oxygen/temperature profiles available from 2002 to 2015 at Eagle Lake, 11 are from this time span.
As shown in Figure 21, for each year with data available, the light blue zone represents the portion of the usable lake depth as lake trout habitat, the light red zone as optimal habitat with up to 7 mg/litre of dissolved oxygen. Usable habitat for lake trout is defined as less than 15.5°C and 4 mg/l or more of dissolved oxygen. Optimal habitat is defined as less than 10°C and 7 mg/l or more of dissolved oxygen.
Figure 21 Usable to optimal depths for Lake Trout on Eagle Lake (2002 to 2017)
This data suggests that Lake Trout habitat is inadequate to borderline in some years, e.g., 2002, 2006, and 2009 to 2011. In other years, e.g., 2003, 2007, 2012, 2014 and 2015, habitat conditions in the late summer are acceptable for Lake Trout. Based on such dissolved oxygen/temperature profiles, it seems that every 4 to 5 years there is sufficient dissolved oxygen, i.e., a minimum of 7 mg/l, in portions of the water column to support juvenile Lake Trout.
These findings suggest that it is the late summer dissolved oxygen/temperature profiles that may be a limiting factor affecting the adequacy of the lake environment for Lake Trout, particularly juvenile fish. Nonetheless, there is potential for survival of a proportion of juvenile fish in certain years, so that some degree of recruitment for the adult pool of Lake Trout at Eagle Lake seems probable.
2.2.3.2 Eagle Lake pH
The majority of samples (Figure 22) were within guidelines established by the Canadian Council of Minister's of the Environment which state that pH should be between 6.5 and 9 to protect aquatic life (Table 9). Surface water’s that are found to be more alkaline (higher pH) are common in many regions of the Tay River subwatershed and can generally be attributed to the geology rather than anthropogenic activities. Biological activities such as increased photosynthesis from algal blooms and plant growth may also influence pH.
Figure 22 pH concentrations at the deep point site (DP1) on Eagle Lake, 2006-2017
Table 9 Summary of pH results at the deep point site (DP1) on Eagle Lake, 2006-2017.
pH 2006-2017
Site
Average (mg/l)
Within Guideline
No. Samples
DP1
8.2
98%
41
Summary of Water Quality for Fish Habitat in Eagle Lake
Overall the water chemistry data at the deep point describes suitable habitat conditions for fish species such as bass, walleye and pike. pH conditions are within the range recommended for the protection of aquatic life. Overall, the data indicates a healthy environment for aquatic species.
2.2.4 Eagle Lake E. Coli
E. coli is sampled at monitored shoreline sites twice each sampling season. E. coli data was not used in the calculations of the WQI rating for the lake due to differences in sampling frequency and site locations. E. coli data has been summarized in Table 10.
Throughout the 2006-2017 period, 100 percent of samples collected by RVCA were below the E. coli guideline of 100 colony forming units (CFU) per 100 ml, set by the PWQO; across the lake the count at the geometric mean was 3 CFU/100ml (Table 10). This provides support that there is little indication of bacterial contamination around the lake. Figure 23 show the distribution of counts across all shoreline sites. All sites fall well below the guideline of 100 CFU/100ml.
Table 10 Summary of E. coli results for Eagle Lake, 2006-2017.
E. coli 2006-2017
Site
Geometric mean (CFU/100ml)
Below Guideline
No. Samples
A-K
3
100%
158
Figure 23 E. coli counts at monitored shoreline sites on Eagle Lake, 2006-2017.
Summary of Bacterial Contamination
The results presented above indicate that bacterial contamination is not a significant concern in Eagle Lake and the water should be safe for recreational use such as swimming and boating.
2.3 Eagle Creek Water Quality
There is one stream site on Eagle Creek monitored in the Eagle Lake-Eagle Creek catchment (EAG-01, Figure 2). Analysis of the data has considered over the 2006-2017 period. Water quality at this site is reported as “Fair-Good” (Table 1) as determined by the Canadian Council of Ministers of the Environment Water Quality Index (CCME WQI). The score at this due to the majority of monitored parameters having results below established guidelines. For more information on the CCME WQI, please see the Tay River Subwatershed Report. Only those parameters with exceedances that influenced the rating will be discussed in the following.
2.3.1 Eagle Creek Nutrients
Total phosphorus (TP) is used as a primary indicator of excessive nutrient loading and may contribute to abundant aquatic vegetation growth and depleted dissolved oxygen levels. The Provincial Water Quality Objective (PWQO) is used as the TP Guideline and states that in streams concentrations greater than 0.030 mg/l indicate an excessive amount of TP.
Total Kjeldahl nitrogen (TKN) is used as a secondary indicator of nutrient loading. RVCA uses a guideline of 0.500 mg/l to assess TKN[1] at the monitored site.
Tables 11 and 12 summarize average nutrient concentrations at the monitored site on Eagle Creek and show the proportion of results that meet the guidelines.
Table 11 Summary of total phosphorous results for Eagle Creek, 2006-2017.
Total phosphorus 2006-2017
Site
Average (mg/l)
Below Guideline
No. Samples
EAG-01
0.027
72%
76
Table 12 Summary of total Kjeldahl nitrogen results for Eagle Creek, 2006-2017 (Highlighted values indicate average concentrations that exceed the guideline).
Total Kjeldahl Nitrogen 2006-2017
Site
Average (mg/l)
Below Guideline
No. Samples
EAG-01
0.575
46%
76
The majority of TP results (72 percent) were below the guideline with an average concentration of 0.027 mg/l (Table 11). Concentrations tend to increase over the summer (Figure 24). Elevated counts were observed during the 2008 and 2016 sampling periods, this may be due to significant periods of wet weather during these sampling years (Figure 25). Please note that no samples were collected over the winter months. Overall, there was no significant trend in the monitoring data throughout the 2006-2017 period (Figure 25).
Figure 24 Average monthly total phosphorus concentrations in Eagle Creek, 2006-2017.
Figure 25 Distribution of total phosphorus concentrations in Eagle Creek, 2006-2017.
TKN results show that the bulk of results exceeded the guideline (Figure 26); 46 percent of samples were below the guideline and the average concentration was slightly elevated at 0.575 mg/l (Table 12). As with TP results, TKN concentrations appear to increase throughout the summer months (Figure 26). Periods of elevated concentrations were observed in 2008, 2011 and 2016 (Figure 27). Overall there was no significant trend in the monitoring data throughout the 2006-2017 period.
Figure 26 Average monthly total Kjeldahl nitrogen concentration in Eagle Creek, 2006-2017
Figure 27 Distribution of total Kjeldahl nitrogen concentrations in Eagle Creek, 2006-2017
Summary of Eagle Creek Nutrients
The data shows that periods of elevated nutrients occur occasionally in Eagle Creek, particularly in regards in TKN. Elevated nitrogen is likely due to the influence of surrounding wetland areas, wetlands are naturally rich in nitrogen and appear to be contributing to the concentrations in this creek. Though this is likely to be a natural condition it is important to reduce human impacts wherever possible. Strategies to reduce nutrient inputs may include diversion of runoff to the creek from surrounding developed areas (i.e. roadways) and enhanced shoreline buffers.
2.3.2 Eagle Creek E. Coli
E. coli is used as an indicator of bacterial pollution from human or animal waste; in elevated concentrations it can pose a risk to human health. The PWQO of 100 colony forming units/100 milliliters (CFU/100 ml) is used to assess E. coli. Counts greater than this guideline indicate that bacterial contamination may be a problem within a waterbody.
Table 13 summarizes the geometric mean for the monitored site on Eagle Creek and shows the proportion of samples that meet the E. coli guideline of 100 CFU/100 ml. The monthly geometric mean with respect to the guideline for the 2006-2017 period is shown in Figure 28 and distribution of sampled counts is shown in Figure 29.
Table 13 Summary of E. coli results for Eagle Creek, 2006-2017
E. coli 2006-2017
Site
Geometric Mean (CFU/100ml)
Below Guideline
No. Samples
EAG-01
42
79%
76
E. coli results at site EAG-01 indicate bacterial counts are typically below (79 percent) the E. coli guideline, similarly the count at geometric mean is 42 CFU/100ml (Table 13) and well below the guideline. E. coli counts are slightly higher during the summer months as warmer temperatures are needed for bacteria to survive (Figure 28). Results have varied for each sampled year, but no trend was observed across the 2006-2017 period (Figure 29).
Figure 28 Geometric mean of monthly E. coli counts in Eagle Creek, 2006-2017
Figure 29 Distribution of E. coli counts in Eagle Creek, 2006-2017
Summary of Eagle Creek Bacterial Contamination
Results indicate that bacterial contamination is not a concern in Eagle Creek. The count at the geometric mean is below the guideline and a limited number of counts exceeding the guideline have been observed. The elevated samples that do occur are most likely due to wildlife and can be considered natural variability in the aquatic ecosystem. However good stewardships practices should be maintained throughout the drainage area to protect both Eagle Creek and Bobs Lake downstream; this includes properly maintaining septic systems, enhancing shoreline buffers and restricting livestock access-all actions that can help to protect water quality conditions in Eagle Creek.
2.3.3 Eagle Creek Metals
Of the metals routinely monitored in Eagle Creek, aluminum (Al) and iron (Fe) reported concentrations above their respective PWQOs. In elevated concentrations, these metals can have toxic effects on sensitive aquatic species. The PWQO for Al is 0.075 mg/l and Fe is 0.300 mg/l.
Tables 14 and 15 summarize metal concentrations at the monitored site, as well as show the proportion of samples that meet guidelines. Figures 30 and 32 show the monthly average concentrations with respect to the guidelines; Figures 31 and 33 show the distribution of sample results.
Table 14 Summary of aluminum results for Eagle Creek, 2006-2017
Aluminum 2006-2017
Site
Average (mg/l)
Below Guideline
No. Samples
EAG-01
0.044
79%
29
Table 15 Summary of iron results for Eagle Creek, 2006-2017
Iron 2006-2017
Site
Average (mg/l)
Below Guideline
No. Samples
EAG-01
0.249
68%
28
Results show that Al concentrations often meet the objective with 79 percent of samples below the guideline, no significant trend was observed in the sampled concentrations (Figure 31). The average concentration of Al was below the guideline at 0.044 mg/l (Table 14).
The majority of Fe results were below the guideline; 68 percent of samples were below the guideline in the 2006-2017 period (Figure 33), as with Al results no trend was observed. The average concentration was below the guideline in the reporting period with a concentration of 0.249 mg/l (Table 15).
Figure 30 Average of monthly aluminum concentrations in Eagle Creek, 2006-2017
Figure 31 Distribution of aluminum concentrations in Eagle Creek, 2010-2015
Figure 32 Average of monthly iron concentrations in Eagle Creek, 2006-2017.
Figure 33 Distribution of iron concentrations in Eagle Creek, 2010-2015
Summary of Eagle Creek Metals
Concentrations of both iron and aluminum have not shown any significant change within Eagle Creek, though exceedances have occurred the majority of samples as well as average concentration are below respective guidelines. Efforts should continue to be made to identify if any significant pollution sources do exist and implement best management practices reduce any inputs such as storm water runoff, metal alloys, fungicides and pesticides to improve overall stream health and lessen downstream impacts.
[1] No Ontario guideline for TKN is presently available; however, waters not influenced by excessive organic inputs typically range from 0.100 to 0.500 mg/l, Environment Canada (1979) Water Quality Sourcebook, A Guide to Water Quality Parameters, Inland Waters Directorate, Water Quality Branch, Ottawa, Canada
[2] All trends were determined using the Mann-Kendall trend test and Sens slope estimator
[3] A type of mean or average, which indicates the central tendency or typical value of a set of numbers by using the product of their values (as opposed to the arithmetic mean which uses their sum). It is often used to summarize a variable that varies over several orders of magnitude, such as E. coli counts.
The Stream Characterization Program evaluated 2.7 km of Eagle Creek in 2016. A total of 27 stream survey assessments were completed in the middle of July.
During the summer and fall of 2016, the Rideau Valley watershed experienced periods of severe drought. Precipitation levels were measured at less than 40% of the long-term average, as the water supply was unable to meet local demand. The lack of rainfall affected the success and function of farm crops, municipal and private wells, lawns and gardens, navigation and ultimately the health of our lakes, rivers and streams.
Low water conditions were readily observed throughout the watershed, as many of the streams were highly fragmented or completely dry. Aquatic species such as amphibians, fish and macroinvertebrates were affected, as suitable habitat may have been limited. Fragmentation of habitat was observed in sections along Eagle Creek during drought conditions in 2016.
Eagle Creek showing fragmentation of aquatic habitat during the drought in the Fall of 2016
3.1 Eagle Creek Overbank Zone
3.1.1 Riparian Buffer Evaluation
The quality of the riparian area increases with the width, complexity and linear extent of its vegetation along a stream or creek. A complex riparian community consists of diverse plant species native to the site, with multiple age-classes providing vertical structural diversity along a watercourse.
Here is a list of watershed benefits from a healthy riparian buffer zone:
Reduces the amount of pollutants that reach the stream from surface runoff
Helps reduce and mitigates erosion
Provides a microclimate that is cooler during the summer months providing cooler water for aquatic organisms
Provides large wood structure from fallen trees and limbs that form instream cover, create pools, stabilize the streambed, and provide habitat for aquatic organisms
Provides organic material for stream biota that, among other functions, is the base of the food chain in lower order streams
Provides habitat for terrestrial insects that drop in the stream and become food for fish and travel corridors for other terrestrial animals
Dissipates energy during flood events
Often provides the only refuge areas for fish during out-of-bank flows (behind trees, stumps, and logs)
Figure 34 demonstrates the buffer conditions of the left and right banks separately. Eagle Creek had a buffer of greater than 30 meters along 100 percent of the left bank and 94 percent of the right bank.
Figure 34 Riparian Buffer Evaluation along Eagle Creek
3.1.2 Riparian Buffer Alterations
Alterations within the riparian buffer were assessed within three distinct shoreline zones (0-5m, 5-15m, 15-30m), and evaluated based on the dominant vegetative community and/or land cover type (Figure 35). The riparian buffer zone along Eagle Creek was found to be dominated by forest, wetland and scrubland conditions. There was an area in the middle reach along the right bank that had altered riparian zone conditions.
Figure 35 Riparian buffer alterations along Eagle Creek
3.1.3 Adjacent Land Use
The RVCA’s Stream Characterization Program identifies eight different land uses along Eagle Creek (Figure 36). Surrounding land use is considered from the beginning to end of the survey section (100m) and up to 100m on each side of the river. Land use outside of this area is not considered for the surveys but is nonetheless part of the subwatershed and will influence the creek. Wetland habitat was dominant at 78 percent of sections surveyed; forested habitat was found at 74% of sections, 19 percent scrubland habitat, while seven percent was classified as meadow habitat in the adjacent lands along Eagle Creek. The remaining land use consisted of active agriculture, residential, recreational and infrastructure in the form of road crossings.
Figure 36 Land Use along Eagle Creek
3.2 Eagle Creek Shoreline Zone
3.2.1 Instream Erosion
Stream erosion is the process by which water erodes and transports sediments, resulting in dynamic flows and diverse habitat conditions. Excessive erosion can result in drastic environmental changes, as habitat conditions, water quality and aquatic life are all negatively affected. Bank stability was assessed as the overall extent of each section with “unstable” shoreline conditions. These conditions are defined by the presence of significant exposed soils/roots, minimal bank vegetation, severe undercutting, slumping or scour and potential failed erosion measures. The majority of Eagle Creek had no evidence of erosion observed along the surveyed sections, however there were three locations with low levels of erosion observed (Figure 37).
Figure 37 Erosion levels along Eagle Creek
3.2.2 Undercut Stream Banks
Stream bank undercuts can provide excellent cover habitat for aquatic life, however excessive levels can be an indication of unstable shoreline conditions. Bank undercut was assessed as the overall extent of each surveyed section with overhanging bank cover present. Figure 38 shows that Eagle Creek had no observed undercut banks along the upper and lower reaches of the system, however there were several sections in the middle reaches with low levels of undercut banks.
Figure 38 Undercut stream banks along Eagle Creek
3.2.3 Stream Shading
Grasses, shrubs and trees all contribute towards shading a stream. Shade is important in moderating stream temperature, contributing to food supply and helping with nutrient reduction within a stream. Stream cover is assessed as the total coverage area in each section that is shaded by overhanging trees/grasses and tree canopy, at greater than 1m above the water surface. Figure 39 shows highly variable levels of stream shading along Eagle Creek. There were many sections along the creek where the channel narrows that had high to moderate levels of stream shading along the system.
Figure 39 Stream shading along Eagle Creek
3.2.4 Instream Wood Structure
Forested shorelines provide essential complex habitat through the perpetual process of shoreline trees falling into the water. This continuous recruitment of trees creates a wood-based physical structure in the littoral zone that is common on natural systems. Insects, fish, amphibians, birds, and other animals have also evolved with this abundance of near shore wood and it is essential to their life cycles. With increased development along many waterways, forested lakeshores have been altered and wood-based physical structure in many waterways has been reduced. It is important to restore this essential habitat to aquatic ecosystems.
Shoreline Protection
Protects shorelines by providing a barrier from wind and wave erosion
Reduces sedimentation of the water caused by shoreline slumping due to bank erosion
Allows detritus to collect and settle on the lake or creek bed providing the substrate structure required for native aquatic vegetation to establish and outcompete invasive species
Food Source
Wood complexes are an important food source for invertebrates
Small fish feed on the abundance of invertebrates that are found around these structures
Larger fish, waterfowl and shorebirds all benefit from the abundance of invertebrates and small fish feeding around woody structures in the littoral zone
Cover
Cover from predators is essential for many fish and animals to successfully complete their life cycle
The nooks and crannies of wood complexes offer critters safety from predators while at the same time concentrating prey to make predators more efficient
Wood provides the structure on which many species must lay or attach their eggs, therefore these complexes provide quality spawning and nesting habitat
Diversity
Wood complexes in the littoral zone provide unique edge habitat along the shoreline
Edge habitats contain more species diversity and higher concentrations of species than the adjoining habitats themselves will have
Figure 40 shows that the majority of Eagle Creek had high to moderate levels of instream wood structure along the system. Low to moderate levels of in water trees and branches were observed along the majority of the system.
Figure 40 Instream wood structure along Eagle Creek
3.2.5 Overhanging Wood Structure
Trees and branches that are less than one meter from the surface of the water are defined as overhanging. Overhanging wood structure provide a food source, nutrients and shade which helps to moderate instream water temperatures. Figure 41 shows the system is highly variable with no overhanging branches and trees where the system is wide and is dominated by wetland habitat to areas in the middle reaches that have high levels of overhanging wood structure along Eagle Creek.
Figure 41 Overhanging wood structure along Eagle Creek
3.2.6 Anthropogenic Alterations
Stream alterations are classified based on specific functional criteria associated with the flow conditions, the riparian buffer and potential human influences. Figure 42 shows seventy four percent of Eagle Creek remains “unaltered” with no anthropogenic alterations. Nineteen percent of Eagle Creek was classified as natural with minor anthropogenic changes while seven percent was considered altered. The alterations along Eagle Creek were in the form of shoreline modifications and road crossings. There were no sections that were classified as being highly altered.
Figure 42 Anthropogenic alterations along Eagle Creek
3.3 Eagle Creek Instream Aquatic Habitat
3.3.1 Benthic Invertebrates
Freshwater benthic invertebrates are animals without backbones that live on the stream bottom and include crustaceans such as crayfish, molluscs and immature forms of aquatic insects. Benthos represent an extremely diverse group of aquatic animals and exhibit wide ranges of responses to stressors such as organic pollutants, sediments and toxicants, which allows scientists to use them as bioindicators. As part of the Ontario Benthic Biomonitoring Network (OBBN), the RVCA has been collecting benthic invertebrates at the Bobs Lake Road site since 2011. The Eagle Creek sample location was added to the monitoring network as a result of an identified gap during the release of the 2011 Eagle Creek catchment report. Monitoring data is analyzed for each sample site and the results are presented using the Family Biotic Index, Family Richness and percent Ephemeroptera, Plecoptera and Trichoptera.
Hilsenhoff Family Biotic Index
The Hilsenhoff Family Biotic Index (FBI) is an indicator of organic and nutrient pollution and provides an estimate of water quality conditions for each site using established pollution tolerance values for benthic invertebrates. FBI results for the Eagle Creek catchment at the County Road 38 sample location is summarized by year. “Poor” water quality conditions were observed at the Eagle Creek sample location (Figure 43) using a grading scheme developed by Conservation Authorities in Ontario for benthic invertebrates.
Figure 43 Hilsenhoff Family Biotic Index at the Bobs Lake Road sample location
Family Richness
Family Richness measures the health of the community through its diversity and increases with increasing habitat diversity suitability and healthy water quality conditions. Family Richness is equivalent to the total number of benthic invertebrate families found within a sample. The Bobs Lake Road sample location is reported to have “Fair” family richness (Figure 44).
Figure 44 Family Richness on Eagle Creek at the Bobs Lake Road sample location
EPT
Ephemeroptera (Mayflies), Plecoptera (Stoneflies), and Trichoptera (Caddisflies) are species considered to be very sensitive to poor water quality conditions. High abundance of these organisms is generally an indication of good water quality conditions at a sample location. The community structure is somewhat variable with samples that are dominated by species that are tolerant to poorer water quality conditions at the Eagle Creek site location. As a result, the EPT indicates that the Eagle Creek sample location is reported to have conditions that range from “Fair” to “Poor” water quality (Figure 45) during the reporting period.
Figure 45 EPT on Eagle Creek at the Bobs Lake Road sample location
Conclusion
Overall the aquatic habitat conditions for the Eagle Creek sample location at Bobs Lake Road from a benthic invertebrate perspective ranges from “Fair” to “Poor” conditions as the samples have species that are more tolerant to high organic pollution levels during most years.
3.3.2 Habitat Complexity
Habitat complexity is a measure of the overall diversity of habitat types and features within a stream. Streams with high habitat complexity support a greater variety of species niches, and therefore contribute to greater diversity. Factors such as substrate, flow conditions (pools, riffles) and cover material (vegetation, wood structure, etc.) all provide crucial habitat to aquatic life. Habitat complexity is assessed based on the presence of boulder, cobble and gravel substrates, as well as the presence of instream woody material.
Low to high habitat complexity was identified for Eagle Creek (Figure 46). Regions with increased habitat complexity were observed in the middle and lower reaches of the system within the catchment.
Figure 46 Habitat complexity along Eagle Creek
3.3.3 Instream Substrate
Diverse substrate is important for fish and benthic invertebrate habitat because some species have specific substrate requirements and for example will only reproduce on certain types of substrate. The absence of diverse substrate types may limit the overall diversity of species within a stream. Figure 47 shows the overall presence of various substrate types observed along Eagle Creek. Substrate conditions were highly diverse along Eagle Creek with all substrate types being recorded at various locations along the creek. Figure 48 shows the dominant substrate type observed for each section surveyed along Eagle Creek.
Figure 47 Instream substrate along Eagle Creek
Figure 48 shows the dominant substrate type along Eagle Creek
3.3.4 Instream Morphology
Pools and riffles are important habitat features for aquatic life. Riffles are fast flowing areas characterized by agitation and overturn of the water surface. Riffles thereby play a crucial role in contributing to dissolved oxygen conditions and directly support spawning for some fish species. They are also areas that support high benthic invertebrate populations which are an important food source for many aquatic species. Pools are characterized by minimal flows, with relatively deep water and winter/summer refuge habitat for aquatic species. Runs are moderately shallow, with unagitated surfaces of water and areas where the thalweg (deepest part of the channel) is in the center of the channel. Figure 49 shows that Eagle Creek is highly variable; 93 percent of sections recorded runs, 33 percent pools and 30 percent riffles. Figure 50 shows where the riffle habitat areas were observed along Eagle Creek.
Figure 49 Instream morphology along Eagle Creek
Figure 50 Instream riffle habitat along Eagle Creek
3.3.5 Vegetation Type
Instream vegetation provides a variety of functions and is a critical component of the aquatic ecosystem. Aquatic plants promote stream health by:
Providing direct riparian/instream habitat
Stabilizing flows reducing shoreline erosion
Contributing to dissolved oxygen through photosynthesis
Maintaining temperature conditions through shading
For example emergent plants along the shoreline can provide shoreline protection from wave action and important rearing habitat for species of waterfowl. Submerged plants provide habitat for fish to find shelter from predator fish while they feed. Floating plants such as water lilies shade the water and can keep temperatures cool while reducing algae growth. Algae was observed in 93 percent of sections, submerged plants were present in 81 percent of the survey sections, 74 percent for floating plants, narrow leaved emergents were observed in 59 percent of sections, 26 percent free floating plants, 63 percent broad leaved emergents and robust emergents were observed in 37 percent of sections surveyed. Figure 51 depicts the plant community structure for Eagle Creek. Figure 52 shows the dominant vegetation type observed for each section surveyed along Eagle Creek.
Figure 51 Vegetation type along Eagle Creek
Figure 52 Dominant vegetation type along Eagle Creek
3.3.6 Instream Vegetation Abundance
Instream vegetation is an important factor for a healthy stream ecosystem. Vegetation helps to remove contaminants from the water, contributes oxygen to the stream, and provides habitat for fish and wildlife. Too much vegetation can also be detrimental. Figure 53 demonstrates that Eagle Creek reach had normal to common levels of vegetation recorded at 41 and 48 percent of stream surveys. Extensive levels of vegetation were observed in 63 percent of the surveyed sections, while 19 percent of sections had areas with no vegetation.
Figure 53 Instream vegetation abundance along Eagle Creek
3.3.7 Invasive Species
Invasive species can have major implications on streams and species diversity. Invasive species are one of the largest threats to ecosystems throughout Ontario and can out compete native species, having negative effects on local wildlife, fish and plant populations. Ninety six percent of the sections surveyed along Eagle Creek reach had invasive species. The invasive species observed in Eagle Creek were European frogbit, purple loosestrife, banded mystery snail and common/glossy buckthorn. Invasive species abundance (i.e. the number of observed invasive species per section) was assessed to determine the potential range/vector of many of these species (Figure 54).
Figure 54 Invasive species abundance along Eagle Creek
3.3.8 Water Chemistry
During the stream characterization survey, a YSI probe is used to collect water chemistry information. Dissolved oxygen (DO), specific conductivity (SPC) and pH are measured at the start and end of each section.
3.3.8.1 Dissolved Oxygen
Dissolved oxygen is a measure of the amount of oxygen dissolved in water. The Canadian Environmental Quality Guidelines of the Canadian Council of Ministers of the Environment (CCME) suggest that for the protection of aquatic life the lowest acceptable dissolved oxygen concentration should be 6 mg/L for warmwater biota and 9.5 mg/L for coldwater biota (CCME, 1999). Figure 55 shows that the dissolved oxygen in Eagle Creek supports warmwater and in certain locations coldwater biota along the system. The average dissolved oxygen level observed within Eagle Creek was 5.2mg/L which is below the recommended level for warmwater biota. The lower and middle reaches of Eagle Creek were within the threshold to support warmwater biota. The upper reaches fell below the recommended threshold to support warmwater aquatic biota.
Figure 55 Dissolved oxygen ranges along Eagle Creek
3.3.8.2 Conductivity
Conductivity in streams is primarily influenced by the geology of the surrounding environment, but can vary drastically as a function of surface water runoff. Currently there are no CCME guideline standards for stream conductivity; however readings which are outside the normal range observed within the system are often an indication of unmitigated discharge and/or stormwater input. The average conductivity observed within the main stem of Eagle Creek was 166.8 µs/cm. Figure 56 shows the conductivity readings for Eagle Creek.
Figure 56 Specific conductivity ranges in Eagle Creek
3.3.8.3 pH
Based on the PWQO for pH, a range of 6.5 to 8.5 should be maintained for the protection of aquatic life. Average pH values along Eagle Creek averaged 7.21 thereby meeting the provincial standard (Figure 57).
Figure 57 pH ranges along Eagle Creek
3.3.8.4 Oxygen Saturation (%)
Oxygen saturation is measured as the ratio of dissolved oxygen relative to the maximum amount of oxygen that will dissolve based on the temperature and atmospheric pressure. Well oxygenated water will stabilize at or above 100% saturation, however the presence of decaying matter/pollutants can drastically reduce these levels. Oxygen input through photosynthesis has the potential to increase saturation above 100% to a maximum of 500%, depending on the productivity level of the environment. In order to represent the relationship between concentration and saturation, the measured values have been summarized into 6 classes:
Figure 58 A bivariate assessment of dissolved oxygen concentration (mg/L) and saturation (%) in Eagle Creek
Dissolved oxygen conditions on Eagle Creek were somewhat variable along the system (Figure 58). Sections in the upper reach fell below the guideline to support warmwater biota, however sections in the middle and lower reaches were acceptable for warm/cool water species.
3.3.8.5 Specific Conductivity Assessment
Specific conductivity (SPC) is a standardized measure of electrical conductance, collected at or corrected to a water temperature of 25⁰C. SPC is directly related to the concentration of ions in water, and is commonly influenced by the presence of dissolved salts, alkalis, chlorides, sulfides and carbonate compounds. The higher the concentration of these compounds, the higher the conductivity. Common sources of elevated conductivity include storm water, agricultural inputs and commercial/industrial effluents.
In order to summarize the conditions observed, SPC levels were evaluated as either normal, moderately elevated or highly elevated. These categories correspond directly to the degree of variation (i.e. standard deviation) at each site relative to the average across the system.
Normal levels were maintained along the majority of Eagle Creek; however there was an area in the middle reach and in the extreme lower reach with high and moderate levels of conductivity (Figure 59).
Figure 59 Relative specific conductivity levels along Eagle Creek
3.3.9 Thermal Regime
Many factors can influence fluctuations in stream temperature, including springs, tributaries, precipitation runoff, discharge pipes and stream shading from riparian vegetation. Water temperature is used along with the maximum air temperature (using the Stoneman and Jones method) to classify a watercourse as either warm water, cool water or cold water. Figure 60 shows where the thermal sampling sites were located on Eagle Creek. Analysis of the data collected indicates that Eagle Creek is classified as a warm water system with cool-warm water reaches (Figure 61).
Figure 60 Temperature logger locations along Eagle Creek
Figure 61 Temperature logger data for the sample locations along Eagle Creek
Each point on the graph represents a temperature that meets the following criteria:
Sampling dates between July 1st and September 7th
Sampling date is preceded by two consecutive days above 24.5 °C, with no rain
Water temperatures are collected at 4pm
Air temperature is recorded as the max temperature for that day
3.3.10 Groundwater
Groundwater discharge areas can influence stream temperature, contribute nutrients, and provide important stream habitat for fish and other biota. During stream surveys, indicators of groundwater discharge are noted when observed. Indicators include: springs/seeps, watercress, iron staining, significant temperature change and rainbow mineral film. Figure 62 shows areas where one or more of the above groundwater indicators were observed during stream surveys and headwater assessments.
Figure 62 Groundwater indicators observed in the Eagle Creek catchment
3.3.11 Fish Community
The Eagle Creek catchment is classified as a mixed community of warm, cool and cold water recreational and baitfish fishery with 16 species observed. The following is a list of species observed in the watershed in 2016 and historically (Figure 63). There was a significant reduction in species richness observed in 2016 likely as a result of drought conditions, which can alter species distribution along the creek.
Figure 63 Fish Community sampling observations for 2016
Table 16 contains a list of species observed in the watershed.
Table 16 Fish species observed in the Eagle Lake catchment
Fish Species
Scientific Name
Fish code
Historical
2016
bluegill
Lepomis macrochirus
Blueg
X
X
brassy minnow
Hybognathus hankinsoni
BrMin
X
brook stickleback
Culaea inconstans
BrSti
X
brown bullhead
Ameiurus nebulosus
BrBul
X
bullhead catfish hybrids
Ictaluridae sp.
Hy650
X
central mudminnow
Umbra limi
CeMud
X
creek chub
Semotilus atromaculatus
CrChu
X
golden shiner
Notemigonus crysoleucas
GoShi
X
X
lake trout
Salvelinus namaycush
LaTro
X
largemouth bass
Micropterus salmoides
LmBas
X
X
micropterus sp.
Micropterus sp.
MicSp
X
northern pike
Esox lucius
NoPik
X
X
northern redbelly dace
Chrosomus eos
NRDac
X
pumpkinseed
Lepomis gibbosus
Pumpk
X
rock bass
Ambloplites rupestris
RoBas
X
X
white sucker
Catostomus commersonii
WhSuc
X
yellow perch
Perca flavescens
YePer
X
TOTAL Species
16
6
RVCA staff weighing and measuring fish from Eagle Creek before release
Fyke net set on Eagle Creek at Bobs Lake Road
3.3.12 Migratory Obstructions
It is important to know locations of migratory obstructions because these can prevent fish from accessing important spawning and rearing habitat. Migratory obstructions can be natural or manmade, and they can be permanent or seasonal. Figure 64 shows the migration barriers along Eagle Creek at the time of the survey in 2016. There were five perched culverts and one debris dams along Eagle Creek and various headwater drainage features within the catchment.
Figure 64 Migratory obstructions in the Eagle Lake catchment
3.3.13 Beaver Dams
Overall beaver dams create natural changes in the environment. Some of the benefits include providing habitat for wildlife, flood control and silt retention. Additional benefits come from bacterial decomposition of woody material used in the dams which removes excess nutrient and toxins. Beaver dams can also result in flooding of agricultural lands and may be potential barriers to fish migration. Several beaver dams were identified along Eagle Creek in 2016 as well as two on headwater drainage features in the catchment (Figure 65).
Figure 65 Beaver dam type and locations in the Eagle Lake catchment
3.4 Headwater Drainage Feature Assessment
3.4.1 Headwaters Sampling Locations
The RVCA Stream Characterization program assessed Headwater Drainage Features for the Eagle Lake catchment in 2016. This protocol measures zero, first and second order headwater drainage features (HDF). It is a rapid assessment method characterizing the amount of water, sediment transport, and storage capacity within headwater drainage features (HDF). RVCA is working with other Conservation Authorities and the Ministry of Natural Resources and Forestry to implement the protocol with the goal of providing standard datasets to support science development and monitoring of headwater drainage features. An HDF is a depression in the land that conveys surface flow. Additionally, this module provides a means of characterizing the connectivity, form and unique features associated with each HDF (OSAP Protocol, 2013). In 2016 the program sampled 14 sites at road crossings in the Eagle Lake catchment area (Figure 66).
Figure 66 Location of the headwater sampling site in the Eagle Lake catchment
3.4.2 Headwater Feature Type
The headwater sampling protocol assesses the feature type in order to understand the function of each feature. The evaluation includes the following classifications: defined natural channel, channelized or constrained, multi-thread, no defined feature, tiled, wetland, swale, roadside ditch and pond outlet. By assessing the values associated with the headwater drainage features in the catchment area we can understand the ecosystem services that they provide to the watershed in the form of hydrology, sediment transport, and aquatic and terrestrial functions. The headwater drainage features in the Eagle Lake catchment are all classified as natural and wetland features. Figure 67 shows the feature type of the primary feature at the sampling locations.
Figure 67 Headwater feature types in the Eagle Lake catchment
3.4.3 Headwater Feature Flow
The observed flow condition within headwater drainage features can be highly variable depending on timing relative to the spring freshet, recent rainfall, soil moisture, etc. Flow conditions are assessed in the spring and in the summer to determine if features are perennial and flow year round, if they are intermittent and dry up during the summer months or if they are ephemeral systems that do not flow regularly and generally respond to specific rainstorm events or snowmelt. Flow conditions in headwater systems can change from year to year depending on local precipitation patterns. Figure 68 shows the observed flow condition at the sampling locations in the Eagle Lake catchment in 2016.
Figure 68 Headwater feature flow conditions in the Eagle Lake catchment
A spring photo of the headwater sample site in the Eagle Lake catchment located on Sugar Bush Road
A summer photo of the headwater sample site in the Eagle Lake catchment located on Sugar Bush Road
3.4.4 Feature Channel Modifications
Channel modifications were assessed at each headwater drainage feature sampling location. Modifications include channelization, dredging, hardening and realignments. The Eagle Lake catchment area had a majority of features with no channel modifications with the exception of one site having mixed modifications. Figure 69 shows the channel modifications observed at the sampling locations for the Eagle Lake catchment.
Figure 69 Headwater feature channel modifications in the Eagle Lake catchment
3.4.5 Headwater Feature Vegetation
Headwater feature vegetation is classified into the following types: no vegetation, lawn, wetland, meadow, scrubland and forest. The type of vegetation within the channel influences the aquatic and terrestrial ecosystem values that the feature provides. For some types of headwater features, the vegetation within the feature plays a very important role in flow and sediment movement and provides wildlife habitat. Figure 70 depicts the dominant vegetation observed at the sampled headwater sites in the Eagle Lake catchment.
Figure 70 Headwater feature vegetation types in the Eagle Lake catchment
3.4.6 Headwater Feature Riparian Vegetation
Headwater riparian vegetation evaluates the type of vegetation that is found along the adjacent lands of a headwater drainage feature. The type of vegetation within the riparian corridor influences the aquatic and terrestrial ecosystem values that the feature provides to the watershed. Figure 71 depicts the type of riparian vegetation observed at the sampled headwater sites in the Eagle Lake catchment. The majority of the headwater drainage features are classified as having natural riparian vegetation with only one feature having altered vegetation.
Figure 71 Headwater feature riparian vegetation types in the Eagle Lake catchment
3.4.7 Headwater Feature Sediment Deposition
Assessing the amount of recent sediment deposited in a channel provides an index of the degree to which the feature could be transporting sediment to downstream reaches (OSAP, 2013). Evidence of excessive sediment deposition might indicate the requirement to follow up with more detailed targeted assessments upstream of the site location to identify potential best management practices to be implemented. Sediment deposition ranged from none to substantial for the headwater sites sampled in the Eagle Lake catchment area. Figure 72 depicts the degree of sediment deposition observed at the sampled headwater sites in the Eagle Lake catchment. Sediment deposition conditions ranged from no sediment deposition to extensive.
Figure 72 Headwater feature sediment deposition in the Eagle Lake catchment
3.4.8 Headwater Feature Upstream Roughness
Feature roughness will provide a measure of the amount of materials within the bankfull channel that could slow down the velocity of water flowing within the headwater feature (OSAP, 2013). Materials on the channel bottom that provide roughness include vegetation, wood structure and boulders/cobble substrates. Roughness can provide benefits in mitigating downstream erosion on the headwater drainage feature and the receiving watercourse by reducing velocities. Roughness also provides important habitat conditions for aquatic organisms. Figure 73 shows that the feature roughness conditions at the sampling locations in the Eagle Lake catchment were highly variable ranging from minimal to extreme.
Figure 73 Headwater feature roughness in the Eagle Lake catchment
Land cover and any change in coverage that has occurred over a six year period is summarized for the Eagle Lake catchment using spatially continuous vector data representing the catchment during the spring of 2008 and 2014. This dataset was developed by the RVCA through heads-up digitization of 20cm DRAPE ortho-imagery at a 1:4000 scale and details the surrounding landscape using 10 land cover classes.
4.1 Eagle Lake Catchment Change
As shown in Table 17 and Figure 1, the dominant land cover type in 2014 is woodland.
Table 17 Land cover in the Eagle Lake catchment (2008 vs. 2014)
Land Cover
2008
2014
Change - 2008 to 2014
Area
Area
Area
Ha
Percent
Ha
Percent
Ha
Percent
Woodland*
1780
52
1779
52
-1
Water
880
26
880
26
Wetland **
437
13
437
13
>Unevaluated
(437)
(13)
(437)
(13)
(0)
(0)
Settlement
95
3
96
3
1
Meadow-Thicket
78
2
78
2
Transportation
78
2
78
2
Crop and Pasture
55
2
55
2
* Does not include treed swamps ** Includes treed swamps
From 2008 to 2014, there was an overall change of six hectares (from one land cover class to another). Most of the change in the Eagle Lake catchment is a result of woodland reverting to wetland and the conversion of crop and pastureland to settlement (Figure 74).
Figure 74 Land cover change in the Eagle Lake catchment (2008 to 2014)
Table 18 provides a detailed breakdown of all land cover change that has taken place in the Eagle Lake catchment between 2008 and 2014.
Table 18 Land cover change in the Eagle Lake catchment (2008 to 2014)
Land Cover
Change - 2008 to 2014
Area
Ha.
Percent
Crop and Pasture to Settlement
0.7
52.3
Wooded Area to Unevaluated Wetland
0.6
44.9
Wooded Area to Settlement
<0.1
2.8
4.2 Woodland Cover
In the Environment Canada Guideline (Third Edition) entitled “How Much Habitat Is Enough?” (hereafter referred to as the “Guideline”) the opening narrative under the Forest Habitat Guidelines section states that prior to European settlement, forest was the predominant habitat in the Mixedwood Plains ecozone. The remnants of this once vast forest now exist in a fragmented state in many areas (including the Rideau Valley watershed) with woodland patches of various sizes distributed across the settled landscape along with higher levels of forest cover associated with features such as the Frontenac Axis (within the on-Shield areas of the Rideau Lakes and Tay River subwatersheds). The forest legacy, in terms of the many types of wildlife species found, overall species richness, ecological functions provided and ecosystem complexity is still evident in the patches and regional forest matrices (found in the Tay River subwatershed and elsewhere in the Rideau Valley watershed). These ecological features are in addition to other influences which forests have on water quality and stream hydrology including reducing soil erosion, producing oxygen, storing carbon along with many other ecological services that are essential not only for wildlife but for human well-being.
The Guideline also notes that forests provide a great many habitat niches that are in turn occupied by a great diversity of plant and animal species. They provide food, water and shelter for these species - whether they are breeding and resident locally or using forest cover to help them move across the landscape. This diversity of species includes many that are considered to be species at risk. Furthermore, from a wildlife perspective, there is increasing evidence that the total forest cover in a given area is a major predictor of the persistence and size of bird populations, and it is possible or perhaps likely that this pattern extends to other flora and fauna groups. The overall effect of a decrease in forest cover on birds in fragmented landscapes is that certain species disappear and many of the remaining ones become rare, or fail to reproduce, while species adapted to more open and successional habitats, as well as those that are more tolerant to human-induced disturbances in general, are able to persist and in some cases thrive. Species with specialized-habitat requirements are most likely to be adversely affected. The overall pattern of distribution of forest cover, the shape, area and juxtaposition of remaining forest patches and the quality of forest cover also play major roles in determining how valuable forests will be to wildlife and people alike.
The current science generally supports minimum forest habitat requirements between 30 and 50 percent, with some limited evidence that the upper limit may be even higher, depending on the organism/species phenomenon under investigation or land-use/resource management planning regime being considered/used.
As shown in Figure 75, 52 percent of the Eagle Lake catchment contains 1779 hectares of upland forest and four hectares of lowland forest (treed swamps) versus the 47 percent of woodland cover in the Tay River subwatershed. This is greater than the 30 percent of forest cover that is identified as the minimum threshold required to sustain forest birds according to the Guideline and which may only support less than one half of potential species richness and marginally healthy aquatic systems. When forest cover drops below 30 percent, forest birds tend to disappear as breeders across the landscape.
Figure 75 Woodland cover and forest interior in the Eagle Lake catchment (2014)
4.2.1 Woodland (Patch) Size
According to the Ministry of Natural Resources’ Natural Heritage Reference Manual (Second Edition), larger woodlands are more likely to contain a greater diversity of plant and animal species and communities than smaller woodlands and have a greater relative importance for mobile animal species such as forest birds.
Bigger forests often provide a different type of habitat. Many forest birds breed far more successfully in larger forests than they do in smaller woodlots and some rely heavily on forest interior conditions. Populations are often healthier in regions with more forest cover and where forest fragments are grouped closely together or connected by corridors of natural habitat. Small forests support small numbers of wildlife. Some species are “area-sensitive” and tend not to inhabit small woodlands, regardless of forest interior conditions. Fragmented habitat also isolates local populations, especially small mammals, amphibians and reptiles with limited mobility. This reduces the healthy mixing of genetic traits that helps populations survive over the long run (Conserving the Forest Interior. Ontario Extension Notes, 2000).
The Environment Canada Guideline also notes that for forest plants that do not disperse broadly or quickly, preservation of some relatively undisturbed large forest patches is needed to sustain them because of their restricted dispersal abilities and specialized habitat requirements and to ensure continued seed or propagation sources for restored or regenerating areas nearby.
The Natural Heritage Reference Manual continues by stating that a larger size also allows woodlands to support more resilient nutrient cycles and food webs and to be big enough to permit different and important successional stages to co-exist. Small, isolated woodlands are more susceptible to the effects of blowdown, drought, disease, insect infestations, and invasions by predators and non-indigenous plants. It is also known that the viability of woodland wildlife depends not only on the characteristics of the woodland in which they reside, but also on the characteristics of the surrounding landscape where the woodland is situated. Additionally, the percentage of forest cover in the surrounding landscape, the presence of ecological barriers such as roads, the ability of various species to cross the matrix surrounding the woodland and the proximity of adjacent habitats interact with woodland size in influencing the species assemblage within a woodland.
In the Eagle Lake catchment (in 2014), seventy-two (43 percent) of the 168 woodland patches are very small, being less than one hectare in size. Another 78 (46 percent) of the woodland patches ranging from one to less than 20 hectares in size tend to be dominated by edge-tolerant bird species. The remaining 18 (11 percent of) woodland patches range between 20 and 273 hectares in size. Fifteen of these patches contain woodland between 20 and 100 hectares and may support a few area-sensitive species and some edge intolerant species, but will be dominated by edge tolerant species.
Conversely, three (two percent) of the 168 woodland patches in the drainage area exceed the 100 plus hectare size needed to support most forest dependent, area sensitive birds and are large enough to support approximately 60 percent of edge-intolerant species. Two patches top 200 hectares, which according to the Environment Canada Guideline will support 80 percent of edge-intolerant forest bird species (including most area sensitive species) that prefer interior forest habitat conditions.
Table 19 presents a comparison of woodland patch size in 2008 and 2014 along with any changes that have occurred over that time. In the Eagle Lake catchment, there has been neither an increase or decrease observed in the overall woodland patch area between the two reporting periods.
Table 19 Woodland patches in the Eagle Lake catchment (2008 and 2014)
Woodland Patch Size Range (ha)
Woodland* Patches
Patch Change
2008
2014
2008 to 2014
Number
Area
Number
Area
Number
Area
Count
Percent
Ha
Percent
Count
Percent
Ha
Percent
Count
Ha
Less than 1
71
42
26
1
72
43
26
1
1
1 to 20
78
47
314
18
78
46
314
18
20 to 50
8
5
292
16
8
5
292
16
50 to 100
7
4
478
27
7
4
478
27
100 to 200
1
1
172
10
1
1
172
10
Greater than 200
2
1
501
28
2
1
501
28
Totals
167
100
1783
100
168
100
1783
100
1
*Includes treed swamps
4.2.2 Woodland (Forest) Interior Habitat
The forest interior is habitat deep within woodlands. It is a sheltered, secluded environment away from the influence of forest edges and open habitats. Some people call it the “core” or the “heart” of a woodland. The presence of forest interior is a good sign of woodland health, and is directly related to the woodland’s size and shape. Large woodlands with round or square outlines have the greatest amount of forest interior. Small, narrow woodlands may have no forest interior conditions at all. Forest interior habitat is a remnant natural environment, reminiscent of the extensive, continuous forests of the past. This increasingly rare forest habitat is now a refuge for certain forest-dependent wildlife; they simply must have it to survive and thrive in a fragmented forest landscape (Conserving the Forest Interior. Ontario Extension Notes, 2000).
The Natural Heritage Reference Manual states that woodland interior habitat is usually defined as habitat more than 100 metres from the edge of the woodland and provides for relative seclusion from outside influences along with a moister, more sheltered and productive forest habitat for certain area sensitive species. Woodlands with interior habitat have centres that are more clearly buffered against the edge effects of agricultural activities or more harmful urban activities than those without.
In the Eagle Creek catchment (in 2014), the 168 woodland patches contain 23 forest interior patches (Figure 75) that occupy five percent (158 ha.) of the catchment land area (which is the same as the five percent of interior forest in the Tay River subwatershed). This is below the ten percent figure referred to in the Environment Canada Guideline that is considered to be the minimum threshold for supporting edge intolerant bird species and other forest dwelling species in the landscape.
Most patches (19) have less than 10 hectares of interior forest, nine of which have small areas of interior forest habitat less than one hectare in size. The remaining four patches contain interior forest between 10 and 127 hectares in area. Between 2008 and 2014, there has been neither an increase or decrease observed in the overall area of interior forest habitat in the Eagle Creek catchment (Table 20).
Table 20 Woodland interior in the Eagle Lake catchment (2008 and 2014)
Woodland Interior Habitat Size Range (ha)
Woodland Interior
Interior Change
2008
2014
2008 to 2014
Number
Area
Number
Area
Number
Area
Count
Percent
Ha
Percent
Count
Percent
Ha
Percent
Count
Ha
Less than 1
9
39
3
2
9
39
3
2
1 to 10
10
44
48
30
10
44
48
30
10 to 30
3
13
52
33
3
13
52
33
50 to 100
1
4
55
35
1
4
55
35
Totals
23
100
158
100
23
100
158
100
4.3 Wetland Cover
Wetlands are habitats forming the interface between aquatic and terrestrial systems. They are among the most productive and biologically diverse habitats on the planet. By the 1980s, according to the Natural Heritage Reference Manual, 68 percent of the original wetlands south of the Precambrian Shield in Ontario had been lost through encroachment, land clearance, drainage and filling.
Wetlands perform a number of important ecological and hydrological functions and provide an array of social and economic benefits that society values. Maintaining wetland cover in a watershed provides many ecological, economic, hydrological and social benefits that are listed in the Reference Manual and which may include:
contributing to the stabilization of shorelines and to the reduction of erosion damage through the mitigation of water flow and soil binding by plant roots
mitigating surface water flow by storing water during periods of peak flow (such as spring snowmelt and heavy rainfall events) and releasing water during periods of low flow (this mitigation of water flow also contributes to a reduction of flood damage)
contributing to an improved water quality through the trapping of sediments, the removal and/or retention of excess nutrients, the immobilization and/or degradation of contaminants and the removal of bacteria
providing renewable harvesting of timber, fuel wood, fish, wildlife and wild rice
contributing to a stable, long-term water supply in areas of groundwater recharge and discharge
providing a high diversity of habitats that support a wide variety of plants and animals
acting as “carbon sinks” making a significant contribution to carbon storage
providing opportunities for recreation, education, research and tourism
Historically, the overall wetland coverage within the Great Lakes basin exceeded 10 percent, but there was significant variability among watersheds and jurisdictions, as stated in the Environment Canada Guideline. In the Rideau Valley Watershed, it has been estimated that pre-settlement wetland cover averaged 35 percent using information provided by Ducks Unlimited Canada (2010) versus the 21 percent of wetland cover existing in 2014 derived from DRAPE imagery analysis.
Figure 76 Wetland cover in the Eagle Lake catchment (2014)
Reliable, pre-settlement wetland cover data is unavailable for the Eagle Lake catchment; however, data for the years 2008 and 2014 is available and shows that wetland cover remains unchanged at 13 percent in 2014 (as indicated in Table 21 and shown in Figure 76). To maintain critical hydrological, ecological functions along with related recreational and economic benefits provided by these wetland habitats in the catchment, a “no net loss” of currently existing wetlands should be employed to ensure the continued provision of tangible benefits accruing from them to landowners and surrounding communities.
Table 21 Wetland cover in the Eagle Lake catchment (2014)
Wetland Cover
Pre-settlement
2008
2014
Change - Historic to 2014
Area
Area
Area
Area
Ha
Percent
Ha
Percent
Ha
Percent
Ha
Percent
Eagle Lake
n/a
n/a
437
13
437
13
n/a
n/a
Tay River
n/a
n/a
15280
19
15330
19
n/a
n/a
Rideau Valley
134115
35
n/a
n/a
82076
21
-52039
-39
4.4 Shoreline Cover
The riparian or shoreline zone is that special area where the land meets the water. Well-vegetated shorelines are critically important in protecting water quality and creating healthy aquatic habitats, lakes and rivers. Natural shorelines intercept sediments and contaminants that could impact water quality conditions and harm fish habitat in streams. Well established buffers protect the banks against erosion, improve habitat for fish by shading and cooling the water and provide protection for birds and other wildlife that feed and rear young near water. A recommended target (from the Environment Canada Guideline) is to maintain a minimum 30 metre wide vegetated buffer along at least 75 percent of the length of both sides of rivers, creeks and streams.
Figure 77 shows the extent of the ‘Natural’ vegetated riparian zone (predominantly wetland/woodland features) and ‘Other’ anthropogenic cover (crop/pastureland, roads/railways, settlements) along a 30-metre-wide area of land around Eagle and Leggat Lake, other lakes and along both sides of the shoreline of Eagle Creek and the many unnamed watercourses (including headwater streams) found in the Eagle Lake catchment.
Figure 77 Natural and other riparian land cover in the Eagle Lake catchment (2014)
This analysis shows that the Eagle Lake catchment riparian buffer is composed of woodland (64 percent), wetland (27 percent), settlement (five percent), transportation (two percent), meadow-thicket (one percent) and crop and pastureland (one percent). Along the many watercourses (including headwater streams) flowing into Eagle Lake, the riparian buffer is composed of woodland (56 percent), wetland (38 percent), transportation routes (three percent), crop and pastureland (one percent), meadow-thicket (one percent) and settlement areas (one percent).
Around Eagle Lake itself, the shoreline buffer is dominated by woodland (83 percent) and cottages, houses and camps (11 percent) with the remainder comprised of wetland (four percent), transportation routes (one percent) and meadow-thicket (one percent). Similarly, the shoreline buffer around Leggat Lake is dominated by woodland (79 percent) and cottages and houses (11 percent) with the remainder comprised of wetland (seven percent), roads (two percent) and meadow-thicket (one percent). Along Eagle Creek, the riparian zone is composed of wetland (55 percent), woodland (25 percent), crop and pastureland (11 percent), settlement (five percent), roads (two percent) and aggregates (two percent).
Additional statistics for the Eagle Lake catchment are presented in Tables 22 to 26 and show that there has been little to no change in shoreline cover from 2008 to 2014.
Table 22 Riparian land cover in the Eagle Lake catchment (2008 vs. 2014)
Riparian Land Cover
2008
2014
Change - 2008 to 2014
Area
Area
Area
Ha.
Percent
Ha.
Percent
Ha.
Percent
Woodland
301.02
64.40
300.54
64.30
-0.48
-0.10
Wetland
125.90
26.94
126.38
27.04
0.48
0.10
> Unevaluated
(125.90)
(26.94)
(126.38)
(27.04)
(0.48)
(0.10)
Settlement
21.34
4.57
21.34
4.57
0.00
0.00
Transportation
10.35
2.22
10.35
2.22
0.00
0.00
Meadow-Thicket
5.37
1.15
5.37
1.15
0.00
0.00
Crop & Pasture
3.44
0.74
3.44
0.74
0.00
0.00
Table 23 Riparian land cover around Eagle Lake (2008 vs. 2014)
Riparian Land Cover
2008
2014
Change - 2008 to 2014
Area
Area
Area
Ha.
Percent
Ha.
Percent
Ha.
Percent
Woodland
113.95
83.15
113.95
83.15
0.00
0.00
Settlement
14.40
10.51
14.40
10.51
0.00
0.00
Wetland
5.11
3.73
5.11
3.73
0.00
0.00
> Unevaluated
(5.11)
(3.73)
(5.11)
(3.73)
(0.00)
(0.00)
Transportation
1.81
1.33
1.81
1.33
0.00
0.00
Meadow-Thicket
1.75
1.28
1.75
1.28
0.00
0.00
Table 24 Riparian land cover around Leggat Lake (2008 vs. 2014)
Riparian Land Cover
2008
2014
Change - 2008 to 2014
Area
Area
Area
Ha.
Percent
Ha.
Percent
Ha.
Percent
Woodland
24.73
79.02
24.73
79.02
0.00
0.00
Settlement
3.51
11.21
3.51
11.21
0.00
0.00
Wetland
2.03
6.50
2.03
6.50
0.00
0.00
> Unevaluated
(2.03)
(6.50)
(2.03)
(6.50)
(0.00)
(0.00)
Transportation
0.66
2.12
0.66
2.12
0.00
0.00
Meadow-Thicket
0.35
1.15
0.35
1.15
0.00
0.00
Table 25 Riparian land cover along Eagle Creek (2008 vs. 2014)
Riparian Land Cover
2008
2014
Change - 2008 to 2014
Area
Area
Area
Ha.
Percent
Ha.
Percent
Ha.
Percent
Wetland
16.94
74.85
16.94
74.85
0.00
0.00
> Unevaluated
(16.94)
(74.85)
(16.94)
(74.85)
(0.00)
(0.00)
Woodland
4.47
19.75
4.47
19.75
0.00
0.00
Transportation
0.91
4.04
0.91
4.04
0.00
0.00
Settlement
0.31
1.36
0.31
1.36
0.00
0.00
Table 26 Riparian land cover along streams in the Eagle Lake Catchment (2008 vs. 2014)
5.0 Eagle Lake Catchment: Stewardship and Water Resources Protection
The RVCA and its partners are working to protect and enhance environmental conditions in the Tay River Watershed. Figure 78 shows the location of all stewardship projects completed in the Eagle Lake catchment.
Figure 78 Stewardship site locations in the Eagle Lake catchment
5.1 Rural Clean Water
The Rural Clean Water Program provides technical and financial assistance to farmers and other rural landowners, to aid in the implementation of projects that protect water quality. Funding is granted to those projects that support best management practices for application in the protection and improvement of surface and ground water resources. The program also supports climate change adaptation and low impact development projects as well as educating rural landowners about environmental stewardship of private property. Examples of supported projects include livestock exclusion fencing, controlled tile drainage, cover crops, erosion control, well related projects, and many more. For a list of eligible projects and to apply for funding, see Rural Clean Water.
In the Eagle Lake catchment from 2011 to 2016, one erosion control projects was completed; prior to this, one well upgrade had been completed. Total value of the two projects is $30,685 with $4,000 of that amount funded through grant dollars from the RVCA.
5.2 Private Land Forestry
Forest cover and tree planting continues to be one of the most widely supported strategies to improve our environment. The many benefits of forest cover include carbon sequestration, flood mitigation and water quality improvement as well as providing wildlife habitat.
Through the RVCA's Trees for Tomorrow Program (and its predecessors), 2,000 trees were planted at two sites resulting in the reforestation of one hectare. Total project value of the two projects in the Eagle Lake catchment is $1,575 with $1,305 of that amount coming from fundraising sources. For more information about the Program and landowner eligibility, please see the following: Tree Planting in the Rideau Valley Watershed and Trees for Tomorrow.
An additional 34 butternut trees were planted through the RVCA Butternut Recovery Program as part of efforts to introduce healthy seedlings from tolerant butternuts into various locations across Eastern Ontario.
5.3 Shoreline Naturalization
Natural shoreline buffers rich in native plants are critically important to protecting the health of our lakes, rivers and streams. Shoreline vegetation protects water quality and aquatic habitat by intercepting potentially harmful contaminants such as nutrients, pollutants and sediment, regulating water temperatures, slowing runoff and providing important fish and wildlife habitat. Natural shorelines also help improve climate change resiliency by increasing flood storage and providing protection from erosion during extreme weather events.
Though the RVCA’s Shoreline Naturalization Program, landowners (private and public property owners) have naturalized more than 2.3 km of shoreline in the Tay Watershed by planting over 10,563 native trees and shrubs at 96 sites since 2008. In the Eagle Lake catchment, a total of 190 native trees and shrubs have been planted along 106 metres of shoreline at an average buffer width of three metres for a total project value of $1,569.
5.4 Fish and Wetland Habitat
One of the primary sites for Lake Trout spawning at Eagle Lake is the extensive shoals opposite Camp Oconto. With Ontario Ministry of Natural Resources & Forestry (OMNRF) approval, rehabilitation of this shoal was undertaken in 2006. Eagle Lake Property Owners’ Association volunteers, along with stewardship rangers from the Frontenac Stewardship Council, shoveled approximately 50 tons of suitably sized rocks onto three sites of this shoal. Spawning activity at this shoal has been directly observed by OMNRF staff in the fall of 2014 and 2015.
An OMNRF-directed creel survey in the spring and summer of 2010 indicated self-sustaining populations of Smallmouth and Largemouth Bass, as well as Northern Pike.
In 2008, OMNRF initiated a program (referred to as Broad-scale Monitoring) to assess the health of fish populations by conducting netting surveys. At Eagle Lake in 2008, 32 sites were surveyed and 13 different fish species netted, including 5 Lake Trout (4 stocked and 1 natural fish). The second survey in 2014 collected 14 species at 30 sites, but no Lake Trout. Broad-scale monitoring was again done at Eagle Lake in 2018 with 44 sites surveyed that netted 16 different fish species including one natural Lake Trout.
According to OMNRF records, Eagle Lake has been stocked with Lake Trout 49 times since 1917. It was last stocked in 1994.
On two occasions, Eagle Lake has had a netting survey specifically to assess the Lake Trout population. This involves setting nets at multiple locations at the proper depth based on water temperature to ensure optimal net placement. In the spring of 1999, nets at 30 widely distributed sites netted 54 Lake Trout only one of which was a natural fish. Of the 53 stocked Lake Trout, their weight class indicated that about 80 percent likely resulted from the last stocking in 1994. A similarly conducted netting survey in the summer of 2016 netted only one large Lake Trout.
5.5 Valley, Stream, Wetland and Hazard Lands
The Eagle Lake catchment covers 34 square kilometres and contains nine square kilometres of wetland along with 64.3 kilometres of stream. None of these natural features are subject to the regulation limit of Ontario Regulation 174/06 (Figure 79) for the protection of wetland areas and river or stream valleys that are affected by flooding and erosion hazards.
For areas where no regulation limit exists, protection of the catchment’s watercourses is provided through the “alteration to waterways” provision of the regulation.
Figure 79 Regulated natural features and hazards in the Eagle Lake catchment
5.6 Vulnerable Drinking Water Areas
Mississippi-Rideau Source Water Protection program has mapped a small part of the catchment as a Significant Groundwater Recharge Areas and all of the catchment as a Highly Vulnerable Aquifer. This means that the nature of the overburden (thin soils, fractured bedrock) does not provide a high level of protection for the underlying groundwater making the aquifer more vulnerable to contaminants released on the surface. There are no Well-Head Protection Areas in the catchment.
The Mississippi-Rideau Source Protection Plan includes policies that focus on the protection of groundwater region-wide due to the fact that most of the region, which encompasses the Mississippi and Rideau watersheds, is considered Highly Vulnerable Aquifer. For detailed maps and policies that have been developed to protect drinking water sources, visit the Mississippi-Rideau Source Protection Region website.
Developed by the Eagle Lake Property Owners' Association and its partners, the State of the Lake Report - Eagle Lake (2010) and State of the Lake Report - Eagle Lake Update 2015 provide information on many aspects of the lake environment, as well as issues of concern and actions to be taken to maintain and improve the long-term health of the lake. The following list includes some of the accomplishments of the Eagle Lake Property Owners' Association and residents that have implications for the well-being of the land and water resources of the lake ecosystem. Specific achievements of the Eagle Lake community are indicated by an asterisk.
Eagle Lake and Catchment Health
Shoreline Planting
190 native trees and shrubs have been planted by the RVCA Shoreline Naturalization Program at an average buffer width of three metres along 106 metres of shoreline.
Shoreline Vegetation Survey
Mapping of the abundance of aquatic plants was carried out along the shoreline of Eagle Lake in September 2015, as part of a Carleton University - RVCA sponsored research project.*
Tree Planting
2000 trees have been planted at two sites in the Eagle Lake catchment by the RVCA Private Land Forestry Program, resulting in the reforestation of one hectare.
As part of the Butternut Tree Recovery Program sponsored by RVCA, six saplings were planted at two locations at the north end of the lake in 2016 and a further 21 at six different sites in 2017.*
Water Levels
Access to the CPR culvert and associated beaver dam on Eagle Creek was obtained from South Frontenac Township in September 2015. A local contractor was subsequently hired to regularly remove the beaver dam located at the opening of the culvert running below the CPR track over Eagle Creek and also to maintain two additional beaver dams along Eagle Creek south of the CPR track. These recent steps and regular trips made by Ministry of Natural Resources & Forestry (MNRF) staff to adjust the outflow through the control dam have gradually stabilized the level of Eagle Lake.*
MNRF staff from Kingston office repaired concrete foundation of the control dam in 2016 and will provide further improvements to the dam and an additional staff gauge in 2019 to enable better control of lake levels. At that time, a HOBO gauge was installed by the province to further enable control of seasonal lake levels, which now allows MNRF staff to see when the creek;s water level has risen, indicating that some action should be considered to restore normal seasonal lake water levels. The gauge provides continuous monitoring of water levels and temperature with data access via a satellite feed available online.*
In 2010, Rideau Valley Conservation Authority installed a water level gauge on a lakeshore property that is regularly monitored by the land owner with data provided to RVCA.*
To better manage water levels, in 2018 a site-visit consultation was arranged with Ducks Unlimited for possible installation of a beaver baffler at the largest beaver dam on Eagle Creek. An equipment/installation quotation was provided by this organization.*
Water Quality
RVCA derived water quality data for Leggat Lake was included in the 2015 State of the Lake Report (it has no lake association but flows into Eagle Lake).*
Microscopic examination, following a filamentous green algal bloom in Curl’s Bay in 2016 on Eagle Lake, reveals many types of green algae as well as 10 species of cyanobacteria, some of which can produce toxins.*
Township of Central Frontenac will implement a septic re-inspection program (mandatory/voluntary) in 2019. The initial phase will involve lake-front properties at Eagle Lake. The service is to be provided by the Mississippi-Rideau Septic System Office.
In the summer of 2014, using a commercially operated barge pump-out service, six water access-only property owners voluntarily had their septic tanks emptied and inspected. RKY Camp completed an extensive septic system treatment replacement in 2018.*
Eagle Lake and Leggat Lake are each sampled yearly by the RVCA for five parameters, four times a year along with one stream sampling site on Eagle Creek being sampled for 22 parameters, six times a year to assess surface chemistry water quality conditions.
One Ontario Benthic Biomonitoring Network site on Eagle Creek is sampled yearly by the RVCA with three replicates to assess instream biological water quality conditions.
One Rural Clean Water Program project has been completed by the RVCA Rural Clean Water Program.
Eagle Lake and Catchment Habitat
Broad-Scale Fish Community Monitoring
Eagle Lake has been designated by MNRF as one of the Ontario lakes to be assessed every five years through their broad-scale monitoring program. At Eagle Lake, fish population census was assessed through multiple site nettings in both 2008 and 2014 with 14 species identified. In 2008, five Lake Trout were netted (one approximately 25 years old), but none in the 2014 netting series.
For a number of years, Department of Civil Engineering staff and students at Queen’s University (one staff member with a family cottage at Eagle Lake) collected data from a buoy anchored at the deep point, installed a weather station on a small island, and obtained a lake-bottom sediment core. Information from this type of data, along with RVCA water quality results from Eagle Lake, has resulted in three published scientific papers and two MSc theses.*
Flora Identification
An illustrated catalogue of Wildflowers of the Eagle Lake Regionconsisting of over 400 wildflowers, shrubs, ferns and grasses in the immediate area of Eagle Lake has been developed. A university student living at Eagle Lake has collected and archived 100 marsh, wetland and shoreline plant species in the local environment. Some of the various trees at Eagle Lake have been documented.*
Habitat Surveillance
Eagle Creek drone videos were taken in September 2017 by staff and students of Granite Ridge Education Centre in Sharbot Lake along with an additional drone survey carried out in March 2018 of an area of the creek with a large beaver dam . These provide better appreciation of the topography of this region as it is not readily accessible and locates beaver lodges and dams. GIS mapping files are also available as part of this project.*
Heronry Monitoring
In 2009, it was noted that a number of Great Blue Herons had established a communal nesting site at the north end of the lake. Herons normally nest in trees, and there have been up to 13 nests at this site. Generally, each nest contains two to three chicks.*
In-stream Habitat
2.7 kilometres of Eagle Creek have been surveyed and 14 headwaters sites were sampled by the RVCA Stream Characterization Program.
Invasive Species Control
For a number of years, Purple Loosestrife was controlled by a combination of manual removal and introduction of the beetle Neogalerucella calmariensis, but has since recurred mainly at one site and requires reintroduction of this beetle species. European Frogbit has been adequately controlled at numerous sites.. From 2010 to 2015, a concerted effort was made to manually cull this species at a number of sites. Volunteers from the Eagle Lake Property Owners’ Association, counsellors from RKY Camp, and high-school students with the Stewardship Rangers Program manually removal large quantities of this plant. As a result, only small numbers of European Frogbit plants remain at one or two locations.*
Lake Partner Program
This sampling of lake water for Total Phosphorus and Secchi disk depth takes place each May in 550 Ontario lakes. It is sponsored by the Ontario Ministry of Environment, Conservation & Parks. Volunteers at Eagle Lake have sampled annually since 1996. Results have been consistently favourable.*
Lake Trout Population Monitoring
A summer protocol of setting gill nets at 30 different locations was carried out by MNRF to assess the status of the Lake trout population in a 2016 survey. No Lake Trout were netted, a result of some concern. A spring-time netting protocol (also with 30 gill nets) performed in 1999 netted 54 Lake Trout (only one natural fish).*
Loon Surveys
Through a Common Loon survey coordinator and volunteers, Eagle Lake has a record of 18 years of Common Loon monitoring data including breeding pair success in raising chicks. During that time frame, there have been 74 pairs observed, resulting in 45 chicks surviving a minimum of 6 weeks; a reasonable success rate. Results are provided annually to the Canadian Lakes Loon Survey, a program of Birds Studies Canada.*
Eagle Lake Property Owners' Association Leadership
The Eagle Lake Property Owners' Association continues to liaise with other local lake associations through its participation in the Lake Networking Group.*
Developed by the Eagle Lake Property Owners’ Association and its partners, the second Eagle Lake State of the Lake Report (2015) provides information on many aspects of the lake environment, as well as issues of concern identified by the lake community that could threaten the long-term health of the lake. The following list includes some of those identified issues that have implications for the water and land resources of the lake ecosystem. Specific issues noted by the lake community are indicated by an asterisk.
Development
Waterfront property development is occurring primarily through the transformation of traditional, seasonal cottages into larger year-round dwellings. This transition is taking place either through re-development of an existing cottage lot or incremental alterations (additions, sleeping cabins, gazebos, decks, sheds, boat houses, garages, lawns, shoreline modifications, docks), all of which may put additional stress on the sensitive shoreline zone and the lake along with potential, added septic system loading.
Many waterfront properties contain existing non-conforming dwellings with respect to minimum water frontage and lot area and are often located within 30 metres of the water that require minor variances for expansion and/or reconstruction of dwellings where standard development setbacks from water are difficult to achieve. In these cases, of which there are many, staff at the Township of Central Frontenac and the Conservation Authority often meet with resistance and push back when attempts are made to implement standards for development setbacks, vegetated shorelines and septic systems.
Monitoring implementation of conditions of planning and regulatory approvals is challenging due to a lack of resources.
Headwaters/In-Water Habitat/Shorelines
Maintaining and enhancing Lake Trout populations at Eagle Lake (the number of fishermen trolling for Lake Trout has markedly decreased). Natural recruitment appears limited. Accumulating evidence from specific netting protocols, along with ending periodic stocking of lake trout in 1994, suggests there are decreasing numbers of Lake Trout.*
Relative to its dissolved oxygen level, Eagle Lake (but not Leggat Lake) is classified by MNR and MOE as a highly-sensitive Lake Trout lake. Its metalimnion layer where Dissolved Oxygen is above 7 mg/L (minimum for juvenile trout) has been declining in thickness with global warming, although improving slightly in 2016.*
Manual removal of the invasive European Frogbit at multiple sites has been quite successful and only minimal plants remain at limited sites. But since the 2012/2013 seasons, Purple Loosestrife has extensively recurred at Oconto Creek where it empties into Eagle Lake.*
Littoral zone mapping identifying substrate type, vegetation and habitat features along with opportunities for shoreline enhancement is unavailable for Eagle and Leggat Lake.
Land Cover
Wetlands cover 13 percent (437 ha.) of the catchment (in 2014). One hundred percent (437 ha.) of these wetlands remain unevaluated and unregulated and although they are not under imminent threat from development activity, they do remain vulnerable to drainage and land clearing activities in the absence of any regulatory and planning controls that would otherwise protect them for the many important hydrological, social, biological and ecological functions/services/values they provide to landowners and the surrounding community (see Section 4.3 of this report).
Water Quality
Eagle Creek surface chemistry water quality rating ranges from Fair to Good (see Section 2.3 of this report).
Eagle Lake surface chemistry water quality does not exhibit any sampling concerns (see Section 2.2 of this report).
Leggat Lake surface chemistry water quality rating ranges from Fair to Good (see Section 2.1 of this report).
Eagle Creek instream biological water quality conditions range from Poor to Fair (at the Bobs Lake Road crossing)(see Section 3.3.1 of this report).
No septic system re-inspection program (mandatory or voluntary) is in effect, currently.*
Water Levels
Beaver dam issues continue at the CPR crossing downstream of the MNR control structure on Eagle Creek. Further improvements to lake level control can only be achieved if flow along Eagle Creek can be stabilized by controlling beaver activities.*
The 1:100 year flood elevation is unavailable for Eagle Lake. It can be utilized as an additional factor to be considered when assessing site specific development setbacks.
Developed by the Eagle Lake Property Owners’ Association and its partners, the State of the Lake Report - Eagle Lake Update 2015 provides information on many aspects of the lake environment, as well as actions to maintain and improve the long-term health of the lake. The following list includes some of those identified actions that have implications for the land and water resources of the lake ecosystem. Specific actions noted by the Eagle Lake community are indicated by an asterisk.
Eagle Lake and Catchment Health
Development
Work with approval authorities (Central Frontenac Township, Frontenac County, Kingston Frontenac Lennox and AddingtonHealth Unit, Mississippi Rideau Septic System Office, RVCA and South Frontenac Township) and waterfront property owners (including the Eagle Lake Property Owners' Association and Leggat Lake community) to consistently implement current land use planning and development policies for water quality and shoreline protection adjacent to Eagle and Legatt Lake, Eagle Creek and headwater streams in the catchment (i.e., a minimum 30 metre development setback from water).
Explore ways and means to more effectively enforce and implement conditions of land-use planning and development approval to achieve net environmental gains (particularly with respect to rehabilitating or protecting naturally vegetated shorelines and water quality).
Encourage Committee of Adjustment to take advantage of technical and environmental information and recommendations forthcoming from planning and environmental professionals.
Municipalities in the Tay Watershed are encouraged to strengthen natural heritage and water resources official plan policies and zoning provisions (pertaining to water setbacks, frontage and naturalized shorelines and wetland protection) where deemed appropriate.
Work with Central Frontenac Township, Frontenac County, South Frontenac Township and agencies to ensure that development approvals around lakes and along watercourses take into consideration the protection of fish habitat (including the near-shore nursery and spawning habitat).
Municipal and agency planners together with development proponents are to use the 2014 Site Evaluation Guidelines to inform decision-making about the application of development setbacks on lots with shallow soils/bedrock, steep slopes and sparse vegetation cover along with the use of the appropriate, development related, best management practices.
Utilize RVCA subwatershed and catchment reports to help develop/revise official plan policies to protect surface water resources and the natural environment (including woodlands, wetlands and shoreline cover).
Establish RVCA regulation limits around the 100 percent (437 ha.) of wetlands in the catchment that are unevaluated. Doing this will help protect landowners from natural hazards including mitigating surface water flow by storing water during periods of peak flow (such as spring snowmelt and heavy rainfall events) and releasing water during periods of low flow (this mitigation of water flow reduces flood damage), as well as contributing to the stabilization of shorelines and to the reduction of soil erosion damage through water flow mitigation and plant soil binding/retention.
Shorelines
Take advantage of the RVCA Shoreline Naturalization Program to re-naturalize altered creek, lake and stream shoreline identified in this report as “Unnatural Riparian Land Cover". Consider concentrating stewardship efforts on Eagle Lake waterfront properties shown in orange on the Riparian Land Cover map (see Figure 77 in Section 4.4 in this report).Other stewardship opportunities in the catchment may be determined based on septic system inspections and surface water quality monitoring results.
Promote the use of bioengineering methods (using native shrub/tree planting, fascines, live stakes) as a shoreline erosion mitigation measure as well as a cost effective alternative to shoreline hardening (with rip rap, armour stone, gabion baskets, walls)
Educate landowners about the value and importance of natural shorelines and property best management practices with respect to shoreline use and development, septic system installation and maintenance and shoreline vegetation retention and enhancement (Central Frontenac Township, Eagle Lake Property Owners’ Association, Frontenac County, Leggat Lake community, Kingston Frontenac Lennox and AddingtonHealth Unit, Mississippi Rideau Septic System Office, RVCA and South Frontenac Township).
Water Quality
Consider further investigation of the Poor to Fair instream biological water quality conditions in Eagle Creek, as part of a review of RVCA's Watershed Watch, Baseline and Benthic Invertebrate surface water quality monitoring.
Offer funding provided by the RVCA Rural Clean Water Program to landowners with potential projects that could improve water quality on Eagle and Lleggat Lakes and their tributaries (e.g., livestock fencing, septic system repair/replacement and streambank erosion control/stabilisation).
Educate waterfront property owners about septic system care by providing information about sewage system maintenance (i.e., when to pump out septic systems and holding talks) through initiatives such as the Septic Savvy Workshop and services provided by the Mississippi Rideau Septic System Office.
Reduce pollutant loadings to Eagle Lake through education about the application of shoreline, stormwater and agricultural best management practices; also consider using low impact development (LID) methods to improve the quality and reduce the amount of stormwater runoff directly reaching the lake ecosystem. This will be particularly beneficial in areas with extensive impervious surfaces (i.e., asphalt, concrete, buildings, and severely compacted soils) or on sensitive waterfront properties (with steep slopes/banks, shallow/impermeable soils).
Eagle Lake and Catchment Habitat
Aquatic Habitat/Fisheries/Wildlife
Eagle Lake Property Owners’ Association will continue to interact with staff at MNR to see if, following recent investigations, stocking of Lake Trout can be resumed. Rehabilitation of the potential spawning sites identified at the north end of the lake might also be given consideration. MNR will also ensure that Eagle Lake remains on the list of lakes that should be considered for lake trout habitat rehabilitation.*
Resume Purple Loosestrife manual removal and perhaps release of the Neogalerucella species of beetles, particularly at the Oconto Creek site where major regrowth of this plant has occurred. These beetles were released at this site in 2005 with much success*.
Arrange for a second phase of drone mapping of the lower sections of Eagle Creek to assist with fish and wildlife habitat improvement (and other initiatives).*
Educate waterfront property owners about: 1) fish habitat requirements, spawning timing and near-shore and in-water activities that can disturb or destroy fish habitat and spawning sites 2) the causes of excessive algae and aquatic vegetation growth (see the RVCA publication entitled Algae and Aquatic Plant Educational Manual) and 3) healthy lake ecosystems and associated water level fluctuations in a natural environment.
Eagle Lake Property Owners’ Association Leadership
Lake Planning
Eagle Lake Property Owners' Association is leading the coordination of the implementation of the recommendations of the State of the Lake Report - Eagle Lake Update 2015.
Use the information contained in the Tay River Subwatershed Report 2017 and Eagle Lake Catchment Report 2017 to assist with implementation of the State of the Lake Report - Eagle Lake Update 2015.
Water Levels
Possible better control of lake water levels on Eagle Lake by installing beaver bafflers at two additional and extensive beaver dams on Eagle Creek. A meeting has been arranged with a representative of Ducks Unlimited for advice on beaver bafflers. Additional meetings should be arranged to discuss beaver bafflers with board members of the Greater Bobs and Crow Lakes Association, since a rehabilitated walleye spawning bed is located where Eagle Creek empties into Bobs Lake.*
The RVCA produces individual reports for 14 catchments in the Tay River subwatershed. Using data collected and analyzed by the RVCA through its watershed monitoring and land cover classification programs, surface water quality and in-stream conditions are reported for the Tay River, Tay Watershed lakes and Tay tributaries along with a summary of environmental conditions for the surrounding countryside every six years, which includes analysis of data collected through the programs along with local information provided by stakeholders up to 2017.
This information is used to better understand the effects of human activity on our water resources, allows us to better track environmental change over time and helps focus watershed management actions where they are needed the most to help sustain the ecosystem services (cultural, aesthetic and recreational values; provisioning of food, fuel and clean water; regulation of erosion/natural hazard protection and water purification; supporting nutrient/water cycling and habitat provision) provided by the catchment’s lands and forests and waters (Millennium Ecosystem Assessment 2005).
The following sections of this report are a compilation of that work for the Elbow Lake catchment.
57 square kilometres; occupies seven percent of the Tay River subwatershed; one percent of the Rideau Valley watershed.
Geology/Physiography
Elbow Lake catchment resides within part of the physiographic region known as the Algonquin Highlands. In the Tay River subwatershed, this ancient and hilly geologic region is made up of such Precambrian rocks as marble, conglomerates, and dark or colour banded granite-like rocks. A veneer of glacial drift (glacial till, sand etc.) overlies the bedrock and a geologic fault may run north-south through the eastern section of the catchment.
Municipal Coverage
Central Frontenac Township: (55 km2; 97% of catchment)
South Frontenac Township: (2 km2; 3% of catchment)
Stream Length
All tributaries (including headwater streams): 160 km
1.2 Vulnerable Areas
Aquifer Vulnerability
Mississippi-Rideau Source Water Protection program has mapped the northern part of the catchment as a Significant Groundwater Recharge Areas and all of the catchment as a Highly Vulnerable Aquifer. There are no Well-Head Protection Areas in the catchment.
Wetland Hydrology
A watershed model developed by the RVCA in 2009 was used to study the hydrologic function of wetlands in the Rideau Valley Watershed, including those found in the Elbow Lake catchment.
1.3 Conditions at a Glance
Aggregates
Two aggregate licenses in the catchment.
Fish Community/Thermal Regime
Warm and cool water recreational and baitfish fishery with 20 species observed in Fish Creek during 2016.
Headwater Drainage Features
Predominantly natural and wetland features with the majority of them having no anthropogenic modifications. Four features had mixed modifications while two features have been straightened, historically.
Instream/Riparian Habitat
Fish Creek: Low to high habitat complexity with increased habitat complexity observed in the lower and middle reaches of the system within the catchment. Dissolved oxygen conditions on Fish Creek are variable along the system with sections in the middle reach below the guideline to support warmwater biota; however, sections in the upper and lower reaches are acceptable for warmwater species.
Land Cover Change (2008 to 2014)
Catchment
Woodland
Crop-Pasture
Settlement
Wetland
Hectares
-6
-1
+4
+2
Land Cover Type (2014)
Catchment
Woodland
Wetland
Crop-Pasture
Water
Meadow-Thicket
Transportation
Settlement
Percent
54
27
8
4
2
2
2
Shoreline Cover Type (30 m. riparian area; 2014)
Catchment
Percent
Elbow Lake
Percent
Fish Creek
Percent
Streams*
Percent
Wetland
52
Woodland
69
Wetland
79
Wetland
51
Woodland
37
Settlement
19
Woodland
19
Woodland
37
Crop-Pasture
6
Wetland
12
Transportation
1
Crop-Pasture
8
Transportation
2
---
---
Meadow-Thicket
6
Transportation
2
Settlement
2
---
---
Crop-Pasture
3
Meadow-Thicket
1
Meadow-Thicket
1
---
---
Settlement
---
Settlement
1
*Excludes Fish Creek
Significant Natural Features
Fish Creek Non-Provincially Significant Wetland
Species at Risk (Elemental Occurrence)
Threatened
Special Concern
Blanding's Turtle
Common Five-lined Skink
Bobolink
Louisiana Waterthrush
Cerulean Warbler
Snapping Turtle
Eastern Meadowlark
---
Eastern Whip-poor-will
---
Water Quality for the Protection of Aquatic Life (2006 to 2017)
Water Quality Source
Elbow Lake
Fish Creek
Surface Chemistry
Very Poor to Poor
Fair
Instream Biological
---
Poor to Good
Fish Creek: Benthic invertebrate samples are sensitive during certain years and change to species that are more tolerant of high organic pollution levels during other years.
Water Wells
Approximately 200 operational private water wells in the Elbow Lake catchment. Groundwater uses are mainly domestic but also include livestock, public and commercial water supplies and monitoring wells.
1.4 Catchment Care
Environmental Management
The Elbow Lake (Parham) Association prepared the Elbow Lake Stewardship Plan (2012) to provide a summary of what is currently known about the Elbow Lake catchment along with the community’s vision for the lake and a list of its main concerns and actions to address them.
Development in, and adjacent to, the Fish Creek Non-Provincially Significant Wetland in the catchment is subject to Ontario Regulation 174-06 (entitled “Development, Interference with Wetlands and Alterations to Shorelines and Watercourses”), which protects the hydrologic function of the wetland and also protects landowners and their property from natural hazards (flooding, fluctuating water table, unstable soils) associated with it.
One Environmental Compliance Approval was sought for a municipal waste disposal site in the catchment.
Environmental Monitoring
Chemical surface (in-stream) water quality collection by the RVCA since 2003 (see Section 2 of this report).
Benthic invertebrate (aquatic insect) surface (in-stream) water quality collection by the RVCA since 2003 (see Section 3.3.1 of this report).
Fish survey and stream characterization survey by the RVCA on Fish Creek in 2016 included taking measurements and recording observations on instream habitat, bank stability, other attributes and preparing a temperature profile (see Section 3 of this report).
Elbow Lake shoreline assessed as majority ornamental (28 properties; 39 percent); majority natural (23 properties; 32 percent) and majority regenerative (21 properties; 29 percent) by the Watersheds Canada Love Your Lake Program.
Twenty-seven headwater drainage feature assessments were conducted in 2016 at road crossings in the catchment. The protocol measures zero, first and second order headwater drainage features and is a rapid assessment method characterizing the amount of water, sediment transport, and storage capacity within headwater drainage features. (see Section 3.4 of this report).
Classification of Elbow Lake catchment land cover types derived by the RVCA from colour aerial photography that was acquired during the spring of 2008 and 2014 (see Section 4.1). (see Section 4.1 of this report).
Groundwater chemistry information is available from the Ontario Geological Survey for two wells (#13-AG-031 and #13-AG-042) located in the catchment.
Stewardship
Seven stewardship projects were completed by landowners with assistance from the RVCA (see Section 5 of this report).
2.0 Elbow Lake Catchment: Water Quality Conditions
Surface water quality conditions in the Elbow Lake catchment are monitored by the Rideau Valley Conservation Authority’s (RVCA) Watershed Watch Program and Baseline Water Quality Monitoring Program. Watershed Watch monitors watershed lakes to assess nutrient concentrations, water clarity, dissolved oxygen availability and pH. The baseline water quality program focuses on streams; data is collected for 22 parameters including nutrients (total phosphorus, total Kjeldahl nitrogen and ammonia), E. coli, metals (like aluminum and copper) and additional chemical/physical parameters (such as alkalinity, chlorides, pH and total suspended solids). Figure 2 shows the locations of monitoring sites in the catchment. Figure 2 shows the locations of monitoring sites in the catchment.
Figure 2 Water quality monitoring sites on Elbow Lake and Fish Creek
Water Quality Rating in the Elbow Lake Catchment
Water quality ratings for Tay River Subwatershed lakes, the Tay River and streams are made up of many water quality parameters blended together to allow water quality to be represented across a range of categories from Very Poor, to Poor, Fair, Good and Very Good. This is based on the Canadian Council of Ministers of the Environment Water Quality Index (CCME WQI) and guidelines for the protection of aquatic life; it does not reflect the suitability of water quality conditions for recreational uses such as swimming or other water sports.
The water quality ratings across this catchment ranges from "Very Poor to Good" (Table 1). A “Very Poor” rating indicates that water quality is almost always threatened or impaired; conditions usually depart from natural or desirable levels. A “Poor” rating indicates that water quality is frequently threatened or impaired; conditions often depart from natural or desirable levels. A "Fair" rating indicates that water quality is usually protected but is occasionally threatened or impaired; conditions sometimes depart from natural or desirable levels. A rating of "Good" indicates that only a minor degree of threat or impairment is observed and conditions rarely depart from natural or desirable levels. Each parameter is evaluated against established guidelines to determine water quality conditions. Those parameters that frequently exceed guidelines are presented below. Data has been analyzed over the 2006-2017 period for general trends and conditions. Table 1 shows the overall rating for the monitored surface water quality sites within the catchment and Table 2 outlines the Water Quality Index (WQI) scores and their corresponding ratings.
Table 1 Water Quality Index ratings for the Elbow Lake Catchment
Site
Location
2006-2008
2009-2011
2012-2014
2015-2017
DP1
Elbow Lake
Poor (47)
Poor (53)
Poor (53)
Very Poor (34)
FIS-03
Fish Creek at Long Lake Rd
Good (83)
Fair (67)
Fair (78)
Fair (69)
FIS-A
Fish Creek upstream of Bobs Lake
Poor (58)
Fair (76)
Good (86)
Good (81)
Table 2 Water Quality Index ratings and corresponding index scores (RVCA terminology, original WQI category names in brackets)
Rating
Index Score
Very Good (Excellent)
95-100
Good
80-94
Fair
65-79
Poor (Marginal)
45-64
Very Poor (Poor)
0-44
2.1 Elbow Lake Water Quality
Surface water quality conditions in Elbow Lake have been monitored by RVCA’s Watershed Watch Program since 2004. Data from the deep point site (DP1) have been used to calculate the WQI rating for Elbow Lake, which averaged “Very Poor-Poor” over the 2006-2017 period (Table 1). Moderate nutrient concentrations and periods of limited oxygen availability influenced this rating. While the WQI is a useful tool in summarizing and comparing water quality conditions across a range of sites, it does not highlight the unique conditions of individual waterbodies. Elbow lake is one of a few smaller lakes in the upper watershed that are fed by nutrient rich wetlands and are shallow in depth. As a result, some of these smaller lakes, including Elbow, received a lower water quality rating due to naturally occurring elevated nutrient levels. It should also be noted that bacterial counts for Elbow Lake, which are not used in calculating the WQI rating, were very low and do not provide any indication of impairment for recreational use. The following discussion explains how each of the monitored water quality parameters contributes to the lake’s water quality.
This report also considers data from eight additional shoreline sites that are monitored around the lake. These sites have not been included in the calculation of the CCME WQI rating, as they are not monitored with the same frequency as the deep point site. However, they do provide important information on water quality conditions in the near shore areas. For locations of shoreline sites (A-H) please see Figure 2.
2.1.1 Elbow Lake Nutrients
Total phosphorus (TP) is used as a primary indicator of excessive nutrient loading and contributes to abundant aquatic vegetation growth and depleted dissolved oxygen levels. The Provincial Water Quality Objective (PWQO) is used as the TP Guideline and states that in lakes, concentrations greater than 0.020 mg/l indicate an excessive amount of TP within the water column.
Total Kjeldahl nitrogen (TKN) is used as a secondary indicator of nutrient loading. RVCA uses a guideline of 0.500 mg/l to assess TKN[1]within surface waters.
Nutrients at the Elbow Lake Deep Point
TP and TKN sampling results collected by the RVCA are presented in Figures 3 to 6. Some variability has occurred in the sampled TP concentrations at this site (Figure 3 and 4); no significant trend[2] was observed in the 2006-2017 data set. Eighty-four percent of samples analyzed for TP were less than the TP guideline and the average concentration was 0.015 mg/l (Table 3). TKN concentration also showed variability, as with TP concentrations no significant change was observed (Figures 5 and 6). Seventy three percent of reported results were below the TKN guideline and the average TKN concentration was 0.453 mg/l (Table 3).
Figure 3 Total phosphorous sampling results at deep point site (DP1) on Elbow Lake, 2006-2017
Figure 4 Average total phosphorous results at deep point site (DP1) on Elbow Lake, 2006-2017
Figure 5 Total Kjeldahl nitrogen sampling results at deep point site (DP1) on Elbow Lake, 2006-2017
Figure 6 Total Kjeldahl nitrogen sampling results at deep point site (DP1) on Elbow Lake, 2006-2017
Table 3 Summary of nutrient results for Elbow Lake, 2006-2017
Total Phosphorous 2006-2017
Site
Average (mg/l)
Below Guideline
No. Samples
DP1
0.015
84%
45
Total Kjeldahl Nitrogen 2006-2017
Site
Average (mg/l)
Below Guideline
No. Samples
DP1
0.453
73%
45
Overall, the data presented indicates that nutrient concentration may be considered moderate with occasional exceedances in the mid-lake, deep water site on Elbow Lake.
Nutrients around Elbow Lake
The average nutrient concentrations at monitored shoreline sites around the lake vary from year to year (Figures 7 and 8). Please note that in the 2006-2017 monitoring period sites A, D, G and H monitored yearly; while sites B, C, E, and F were only sampled in 2009 and 2014.
Average total phosphorous concentrations are below the TP guideline during most year, with the exception of site C, site D in 2011 and 2017, and site H in 2011 and 2012. A single exceedance is also observed at site B in 2011 (Figure 7). Exceedances at sites that are monitored yearly (B, D, and H) are not consistent making it inconclusive if this is indicative of a persistent problem.
A similar pattern of occasional exceedances at some sites, particularly D and G was also observed in the TKN data set, however the majority of sites did report average concentrations below the guideline each year (Figure 8). Elevated results were also observed at all site in 2014, this may be due to an external factor such as weather conditions that influenced the lake at the time of sampling.
Figure 7 Average total phosphorous concentrations at shoreline monitoring sites in Elbow Lake, 2006-2017
Figure 8 Average total Kjeldahl nitrogen concentrations at shoreline monitoring sites in Elbow Lake, 2006-2017
Summary of Elbow Lake Nutrients
Elbow Lake nutrient concentrations are generally below the guidelines. It is possible that occasional problems with nutrient enrichment (i.e. algal blooms or excessive plant growth) may be observed in some shallow, sheltered bays.
Efforts such as the diversion of runoff and enhanced shoreline buffers are important to continue to protect and enhance water quality, and reduce future nutrient increases-particularly in developed areas. Nutrient exceedances may be partially attributed to the natural aging of a lake and basin characteristics. All residents can help minimize their impact on the lake by reducing nutrient inputs through practices such as proper maintenance of septic systems, keeping shorelines natural and using phosphate free soaps and detergents. Promotion of sound stewardship and protection around lake is important to maintain and protect water quality conditions into the future.
2.1.2 Elbow Lake Water Clarity
Water clarity is measured using a Secchi disk during each deep point sample. Table 4 summarizes the recorded depths with an average depth of 3.0 m and shows that 77 percent readings have exceeded the minimum PWQO of 2 m; indicating that algae in the water column is not at excessive levels (good water clarity). Less than 2 m will indicate overproduction in a lake or significant inputs to the water column that are limiting light availability. Figure 9 shows that measured depths range from 1.3 m to 4.6 m. No significant trend was observed in Secchi depths over the 2006-2017 data set, meaning that clarity in the water column has not changed through this period.
Table 4 Summary of Secchi depths recorded at the deep point site (DP1) on Elbow Lake, 2006-2017
Secchi 2006-2017
Site
Average (m)
Above Guideline
No. Samples
DP1
3.0
77%
43
Figure 9 Recorded Secchi depths at the deep point site (DP1) on Elbow Lake, 2006-2017
Summary of Elbow Lake Water Clarity
Waters in Elbow Lake are usually clear and sufficient sunlight is able to penetrate the water column to support aquatic life and provide sufficient visibility for safe recreational use (boating, swimming).
2.1.3 Elbow Lake Fish Habitat
Two other factors, dissolved oxygen/temperature and pH were also assessed to provide an overall sense of the health of Elbow Lake from a fish habitat perspective.
2.1.3.1 Elbow Lake Dissolved Oxygen and Temperature
The red bars in Figure 10 show the depths where suitable conditions exist for warm water fish species (temperature less than 25°C and dissolved oxygen greater than 4 mg/l) at the deep point site. The vertical axis represents the total lake depth at each site where the profile is taken. Suitable conditions typically were observed over the monitoring periods to about 6 m of the water column. Periods of very limited conditions were observed in the summer of 2011, 2012 and 2016, due to very warm water temperatures in the upper portion of the water column and depleted oxygen conditions at the deeper depths. Overall, no significant change was noted in conditions through the 2006-2017 period.
Figure 10 Depths suitable for warm water fish species at the deep point site (DP1) on Elbow Lake, 2006-2017
2.1.3.2 Elbow Lake pH
The majority of samples (Figure 11) were within guidelines established by the Canadian Council of Minister's of the Environment which state that pH should be between 6.5 and 9 to protect aquatic life (Table 5). Biological activities such as increased photosynthesis from algal blooms and plant growth may influence pH in addition to anthropogenic activities.
Figure 11 pH concentrations at the deep point site (DP1) on Elbow Lake, 2006-2017
Table 5 Summary of pH results at the deep point site (DP1) on Elbow Lake, 2006-2017
pH 2006-2017
Site
Average (mg/l)
Within Guideline
No. Samples
DP1
7.6
95%
41
Summary of Water Quality for Fish Habitat in Elbow Lake
Overall the water chemistry data at the deep point describes suitable habitat conditions for warm water fish species. pH conditions are within the range recommended for the protection of aquatic life. Overall, the data indicates a healthy environment for aquatic species.
2.1.4 Elbow Lake E. Coli
E. coli is sampled at monitored shoreline sites twice each sampling season. E. coli data was not used in the calculations of the WQI rating for the lake due to differences in sampling frequency and site locations. E. coli data has been summarized in Table 6.
Throughout the 2006-2017 period 99 percent of samples collected by RVCA were below the E. coli guideline of 100 colony forming units (CFU) per 100 ml set by the PWQO; across the lake the count at the geometric mean was 4 CFU/100ml (Table 6). This provides support that there is little indication of bacterial contamination around the lake. Figure 12 show the distribution of counts across all shoreline sites. All sites fell well below the guideline of 100 CFU/100ml.
Table 6 Summary of E. coli results for Elbow Lake, 2006-2017
E. coli 2006-2017
Site
Geometric Mean (CFU/100ml)
Below Guideline
No. Samples
DP1
4
99%
122
Figure12 Geometric mean of shoreline sites monitored on Elbow Lake, 2003-2008
Summary of Elbow Lake Bacterial Contamination
The results presented above indicate that bacterial contamination is not a significant concern in Elbow Lake and the water should be safe for recreational use such as swimming and boating.
2.2 Fish Creek Water Quality
There are two stream sites on Fish Creek (FIS-03 and FIS-A) monitored in the Elbow Lake and Fish Creek catchment (Figure 1). Water quality at these sites ranged from "Poor" to “Good” (Table 1). The score at each site is largely influenced by elevated nutrient concentrations, iron and high bacterial counts. For more information on the CCME WQI, please see the Tay River Subwatershed Report 2017.
2.2.1 Fish Creek Nutrients
Total phosphorus (TP) is used as a primary indicator of excessive nutrient loading and may contribute to abundant aquatic vegetation growth and depleted dissolved oxygen levels. The Provincial Water Quality Objective (PWQO) is used as the TP Guideline and states that in streams concentrations greater than 0.030 mg/l indicate an excessive amount of TP.
Total Kjeldahl nitrogen (TKN) is used as a secondary indicator of nutrient loading. RVCA uses a guideline of 0.500 mg/l to assess TKN[1].
Tables 7 and 8 summarize average nutrient concentrations at the monitored sites within the Fish Creek catchment and show the proportion of results that met the guidelines.
Table 7 Summary of total phosphorus results for the Fish Creek, 2006-2017. Highlighted values indicate average concentrations exceed the guideline
Total Phosphorous 2006-2017
Site
Average (mg/l)
Below Guideline
No. Samples
FIS-03
0.063
59%
76
FIS-A
0.037
58%
64
Table 8 Summary of total Kjeldahl nitrogen results for the Fish Creek, 2006-2017. Highlighted values indicate average concentrations exceed the guideline
Total Kjeldahl Nitrogen 2006-2017
Site
Average (mg/l)
Below Guideline
No. Samples
FIS-03
0.808
33%
76
FIS-A
0.678
8%
64
2.2.1.1 Fish Creek Monitoring Site FIS-03
Elevated TP results occurred occasionally at site FIS-03 throughout the monitoring period; 59% of samples were below the guideline (Figure 14) though average concentrations generally exceed the guidelines during the summer months (Figure 13). The average TP concentration was above the guideline of 0.030 mg/l at 0.063 mg/l (Table 7).
The majority of TKN results have exceeded the guideline (Figure 16), 33 percent of samples below the guideline. The average concentration was 0.808 mg/l and exceeded the guideline of 0.500 mg/l (Table 8).
There was no significant change[2] in the sampled concentrations of TP or TKN at this site over the 2006-2017 period (Figure 14 and 16).
2.2.1.2 Fish Creek Monitoring Site FIS-A
Elevated TP results also occurred occasionally at the downstream site FIS-A throughout the monitoring period; 58% of samples were below the guideline (Figure 14) monthly average concentrations were variable across the monitoring period (Figure 13). The average TP concentration was just above the guideline at 0.037 mg/l (Table 7).
Nearly all TKN results have exceeded the guideline (Figure 16), only 8 percent of samples were below the guideline. Concentrations were fairly consistent with the highest concentrations observed in October (Figure 15). Overall the average concentration was 0.678 mg/l and exceeded the guideline of 0.500 mg/l (Table 8).
There was no significant change[2] in the sampled concentrations of TP or TKN at this site over the 2006-2017 period (Figure 14 and 16). It should also be noted that access to site FIS-A is difficult and has resulted in fewer collected samples compared to the upstream site FIS-03.
Figure 13 Average monthly total phosphorus concentrations in Fish Creek, 2006-2017.
Figure 14 Distribution of total phosphorus concentrations in Fish Creek, 2006-2017.
Figure 15 Average monthly total Kjeldahl nitrogen concentrations in Fish Creek, 2006-2017.
Figure 16 Distribution of total Kjeldahl nitrogen concentrations in Fish Creek, 2006-2017
Summary of Fish Creek Nutrients
Results of the two monitored sites on Fish Creek shows that periods of nutrient enrichment is a feature of this creek. Both parameters (total phosphorus, total Kjeldahl nitrogen) have concentrations that exceed their respective guidelines. Elevated nutrients may result in nutrient loading downstream and to the Bobs Lake. High nutrient concentrations can help stimulate the growth of algae blooms and other aquatic vegetation in a water body and deplete oxygen levels as the vegetation dies off. It should be noted that this creek is fed by the extensive wetlands, this wetland complex is naturally nutrient rich and is likely the largest contributor to naturally elevated nutrient conditions. Development in this area is also minimal but best management practices such as minimizing storm water runoff, enhanced shoreline buffers, minimizing/discontinuing the use of fertilizers and restricting livestock access in both surrounding agricultural and developed areas can help to reduce additional nutrient enrichment both within this creek.
2.3 Fish Creek Escherichia coli
Escherichia coli (E. coli) is used as an indicator of bacterial pollution from human or animal waste; in elevated concentrations it can pose a risk to human health. The PWQO of 100 colony forming units/100 millilitres (CFU/100 ml) is used as a guideline. E. coli counts greater than this guideline indicate that bacterial contamination may be a problem within a waterbody.
Table 9 summarizes the geometric mean [3] for the monitored sites on Fish Creek and shows the proportion of samples that meet the E. coli guideline of 100 CFU/100 ml. The results of the geometric mean with respect to the guideline for the 2006-2017 period are shown in Figures 17 and 18.
Table 9 Summary of E. coli results for Fish Creek, 2006-2017
E. coli 2012-2017
Site
Geometric Mean (CFU/100ml)
Below Guideline
No. Samples
FIS-03
60
59%
76
FIS-A
65
66%
64
2.3.1. Fish Creek Monitoring Site FIS-03
E. coli counts at site FIS-03 show that there has been no significant trend in bacterial counts (Figure 18). The count at the geometric mean was 60 (Table 9) and the majority of results (59 percent) were below the E. coli guideline. Figure 17 shows that periods of elevated counts are most common is September; this can likely be attributed to warm weather and low flow conditions.
2.3.2. Fish Creek Monitoring Site FIS-A
At site FIS-A, there was no significant trend noted with respect to E. coli counts (Figure 18). The count at the geometric mean was 65 (Table 9), and the majority of results (66 percent) were below the E. coli guideline. As with upstream site FIS-03, periods of elevated counts are most common in September (Figure 17).
Figure 17 Geometric mean of monthly E. coli counts in Fish Creek, 2006-2017
Figure 18 Distribution of E. coli counts in Fish Creek, 2006-2017
Summary of Fish Creek Bacterial Contamination
Bacterial contamination does not appear to be a significant concern in Fish Creek, results are very comparable between upstream and downstream sites. As indicated by Figure 18, occasional exceedances above the guideline of 100 CFU/100ml have been observed. Best management practices such as enhancing shoreline buffers, limiting livestock access and minimizing runoff in both rural and developed areas can help to protect Fish Creek into the future.
2.4 Fish Creek Metals
Of the metals routinely monitored in Fish Creek, iron (Fe) occasionally reported concentrations above its respective Provincial Water Quality Objective of 0.300 mg/l. In elevated concentrations, this metal can have toxic effects on sensitive aquatic species.
Table 10 summarizes Fe concentrations within the creek as well as show the proportion of samples that meet guidelines. Figures 19 and 20 show Fe concentrations with respect to the guidelines for the monitoring period, 2006-2017.
Table 10 Summary of iron results in Fish Creek from 2006-2017. Highlighted values indicate average concentrations exceed the guideline.
Iron 2006-2017
Site
Average (mg/l)
Below Guideline
No. Samples
FIS-03
0.556
48%
28
FIS-A
0.549
64%
22
2.4.1 Fish Creek Monitoring Site FIS-03
The average Fe concentrations in site FIS-03 was 0.556 mg/l and exceeded the guideline (PWQO). Forty-eight percent of samples were below the guideline and there was no significant change in Fe concentrations across the monitoring period (Table 10, Figure 20). Monthly concentrations were highly variable across the monitoring period, and strongly influenced by single elevated samples (Figure 19).
2.4.2 Fish Creek Monitoring Site FIS-A
Iron concentrations at FIS-A were comparable to site FIS-03. The average Fe concentrations in site FIS-03 was 0.549 mg/l and 64 percent of samples were below the guideline. Overall there was no significant trend in Fe concentrations Figure 20). Monthly concentrations were also variable across the monitoring period (Figure 19).
Figure 19 Average monthly iron concentrations in Fish Creek, 2006-2017.
Figure 20 Distribution of iron concentrations in Fish Creek, 2006-2017.
Summary of Fish Creek Metals
In the Fish Creek there is little evidence of increased metal concentration above respective guidelines, though elevated concentrations do occur it is quite likely that they are naturally occurring from groundwater inputs. Even so continued efforts should be made to protect against possible pollution sources and implement best management practices to reduce any inputs such as storm water runoff from hardened surfaces to improve overall stream health and lessen downstream impacts.
1 No Ontario guideline for TKN is presently available; however, waters not influenced by excessive organic inputs typically range from 0.100 to 0.500 mg/l, Environment Canada (1979) Water Quality Sourcebook, A Guide to Water Quality Parameters, Inland Waters Directorate, Water Quality Branch, Ottawa, Canada
2 The evaulations of temporal trends or significant change over time in the data set was preformed using the Mann Kendall trend test and Sens slope estimator, a confidence levels of p<0.05 was used to determine if trends were significant.
3 A type of mean or average, which indicates the central tendency or typical value of a set of numbers by using the product of their values (as opposed to the arithmetic mean which uses their sum). It is often used to summarize a variable that varies over several orders of magnitude, such as E. coli counts.
The Stream Characterization Program evaluated 3.9 km of Fish Creek in 2016. A total of 39 stream survey assessments were completed in the middle of June and July.
During the summer and fall of 2016, the Rideau Valley watershed experienced periods of severe drought. Precipitation levels were measured at less than 40 percent of the long-term average, as the water supply was unable to meet local demand. The lack of rainfall affected the success and function of farm crops, municipal and private wells, lawns and gardens, navigation and ultimately the health of our lakes, rivers and streams.
Low water conditions were readily observed throughout the watershed, as many of the streams were highly fragmented or completely dry. Aquatic species such as amphibians, fish and macroinvertebrates were affected, as suitable habitat may have been limited. Fragmentation of habitat was observed in sections along Fish Creek during drought conditions in 2016.
Fish Creek at County Road 38 in Parham during the drought in the Fall of 2016
3.1 Fish Creek Overbank Zone
3.1.1 Riparian Buffer Land Cover Evaluation
The quality of the riparian area increases with the width, complexity and linear extent of its vegetation along a stream or creek. A complex riparian community consists of diverse plant species native to the site, with multiple age-classes providing vertical structural diversity along a watercourse.
Here is a list of watershed benefits from a healthy riparian buffer zone:
Reduces the amount of pollutants that reach the stream from surface runoff
Helps reduce and mitigates erosion
Provides a microclimate that is cooler during the summer months providing cooler water for aquatic organisms
Provides large wood structure from fallen trees and limbs that form instream cover, create pools, stabilize the streambed, and provide habitat for aquatic organisms
Provides organic material for stream biota that, among other functions, is the base of the food chain in lower order streams
Provides habitat for terrestrial insects that drop in the stream and become food for fish and travel corridors for other terrestrial animals
Dissipates energy during flood events
Often provides the only refuge areas for fish during out-of-bank flows (behind trees, stumps, and logs)
Figure 21 demonstrates the buffer conditions of the left and right banks separately. Fish Creek had a buffer of greater than 30 meters along 92 percent of the left bank and 83 percent of the right bank.
Figure 21 Riparian Buffer Evaluation along Fish Creek
3.1.2 Riparian Buffer Alterations
Alterations within the riparian buffer were assessed within three distinct shoreline zones (0-5m, 5-15m, 15-30m), and evaluated based on the dominant vegetative community and/or land cover type (Figure 22). The riparian buffer zone along Fish Creek was found to be dominated by forest, scrubland and wetland conditions. There were several short areas that had altered riparian zone conditions along the watercourse.
Figure 22 Riparian buffer alterations along Fish Creek
3.1.3 Adjacent Land Use
The RVCA’s Stream Characterization Program identifies nine different land uses along Fish Creek (Figure 23). Surrounding land use is considered from the beginning to end of the survey section (100m) and up to 100m on each side of the creek. Land use outside of this area is not considered for the surveys but is nonetheless part of the subwatershed and will influence the creek. Forest habitat was dominant at 100 percent of sections surveyed; scrubland was found at 62% of sections, 44 percent was classified as meadow habitat, while wetland habitat was observed in the adjacent lands along Fish Creek at 13 percent of the surveyed sections. The remaining land use consisted of active agriculture, pasture, abandoned agriculture, residential and infrastructure in the form of road crossings.
Figure 23 Land Use along Fish Creek
3.2 Fish Creek Shoreline Zone
3.2.1 Instream Erosion
Stream erosion is the process by which water erodes and transports sediments, resulting in dynamic flows and diverse habitat conditions. Excessive erosion can result in drastic environmental changes, as habitat conditions, water quality and aquatic life are all negatively affected. Bank stability was assessed as the overall extent of each section with “unstable” shoreline conditions. These conditions are defined by the presence of significant exposed soils/roots, minimal bank vegetation, severe undercutting, slumping or scour and potential failed erosion measures. The majority of Fish Creek had low levels of erosion observed along the surveyed sections with two reaches having moderate levels of erosion in the middle reach (Fig.24).
Figure 24 Erosion levels along Fish Creek
3.2.2 Undercut Stream Banks
Stream bank undercuts can provide excellent cover habitat for aquatic life, however excessive levels can be an indication of unstable shoreline conditions. Bank undercut was assessed as the overall extent of each surveyed section with overhanging bank cover present. Figure 25 shows that Fish Creek had no observed undercut banks along the upper and lower reaches of the system, however there were several sections in the middle reaches with low to moderate levels of undercut banks.
Figure 25 Undercut stream banks along Fish Creek
3.2.3 Stream Shading
Grasses, shrubs and trees all contribute towards shading a stream. Shade is important in moderating stream temperature, contributing to food supply and helping with nutrient reduction within a stream. Stream cover is assessed as the total coverage area in each section that is shaded by overhanging trees/grasses and tree canopy, at greater than 1m above the water surface. Figure 26 shows low levels of stream shading along in the lower and upper reaches of Fish Creek where the channel naturally widens, which is consistent with wetland habitat conditions. There were many sections in the middle reaches, where the channel narrows, that had high to moderate levels of stream shading along the creek.
Figure 26 Stream shading along Fish Creek
3.2.4 Instream Wood Structure
Forested shorelines provide essential complex habitat through the perpetual process of shoreline trees falling into the water. This continuous recruitment of trees creates a wood-based physical structure in the littoral zone that is common on natural systems. Insects, fish, amphibians, birds, and other animals have also evolved with this abundance of near shore wood and it is essential to their life cycles. With increased development along many waterways, forested lakeshores have been altered and wood-based physical structure in many waterways has been reduced. It is important to restore this essential habitat to aquatic ecosystems.
Shoreline Protection
Protects shorelines by providing a barrier from wind and wave erosion
Reduces sedimentation of the water caused by shoreline slumping due to bank erosion
Allows detritus to collect and settle on the lake or creek bed providing the substrate structure required for native aquatic vegetation to establish and outcompete invasive species
Food Source
Wood complexes are an important food source for invertebrates
Small fish feed on the abundance of invertebrates that are found around these structures
Larger fish, waterfowl and shorebirds all benefit from the abundance of invertebrates and small fish feeding around woody structures in the littoral zone
Cover
Cover from predators is essential for many fish and animals to successfully complete their life cycle
The nooks and crannies of wood complexes offer critters safety from predators while at the same time concentrating prey to make predators more efficient
Wood provides the structure on which many species must lay or attach their eggs, therefore these complexes provide quality spawning and nesting habitat
Diversity
Wood complexes in the littoral zone provide unique edge habitat along the shoreline
Edge habitats contain more species diversity and higher concentrations of species than the adjoining habitats themselves will have
Figure 27 shows that the majority of Fish Creek had high to moderate levels of instream structure along the system. Lower levels of in-water trees and branches were observed in the lower and upper reaches of the creek.
Figure 27 Instream wood structure along Fish Creek
3.2.5 Overhanging Wood Structure
Trees and branches that are less than one meter from the surface of the water are defined as overhanging. Overhanging wood structure provide a food source, nutrients and shade which helps to moderate instream water temperatures. Figure 28 shows the system is highly variable with no overhanging branches and trees where the system is wide and is dominated by wetland habitat to areas in the middle reaches that have high levels of overhanging wood structure along Fish Creek.
Figure 28 Overhanging wood structure along Fish Creek
3.2.6 Anthropogenic Alterations
Stream alterations are classified based on specific functional criteria associated with the flow conditions, the riparian buffer and potential human influences. Figure 29 shows sixty seven percent of Fish Creek remains “unaltered” with no anthropogenic alterations. Twenty eight percent of Fish Creek was classified as natural with minor anthropogenic changes while five percent was considered altered. The alterations along Fish Creek were in the form of shoreline modifications and road crossings. There were no sections that were classified as being highly altered.
Figure 29 Anthropogenic alterations along Fish Creek
3.3 Fish Creek Instream Aquatic Habitat
3.3.1 Benthic Invertebrates
Freshwater benthic invertebrates are animals without backbones that live on the stream bottom and include crustaceans such as crayfish, molluscs and immature forms of aquatic insects. Benthos represent an extremely diverse group of aquatic animals and exhibit wide ranges of responses to stressors such as organic pollutants, sediments and toxicants, which allows scientists to use them as bioindicators. As part of the Ontario Benthic Biomonitoring Network (OBBN), the RVCA has been collecting benthic invertebrates at the County Road 38 site since 2003. Monitoring data is analyzed for each sample site and the results are presented using the Family Biotic Index, Family Richness and percent Ephemeroptera, Plecoptera and Trichoptera.
Hilsenhoff Family Biotic Index
The Hilsenhoff Family Biotic Index (FBI) is an indicator of organic and nutrient pollution and provides an estimate of water quality conditions for each site using established pollution tolerance values for benthic invertebrates. FBI results for the Fish Creek catchment at the County Road 38 sample location is summarized by year. “Good” to “Poor” water quality conditions were observed at the Fish Creek sample location (Figure 30) using a grading scheme developed by Conservation Authorities in Ontario for benthic invertebrates.
Figure 30 Hilsenhoff Family Biotic Index at the County Road 38 sample location
Family Richness
Family Richness measures the health of the community through its diversity and increases with increasing habitat diversity suitability and healthy water quality conditions. Family Richness is equivalent to the total number of benthic invertebrate families found within a sample. The County Road 38 location is reported to have “Fair” to “Good” family richness (Figure 31).
Figure 31 Family Richness on Fish Creek at the County Road 38 sample location
EPT
Ephemeroptera (Mayflies), Plecoptera (Stoneflies), and Trichoptera (Caddisflies) are species considered to be very sensitive to poor water quality conditions. High abundance of these organisms is generally an indication of good water quality conditions at a sample location. The community structure is highly variable with species that are sensitive during some years and other years being dominated by species that are tolerant to poorer water quality conditions at the Fish Creek sample location. As a result, the EPT indicates that the Fish Creek sample location is reported to have wide ranging conditions from “Good” to “Poor” water quality (Figure 32) during the reporting periods.
Figure 32 EPT on Fish Creek at the County Road 38 sample location
Conclusion
Overall the Fish Creek sample location at County Road 38 aquatic habitat conditions from a benthic invertebrate perspective is highly variable depending on the year. Conditions ranged from “Good” to “Poor” as the samples have species that are sensitive during certain years and change to species that are more tolerant to high organic pollution levels during other years.
3.3.2 Habitat Complexity
Habitat complexity is a measure of the overall diversity of habitat types and features within a stream. Streams with high habitat complexity support a greater variety of species niches, and therefore contribute to greater diversity. Factors such as substrate, flow conditions (pools, riffles) and cover material (vegetation, wood structure, etc.) all provide crucial habitat to aquatic life. Habitat complexity is assessed based on the presence of boulder, cobble and gravel substrates, as well as the presence of instream woody material.
Low to high habitat complexity was identified for Fish Creek (Figure 33). Regions with increased habitat complexity were observed in the lower and middle reaches of the system within the catchment.
Figure 33 Habitat complexity along Fish Creek
3.3.3 Instream Substrate
Diverse substrate is important for fish and benthic invertebrate habitat because some species have specific substrate requirements and for example will only reproduce on certain types of substrate. The absence of diverse substrate types may limit the overall diversity of species within a stream. Figure 34 shows the overall presence of various substrate types observed along Fish Creek. Substrate conditions were highly diverse along Fish Creek with all substrate types being recorded at various locations along the creek. Figure 35 shows the dominant substrate type observed for each section surveyed along Fish Creek.
Figure 34 Instream substrate along Fish Creek
Figure 35 shows the dominant substrate type along Fish Creek
3.3.4 Instream Morphology
Pools and riffles are important habitat features for aquatic life. Riffles are fast flowing areas characterized by agitation and overturn of the water surface. Riffles thereby play a crucial role in contributing to dissolved oxygen conditions and directly support spawning for some fish species. They are also areas that support high benthic invertebrate populations which are an important food source for many aquatic species. Pools are characterized by minimal flows, with relatively deep water and winter/summer refuge habitat for aquatic species. Runs are moderately shallow, with unagitated surfaces of water and areas where the thalweg (deepest part of the channel) is in the center of the channel. Figure 36 shows that Fish Creek is highly variable; 95 percent of sections recorded runs, 67 percent pools and 13 percent riffles. Figure 37 shows where the riffle habitat areas were observed along Fish Creek.
Figure 36 Instream morphology along Fish Creek
Figure 37 Instream riffle habitat along Fish Creek
3.3.5 Vegetation Type
Instream vegetation provides a variety of functions and is a critical component of the aquatic ecosystem. Aquatic plants promote stream health by:
Providing direct riparian/instream habitat
Stabilizing flows reducing shoreline erosion
Contributing to dissolved oxygen through photosynthesis
Maintaining temperature conditions through shading
For example emergent plants along the shoreline can provide shoreline protection from wave action and important rearing habitat for species of waterfowl. Submerged plants provide habitat for fish to find shelter from predator fish while they feed. Floating plants such as water lilies shade the water and can keep temperatures cool while reducing algae growth. Algae was observed in 97 percent of sections, submerged plants were present in 95 percent of the survey sections, floating plants in 82%, narrow leaved emergents were observed in 64 percent of sections, 36 percent free floating plants, 8 percent broad leaved emergents and robust emergents were observed in 3 percent of sections surveyed. Figure 38 depicts the plant community structure for Fish Creek. Figure 39 shows the dominant vegetation type observed for each section surveyed along Fish Creek.
Figure 38 Vegetation type along Fish Creek
Figure 39 Dominant vegetation type along Fish Creek
3.3.6 Instream Vegetation Abundance
Instream vegetation is an important factor for a healthy stream ecosystem. Vegetation helps to remove contaminants from the water, contributes oxygen to the stream, and provides habitat for fish and wildlife. Too much vegetation can also be detrimental. Figure 40 demonstrates that Fish Creek reach had normal to common levels of vegetation recorded at 51 and 46 percent of stream surveys. Extensive levels of vegetation were observed in 51 percent of the surveyed sections, while 56 percent of sections had areas with no vegetation.
Figure 40 Instream vegetation abundance along Fish Creek
3.3.7 Invasive Species
Invasive species can have major implications on streams and species diversity. Invasive species are one of the largest threats to ecosystems throughout Ontario and can out compete native species, having negative effects on local wildlife, fish and plant populations. Thirty eight percent of the sections surveyed along Fish Creek reach had invasive species. The invasive species observed in Fish Creek were European frogbit, purple loosestrife and dog strangling vine. Invasive species abundance (i.e. the number of observed invasive species per section) was assessed to determine the potential range/vector of many of these species (Figure 41).
Figure 41 Invasive species abundance along Fish Creek
3.3.8 Water Chemistry
During the stream characterization survey, a YSI probe is used to collect water chemistry information. Dissolved oxygen (DO), specific conductivity (SPC) and pH are measured at the start and end of each section.
3.3.8.1 Dissolved Oxygen
Dissolved oxygen is a measure of the amount of oxygen dissolved in water. The Canadian Environmental Quality Guidelines of the Canadian Council of Ministers of the Environment (CCME) suggest that for the protection of aquatic life the lowest acceptable dissolved oxygen concentration should be 6 mg/L for warmwater biota and 9.5 mg/L for coldwater biota (CCME, 1999). Figure 42 shows that the dissolved oxygen in Fish Creek supports warmwater and in certain locations coldwater biota along the system. The average dissolved oxygen level observed within Fish Creek was 4.6mg/L which is below the recommended level for warmwater biota. The lower and upper reaches of Fish Creek were within the threshold to support warmwater biota. The middle reaches fell below the recommended threshold to support warmwater aquatic biota.
Figure 42 Dissolved oxygen ranges along Fish Creek
3.3.8.2 Conductivity
Conductivity in streams is primarily influenced by the geology of the surrounding environment, but can vary drastically as a function of surface water runoff. Currently there are no CCME guideline standards for stream conductivity; however readings which are outside the normal range observed within the system are often an indication of unmitigated discharge and/or stormwater input. The average conductivity observed within the main stem of Fish Creek was 125.5 µs/cm. Figure 43 shows the conductivity readings for Fish Creek.
Figure 43 Specific conductivity ranges in Fish Creek
3.3.8.3 pH
Based on the PWQO for pH, a range of 6.5 to 8.5 should be maintained for the protection of aquatic life. Average pH values along Fish Creek averaged 6.93 thereby meeting the provincial standard (Figure 44).
Figure 44 pH ranges along Fish Creek
3.3.8.4 Oxygen Saturation (%)
Oxygen saturation is measured as the ratio of dissolved oxygen relative to the maximum amount of oxygen that will dissolve based on the temperature and atmospheric pressure. Well oxygenated water will stabilize at or above 100% saturation, however the presence of decaying matter/pollutants can drastically reduce these levels. Oxygen input through photosynthesis has the potential to increase saturation above 100% to a maximum of 500%, depending on the productivity level of the environment. In order to represent the relationship between concentration and saturation, the measured values have been summarized into 6 classes.
Figure 45 A bivariate assessment of dissolved oxygen concentration (mg/L) and saturation (%) in Fish Creek
Dissolved oxygen conditions on Fish Creek were fairly uniform along the system (Figure 45). Sections in the middle reach fell below the guideline to support warmwater biota, however sections in the upper and lower reaches were acceptable for warmwater species.
3.3.8.5 Specific Conductivity Assessment
Specific conductivity (SPC) is a standardized measure of electrical conductance, collected at or corrected to a water temperature of 25⁰C. SPC is directly related to the concentration of ions in water, and is commonly influenced by the presence of dissolved salts, alkalis, chlorides, sulfides and carbonate compounds. The higher the concentration of these compounds, the higher the conductivity. Common sources of elevated conductivity include storm water, agricultural inputs and commercial/industrial effluents.
In order to summarize the conditions observed, SPC levels were evaluated as either normal, moderately elevated or highly elevated. These categories correspond directly to the degree of variation (i.e. standard deviation) at each site relative to the average across the system.
Normal levels were maintained along the majority of Fish Creek, however there was an area in the middle reach with high levels and other areas were reported to have moderately elevated levels in the middle and lower reaches (Figure 46).
Figure 46 Relative specific conductivity levels along Fish Creek
3.3.9 Thermal Regime
Many factors can influence fluctuations in stream temperature, including springs, tributaries, precipitation runoff, discharge pipes and stream shading from riparian vegetation. Water temperature is used along with the maximum air temperature (using the Stoneman and Jones method) to classify a watercourse as either warm water, cool water or cold water. Figure 47 shows where the thermal sampling sites were located on Fish Creek. Analysis of the data collected indicates that Fish Creek is classified as a warm water system with cool-warm water reaches (Figure 48).
Figure 47 Temperature logger locations along Fish Creek
Figure 48 Temperature logger data for the sites on Fish Creek
Each point on the graph represents a temperature that meets the following criteria:
Sampling dates between July 1st and September 7th
Sampling date is preceded by two consecutive days above 24.5 °C, with no rain
Water temperatures are collected at 4pm
Air temperature is recorded as the max temperature for that day
3.3.10 Groundwater
Groundwater discharge areas can influence stream temperature, contribute nutrients, and provide important stream habitat for fish and other biota. During stream surveys, indicators of groundwater discharge are noted when observed. Indicators include: springs/seeps, watercress, iron staining, significant temperature change and rainbow mineral film. Figure 49 shows areas where one or more of the above groundwater indicators were observed during stream surveys and headwater assessments.
Figure 49 Groundwater indicators observed in the Elbow Lake catchment
3.3.11 Fish Community
The Fish Creek catchment is classified as a mixed community of warm and cool water recreational and baitfish fishery with 20 species observed. The following is a list of species observed in the watershed in 2016 and historically (Figure 50). There was a significant reduction in species richness observed in 2016 likely as a result of drought conditions. Habitat fragmentation due to low water can reduce the abundance and presence of fish species along the system.
Figure 50 Fish community sampling observations for 2016 in the Elbow Lake catchment
Table 11 contains a list of species observed in the watershed.
Table 11 Fish species observed in Fish Creek catchment
Fish Species
Scientific Name
Fish code
Historical
2016
blacknose shiner
Notropis heterolepis
BnShi
X
X
bluegill
Lepomis macrochirus
Blueg
X
X
bluntnose minnow
Pimephales notatus
BnMin
X
brassy minnow
Hybognathus hankinsoni
BrMin
X
brook stickleback
Culaea inconstans
BrSti
X
brown bullhead
Ameiurus nebulosus
BrBul
X
burbot
Lota lota
Burbo
X
central mudminnow
Umbra limi
CeMud
X
common shiner
Luxilus cornutus
CoShi
X
creek chub
Semotilus atromaculatus
CrChu
X
fallfish
Semotilus corporalis
Fallf
X
finescale dace
Phoxinus neogaeus
FsDac
X
golden shiner
Notemigonus crysoleucas
GoShi
X
largemouth bass
Micropterus salmoides
LmBas
X
X
logperch
Percina caprodes
Lope
X
X
northern pike
Esox lucius
NoPik
X
northern redbelly dace
Chrosomus eos
NRDac
X
pumpkinseed
Lepomis gibbosus
Pumpk
X
X
rock bass
Ambloplites rupestris
RoBas
X
X
walleye
Sander vitreus
Walle
X
white sucker
Catostomus commersonii
WhSuc
X
X
yellow perch
Perca flavescens
YePer
X
X
TOTAL Species
20
10
RVCA staff weighing and measuring fish from Fish Creek before release back into the creek
Fyke net set on Fish Creek as one of the fish sampling methods
3.3.12 Migratory Obstructions
It is important to know locations of migratory obstructions because these can prevent fish from accessing important spawning and rearing habitat. Migratory obstructions can be natural or manmade, and they can be permanent or seasonal. Figure 51 shows the migration barriers along Fish Creek at the time of the survey in 2016. There were four perched culverts and five debris dams along fish creek and various headwater drainage features within the catchment.
Figure 51 Migratory obstructions in the Elbow Lake catchment
3.3.13 Beaver Dams
Overall beaver dams create natural changes in the environment. Some of the benefits include providing habitat for wildlife, flood control, and silt retention. Additional benefits come from bacterial decomposition of woody material used in the dams which removes excess nutrient and toxins. Beaver dams can also result in flooding of agricultural lands and may be potential barriers to fish migration. Seven beaver dams were identified along Fish Creek in 2016 (Figure 52).
Figure 52 Beaver dam type and locations along Fish Creek
One of the beaver dams observed on Fish Creek in 2016
3.3.14 Instream Restoration
Figure 53 depicts the locations of instream restoration opportunities as a result of observations made during the stream survey. One channel modification and a garbage cleanup opportunity were identified on Fish Creek.
Figure 53 Instream restoration opportunities in the Elbow Lake - Fish Creek catchment
3.4 Headwater Drainage Feature Assessment
3.4.1 Headwaters Sampling Locations
The RVCA Stream Characterization program assessed Headwater Drainage Features for the Fish Creek catchment in 2016. This protocol measures zero, first and second order headwater drainage features (HDF). It is a rapid assessment method characterizing the amount of water, sediment transport, and storage capacity within headwater drainage features (HDF). RVCA is working with other Conservation Authorities and the Ministry of Natural Resources and Forestry to implement the protocol with the goal of providing standard datasets to support science development and monitoring of headwater drainage features. An HDF is a depression in the land that conveys surface flow. Additionally, this module provides a means of characterizing the connectivity, form and unique features associated with each HDF (OSAP Protocol, 2013). In 2016 the program sampled 27 sites at road crossings in the Elbow Lake catchment area (Figure 54).
Figure 54 Location of the headwater sampling site in the Elbow Lake catchment
3.4.2 Headwater Feature Type
The headwater sampling protocol assesses the feature type in order to understand the function of each feature. The evaluation includes the following classifications: defined natural channel, channelized or constrained, multi-thread, no defined feature, tiled, wetland, swale, roadside ditch and pond outlet. By assessing the values associated with the headwater drainage features in the catchment area we can understand the ecosystem services that they provide to the watershed in the form of hydrology, sediment transport, and aquatic and terrestrial functions. The headwater drainage features in the Elbow Lake catchment are predominantly natural and wetland features. Figure 55 shows the feature type of the primary feature at the sampling locations.
Figure 55 Headwater feature types in the Elbow Lake catchment
3.4.3 Headwater Feature Flow
The observed flow condition within headwater drainage features can be highly variable depending on timing relative to the spring freshet, recent rainfall, soil moisture, etc. Flow conditions are assessed in the spring and in the summer to determine if features are perennial and flow year round, if they are intermittent and dry up during the summer months or if they are ephemeral systems that do not flow regularly and generally respond to specific rainstorm events or snowmelt. Flow conditions in headwater systems can change from year to year depending on local precipitation patterns. Figure 56 shows the observed flow condition at the sampling locations in the Elbow Lake catchment in 2016.
Figure 56 Headwater feature flow conditions in the Elbow Lake catchment
A spring photo of the headwater sample site in the Elbow Lake catchment located on County Road 38
A summer photo of the headwater sample site in the Elbow Lake catchment located on County Road 38
3.4.4 Feature Channel Modifications
Channel modifications were assessed at each headwater drainage feature sampling location. Modifications include channelization, dredging, hardening and realignments. The Fish Creek catchment area had a majority of features with no channel modifications observed, two sites as having been historically dredged/channelized and four locations had mixed modifications. Figure 57 shows the channel modifications observed at the sampling locations for the Elbow Lake catchment.
Figure 57 Headwater feature channel modifications in the Elbow Lake catchment
3.4.5 Headwater Feature Vegetation
Headwater feature vegetation evaluates the type of vegetation that is found within the drainage feature. The type of vegetated within the channel influences the aquatic and terrestrial ecosystem values that the feature provides. For some types of headwater features the vegetation within the feature plays a very important role in flow and sediment movement and provides wildlife habitat. The following classifications are evaluated no vegetation, lawn, wetland, meadow, scrubland and forest. Figure 58 depicts the dominant vegetation observed at the sampled headwater sites in the Elbow Lake catchment.
Figure 58 Headwater feature vegetation types in the Elbow Lake catchment
3.4.6 Headwater Feature Riparian Vegetation
Headwater riparian vegetation evaluates the type of vegetation that is found along the adjacent lands of a headwater drainage feature. The type of vegetation within the riparian corridor influences the aquatic and terrestrial ecosystem values that the feature provides to the watershed. Figure 59 depicts the type of riparian vegetation observed at the sampled headwater sites in the Elbow Lake - Fish Creek catchment. The majority of the headwater drainage features are classified as having natural riparian vegetation with only five features having altered vegetation typically in the form of ornamental grass or agricultural crops in the riparian zone.
Figure 59 Headwater feature riparian vegetation types in the Elbow Lake catchment
3.4.7 Headwater Feature Sediment Deposition
Assessing the amount of recent sediment deposited in a channel provides an index of the degree to which the feature could be transporting sediment to downstream reaches (OSAP, 2013). Evidence of excessive sediment deposition might indicate the requirement to follow up with more detailed targeted assessments upstream of the site location to identify potential best management practices to be implemented. Sediment deposition ranged from none to substantial for the headwater sites sampled in the Fish Creek catchment area. Figure 60 depicts the degree of sediment deposition observed at the sampled headwater sites in the Elbow Lake catchment. Sediment deposition conditions ranged from no sediment deposition to substantial.
Figure 60 Headwater feature sediment deposition in the Elbow Lake catchment
3.4.8 Headwater Feature Upstream Roughness
Feature roughness will provide a measure of the amount of materials within the bankfull channel that could slow down the velocity of water flowing within the headwater feature (OSAP, 2013). Materials on the channel bottom that provide roughness include vegetation, woody structure and boulders/cobble substrates. Roughness can provide benefits in mitigating downstream erosion on the headwater drainage feature and the receiving watercourse by reducing velocities. Roughness also provides important habitat conditions for aquatic organisms. Figure 61 shows that the feature roughness conditions at the sampling locations in the Elbow Lake catchment were highly variable ranging from minimal to extreme.
Figure 61 Headwater feature roughness in the Elbow Lake
Land cover and any change in coverage that has occurred over a six year period is summarized for the Elbow Lake catchment using spatially continuous vector data representing the catchment during the spring of 2008 and 2014. This dataset was developed by the RVCA through heads-up digitization of 20cm DRAPE ortho-imagery at a 1:4000 scale and details the surrounding landscape using 10 land cover classes.
4.1 Elbow Lake Catchment Change
As shown in Table 12 and Figure 1, the dominant land cover type in 2014 is woodland.
Table 12 Land cover in the Elbow Lake catchment (2008 vs. 2014)
Land Cover
2008
2014
Change - 2008 to 2014
Area
Area
Area
Ha
Percent
Ha
Percent
Ha
Percent
Woodland*
3082
55
3076
54
-6
-1
Wetland **
1546
27
1548
27
2
>Evaluated
(114)
(2)
(114)
(2)
(0)
(0)
>Unevaluated
(1432)
(25)
(1434)
(25)
(2)
(0)
Crop and Pasture
462
8
461
8
-1
Water
204
4
204
4
Meadow-Thicket
127
2
127
2
Settlement
123
2
127
2
4
Transportation
103
2
103
2
* Does not include treed swamps ** Includes treed swamps
From 2008 to 2014, there was an overall change of six hectares (from one land cover class to another). Most of the change in the Elbow Lake catchment is a result of the conversion of woodland to settlement and woodland reverting to wetland (Figure 62).
Figure 62 Land cover change in the Elbow Lake catchment (2008 to 2014)
Table 13 provides a detailed breakdown of all land cover change that has taken place in the Elbow Lake catchment between 2008 and 2014.
Table13 Land cover change in the Elbow Lake catchment (2008 to 2014)
Land Cover
Change - 2008 to 2014
Area
Ha.
Percent
Woodland to Settlement
2.8
46.9
Woodland to Unevaluated Wetland
2.8
46.3
Crop and Pasture to Settlement
0.4
6.8
4.2 Woodland Cover
In the Environment Canada Guideline (Third Edition) entitled “How Much Habitat Is Enough?” (hereafter referred to as the “Guideline”) the opening narrative under the Forest Habitat Guidelines section states that prior to European settlement, forest was the predominant habitat in the Mixedwood Plains ecozone. The remnants of this once vast forest now exist in a fragmented state in many areas (including the Rideau Valley watershed) with woodland patches of various sizes distributed across the settled landscape along with higher levels of forest cover associated with features such as the Frontenac Axis (within the on-Shield areas of the Rideau Lakes and Tay River subwatersheds). The forest legacy, in terms of the many types of wildlife species found, overall species richness, ecological functions provided and ecosystem complexity is still evident in the patches and regional forest matrices (found in the Tay River subwatershed and elsewhere in the Rideau Valley watershed). These ecological features are in addition to other influences which forests have on water quality and stream hydrology including reducing soil erosion, producing oxygen, storing carbon along with many other ecological services that are essential not only for wildlife but for human well-being.
The Guideline also notes that forests provide a great many habitat niches that are in turn occupied by a great diversity of plant and animal species. They provide food, water and shelter for these species - whether they are breeding and resident locally or using forest cover to help them move across the landscape. This diversity of species includes many that are considered to be species at risk. Furthermore, from a wildlife perspective, there is increasing evidence that the total forest cover in a given area is a major predictor of the persistence and size of bird populations, and it is possible or perhaps likely that this pattern extends to other flora and fauna groups. The overall effect of a decrease in forest cover on birds in fragmented landscapes is that certain species disappear and many of the remaining ones become rare, or fail to reproduce, while species adapted to more open and successional habitats, as well as those that are more tolerant to human-induced disturbances in general, are able to persist and in some cases thrive. Species with specialized-habitat requirements are most likely to be adversely affected. The overall pattern of distribution of forest cover, the shape, area and juxtaposition of remaining forest patches and the quality of forest cover also play major roles in determining how valuable forests will be to wildlife and people alike.
The current science generally supports minimum forest habitat requirements between 30 and 50 percent, with some limited evidence that the upper limit may be even higher, depending on the organism/species phenomenon under investigation or land-use/resource management planning regime being considered/used.
As shown in Figure 63, 56 percent of the Elbow Creek catchment contains 3076 hectares of upland forest and 76 hectares of lowland forest (treed swamps) versus the 47 percent of woodland cover in the Tay River subwatershed. This is greater than the 30 percent of forest cover that is identified as the minimum threshold required to sustain forest birds according to the Guideline and which may only support less than one half of potential species richness and marginally healthy aquatic systems. When forest cover drops below 30 percent, forest birds tend to disappear as breeders across the landscape.
Figure 63 Woodland cover and forest interior in the Elbow Lake catchment (2014)
4.2.1 Woodland (Patch) Size
According to the Ministry of Natural Resources’ Natural Heritage Reference Manual (Second Edition), larger woodlands are more likely to contain a greater diversity of plant and animal species and communities than smaller woodlands and have a greater relative importance for mobile animal species such as forest birds.
Bigger forests often provide a different type of habitat. Many forest birds breed far more successfully in larger forests than they do in smaller woodlots and some rely heavily on forest interior conditions. Populations are often healthier in regions with more forest cover and where forest fragments are grouped closely together or connected by corridors of natural habitat. Small forests support small numbers of wildlife. Some species are “area-sensitive” and tend not to inhabit small woodlands, regardless of forest interior conditions. Fragmented habitat also isolates local populations, especially small mammals, amphibians and reptiles with limited mobility. This reduces the healthy mixing of genetic traits that helps populations survive over the long run (Conserving the Forest Interior. Ontario Extension Notes, 2000).
The Environment Canada Guideline also notes that for forest plants that do not disperse broadly or quickly, preservation of some relatively undisturbed large forest patches is needed to sustain them because of their restricted dispersal abilities and specialized habitat requirements and to ensure continued seed or propagation sources for restored or regenerating areas nearby.
The Natural Heritage Reference Manual continues by stating that a larger size also allows woodlands to support more resilient nutrient cycles and food webs and to be big enough to permit different and important successional stages to co-exist. Small, isolated woodlands are more susceptible to the effects of blowdown, drought, disease, insect infestations, and invasions by predators and non-indigenous plants. It is also known that the viability of woodland wildlife depends not only on the characteristics of the woodland in which they reside, but also on the characteristics of the surrounding landscape where the woodland is situated. Additionally, the percentage of forest cover in the surrounding landscape, the presence of ecological barriers such as roads, the ability of various species to cross the matrix surrounding the woodland and the proximity of adjacent habitats interact with woodland size in influencing the species assemblage within a woodland.
In the Elbow Lake catchment (in 2014), one hundred and sixty-four (57 percent) of the 286 woodland patches are very small, being less than one hectare in size. Another 96 (34 percent) of the woodland patches ranging from one to less than 20 hectares in size tend to be dominated by edge-tolerant bird species. The remaining 26 (nine percent of) woodland patches range between 27 and 400 hectares in size. Six of these patches contain woodland between 20 and 100 hectares and may support a few area-sensitive species and some edge intolerant species, but will be dominated by edge tolerant species.
Conversely, nine (three percent) of the 286 woodland patches in the drainage area exceed the 100 plus hectare size needed to support most forest dependent, area sensitive birds and are large enough to support approximately 60 percent of edge-intolerant species. Two patches top 200 hectares, which according to the Environment Canada Guideline will support 80 percent of edge-intolerant forest bird species (including most area sensitive species) that prefer interior forest habitat conditions.
Table 14 presents a comparison of woodland patch size in 2008 and 2014 along with any changes that have occurred over that time. A decrease (of six hectares) has been observed in the overall woodland patch area between the two reporting periods with change occurring across all woodland patch size classes above one hectare.
Table 14 Woodland patches in the Elbow Lake catchment (2008 and 2014)
Woodland Patch Size Range (ha)
Woodland* Patches
Patch Change
2008
2014
2008 to 2014
Number
Area
Number
Area
Number
Area
Count
Percent
Ha
Percent
Count
Percent
Ha
Percent
Count
Ha
Less than 1
163
57
54
2
164
57
54
2
1
1 to 20
96
34
434
14
96
34
432
14
-2
20 to 50
7
2
267
8
7
2
268
8
1
50 to 100
10
4
687
22
10
4
686
22
-1
100 to 200
7
2
975
31
7
2
973
31
-2
Greater than 200
2
1
741
23
2
1
739
23
-2
Totals
285
100
3158
100
286
100
3152
100
1
-6
*Includes treed swamps
4.2.2 Woodland (Forest) Interior Habitat
The forest interior is habitat deep within woodlands. It is a sheltered, secluded environment away from the influence of forest edges and open habitats. Some people call it the “core” or the “heart” of a woodland. The presence of forest interior is a good sign of woodland health, and is directly related to the woodland’s size and shape. Large woodlands with round or square outlines have the greatest amount of forest interior. Small, narrow woodlands may have no forest interior conditions at all. Forest interior habitat is a remnant natural environment, reminiscent of the extensive, continuous forests of the past. This increasingly rare forest habitat is now a refuge for certain forest-dependent wildlife; they simply must have it to survive and thrive in a fragmented forest landscape (Conserving the Forest Interior. Ontario Extension Notes, 2000).
The Natural Heritage Reference Manual states that woodland interior habitat is usually defined as habitat more than 100 metres from the edge of the woodland and provides for relative seclusion from outside influences along with a moister, more sheltered and productive forest habitat for certain area sensitive species. Woodlands with interior habitat have centres that are more clearly buffered against the edge effects of agricultural activities or more harmful urban activities than those without.
In the Elbow Lake catchment (in 2014), the 286 woodland patches contain 36 forest interior patches (Figure 63) that occupy five percent (261 ha.) of the catchment land area (which is equal to the five percent of interior forest in the Tay River subwatershed). This is below the ten percent figure referred to in the Environment Canada Guideline that is considered to be the minimum threshold for supporting edge intolerant bird species and other forest dwelling species in the landscape.
Most patches (29) have less than 10 hectares of interior forest, eleven of which have small areas of interior forest habitat less than one hectare in size. The remaining seven patches contain interior forest between 12 and 64 hectares in area. Between 2008 and 2014, a small loss of one hectare of interior forest was observed in the Elbow Lake catchment (Table 15).
Table 15 Woodland interior in the Elbow Lake catchment (2008 and 2014)
Woodland Interior Habitat Size Range (ha)
Woodland Interior
Interior Change
2008
2014
2008 to 2014
Number
Area
Number
Area
Number
Area
Count
Percent
Ha
Percent
Count
Percent
Ha
Percent
Count
Ha
Less than 1
11
30
2
1
11
30
2
1
1 to 10
18
50
82
31
18
50
81
31
-1
10 to 30
5
14
84
32
5
14
84
32
30 to 50
1
3
30
12
1
3
30
12
50 to 100
1
3
64
24
1
3
64
24
Totals
36
100
262
100
36
100
261
100
-1
4.3 Wetland Cover
Wetlands are habitats forming the interface between aquatic and terrestrial systems. They are among the most productive and biologically diverse habitats on the planet. By the 1980s, according to the Natural Heritage Reference Manual, 68 percent of the original wetlands south of the Precambrian Shield in Ontario had been lost through encroachment, land clearance, drainage and filling.
Wetlands perform a number of important ecological and hydrological functions and provide an array of social and economic benefits that society values. Maintaining wetland cover in a watershed provides many ecological, economic, hydrological and social benefits that are listed in the Reference Manual and which may include:
contributing to the stabilization of shorelines and to the reduction of erosion damage through the mitigation of water flow and soil binding by plant roots
mitigating surface water flow by storing water during periods of peak flow (such as spring snowmelt and heavy rainfall events) and releasing water during periods of low flow (this mitigation of water flow also contributes to a reduction of flood damage)
contributing to an improved water quality through the trapping of sediments, the removal and/or retention of excess nutrients, the immobilization and/or degradation of contaminants and the removal of bacteria
providing renewable harvesting of timber, fuel wood, fish, wildlife and wild rice
contributing to a stable, long-term water supply in areas of groundwater recharge and discharge
providing a high diversity of habitats that support a wide variety of plants and animals
acting as “carbon sinks” making a significant contribution to carbon storage
providing opportunities for recreation, education, research and tourism
Historically, the overall wetland coverage within the Great Lakes basin exceeded 10 percent, but there was significant variability among watersheds and jurisdictions, as stated in the Environment Canada Guideline. In the Rideau Valley Watershed, it has been estimated that pre-settlement wetland cover averaged 35 percent using information provided by Ducks Unlimited Canada (2010) versus the 21 percent of wetland cover existing in 2014 derived from DRAPE imagery analysis.
Figure 64 Wetland cover in the Elbow Lake catchment (2014)
Reliable, pre-settlement wetland cover data is unavailable for the Elbow Lake catchment; however, data for the years 2008 and 2014 is available and shows that wetland cover remains largely unchanged at 27 percent in 2014 (as indicated in Table 16 and shown in Figure 64). To maintain critical hydrological, ecological functions along with related recreational and economic benefits provided by these wetland habitats in the catchment, a “no net loss” of currently existing wetlands should be employed to ensure the continued provision of tangible benefits accruing from them to landowners and surrounding communities.
Table 16 Wetland cover in the Elbow Lake catchment (2014)
Wetland Cover
Pre-settlement
2008
2014
Change - Historic to 2014
Area
Area
Area
Area
Ha
Percent
Ha
Percent
Ha
Percent
Ha
Percent
Elbow Lake
n/a
n/a
1545
27
1548
27
n/a
n/a
Tay River
n/a
n/a
15280
19
15330
19
n/a
n/a
Rideau Valley
134115
35
n/a
n/a
82076
21
-52039
-39
4.4 Shoreline Cover
The riparian or shoreline zone is that special area where the land meets the water. Well-vegetated shorelines are critically important in protecting water quality and creating healthy aquatic habitats, lakes and rivers. Natural shorelines intercept sediments and contaminants that could impact water quality conditions and harm fish habitat in streams. Well established buffers protect the banks against erosion, improve habitat for fish by shading and cooling the water and provide protection for birds and other wildlife that feed and rear young near water. A recommended target (from the Environment Canada Guideline) is to maintain a minimum 30 metre wide vegetated buffer along at least 75 percent of the length of both sides of rivers, creeks and streams.
Figure 65 shows the extent of the ‘Natural’ vegetated riparian zone (predominantly wetland/woodland features) and ‘Other’ anthropogenic cover (crop/pastureland, roads/railways, settlements) along a 30-metre-wide area of land around Elbow Lake, other lakes and along both sides of the shoreline of Fish Creek and the many unnamed watercourses (including headwater streams) found in the Elbow Lake catchment.
Figure 65 Natural and other riparian land cover in the Elbow Lake catchment (2014)
This analysis shows that the Elbow Lake catchment riparian buffer is composed of wetland (52 percent), woodland (37 percent), crop and pastureland (six percent), roads (two percent), settlement (two percent) and meadow-thicket (one percent). Along the many watercourses (including headwater streams) flowing into Duncan and Elbow Lake and Fish Creek, the riparian buffer is composed of wetland (51 percent), woodland (37 percent), crop and pastureland (eight percent), roads (two percent), meadow-thicket (one percent) and settlement areas (one percent).
Around Elbow Lake itself, the shoreline buffer is dominated by woodland (69 percent) and cottages and houses (19 percent) with the remainder comprised of wetland (12 percent) and roads (less than one percent). Along Fish Creek, the riparian zone is composed of wetland (79 percent), woodland (19 percent), roads (one percent) and meadow-thicket, settlement and crop and pastureland (total of one percent).
Additional statistics for the Elbow Lake catchment are presented in Tables 17 to 20 and show that there has been little to no change in shoreline cover from 2008 to 2014.
Table 17 Riparian land cover in the Elbow Lake catchment (2008 vs. 2014)
Riparian Land Cover
2008
2014
Change - 2008 to 2014
Area
Area
Area
Ha.
Percent
Ha.
Percent
Ha.
Percent
Wetland
513.05
52.21
514.25
52.33
1.20
0.12
> Unevaluated
(475.86)
(48.43)
(477.06)
(48.55)
(1.20)
(0.12)
>Evaluated
(37.19)
(3.78)
(37.19)
(3.78)
(0.00)
(0.00)
Woodland
365.33
37.18
363.86
37.03
-1.47
-0.15
Crop & Pasture
59.55
6.06
59.55
6.06
0.00
0.00
Transportation
16.39
1.67
16.39
1.67
0.00
0.00
Settlement
16.25
1.65
16.53
1.68
0.28
0.03
Meadow-Thicket
12.06
1.23
12.06
1.23
0.00
0.00
Table 18 Riparian land cover around Elbow Lake (2008 vs. 2014)
Riparian Land Cover
2008
2014
Change - 2008 to 2014
Area
Area
Area
Ha.
Percent
Ha.
Percent
Ha.
Percent
Woodland
22.97
69.57
22.69
68.73
-0.28
-0.84
Settlement
5.90
17.87
6.18
18.72
0.28
0.85
Wetland
3.98
12.06
3.98
12.06
0.00
0.00
> Unevaluated
(3.98)
(12.06)
(3.98)
(12.06)
(0.00)
(0.00)
Transportation
0.16
0.50
0.16
0.50
0.00
0.00
Table 19 Riparian land cover along Fish Creek (2008 vs. 2014)
Riparian Land Cover
2008
2014
Change - 2008 to 2014
Area
Area
Area
Ha.
Percent
Ha.
Percent
Ha.
Percent
Wetland
93.66
78.58
93.87
78.75
0.21
0.17
> Unevaluated
(71.85)
(60.28)
(72.06)
(60.45)
(0.21)
(0.17)
> Evaluated
(21.81)
(18.3)
(21.81)
(18.3)
(0.00)
(0.00)
Woodland
22.91
19.22
22.71
19.05
-0.20
-0.17
Transportation
1.24
1.05
1.25
1.05
0.01
0.00
Meadow-Thicket
0.61
0.51
0.61
0.51
0.00
0.00
Settlement
0.42
0.35
0.42
0.35
0.00
0.00
Crop and Pasture
0.35
0.29
0.35
0.29
0.00
0.00
Table 20 Riparian land cover along streams in the Elbow Lake catchment (2008 vs. 2014)
5.0 Elbow Lake Catchment: Stewardship and Water Resources Protection
The RVCA and its partners are working to protect and enhance environmental conditions in the Tay River Watershed. Figure 66 shows the location of all stewardship projects completed in the Elbow Lake catchment.
Figure 66 Stewardship site locations in the Elbow Lake catchment
5.1 Rural Clean Water
The Rural Clean Water Program provides technical and financial assistance to farmers and other rural landowners, to aid in the implementation of projects that protect water quality. Funding is granted to those projects that support best management practices for application in the protection and improvement of surface and ground water resources. The program also supports climate change adaptation and low impact development projects as well as educating rural landowners about environmental stewardship of private property. Examples of supported projects include livestock exclusion fencing, controlled tile drainage, cover crops, erosion control, well related projects, and many more. For a list of eligible projects and to apply for funding, see Rural Clean Water.
In the Elbow Lake catchment from 2011 to 2016, one windbreak/buffer and one education initiative were completed at a total value of $2,115.00 with $978.00 of that amount funded through grant dollars from the RVCA.
5.2 Private Land Forestry
Forest cover and tree planting continues to be one of the most widely supported strategies to improve our environment. The many benefits of forest cover include carbon sequestration, flood mitigation and water quality improvement as well as providing wildlife habitat. For more information about the Program and landowner eligibility, please see the following: Tree Planting in the Rideau Valley Watershed and Trees for Tomorrow.
5.3 Shoreline Naturalization
Natural shoreline buffers rich in native plants are critically important to protecting the health of our lakes, rivers and streams. Shoreline vegetation protects water quality and aquatic habitat by intercepting potentially harmful contaminants such as nutrients, pollutants and sediment, regulating water temperatures, slowing runoff and providing important fish and wildlife habitat. Natural shorelines also help improve climate change resiliency by increasing flood storage and providing protection from erosion during extreme weather events.
Though the RVCA's Shoreline Naturalization Program, landowners (private and public property owners) have naturalized more than 2.3 km of shoreline in the Tay Watershed by planting over 10,563 native trees and shrubs at 96 sites since 2008. In the Elbow Lake catchment, a total of 426 native trees and shrubs have been planted along 100 metres of shoreline at an average buffer width of five metres for a total project value of $4,834.00.
5.4 Fish and Wetland Habitat Improvement
With funding from the Ministry of Natural Resources, a group of volunteer from Elbow Lake hauled cobblestone onto the winter ice in order to improve the potential of the walleye spawning bed in the lake. This work was completed in 2013 and its success is to be determined using the results from a fish survey conducted by the Ministry of Natural Resources and Forestry in 2017.
5.5 Valley, Stream, Wetland and Hazard Lands
The Elbow Lake catchment covers 56 square kilometres with 2.5 square kilometres (or four percent) of the drainage area being within the regulation limit of Ontario Regulation 174/06 (Figure 67), giving protection to wetland areas and river or stream valleys that are affected by flooding and erosion hazards.
Wetlands occupy 15 square kilometres (or 27 percent) of the catchment. Of these wetlands, one square kilometre (or seven percent) is designated as provincially significant and included within the RVCA regulation limit. This leaves the remaining 14 sq. km (or 93 percent) of wetlands in the catchment outside the regulated area limit.
Of the 159.9 kilometres of stream in the catchment, regulation limit mapping has been plotted along 9.7 kilometers of streams (representing six percent of all streams in the catchment). Some of these regulated streams (6.9 km) flow through regulated wetlands; the remaining 2.8 kilometres of regulated streams are located outside of those wetlands. Plotting of the regulation limit on the remaining 150.2 kilometres (or 94 percent) of streams requires identification of flood and erosion hazards and valley systems.
Within those areas of the Elbow Lake catchment subject to the regulation (limit), efforts (have been made and) continue through RVCA planning and regulations input and review to manage the impact of development (and other land management practices) in areas where “natural hazards” are associated with rivers, streams, valley lands and wetlands. For areas beyond the regulation limit, protection of the catchment’s watercourses is only provided through the “alteration to waterways” provision of the regulation.
Figure 67 Regulated natural features and hazards in the Elbow Lake catchment
5.6 Vulnerable Drinking Water Areas
Mississippi-Rideau Source Water Protection Program has mapped the north boundary of the Elbow Lake catchment as a Significant Groundwater Recharge Areas and all of the catchment as a Highly Vulnerable Aquifer. This means that the nature of the overburden (thin soils, fractured bedrock) does not provide a high level of protection for the underlying groundwater making the aquifer more vulnerable to contaminants released on the surface. There are no Well-Head protection Areas in the catchment.
The Mississippi-Rideau Source Protection Plan includes policies that focus on the protection of groundwater region-wide due to the fact that most of the region, which encompasses the Mississippi and Rideau watersheds, is considered Highly Vulnerable Aquifer. For detailed maps and policies that have been developed to protect drinking water sources, visit the Mississippi-Rideau Source Protection Region website.
Developed by the Elbow Lake (Parham) Association and its partners, the Elbow Lake Stewardship Plan (2012) provides information on many aspects of the lake environment, as well as issues of concern and actions to be taken to maintain and improve the long-term health of the lake. The following list includes some of the accomplishments of the Elbow Lake Association and residents that have implications for the well-being of the land and water resources of the lake ecosystem. Specific achievements of the Elbow Lake community are indicated by an asterisk.
Elbow Lake and Catchment Health
Shoreline Assessment
In 2013, an assessment of the Elbow Lake shoreline was carried out under the Love Your Lake Program. Individual assessment reports were made available to property owners in the spring of 2014. To date, only 39 of the 72 reports have been ordered (although it should be noted that 11 of the 72 properties are undeveloped). In 2017, the Elbow Lake Association decided to help fund the (re)printing of all 72 reports and will deliver them to property owners in 2018 along with information about the RVCA's Shoreline Naturalization Program.*
Out of the 72 properties assessed under the Love Your Lake Program, 28 (39 percent) were classified as majority ornamental, 23 (32 percent) as majority natural and 21 (29 percent) as majority regenerative. It is recognized that ornamental or degraded waterfronts will contribute additional nutrients and sediments to a waterbody such as Elbow Lake.
Shoreline Naturalization
In 2015, while carrying out a live planting on one resident’s property, RVCA presented a short workshop on shoreline naturalization. As a follow-up, the Elbow Lake Association appointed a coordinator to help organize RVCA site visits for residents and has been promoting the Program at its AGM's. To date, another seven properties have had site visits. In addition, at least three others have agreed to planting plans in the course of obtaining building permits to replace their cottages with new homes. One of these was for a new home on the site of a small campground, which was the only commercial development on the lake and has now been removed.*
426 native trees and shrubs have been planted at five project sites by the RVCA’s Shoreline Naturalization Program at an average buffer width of five metres along 100 metres of shoreline.
Water Quality
Elbow Lake is sampled yearly by the RVCA for five parameters, four times a year along with one stream sampling site on Fish Creek being sampled for 22 parameters, six times a year to assess surface chemistry water quality conditions.
One Ontario Benthic Biomonitoring Network site on Fish Creek is sampled by the RVCA with three replicates to assess instream biological water quality conditions.
Two Rural Clean Water Program projects were completed by the RVCA Rural Clean Water Program.
Township of Central Frontenac will implement a septic re-inspection program (mandatory/voluntary) in 2019. The service is to be provided by the Mississippi-Rideau Septic System Office.
Elbow Lake and Catchment Habitat
Broad-scale Fish Community Monitoring
2012 fish survey was conducted by the Frontenac Stewardship Council at the request of the Lake Steward in order to establish a baseline for determining the success of any future fish enhancement project. Specimens were sent to the Ministry of Natural Resources for aging, etc. The 2017 fish survey was conducted by the Ministry of Natural Resources and Forestry.*
Walleye Spawning Enhancement Project
With funding from the Ministry of Natural Resources, a group of volunteer lake residents in 2013 hauled cobblestone onto the winter ice in order to improve the potential of the walleye spawning bed. The results of the 2017 fish survey will help to evaluate the success of this effort.*
In-stream Habitat
2.7 kilometres of Fish Creek are surveyed and 27 headwaters sites are sampled by the RVCA Stream Characterization Program.
Elbow Lake Association Leadership
Lake Planning
The Elbow Lake (Parham) Stewardship Plan was published in spring 2012 and distributed to all property owners. It was also presented to the Township of Central Frontenac Council in the fall. Since then, projects and issues related to the Plan’s five main objectives have been discussed annually at the Lake Association’s Annual General Meeting.These objectives are to: 1) maintain and improve water quality 2) maintain and improve wildlife and fish habitat 3) preserve peace and tranquility 4) emphasize safety in the pursuit of recreational opportunities and 5) strengthen a sense of community.*
Liaison with Other Lake Associations
The Elbow Lake Association continues to liaise with other local lake associations through its participation in the Lake Networking Group.*
Developed by the Elbow Lake (Parham) Association and its partners, the Elbow Lake Stewardship Plan (2012) provides information on many aspects of the lake environment, as well as issues of concern identified by the lake community that could threaten the long-term health of the lake. The following list includes some of those identified issues that have implications for the water and land resources of the lake ecosystem. Specific issues noted by the lake community are indicated by an asterisk.
Development
Waterfront property development is occurring primarily through the transformation of traditional, seasonal cottages into larger year-round dwellings. This transition is taking place either through re-development of an existing cottage lot or incremental alterations (additions, sleeping cabins, gazebos, decks, sheds, boat houses, garages, lawns, shoreline modifications, docks), all of which may put additional stress on the sensitive shoreline zone and the lake along with potential, added septic system loading.
Many waterfront properties contain existing non-conforming dwellings with respect to minimum water frontage and lot area and are often located within 30 metres of the water that require minor variances for expansion and/or reconstruction of dwellings where standard development setbacks from water are difficult to achieve. In these cases, of which there are many, staff at the Township of Central Frontenac and the Conservation Authority often meet with resistance and push back when attempts are made to implement standards for development setbacks, vegetated shorelines and septic systems.
Monitoring implementation of conditions of planning and regulatory approvals is challenging due to a lack of resources.
Headwaters/In-water Habitat/Shorelines
The Elbow Lake Association has been actively promoting good shoreline practices for many years. The Executive is disappointed that more Elbow Lake residents have not ordered their 2013 Love your Lake Shoreline Assessment Reports or participated in the RVCA Shoreline Naturalization Program.*
Anecdotal evidence suggests that the level of aquatic vegetation in Elbow Lake has increased significantly since the Frontenac Stewardship Council conducted a survey in 2010. At the time, Eurasian Watermilfoil was found at six sites with only one patch being of significant size; in 2017, at least one other large patch has appeared along with other smaller ones.*
Elbow Lake has seen a small increase in the area of settlement (0.28 ha.) along its shoreline between 2008 and 2014, due primarily to a loss of woodland.
Two of twenty-seven sampled headwater sites in the catchment have been modified (one is channelized, the other is a roadside ditch)(see Section 3.4.2 of this report).
Littoral zone mapping identifying substrate type, vegetation and habitat features along with opportunities for shoreline enhancement is unavailable for Elbow Lake.
Land Cover
Land cover has changed across the catchment (2008 to 2014) largely as a result of an increase in the area of settlement (4 ha.) and wetland (2 ha.) and loss of woodland (6 ha.)(see Section 4.1 of this report).
Wetlands cover 27 percent (1548 ha.) of the catchment (in 2014). Ninety-three percent (1434 ha.) of these wetlands remain unevaluated and unregulated and although they are not under imminent threat from development activity, they do remain vulnerable to drainage and land clearing activities in the absence of any regulatory and planning controls that would otherwise protect them for the many important hydrological, social, biological and ecological functions/services/values they provide to landowners and the surrounding community (see Section 4.3 of this report).
Water Quality
Elbow Lake surface chemistry water quality rating ranges from Very Poor to Poor (see Section 2.1 of this report).
The Elbow Lake Association notes that phosphorus and nitrogen concentrations have shown persistent instances of elevated levels above the Provincial Water Quality Objectives through the years. This may be due to the influence of such factors as the large wetland along the south shore of the lake and repeated dynamiting of the beaver dam along the CPR railroad.*
Fish Creek surface chemistry water quality rating ranges from Fair in its upper reach (at the Wagarville Rd. crossing) to Poor and Good close to its outlet into the West Basin of Bobs Lake (upstream of the Bobs Lake Rd. crossing)(see Section 2.2 of this report).
Fish Creek instream biological water quality conditions range from Poor to Good at the County Road 38 inventory location (south of Parham)(see Section 3.3.1 of this report).
Developed by the Elbow Lake (Parham) Association and its partners, the Elbow Lake Stewardship Plan (2012) provides information on many aspects of the lake environment, as well as actions to maintain and improve the long-term health of the lake. The following list includes some of those identified actions that have implications for the land and water resources of the lake ecosystem. Specific actions noted by the Elbow Lake community are indicated by an asterisk.
Elbow Lake and Catchment Health
Development
Work with approval authorities (Central Frontenac Township, Frontenac County, Kingston Frontenac Lennox and AddingtonHealth Unit, Mississippi Rideau Septic System Office and RVCA) and waterfront property owners (including the Duncan Lake community and Elbow Lake Association) to consistently implement current land use planning and development policies for water quality and shoreline protection adjacent to Duncan Lake, Elbow Lake, Fish Creek and headwater streams in the catchment (i.e., a minimum 30 metre development setback from water).
Explore ways and means to more effectively enforce and implement conditions of land-use planning and development approval to achieve net environmental gains (particularly with respect to rehabilitating or protecting naturally vegetated shorelines and water quality).
Encourage Committee of Adjustment to take advantage of technical and environmental information and recommendations forthcoming from planning and environmental professionals.
Municipalities in the Tay Watershed are encouraged to strengthen natural heritage and water resources official plan policies and zoning provisions (pertaining to water setbacks, frontage and naturalized shorelines and wetland protection) where deemed appropriate.
Work with Central Frontenac Township, Frontenac County and agencies to ensure that development approvals around lakes and along watercourses take into consideration the protection of fish habitat (including the near-shore nursery and spawning habitat).
Municipal and agency planners together with development proponents are to use the 2014 Site Evaluation Guidelines to inform decision-making about the application of development setbacks on lots with shallow soils/bedrock, steep slopes and sparse vegetation cover along with the use of the appropriate, development related, best management practices.
Utilize RVCA subwatershed and catchment reports to help develop/revise official plan policies to protect surface water resources and the natural environment (including woodlands, wetlands and shoreline cover).
Establish RVCA regulation limits around the 93 percent (1434 ha.) of wetlands in the catchment that are unevaluated. Doing this will help protect landowners from natural hazards including mitigating surface water flow by storing water during periods of peak flow (such as spring snowmelt and heavy rainfall events) and releasing water during periods of low flow (this mitigation of water flow reduces flood damage), as well as contributing to the stabilization of shorelines and to the reduction of soil erosion damage through water flow mitigation and plant soil binding/retention.
Shorelines
Continue to explore ways and means to increase individual Elbow Lake property owner acquisition of the 2013 Love Your Lake Program waterfront assessment reports and participation in the implementation of individual property recommendations.*
Take advantage of the RVCA Shoreline Naturalization Program to re-naturalize altered creek, lake and stream shoreline identified in this report as “Unnatural Riparian Land Cover". Given the undeveloped nature of most of the catchment, consider concentrating stewardship efforts on Elbow Lake waterfront properties shown in orange on the Riparian Land Cover map (see Figure 65 in Section 4.4 in this report).Other stewardship opportunities in the catchment may be determined based on septic system inspections and surface water quality monitoring results. Use the Elbow Lake coordinator to help disseminate information about the program.*
Promote the use of bioengineering methods (using native shrub/tree planting, fascines, live stakes) as a shoreline erosion mitigation measure as well as a cost effective alternative to shoreline hardening (with rip rap, armour stone, gabion baskets, walls).
Educate landowners about the value and importance of natural shorelines and property best management practices with respect to shoreline use and development, septic system installation and maintenance and shoreline vegetation retention and enhancement (Central Frontenac Township, Elbow Lake Association, Kingston Frontenac Lennox and AddingtonHealth Unit, Frontenac County, Mississippi Rideau Septic System Office and RVCA).
Water Quality
Work with the Township of Central Frontenac to establish a septic re-inspection program (mandatory/voluntary) on Elbow Lake.*
Provide advice to the Elbow Lake Association about the physical state of the large beaver dam along the south shore of Elbow Lake and its potential impact to lake water quality, if it were to fail.*
Consider further investigation of the 1) Very Poor to Poorsurface chemistry water quality rating on Elbow Lake, 2) Poor to Goodsurface chemistry water quality rating in Fish Creek andPoor to Goodinstream biological water quality rating in Fish Creek as part of a review of RVCA's Watershed Watch, Baseline and Benthic Invertebrate surface water quality monitoring.
Offer funding provided by the RVCA Rural Clean Water Program to landowners with potential projects that could improve water quality on Elbow Lake and its tributaries including Fish Creek (e.g., livestock fencing, septic system repair/replacement and streambank erosion control/stabilisation).
Educate waterfront property owners about septic system care and maintenance by providing information about sewage system maintenance (i.e., when to pump out septic systems and holding talks) through initiatives such as the Septic Savvy Workshop and services provided by the Mississippi Rideau Septic System Office.
Reduce pollutant loading to Elbow Lake through education about the application of shoreline, stormwater and agricultural best management practices; also consider using low impact development (LID) methods to improve the quality and reduce the amount of stormwater runoff directly reaching the lake ecosystem. This will be particularly beneficial in areas with extensive impervious surfaces (i.e., asphalt, concrete, buildings, and severely compacted soils) or on sensitive waterfront properties (with steep slopes/banks, shallow/impermeable soils).
Elbow Lake and Catchment Habitat
Aquatic Habitat/Fisheries/Wildlife
Consider a follow-up survey of the aquatic vegetation in Elbow Lake to determine if the anecdotal evidence of the level of aquatic vegetation in the lake has changed substantially since the 2010 Frontenac Stewardship Council survey.*
Explore the feasibility of control measures for Eurasian water milfoil, such as use of the native water milfoil weevil.*
Discuss alternatives to the dynamiting of the beaver dam along the west side of Elbow Lake undertaken by the Canadian Pacific Railway, to alleviate the Elbow Lake Association's concerns about its impact on the lake ecosystem including water quality.*
Consider a second fish spawning enhancement project on Elbow Lake, if the results of the 2017 MNR fish community survey suggest the need to do so. This action would address a number of goals listed in the Elbow Lake Stewardship Plan (2012).*
Consider a Bioblitz to learn more about the flora and fauna in the area, which could be organised by the Elbow Lake Association.This endeavour would have the added benefit of bringing residents together to exchange ideas and ultimately increase participation in other projects such as the naturalization of shorelines.*
Educate waterfront property owners about: 1) fish habitat requirements, spawning timing and near-shore and in-water activities that can disturb or destroy fish habitat and spawning sites 2) the causes of excessive algae and aquatic vegetation growth (see the RVCA publication entitled Algae and Aquatic Plant Educational Manual) and 3) healthy lake ecosystems and associated water level fluctuations in a natural environment.
Elbow Lake Association Leadership
Lake Planning
Continue to tackle projects and issues related to the 2012 Elbow Lake Stewardship Plan's five main objectives: 1) maintain and improve water quality 2) maintain and improve wildlife and fish habitat 3) preserve peace and tranquility 4) emphasize safety in the pursuit of recreational opportunities and 5) strengthen a sense of community.*
Use the information contained in the Tay River Subwatershed Report 2017 and Elbow Lake Catchment Report 2017 to assist with implementation of the 2012 Elbow Lake Stewardship Plan.*
The RVCA produces individual reports for 14 catchments in the Tay River subwatershed. Using data collected and analyzed by the RVCA through its watershed monitoring and land cover classification programs, surface water quality and in-stream conditions are reported for the Tay River, Tay Watershed lakes and Tay tributaries along with a summary of environmental conditions for the surrounding countryside every six years, which includes analysis of data collected through the programs along with local information provided by stakeholders up to 2017.
This information is used to better understand the effects of human activity on our water resources, allows us to better track environmental change over time and helps focus watershed management actions where they are needed the most to help sustain the ecosystem services (cultural, aesthetic and recreational values; provisioning of food, fuel and clean water; regulation of erosion/natural hazard protection and water purification; supporting nutrient/water cycling and habitat provision) provided by the catchment’s lands and forests and waters (Millennium Ecosystem Assessment 2005).
The following sections of this report are a compilation of that work for the Grants Creek catchment.
31.1 square kilometres; occupies 3.9 percent of the Tay River subwatershed; 0.7 percent of the Rideau Valley watershed.
Geology/Physiography
The Grants Creek catchment resides within part of the physiographic region known as the Algonquin Highlands. In the Tay River Subwatershed, this ancient and hilly geologic region is made up of such Precambrian rocks as marble, conglomerates, and dark or colour banded granite-like rocks. A large area of younger sandstone is found within the centre of the catchment. Although a veneer of glacial drift (glacial till, sand etc.) overlies most of the bedrock in this catchment, large expanses of glacial till and clay overlie the central part of the catchment. A geologic fault may cut across the northern part of this catchment.
Municipal Coverage
Drummond/North Elmsley Township (1.5 km2; 5.0% of catchment)
Tay Valley Township (28.2 km2; 90.9% of catchment)
Town of Perth (1.2 km2; 4.1% of catchment)
Stream Length
All watercourses (including headwater streams): 63.2 km.
1.2 Vulnerable Areas
Aquifer Vulnerability
The Mississippi-Rideau Source Water Protection program has mapped the central part of this catchment as a Significant Groundwater Recharge Area and all of the catchment as a Highly Vulnerable Aquifer. There are no Well-Head Protection Areas in the catchment.
Wetland Hydrology
A watershed model developed by the RVCA in 2009 was used to study the hydrologic function of wetlands in the Rideau Valley Watershed, including those found in the Grants Creek catchment.
1.3 Conditions at a Glance
Fish Community/Thermal Regime
Warm and cool water recreational and baitfish fishery with 28 species observed in Grants Creek during 2016.
Headwater Drainage Features
Classified as wetland and channelized features with historical modifications in the form of straightening.
Instream/Riparian Habitat
Grants Creek: Low to high habitat complexity. Areas with increased habitat complexity are observed in the lower and upper reaches of the system within the catchment. The habitat complexity is considered low within the Provincially Significant Wetland along Grants Creek as defined by the criteria above; however, the wetland habitat provides the critical benefits of flood storage, water quality treatment, increased biodiversity and important aquatic and terrestrial habitat.
Land Cover Change (2008 to 2014)
Catchment
Crop-Pasture
Woodland
Wetland
Meadow-Thicket
Transportation
Settlement
Hectares
-23
-9
-1
+1
+2
+32
Land Cover Type (2014)
Catchment
Crop-Pasture
Woodland
Wetland
Settlement
Meadow-Thicket
Transportation
Water
Percent
44
28
15
8
2
2
1
Shoreline Cover Type (30 m. riparian area; 2014)
Catchment
Percent
Grants Creek
Percent
Streams*
Percent
Wetland
34
Wetland
56
Crop-Pasture
40
Crop-Pasture
32
Woodland
27
Wetland
27
Woodland
25
Crop-Pasture
8
Woodland
26
Settlement
5
Settlement
6
Settlement
4
Transportation
2
Transportation
1
Transportation
2
Meadow-Thicket
1
Meadow-Thicket
1
Meadow-Thicket
1
*Excludes Grants Creek
Significant Natural Features
Grants Creek Provincially Significant Wetland
Species at Risk (Elemental Occurrence)
Status
Species at Risk
Threatened
Blanding's Turtle
Eastern Meadowlark
Special Concern
Eastern Musk Turtle
---
Water Quality for the Protection of Aquatic Life
Water Quality Source
Grants Creek
Surface Chemistry
Poor to Very Good
Instream Biological
Poor to Fair
Grants Creek: Benthic invertebrate samples are highly variable with species that are sensitive and moderately tolerant to high organic pollution levels.
Water Wells
Approximately 220 operational private water wells in the Grants Creek catchment. Groundwater uses are mainly domestic, but also include livestock, industrial and commercial water supplies.
Wetland Cover
Wetlands are reported to have covered 34 percent of the Grants Creek catchment prior to European settlement, as compared to 16 percent (or 4.9 square kilometres) of the area in 2014. This represents a 54 percent (or 5.7 square kilometre) loss of historic wetland cover. Sixty-six percent of the remaining wetlands are regulated leaving 34 percent (or 1.6 square kilometers) unregulated.
1.4 Catchment Care
Environmental Management
Development along Grants Creek (Glen Tay Road to the Tay River in the Town of Perth) and in, and adjacent to, the Grants Creek Provincially Significant Wetland in the catchment is subject to Ontario Regulation 174-06 (entitled “Development, Interference with Wetlands and Alterations to Shorelines and Watercourses”) that protects landowners and their property from natural hazards (i.e., flooding, fluctuating water table, unstable soils) along with the hydrologic function of the wetland.
Two Environmental Activity and Sector Registries were sought for a vehicle disposal facility and for an industrial heating system in the catchment.
Three Permits To Take Water (PTTW) are active in the catchment for recreation and golf course water supplies.
Environmental Monitoring
Chemical surface (in-stream/lake) water quality collection by the RVCA since 2006 (see Section 2 of this report).
Benthic invertebrate (aquatic insect) surface (in-stream) water quality collection by the RVCA in Grants Creek since 2005 (see Section 3.3.1 of this report).
Fish survey and stream characterization survey by the RVCA on Grants Creek in 2016 included taking measurements and recording observations on instream habitat, bank stability, other attributes and preparing a temperature profile (see Section 3 of this report).
Ten drainage feature assessments were conducted by the RVCA in 2017 at road crossings in the catchment. The protocol measures zero, first and second order headwater drainage features and is a rapid assessment method characterizing the amount of water, sediment transport, and storage capacity within headwater drainage features (see Section 3.4 of this report).
Classification of Grants Creek catchment land cover types derived by the RVCA from colour aerial photography that was acquired during the spring of 2008 and 2014 (see Section 4.1of this report).
The Mississippi Rideau Septic System Office has conducted 41 voluntary septic system re-inspections on 41 properties along Grants Creek from 2004 to 2017 (see Section 5.4 of this report).
Stewardship
Eighteen stewardship projects were completed by landowners with assistance from the RVCA (see Section 5 of this report).
2.0 Grants Creek Catchment: Water Quality Conditions
Surface water quality conditions in the Grants Creek catchment are monitored by the Rideau Valley Conservation Authority (RVCA) Baseline Water Quality Monitoring Program. The baseline water quality program focuses on streams; data is collected for 22 parameters including nutrients (total phosphorus and total Kjeldahl nitrogen), E. coli, metals (like aluminum and copper) and additional chemical/physical parameters (such as alkalinity, chlorides, pH and total suspended solids). Figure 2 shows the locations of monitoring sites in the catchment.
Figure 2 Water quality monitoring sites on the Grants Creek in the Grants Creek Catchment
2.1 Grants Creek: Water Quality Rating
There are six monitored water quality sites in the Grants Creek Catchment, five of which are on Grants Creek (GRT-01 to GRT-05) and one site (STA-01) on an unnamed creek crossing Stanleyville Rd (Figure 2). The RVCA's water quality rating for these sites range from "Poor" to “Very Good” (Table 1) as determined by the Canadian Council of Ministers of the Environment (CCME) Water Quality Index.
A “Poor” rating indicates that water quality is frequently threatened or impaired; conditions often depart from natural or desirable levels. A rating of “Fair” indicates that water quality is usually protected but is occasionally threatened or impaired; conditions sometimes depart from natural or desirable levels. A rating of "Good" indicates that only a minor degree of threat or impairment is observed and conditions rarely depart from natural or desirable levels. “Very Good" indicates water quality is protected with a virtual absence of threat or impairment; conditions are very close to natural or pristine levels.
Each parameter is evaluated against established guidelines to determine water quality conditions. Those parameters that frequently exceed guidelines are presented below. Data has been analyzed over the 2006-2017 period for general trends and conditions. Table 1 shows the overall rating for the monitored surface water quality sites within the catchment and Table 2 outlines the Water Quality Index (WQI) scores and their corresponding ratings.
The scores at these sites are largely influenced by frequent high nutrient concentrations and occasional metal exceedances. For more information on the CCME WQI, please see the Tay River Subwatershed Report. For more information on the CCME WQI, please see the Tay River Subwatershed Report.
Table 1 Water Quality Index ratings for the Grants Creek Catchment
Site
Location
2006-2008
2009-2011
2012-2014
2015-2017
GRT-04
Grants Creek at Pike Lake Dam
Good (91)
Good (94)
Good (85)
Very Good (97)
GRT-03
Grants Creek at County Rd 10.
Good (85)
Good (91)
Very Good (97)
Very Good (100)
GRT-02
Grants Creek at Upper Scotch Line
Good (84)
Good (86)
Good (86)
Good (92)
GRT-05
Grants Creek downstream of Upper Scotch Line
Good (80)
Fair (75)
Fair (76)
Good (86)
GRT-01
Grants Creek at Glen Tay Rd.
Poor (59)
Good (82)
Fair (70)
Fair (70)
STA-01
Unnamed creek crossing Stanleyville Rd upstream of Pike Lake
Poor (68)
Very Poor (44)
Poor (55)
Good (80)
Table 2 Water Quality Index ratings and corresponding index scores (RVCA terminology, original WQI category names in brackets)
Rating
Index Score
Very Good (Excellent)
95-100
Good
80-94
Fair
65-79
Poor (Marginal)
45-64
Very Poor (Poor)
0-44
2.1.1 Grants Creek: Nutrients
Total phosphorus (TP) is used as a primary indicator of excessive nutrient loading and may contribute to abundant aquatic vegetation growth and depleted dissolved oxygen levels. The Provincial Water Quality Objective (PWQO) is used as the TP Guideline and states that in streams concentrations greater than 0.030 mg/l indicate an excessive amount of TP.
Total Kjeldahl nitrogen (TKN) is used as secondary indicators of nutrient loading. RVCA uses a guideline of 0.500 mg/l to assess TKN[1] .
Tables 3 and 4 summarize average nutrient concentrations at monitored sites within the Grants Creek catchment and show the proportion of results that meet the guidelines.
Table 3 Summary of total phosphorus results for the Grants Creek catchment, 2006-2017 (Highlighted values indicate average concentrations exceed the guideline)
Total Phosphorus 2006-2017
Site
Average (mg/l)
Below Guideline
No. Samples
GRT-04
0.016
99%
72
GRT-03
0.017
97%
72
GRT-02
0.023
74%
72
GRT-05
0.035
58%
72
GRT-01
0.043
33%
72
STA-01
0.179
27%
59
Table 4 Summary of total Kjeldahl nitrogen results for the Grants Creek catchment from 2006-2017 (Highlighted values indicate average concentrations exceed the guideline)
Total Kjeldahl Nitrogen 2006-2017
Site
Average (mg/l)
Below Guideline
No. Samples
GRT-04
0.439
81%
72
GRT-03
0.450
83%
71
GRT-02
0.475
65%
72
GRT-05
0.559
49%
72
GRT-01
0.595
26%
72
STA-01
1.865
13%
60
Monitoring Site GRT-04
Site GRT-04 is the at the outflow of Pike Lake, the source of Grants Creek. Almost all (99 percent) samples at this site were below the TP guideline from 2006-2017 (Figures 3 and 4). The average TP concentration in the at this site was 0.016 mg/l (Table 3), the monthly average concentrations are fairly consistent with a slight increase observed in May samples (Figure 3). Overall a decrease was observed in TP concentrations over the 2006-2017 period[2].
TKN concentrations show that the bulk of results (81 percent) were also below the guideline (Figure 6, Table 4). The average concentration over the 2006-2017 period was 0.439 mg/l (Table 4); monthly averages are comparable across the sampling season with the lowest concentrations observed in April and November (Figure 5). There was no significant trend found in TKN results at this site.
Monitoring Site GRT-03
Similar nutrient conditions to site GRT-04 are observed at site GRT-03. TP results were low, the average concentrations was 0.017 and 97 percent of samples were below the guideline (Table 3, Figure 4). As with the upstream site the highest concentrations were observed in May, with another period of slightly elevated results (with respect to average concentrations) in November (Figure 3).
The majority of TKN results were below the guideline (Figure 5 and 6), 83 percent of samples were below 0.500 mg/l (TKN Guideline) with an average concentration of 0.450 mg/l (Table 4). Average monthly concentrations were comparable, with the exception of lower concentrations in April (Figure 5).
A decreasing trend was observed in both TP and TKN concentrations at this site.
Monitoring Site GRT-02
Site GRT-02 is further downstream from GRT-04 and GRT-03. While an increase in TP concentrations is observed relative to the two upstream sites (GRT-03 and GRT-04) TP concentrations may be considered low-moderate. Seventy-four percent of samples at this site were below the TP guideline from 2006-2017 (Figures 3 and 4), and the average TP concentration in the at this site was 0.023 mg/l (Table 3). The monthly average concentrations exceeded the guideline in May and June, but are below the guideline in other months (Figure 3). A decrease was observed in TP concentrations over the 2006-2017 period.
TKN concentrations show that the bulk of results (65 percent) were also below the guideline (Figure 6, Table 4). The average concentration over the 2006-2017 period was 0.475 mg/l (Table 4). A similar pattern to TP results is observed; monthly averages are comparable, elevated results were observed in May and June, and remaining monthly averages are below the guideline (Figure 5). A declining trend in TKN concentrations was also found at this site.
Monitoring Site GRT-05
Moving further downstream nutrient concentrations continue to increase. The majority of TP results (58%) are below the guideline, however, the average concentrations was elevated at 0.035 mg/l (Table 3, Figure 4). Concentrations appear to increase from Spring through early Summer, with a second increase observed in October (Figure 3). As with other upstream sites an overall declining trend was found in TP concentrations.
The majority (49%) of TKN results were also above the guideline (Figure 5 and 6), with an average concentration of 0.559 mg/l (Table 4). Average monthly concentrations patterns were comparable with TP results, increasing from April to July, with an elevated period observed in October (Figure 5). No trend was detected in TKN concentrations at this site.
Monitoring Site GRT-01
Site GRT-01 is the last monitored site before Grants Creek meets the Tay River further downstream; increased TP concentrations continued to be observed at this site. Only 33 percent of samples were below the TP guideline from 2006-2017 (Figures 3 and 4), and the average TP concentration at this site was 0.043 mg/l (Table 3). The monthly average concentrations exceeded the guideline from May to July, with lower average concentrations into the late summer and fall (Figure 3). A weak, significant decrease in TP concentrations was observed in the 2006-2017 data set.
TKN concentrations show that the bulk of results were also elevated (Figure 6, Table 4). Only 26 percent of samples were below the guideline, the average concentration over the 2006-2017 period was 0.595 mg/l (Table 4). As with TP data for this site, increasing monthly average concentrations were observed from April-July; concentrations in subsequent months are lower, although they still exceed the guideline (Table 3). No trend was observed in TKN concentrations over the 2006-2017 period.
Figure 3 Average monthly total phosphorous concentrations in Grants Creek, 2006-2017
Figure 4 Distribution of total phosphorous concentrations in Grants Creek, 2006-2017
Figure 5 Average monthly total Kjeldahl nitrogen concentrations in Grants Creek, 2006-2017
Figure 6 Distribution of total Kjeldahl nitrogen concentrations in Grants Creek, 2006-2017
Monitoring Site STA-01
This site does not drain into Grant's Creek though has been included as part of this catchment. STA-01 monitors water quality in a small creek that drains a former waste management site along Stanleyville Rd to Pike Lake. The majority of TP samples are elevated; only 27% of samples at this site were below the guideline from 2006-2017 (Figures 7 and 8) and the average TP concentration was 0.179 (Table 3). the monthly average concentrations are fairly consistent with a slight increase observed in May samples (Figure 7). From data calculated for the monthly averages, concentrations increase through the summer peaking in July, after which a decrease is observed.
TKN results also show elevated concentrations are a feature of this water body. Thirteen percent of samples were also below the guideline (Figure 10, Table 4). The average concentration over the 2006-2017 period was 1.865 mg/l (Table 4). Averaged monthly data also shows an increase from April to July in TKN concentrations followed by a decrease in the following months (Figure 9).
There was no significant trend detected in either TP or TKN results. It should be noticed that during the late summer this creek often has very low water levels which may have impacted sampling efforts.
Figure 7 Average monthly total phosphorous concentrations at site STA-01, 2006-2017
Figure 8 Distribution of monthly total phosphorous concentrations at site STA-01, 2006-2017
Figure 9 Average monthly total Kjeldahl nitrogen concentrations at site STA-01, 2006-2017
Figure 10 Distribution of monthly total Kjeldahl nitrogen concentrations at site STA-01, 2006-2017
Summary of Grants Creek Nutrients
The data collected in Grants Creek provides evidence of nutrient enrichment downstream along the creek. Overall, there is a declining trend in TP concentrations at all sites, with a decrease in TKN observed at sites GRT-03 and GRT-02. This provides support that cumulative changes throughout the catchment have reduced nutrient loadings to the creek. This should be taken as a positive sign as high nutrient concentrations can help stimulate the growth of algae blooms and other aquatic vegetation in a water body and deplete oxygen levels as the vegetation dies off. However, elevated concentrations are still a concern in the lower reaches. Therefore, it is important to continue best management practices such as minimizing storm water runoff, enhanced shoreline buffers, minimizing/discontinuing the use of fertilizers and restricting livestock access in upstream agricultural areas to help to further reduce nutrient pollution and to continue to protect and enhance water quality conditions within Grants Creek.
Conditions at STA-01 have remained unchanged. As this is a very small watercourse with limited flow it is unlikely that this is having a significant impact of downstream water bodies such as Pike Lake. It should be noted that in 2011 extra sampling was done at this site, as well as upstream and downstream locations to determine sources of high nutrients and downstream impacts. Overall results were found to be inconclusive and any elevated nutrients were attenuated by the large wetland complex downstream of this site. For more information, please contact the RVCA Surface Water Quality Coordinator.
2.1.2 Grants Creek: E. coli
Escherichia coli (E. coli) is used as an indicator of bacterial pollution from human or animal waste; in elevated concentrations it can pose a risk to human health. The PWQO of 100 colony forming units/100 millilitres (CFU/100 ml) is used. E. coli counts greater than this guideline indicate that bacterial contamination may be a problem within a water body.
Table 5 summarizes the geometric mean[3] for the monitored sites within the Grants Creek catchment and shows the proportion of samples that meet the E. coli guideline of 100 CFU/100 ml. The results of the geometric mean with respect to the guideline Figures 11-13 respectively.
Table 5 Summary of E. coli results for the Grants Creek catchment, 2006-2017 (Highlighted values indicate average concentrations exceed the guideline)
E. coli 2006-2017
Site
Geometric Mean (CFU/100ml)
Below Guideline
No. Samples
GRT-04
14
97%
72
GRT-03
23
90%
72
GRT-02
103
44%
72
GRT-05
109
46%
72
GRT-01
71
61%
72
STA-01
48
68%
60
Monitoring Site GRT-04
E. coli counts at site GRT-04 indicate little concern with regard to bacterial contamination. Ninety-seven percent of samples were below the guideline (Figures 11-12) and the count at the geometric mean was only 14 CFU/100ml (Table 5). Monthly E. coli counts were comparable, with lower numbers observed in April and November, likely due to cooler weather conditions which inhibits bacterial growth (Figure 12). No trend was noted in E. coli counts over the 2006-2017 period.
Monitoring Site GRT-03
Elevated E. coli counts at site GRT-03 were uncommon. Ninety percent of samples were below the guideline (Figure 12) from 2006-2017. The count at the geometric mean was 23 CFU/100ml (Table 5) and well below the guideline, the highest counts were recorded in May (Figure 11). As with site GRT-04 there was no significant trend in E. coli data over the 2006-2017 period.
Monitoring Site GRT-02
There is a noted increase in E. coli counts at site GRT-02 when compared to upstream sites (GRT-04 and GRT-03). Only 44% of samples were below the guideline, with a elevated count of 103 CFU/100ml at the geometric mean (Table 5, Figure 11). Monthly E. coli counts were variable across the sampling season, often exceeding the guideline (Figure 12). As with upstream sites no trend was noted in E. coli counts over the 2006-2017 period.
Monitoring Site GRT-05
The results for the GRT-05 are comparable to neighbouring site GRT-02. Forty-six percent of samples were below the guideline (Figure 12) from 2006-2017. The count at the geometric mean was above the guideline at 109 CFU/100ml (Table 5). As with site GRT-02 monthly counts were variable and often exceeded the guideline (Figure 12), no significant trend was noted at this site.
Monitoring Site GRT-01
The results for the GRT-01 show a reduction in downstream bacterial contamination from sites GRT-02 and GRT-05. The majority of samples (61%) were below the E. coli guideline as was the count of 71 CFU/100ml at the geometric mean (Table 5). A pattern of variable monthly counts continued to be observed (Figure 11), indicating that this data may not be strongly influenced by season. As with other sites on Grants Creek no significant trend was noted in E. coli counts.
Figure 11 Geometric mean of E. coli results in Grants Creek, 2006-2017
Figure 12 Distribution of E. coli results in Grants Creek, 2006-2017
Monitoring Site STA-01
The results for the STA-01 show that though periods of elevated concentrations occur bacterial contamination is not a concern at this site. The majority of samples (68%) were below the E. coli guideline as was the count of 48 CFU/100ml at the geometric mean (Figure 14, Table 5). Counts were lower in the spring and fall months likely due to cooler temperatures that inhibit bacterial growth (Figure 13).
Figure 13 Geometric mean of E. coli results at site STA-01, 2006-2017
Figure 14 Distribution of E. coli counts at site STA-01, 2006-2017
Summary of Grants Creek Bacterial Contamination
Bacterial contamination does not appear to be a significant concern in most sections of Grants Creek. The data does suggest that upstream of site GRT-02 and GRT-05 (and likely directly downstream) bacterial pollution may be an issue given the high proportion of samples above the guideline and elevated counts at the geometric mean. Best management practices such as enhancing shoreline buffers, limiting livestock access and minimizing runoff in both developed and agricultural areas can help to protect water quality within Grants Creek.
2.1.3 Grants Creek: Metals
Of the metals routinely monitored in the Grants Creek Catchment, aluminum (Al) most commonly reported concentrations above its PWQO of 0.075 mg/l. In elevated concentrations, this metals can have toxic effects on sensitive aquatic species.
Table 6 summarize metal concentrations at sites and shows the proportion of samples that meet guidelines. Figures 15 and 16 show metal concentrations with respect to the guidelines for the two periods of interest, 2006-2017.
Table 6 Summary of aluminum results in Grants Creek, 2006-2017 (Highlighted values indicate average concentrations exceed the guideline)
Aluminum 2006-2017
Site
Average (mg/l)
Below Guideline
No. Samples
GRT-04
0.029
96%
27
GRT-03
0.021
100%
27
GRT-02
0.025
97%
60
GRT-05
0.042
84%
61
GRT-01
0.110
67%
60
STA-01
0.255
79%
24
Monitoring Site GRT-04
Aluminum concentrations at site GRT-04 show little evidence of this pollution in the upper reaches of the creek. Ninety-six percent of samples were below the guideline (Figures 15-16) with an average concentration of 0.029 mg/l (Table 6). At this site metals are only monitored in April and August to provide information on concentrations during high and low flow conditions. A few samples have been collected during other months but please note this is a limited number (Figure 16). No trend was noted in Al concentrations over the 2006-2017 period.
Monitoring Site GRT-03
As with the upstream site (GRT-04) elevated Al concentrations are not a feature of this site. All samples were below the guideline (Figure 16) from 2006-2017. The average concentration was 0.021 (Table 6) and well below the guideline. Metals concentrations are also only monitored in August and April (Figure 15) at this site. A few samples have been collected during other months but please note this is a limited number; no significant trend was noted in the available data.
Monitoring Site GRT-02
There is no noted increase Al concentrations at GRT-02 when compared to upstream sites (GRT-04 and GRT-03), as with upstream sites metal samples are primarily collected in April and August at GRT-02 (Figure 15). The majority of samples (97 percent) were below the guideline, an average concentration of 0.025 mg/l (Table 6, Figure 16). As with upstream sites no trend was observed in Al concentrations over the 2006-2017 period.
Monitoring Site GRT-05
The results at site GRT-05 show a slight increase in Al concentrations when compared to the previously discussed upstream sites. Eighty-four percent of samples were below the guideline (Figure 16) from 2006-2017 and the average concentration was 0.042 mg/l (Table 6). Metal concentrations are monitored monthly at this site due to the increase in commercial and agricultural activity in this reach of the the creek, all monthly average concentrations were below the guideline (Figure 15). No significant trend in Al concentration was noted at this site.
Monitoring Site GRT-01
The results for the GRT-01 show elevated Al concentration at this site (Figure 15). The majority of samples (67%) were below the Al guideline (Figure 16); however the average concentration was elevated at 0.110 mg/l (Table 6), indicating that periods of significantly elevated samples are contributing to a high overall concentration as shown in Figure 16. As with site GRT-05, samples are collected monthly at this site; elevated concentration are observed during the majority of sampled months (Figure 15). Overall, no significant trend was observed in Al concentrations at this site.
Figure 15 Average aluminum concentrations in Grants Creek, 2006-2017
Figure 16 Distribution of aluminum concentrations in Grants Creek, 2006-2017
Monitoring Site STA-01
The results for the STA-01 show that few elevated samples have resulted in high average aluminum concentrations at this site. The majority of samples (79%) were below theAl guideline, however the average concentration exceeded it at 0.255 mg/l (Figure 17-18, Table 6). This site has typically only been monitored in April and August, though sampling may have occurred outside these months to capture other high or low flow events, concentrations have typically been higher during the summer months (Figure 17). There have been no significant trends in the data. Figure 18 shows that periods of very high aluminum concentrations have only been observed in 2011 and 2013; subsequent sampling has not found these high concentrations to persist at this site.
Figure 17 Average aluminum concentrations at site STA-01, 2006-2017
Figure 18 Distribution of aluminum concentrations at site STA-01, 2006-2017
Summary of Grants Creek Metals
In the Grants Creek catchment aluminum concentrations have remained consistent through the monitoring period 2006-2017. The majority of elevated concentrations have been observed at the two most downstream sites in Grants Creek. This can likely be attributed of the cummulative impact of runoff within the catchment and the intensification of commercial, agricultural and developed land use upstream of these two sites (GRT-05 and GRT-01). Runoff due to meltwater and rainfall may pick up pollutants from farms, yards, roads and parking lots. Efforts should continue to be made to identify pollution sources and implement best management practices to reduce any inputs to improve overall stream health and lessen downstream impacts on the lower reach of Grants Creek and the Tay River.
1 No Ontario guideline for TKN is presently available; however, waters not influenced by excessive organic inputs typically range from 0.100 to 0.500 mg/l, Environment Canada (1979) Water Quality Sourcebook, A Guide to Water Quality Parameters, Inland Waters Directorate, Water Quality Branch, Ottawa, Canada.
2 Trends in the data were assessed using the Mann-Kendall trend test and Sens slope statistic.
3 A type of mean or average, which indicates the central tendency or typical value of a set of numbers by using the product of their values (as opposed to the arithmetic mean which uses their sum). It is often used to summarize a variable that varies over several orders of magnitude, such as E. coli counts.
The Stream Characterization Program evaluated 5.4 km of Grants Creek in 2016. A total of 54 stream survey assessments were completed in late July and the middle of August.
During the summer and fall of 2016, the Rideau Valley watershed experienced periods of severe drought. Precipitation levels were measured at less than 40% of the long-term average, as the water supply was unable to meet local demand. The lack of rainfall affected the success and function of farm crops, municipal and private wells, lawns and gardens, navigation and ultimately the health of our lakes, rivers and streams.
Low water conditions were readily observed throughout the watershed, as many of the streams were highly fragmented or completely dry. Aquatic species such as amphibians, fish and macroinvertebrates were affected, as suitable habitat may have been limited. Fragmentation of habitat was not observed along Grants Creek during the drought conditions in 2016, as the many large wetlands (provincially significant and unevaluated) along Grants Creek and upstream, around Pike Lake, provided critical baseflow to maintain the aquatic and riparian ecosystems (see photos below).
Grants Creek showing no apparent loss of baseflow during the drought of 2016
Grants Creek provincially significant wetland showing no apparent loss of baseflow during the drought of 2016
3.1 Grants Creek Overbank Zone
3.1.1 Riparian Buffer Land Cover Evaluation
The quality of the riparian area increases with the width, complexity and linear extent of its vegetation along a stream or creek. A complex riparian community consists of diverse plant species native to the site, with multiple age-classes providing vertical structural diversity along a watercourse.
Here is a list of watershed benefits from a healthy riparian buffer zone:
• Reduces the amount of pollutants that reach the stream from surface runoff • Helps reduce and mitigates erosion • Provides a microclimate that is cooler during the summer months providing cooler water for aquatic organisms • Provides large wood structure from fallen trees and limbs that form instream cover, create pools, stabilize the streambed, and provide habitat for aquatic organisms • Provides organic material for stream biota that, among other functions, is the base of the food chain in lower order streams • Provides habitat for terrestrial insects that drop in the stream and become food for fish and travel corridors for other terrestrial animals • Dissipates energy during flood events • Often provides the only refuge areas for fish during out-of-bank flows (behind trees, stumps, and logs)
Figure 19 demonstrates the buffer conditions of the left and right banks separately. Grants Creek had a buffer of greater than 30 meters along 94 percent of the left and right banks.
Figure 19 Riparian Buffer Evaluation along Grants Creek
3.1.2 Riparian Buffer Alterations
Alterations within the riparian buffer were assessed within three distinct shoreline zones (0-5m, 5-15m, 15-30m), and evaluated based on the dominant vegetative community and/or land cover type (Figure 20). The riparian buffer zone along Grants Creek was found to be dominated by wetland and forest conditions.
Figure 20 Riparian buffer alterations along Grants Creek
3.1.3 Adjacent Land Use
The RVCA’s Stream Characterization Program identifies eight different land uses along Grants Creek (Figure 21). Surrounding land use is considered from the beginning to end of the survey section (100m) and up to 100m on each side of the river. Land use outside of this area is not considered for the surveys but is nonetheless part of the subwatershed and will influence the creek. Wetland habitat was dominant at 67 percent; forested habitat was observed in the adjacent lands along Grants Creek at 50 percent of the surveyed sections, 35 percent scrubland and 15 percent meadow habitat. The remaining land use consisted of active agriculture, pasture, residential and infrastructure in the form of road crossings.
Figure 21 Land Use along Grants Creek
3.2 Grants Creek Shoreline Zone
3.2.1 Instream Erosion
Stream erosion is the process by which water erodes and transports sediments, resulting in dynamic flows and diverse habitat conditions. Excessive erosion can result in drastic environmental changes, as habitat conditions, water quality and aquatic life are all negatively affected. Bank stability was assessed as the overall extent of each section with “unstable” shoreline conditions. These conditions are defined by the presence of significant exposed soils/roots, minimal bank vegetation, severe undercutting, slumping or scour and potential failed erosion measures. The majority of Grants Creek had no erosion observed along the surveyed sections with only two sections having low levels of erosion in the lower reach (Figure 22).
Figure 22 Erosion levels along Grants Creek
3.2.2 Undercut Stream Banks
Stream bank undercuts can provide excellent cover habitat for aquatic life, however excessive levels can be an indication of unstable shoreline conditions. Bank undercut was assessed as the overall extent of each surveyed section with overhanging bank cover present. Figure 23 shows that Grants Creek had no observed undercut banks along the majority of the system which is typical for systems that are dominated by riverine wetland habitat along the shoreline.
Figure 23 Undercut stream banks along Grants Creek
3.2.3 Stream Shading
Grasses, shrubs and trees all contribute towards shading a stream. Shade is important in moderating stream temperature, contributing to food supply and helping with nutrient reduction within a stream. Stream cover is assessed as the total coverage area in each section that is shaded by overhanging trees/grasses and tree canopy, at greater than 1m above the water surface. Figure 24 shows low levels of stream shading along the majority of Grants Creek, which is consistent with wide open water wetland habitat conditions. There were several sections in the upper reaches, where the channel narrows, that had high to moderate levels of stream shading along the creek.
Figure 24 Stream shading along Grants Creek
3.2.4 Instream Wood Structure
Forested shorelines provide essential complex habitat through the perpetual process of shoreline trees falling into the water. This continuous recruitment of trees creates a wood-based physical structure in the littoral zone that is common on natural systems. Insects, fish, amphibians, birds, and other animals have also evolved with this abundance of near shore wood and it is essential to their life cycles. With increased development along many waterways, forested lakeshores have been altered and wood-based physical structure in many waterways has been reduced. It is important to restore this essential habitat to aquatic ecosystems.
Shoreline Protection
Protects shorelines by providing a barrier from wind and wave erosion
Reduces sedimentation of the water caused by shoreline slumping due to bank erosion
Allows detritus to collect and settle on the lake or creek bed providing the substrate structure required for native aquatic vegetation to establish and outcompete invasive species
Food Source
Wood complexes are an important food source for invertebrates
Small fish feed on the abundance of invertebrates that are found around these structures
Larger fish, waterfowl and shorebirds all benefit from the abundance of invertebrates and small fish feeding around woody structures in the littoral zone
Cover
Cover from predators is essential for many fish and animals to successfully complete their life cycle
The nooks and crannies of wood complexes offer critters safety from predators while at the same time concentrating prey to make predators more efficient
Wood provides the structure on which many species must lay or attach their eggs, therefore these complexes provide quality spawning and nesting habitat
Diversity
Wood complexes in the littoral zone provide unique edge habitat along the shoreline
Edge habitats contain more species diversity and higher concentrations of species than the adjoining habitats themselves will have
Figure 25 shows that the majority of Grants Creek had low to moderate levels of instream wood structure in the form of branches and trees along the system.
Figure 25 Instream wood structure along Grants Creek
3.2.5 Overhanging Wood Structure
Trees and branches that are less than one meter from the surface of the water are defined as overhanging. Overhanging branches and trees provide a food source, nutrients and shade which helps to moderate instream water temperatures. Figure 26 shows the system is highly variable with no overhanging branches and trees where the system is wide and is dominated by wetland habitat to an area in the upper reach that has high levels of overhanging wood structure along Grants Creek.
Figure 26 Overhanging wood structure along Grants Creek
3.2.6 Anthropogenic Alterations
Stream alterations are classified based on specific functional criteria associated with the flow conditions, the riparian buffer and potential human influences. Figure 27 shows 70 percent of Grants Creek remains “unaltered” with no anthropogenic alterations. Twenty two percent of Grants Creek was classified as natural with minor anthropogenic changes while seven percent was considered altered. The alterations along Grants Creek were in the form of shoreline modifications and road crossings.
Figure 27 Anthropogenic alterations along Grants Creek
3.3 Grants Creek Instream Aquatic Habitat
3.3.1 Benthic Invertebrates
Freshwater benthic invertebrates are animals without backbones that live on the stream bottom and include crustaceans such as crayfish, molluscs and immature forms of aquatic insects. Benthos represent an extremely diverse group of aquatic animals and exhibit wide ranges of responses to stressors such as organic pollutants, sediments and toxicants, which allows scientists to use them as bioindicators. As part of the Ontario Benthic Biomonitoring Network (OBBN), the RVCA has been collecting benthic invertebrates at the Glen Tay Road since 2003 and an additional site was added on Grants Creek in 2011 immediately downstream of the Pike Lake Dam. This site was added in 2011 as result of an identified gap in the network during the previous preparation of the 2011 Tay subwatershed report. Monitoring data is analyzed for each sample site and the results are presented using the Family Biotic Index, Family Richness and percent Ephemeroptera, Plecoptera and Trichoptera.
Hilsenhoff Family Biotic Index
The Hilsenhoff Family Biotic Index (FBI) is an indicator of organic and nutrient pollution and provides an estimate of water quality conditions for each site using established pollution tolerance values for benthic invertebrates. FBI results for the Grants Creek catchment at the Glen Tay Road and Pike Lake Dam sample locations are summarized in separate tables by year. “Fair” to “Poor” water quality conditions were observed at the Glen Tay Road (Figure 28) and the Pike Lake Dam sample (Figure 29) locations using a grading scheme developed by Conservation Authorities in Ontario for benthic invertebrates.
Figure 28 Hilsenhoff Family Biotic Index at the Glen Tay Road sample location
Figure 29 Hilsenhoff Family Biotic Index at the Pike Lake Dam sample location
Family Richness
Family Richness measures the health of the community through its diversity and increases with increasing habitat diversity suitability and healthy water quality conditions. Family Richness is equivalent to the total number of benthic invertebrate families found within a sample. The Glen Tay Road (Figure 30) and Pike Lake Dam (Figure 31) locations are reported to have “Fair” to “Good” family richness.
Figure 30 Family Richness on Grants Creek at the Glen Tay Road sample location
Figure 31 Family Richness on Grants Creek at the Pike Lake Dam sample location
EPT
Ephemeroptera (Mayflies), Plecoptera (Stoneflies), and Trichoptera (Caddisflies) are species considered to be very sensitive to poor water quality conditions. High abundance of these organisms is generally an indication of good water quality conditions at a sample location. The community structure is typically mixed with species that are moderately tolerant and tolerant to poorer water quality conditions. As a result, the EPT indicates that both of the Grants Creek samples at the Glen Tay Road (Figure 32) and Pike Lake Dam (Figure 33) locations are reported to have “Fair” to “Poor” water quality during the reporting periods.
Figure 32 EPT on Grants Creek at the Glen Tay Road sample location
Figure 33 EPT on Grants Creek at the Pike Lake Dam sample location
Conclusion
Overall the Grants Creek sample locations at Glen Tay Road and Pike Lake Dam aquatic habitat conditions from a benthic invertebrate perspective are considered “Fair to Poor” as the samples are highly variable with species that are moderately sensitive and tolerant to high organic pollution levels.
3.3.2 Habitat Complexity
Habitat complexity is a measure of the overall diversity of habitat types and features within a stream. Streams with high habitat complexity support a greater variety of species niches, and therefore contribute to greater diversity. Factors such as substrate, flow conditions (pools, riffles) and cover material (vegetation, wood structure, etc.) all provide crucial habitat to aquatic life. Habitat complexity is assessed based on the presence of boulder, cobble and gravel substrates, as well as the presence of instream woody material.
Low to high habitat complexity was identified for Grants Creek (Figure 34). Regions with increased habitat complexity were observed in the lower and upper reaches of the system within the catchment. The habitat complexity was considered low within the Provincially Significant wetland along Grants Creek as defined by the criteria above, However the wetland habitat provides critical values from the following perspective; flood storage, water quality treatment, increased biodiversity and important aquatic and terrestrial habitat.
Figure 34 Habitat complexity along Grants Creek
3.3.3 Instream Substrate
Diverse substrate is important for fish and benthic invertebrate habitat because some species have specific substrate requirements and for example will only reproduce on certain types of substrate. The absence of diverse substrate types may limit the overall diversity of species within a stream. Figure 35 shows the overall presence of various substrate types observed along Grants Creek. Substrate conditions were highly diverse along Grants Creek with all substrate types being recorded at various locations along the creek. Figure 36 shows the dominant substrate type observed for each section surveyed along Grants Creek.
Figure 35 Instream substrate along Grants Creek
Figure 36 shows the dominant substrate type along Grants Creek
3.3.4 Instream Morphology
Pools and riffles are important habitat features for aquatic life. Riffles are fast flowing areas characterized by agitation and overturn of the water surface. Riffles thereby play a crucial role in contributing to dissolved oxygen conditions and directly support spawning for some fish species. They are also areas that support high benthic invertebrate populations which are an important food source for many aquatic species. Pools are characterized by minimal flows, with relatively deep water and winter/summer refuge habitat for aquatic species. Runs are moderately shallow, with unagitated surfaces of water and areas where the thalweg (deepest part of the channel) is in the center of the channel. Figure 37 shows that Grants Creek is somewhat variable; 100 percent of sections recorded runs, 28 percent pools and 15 percent riffles. Figure 38 shows where the riffle habitat areas were observed along Grants Creek.
Figure 37 Instream morphology along Grants Creek
Figure 38 Instream riffle habitat along Grants Creek
3.3.5 Vegetation Type
Instream vegetation provides a variety of functions and is a critical component of the aquatic ecosystem. Aquatic plants promote stream health by:
Providing direct riparian/instream habitat
Stabilizing flows reducing shoreline erosion
Contributing to dissolved oxygen through photosynthesis
Maintaining temperature conditions through shading
For example emergent plants along the shoreline can provide shoreline protection from wave action and important rearing habitat for species of waterfowl. Submerged plants provide habitat for fish to find shelter from predator fish while they feed. Floating plants such as water lilies shade the water and can keep temperatures cool while reducing algae growth. Submerged plants were present in 98 percent of the survey sections, 89 percent floating plants, 69 percent free floating plants, 67 percent broad leaved emergents, algae and robust emergents were observed in 48 percent of sections and narrow leaved emergent were observed in 43 percent of sections surveyed. Figure 39 depicts the plant community structure for Grants Creek. Figure 40 shows the dominant vegetation type observed for each section surveyed along Grants Creek.
Figure 39 Vegetation type along Grants Creek
Figure 40 Dominant instream vegetation type along Grants Creek
3.3.6 Instream Vegetation Abundance
Instream vegetation is an important factor for a healthy stream ecosystem. Vegetation helps to remove contaminants from the water, contributes oxygen to the stream, and provides habitat for fish and wildlife. Too much vegetation can also be detrimental. Figure 41 demonstrates that Grants Creek reach had normal to common levels of vegetation recorded at 30 and 39 percent of stream surveys. Extensive levels of vegetation were observed along 65 percent of the surveyed sections while twenty percent of sections had no vegetation.
Figure 41 Instream vegetation abundance along Grants Creek
3.3.7 Invasive Species
Invasive species can have major implications on streams and species diversity. Invasive species are one of the largest threats to ecosystems throughout Ontario and can out compete native species, having negative effects on local wildlife, fish and plant populations. Ninety eight percent of the sections surveyed along Grants Creek reach had invasive species. The invasive species observed in Grants Creek reach were European frogbit, Eurasian milfoil, Himalayan balsam, purple loosestrife, bull thistle, poison parsnip, Manitoba maple and banded mystery snail. Invasive species abundance (i.e. the number of observed invasive species per section) was assessed to determine the potential range/vector of many of these species (Figure 42).
Figure 42 Invasive species abundance along Grants Creek
3.3.8 Water Chemistry
During the stream characterization survey, a YSI probe is used to collect water chemistry information. Dissolved oxygen (DO), specific conductivity (SPC) and pH are measured at the start and end of each section.
3.3.8.1 Dissolved Oxygen
Dissolved oxygen is a measure of the amount of oxygen dissolved in water. The Canadian Environmental Quality Guidelines of the Canadian Council of Ministers of the Environment (CCME) suggest that for the protection of aquatic life the lowest acceptable dissolved oxygen concentration should be 6 mg/L for warmwater biota and 9.5 mg/L for coldwater biota (CCME, 1999). Figure 43 shows that the dissolved oxygen in Grants Creek supports warmwater and in certain locations coldwater biota along the system. The average dissolved oxygen levels observed within Grants Creek was 6.2mg/L which is above the recommended level for warmwater biota.
Figure 43 Dissolved oxygen ranges along Grants Creek
3.3.8.2 Conductivity
Conductivity in streams is primarily influenced by the geology of the surrounding environment, but can vary drastically as a function of surface water runoff. Currently there are no CCME guideline standards for stream conductivity; however readings which are outside the normal range observed within the system are often an indication of unmitigated discharge and/or stormwater input. The average conductivity observed within the main stem of Grants Creek was 185.3 µs/cm. Figure 44 shows the conductivity readings for Grants Creek.
Figure 44 Specific conductivity ranges along Grants Creek
3.3.8.3 pH
Based on the PWQO for pH, a range of 6.5 to 8.5 should be maintained for the protection of aquatic life. Average pH values along Grants Creek averaged 7.32 thereby meeting the provincial standard (Figure 45).
Figure 45 pH ranges along Grants Creek
3.3.8.4 Oxygen Saturation (%)
Oxygen saturation is measured as the ratio of dissolved oxygen relative to the maximum amount of oxygen that will dissolve based on the temperature and atmospheric pressure. Well oxygenated water will stabilize at or above 100% saturation, however the presence of decaying matter/pollutants can drastically reduce these levels. Oxygen input through photosynthesis has the potential to increase saturation above 100% to a maximum of 500%, depending on the productivity level of the environment. In order to represent the relationship between concentration and saturation, the measured values have been summarized into 6 classes:
Figure 46 A bivariate assessment of dissolved oxygen concentration (mg/L) and saturation (%) in Grants Creek
Dissolved oxygen conditions on Grants Creek varied along the system for both warm and coolwater species (upper reach) (Figure 46). There are areas within the wetland in the lower reach that fall below the guideline to support warmwater biota, however this can be common in riverine wetland habitat.
3.3.8.5 Specific Conductivity Assessment
Specific conductivity (SPC) is a standardized measure of electrical conductance, collected at or corrected to a water temperature of 25⁰C. SPC is directly related to the concentration of ions in water, and is commonly influenced by the presence of dissolved salts, alkalis, chlorides, sulfides and carbonate compounds. The higher the concentration of these compounds, the higher the conductivity. Common sources of elevated conductivity include storm water, agricultural inputs and commercial/industrial effluents.
In order to summarize the conditions observed, SPC levels were evaluated as either normal, moderately elevated or highly elevated. These categories correspond directly to the degree of variation (i.e. standard deviation) at each site relative to the average across the system.
Normal levels were maintained along the majority of Grants Creek, however there were highly and moderately elevated areas in the upper reaches (Figure 47).
Figure 47 Relative specific conductivity levels along Grants Creek
3.3.9 Thermal Regime
Many factors can influence fluctuations in stream temperature, including springs, tributaries, precipitation runoff, discharge pipes and stream shading from riparian vegetation. Water temperature is used along with the maximum air temperature (using the Stoneman and Jones method) to classify a watercourse as either warm water, cool water or cold water. Figure 48 shows where the thermal sampling sites were located on Grants Creek. Analysis of the data collected indicates that Grants Creek is classified as a warm water system (Figure 49).
Figure 48 Temperature logger locations along Grants Creek
Figure 49 Temperature logger data for the sites on Grants Creek
Each point on the graph represents a temperature that meets the following criteria:
Sampling dates between July 1st and September 7th
Sampling date is preceded by two consecutive days above 24.5 °C, with no rain
Water temperatures are collected at 4pm
Air temperature is recorded as the max temperature for that day
3.3.10 Groundwater
Groundwater discharge areas can influence stream temperature, contribute nutrients, and provide important stream habitat for fish and other biota. During stream surveys, indicators of groundwater discharge are noted when observed. Indicators include: springs/seeps, watercress, iron staining, significant temperature change and rainbow mineral film. Figure 50 shows areas where one or more of the above groundwater indicators were observed during stream surveys and headwater assessments.
Figure 50 Groundwater indicators observed in the Grants Creek catchment
3.3.11 Fish Community
The Grants Creek catchment is classified as a mixed community of warm and cool water recreational and baitfish fishery with 28 species observed (Figure 51). Sampling effort on Grants Creek were influenced by the 2016 drought conditions experienced in the catchment, which is the most obvious reason for the lower diversity of fish species captured.
Figure 51 Fish community sampling observations for 2016 in the Grants Creek catchment
Table 7 contains a list of fish species observed in the watershed.
Table 7 Fish species observed in the Grants Creek catchment
Fish Species
Scientific Name
Fish code
Historical
2016
banded killifish
Fundulus diaphanus
BaKil
X
X
blacknose dace
Rhinichthys atratulus
BnDac
X
blacknose shiner
Notropis heterolepis
BnShi
X
bluegill
Lepomis macrochirus
Blueg
X
bluntnose minnow
Pimephales notatus
BnMin
X
X
brook stickleback
Culaea inconstans
BrSti
X
brown bullhead
Ameiurus nebulosus
BrBul
X
burbot
Lota lota
Burbo
X
carps and minnows
Cyprinidae
CA_MI
X
X
central mudminnow
Umbra limi
CeMud
X
central stoneroller
Campostoma anomalum
CeSto
X
common shiner
Luxilus cornutus
CoShi
X
X
creek chub
Semotilus atromaculatus
CrChu
X
X
etheostoma sp.
etheostoma sp.
EthSp
X
fallfish
Semotilus corporalis
Fallf
X
fathead minnow
Pimephales promelas
FhMin
X
golden shiner
Notemigonus crysoleucas
GoShi
X
X
hornyhead chub
Nocomis biguttatus
HhChu
X
X
iowa darter
Etheostoma exile
IoDar
X
largemouth bass
Micropterus salmoides
LmBas
X
logperch
Percina caprodes
Logpe
X
longnose dace
Rhinichthys cataractae
LnDac
X
X
northern pike
Esox lucius
NoPik
X
northern redbelly dace
Chrosomus eos
NRDac
X
pumpkinseed
Lepomis gibbosus
Pumpk
X
X
rock bass
Ambloplites rupestris
RoBas
X
X
smallmouth bass
Micropterus dolomieu
SmBas
X
spotfin shiner
Cyprinella spiloptera
SpShi
X
spottail shiner
Notropis hudsonius
StShi
X
stonecat
Noturus flavus
Stone
X
white sucker
Catostomus commersonii
WhSuc
X
yellow bullhead
Ameiurus natalis
YeBul
X
yellow perch
Perca flavescens
YePer
X
TOTAL Species
28
15
RVCA electrofishing site located on Grants Creek
3.3.12 Migratory Obstructions
It is important to know locations of migratory obstructions because these can prevent fish from accessing important spawning and rearing habitat. Migratory obstructions can be natural or man made, and they can be permanent or seasonal. Figure 52 shows that Grants Creek had three migration barriers they include Pike Lake Dam at the outlet of the lake as well as two weirs identified along Grants Creek at the time of the survey in 2016.
Figure 52 Migratory obstructions in the Grants Creek catchment
3.3.13 Beaver Dams
Overall beaver dams create natural changes in the environment. Some of the benefits include providing habitat for wildlife, flood control, and silt retention. Additional benefits come from bacterial decomposition of woody material used in the dams which removes excess nutrient and toxins. Beaver dams can also result in flooding of agricultural lands and may be potential barriers to fish migration. Several beavers dams were observed in 2016 (Figure 53).
Figure 53 Beaver dam observations along Grants Creek in 2016
3.3.14 Riparian Restoration
Figure 54 depicts the locations of riparian restoration opportunities as a result of observations made during the headwater drainage feature survey assessments.
Figure 54 Riparian restoration opportunities in the Grants Creek catchment
3.4 Headwater Drainage Feature Assessment
3.4.1 Headwaters Sampling Locations
The RVCA Stream Characterization program assessed Headwater Drainage Features for the Grants Creek catchment in 2017. This protocol measures zero, first and second order headwater drainage features (HDF). It is a rapid assessment method characterizing the amount of water, sediment transport, and storage capacity within headwater drainage features (HDF). RVCA is working with other Conservation Authorities and the Ministry of Natural Resources and Forestry to implement the protocol with the goal of providing standard datasets to support science development and monitoring of headwater drainage features. An HDF is a depression in the land that conveys surface flow. Additionally, this module provides a means of characterizing the connectivity, form and unique features associated with each HDF (OSAP Protocol, 2013). In 2017 the program sampled 10 sites at road crossings in the Grants Creek catchment area (Figure 55).
Figure 55 Location of the headwater sampling site in the Grants Creek catchment
3.4.2 Headwater Feature Type
The headwater sampling protocol assesses the feature type in order to understand the function of each feature. The evaluation includes the following classifications: defined natural channel, channelized or constrained, multi-thread, no defined feature, tiled, wetland, swale, roadside ditch and pond outlet. By assessing the values associated with the headwater drainage features in the catchment area we can understand the ecosystem services that they provide to the watershed in the form of hydrology, sediment transport, and aquatic and terrestrial functions. The headwater drainage features in the Grants Creek catchment are classified as four wetland features and six were classified as channelized. Figure 56 shows the feature type of the primary feature at the sampling locations.
Figure 56 Headwater feature types in the Grants Creek catchment
3.4.3 Headwater Feature Flow
The observed flow condition within headwater drainage features can be highly variable depending on timing relative to the spring freshet, recent rainfall, soil moisture, etc. Flow conditions are assessed in the spring and in the summer to determine if features are perennial and flow year round, if they are intermittent and dry up during the summer months or if they are ephemeral systems that do not flow regularly and generally respond to specific rainstorm events or snowmelt. Flow conditions in headwater systems can change from year to year depending on local precipitation patterns. Figure 57 shows the observed flow condition at the sampling locations in the Grants Creek catchment in 2017.
Figure 57 Headwater feature flow conditions in the Grants Creek catchment
A spring photo of the headwater sample site in the Grants Creek catchment located on Narrows Lock Road
A summer photo of the headwater sample site in the Grants Creek catchment located on Narrows Lock Road
3.4.4 Feature Channel Modifications
Channel modifications were assessed at each headwater drainage feature sampling location. Modifications include channelization, dredging, hardening and realignments. The Grants Creek catchment area had five with no channel modifications observed, four sites as having been historically dredged/channelized and one location had mixed modifications. Figure 58 shows the channel modifications observed at the sampling locations for Grants Creek.
Figure 58 Headwater feature channel modifications in the Grants Creek catchment
3.4.5 Headwater Feature Vegetation
Headwater feature vegetation evaluates the type of vegetation that is found within the drainage feature. The type of vegetated within the channel influences the aquatic and terrestrial ecosystem values that the feature provides. For some types of headwater features the vegetation within the feature plays a very important role in flow and sediment movement and provides wildlife habitat. The following classifications are evaluated no vegetation, lawn, wetland, meadow, scrubland and forest. Figure 59 depicts the dominant vegetation observed at the sampled headwater sites in the Grants Creek catchment.
Figure 59 Headwater feature vegetation types in the Grants Creek catchment
3.4.6 Headwater Feature Riparian Vegetation
Headwater riparian vegetation evaluates the type of vegetation that is found along the adjacent lands of a headwater drainage feature. The type of vegetation within the riparian corridor influences the aquatic and terrestrial ecosystem values that the feature provides to the watershed. Figure 60 depicts the type of riparian vegetation observed at the sampled headwater sites in the Grants Creek catchment.
Figure 60 Headwater feature riparian vegetation types in the Grants Creek catchment
3.4.7 Headwater Feature Sediment Deposition
Assessing the amount of recent sediment deposited in a channel provides an index of the degree to which the feature could be transporting sediment to downstream reaches (OSAP, 2013). Evidence of excessive sediment deposition might indicate the requirement to follow up with more detailed targeted assessments upstream of the site location to identify potential best management practices to be implemented. Sediment deposition ranged from none to substantial for the headwater sites sampled in the Grants Creek catchment area. Figure 61 depicts the degree of sediment deposition observed at the sampled headwater sites in the Grants Creek catchment.
Figure 61 Headwater feature sediment deposition in the Grants Creek catchment
3.4.8 Headwater Feature Upstream Roughness
Feature roughness will provide a measure of the amount of materials within the bankfull channel that could slow down the velocity of water flowing within the headwater feature (OSAP, 2013). Materials on the channel bottom that provide roughness include vegetation, woody Structure and boulders/cobble substrates. Roughness can provide benefits in mitigating downstream erosion on the headwater drainage feature and the receiving watercourse by reducing velocities. Roughness also provides important habitat conditions for aquatic organisms. Figure 62 shows the feature roughness conditions at the sampling locations in the Grants Creek catchment.
Figure 62 Headwater feature roughness in the Grants Creek catchment
Land cover and any change in coverage that has occurred over a six year period is summarized for the Grants Creek catchment using spatially continuous vector data representing the catchment during the spring of 2008 and 2014. This dataset was developed by the RVCA through heads-up digitization of 20cm DRAPE ortho-imagery at a 1:4000 scale and details the surrounding landscape using 10 land cover classes.
4.1 Grants Creek Catchment Land Cover/Change
As shown in Table 8 and Figure 1, the dominant land cover type in 2014 is crop and pastureland.
Table 8 Land cover in the Grants Creek catchment (2008 vs. 2014)
Land Cover
2008
2014
Change - 2008 to 2014
Area
Area
Area
Ha
Percent
Ha
Percent
Ha
Percent
Crop and Pasture
1385
44
1362
44
-23
Woodland*
870
28
861
28
-9
Wetland **
491
15
490
15
-1
>Evaluated
(328)
(10)
(328)
(10)
(0)
(0)
>Unevaluated
(163)
(5)
(162)
(5)
(-1)
(0)
Settlement
208
7
240
8
32
1
Meadow-Thicket
72
2
71
2
-1
Transportation
70
2
72
2
2
Water
17
1
17
1
* Does not include treed swamps ** Includes treed swamps
From 2008 to 2014, there was an overall change of 38 hectares (from one land cover class to another). Most of the change in the Grants Creek catchment is a result of the conversion of crop and pastureland along with woodland to settlement (Figure 63).
Figure 63 Land cover change in the Grants Creek catchment (2014)
Table 9 provides a detailed breakdown of all land cover change that has taken place in the Grants Creek catchment between 2008 and 2014.
Table 9 Land cover change in the Grants Creek catchment (2008 to 2014)
Land Cover
Change - 2008 to 2014
Area
Ha.
Percent
Crop and Pasture to Settlement
20
53.2
Woodland to Settlement
10.2
27.1
Crop and Pasture to Woodland
2.6
6.8
Meadow-Thicket to Settlement
1.3
3.6
Crop and Pasture to Transportation
1.3
3.5
Woodland to Crop and Pasture
0.9
2.4
Unevaluated Wetland to Settlement
0.8
2.1
Unevaluated Wetland to Transportation
0.3
0.9
Setlement to Transportation
0.1
0.4
Woodland to Transportation
<0.1
0.1
4.2 Woodland Cover
In the Environment Canada Guideline (Third Edition) entitled “How Much Habitat Is Enough?” (hereafter referred to as the “Guideline”) the opening narrative under the Forest Habitat Guidelines section states that prior to European settlement, forest was the predominant habitat in the Mixedwood Plains ecozone. The remnants of this once vast forest now exist in a fragmented state in many areas (including the Rideau Valley watershed) with woodland patches of various sizes distributed across the settled landscape along with higher levels of forest cover associated with features such as the Frontenac Axis (within the on-Shield areas of the Rideau Lakes and Tay River subwatersheds). The forest legacy, in terms of the many types of wildlife species found, overall species richness, ecological functions provided and ecosystem complexity is still evident in the patches and regional forest matrices (found in the Tay River subwatershed and elsewhere in the Rideau Valley watershed). These ecological features are in addition to other influences which forests have on water quality and stream hydrology including reducing soil erosion, producing oxygen, storing carbon along with many other ecological services that are essential not only for wildlife but for human well-being.
The Guideline also notes that forests provide a great many habitat niches that are in turn occupied by a great diversity of plant and animal species. They provide food, water and shelter for these species - whether they are breeding and resident locally or using forest cover to help them move across the landscape. This diversity of species includes many that are considered to be species at risk. Furthermore, from a wildlife perspective, there is increasing evidence that the total forest cover in a given area is a major predictor of the persistence and size of bird populations, and it is possible or perhaps likely that this pattern extends to other flora and fauna groups. The overall effect of a decrease in forest cover on birds in fragmented landscapes is that certain species disappear and many of the remaining ones become rare, or fail to reproduce, while species adapted to more open and successional habitats, as well as those that are more tolerant to human-induced disturbances in general, are able to persist and in some cases thrive. Species with specialized-habitat requirements are most likely to be adversely affected. The overall pattern of distribution of forest cover, the shape, area and juxtaposition of remaining forest patches and the quality of forest cover also play major roles in determining how valuable forests will be to wildlife and people alike.
The current science generally supports minimum forest habitat requirements between 30 and 50 percent, with some limited evidence that the upper limit may be even higher, depending on the organism/species phenomenon under investigation or land-use/resource management planning regime being considered/used.
As shown in Figure 64, 28 percent of the Grants Creek catchment contains 861 hectares of upland forest and six hectares of lowland forest (treed swamps) versus the 47 percent of woodland cover in the Tay River subwatershed. This is less than the 30 percent of forest cover that is identified as the minimum threshold required to sustain forest birds according to the Guideline and which may only support less than one half of potential species richness and marginally healthy aquatic systems. When forest cover drops below 30 percent, forest birds tend to disappear as breeders across the landscape.
Figure 64 Woodland cover and forest interior in the Grants Creek catchment (2014)
4.2.1 Woodland (Patch) Size
According to the Ministry of Natural Resources’ Natural Heritage Reference Manual (Second Edition), larger woodlands are more likely to contain a greater diversity of plant and animal species and communities than smaller woodlands and have a greater relative importance for mobile animal species such as forest birds.
Bigger forests often provide a different type of habitat. Many forest birds breed far more successfully in larger forests than they do in smaller woodlots and some rely heavily on forest interior conditions. Populations are often healthier in regions with more forest cover and where forest fragments are grouped closely together or connected by corridors of natural habitat. Small forests support small numbers of wildlife. Some species are “area-sensitive” and tend not to inhabit small woodlands, regardless of forest interior conditions. Fragmented habitat also isolates local populations, especially small mammals, amphibians and reptiles with limited mobility. This reduces the healthy mixing of genetic traits that helps populations survive over the long run (Conserving the Forest Interior. Ontario Extension Notes, 2000).
The Environment Canada Guideline also notes that for forest plants that do not disperse broadly or quickly, preservation of some relatively undisturbed large forest patches is needed to sustain them because of their restricted dispersal abilities and specialized habitat requirements and to ensure continued seed or propagation sources for restored or regenerating areas nearby.
The Natural Heritage Reference Manual continues by stating that a larger size also allows woodlands to support more resilient nutrient cycles and food webs and to be big enough to permit different and important successional stages to co-exist. Small, isolated woodlands are more susceptible to the effects of blowdown, drought, disease, insect infestations, and invasions by predators and non-indigenous plants. It is also known that the viability of woodland wildlife depends not only on the characteristics of the woodland in which they reside, but also on the characteristics of the surrounding landscape where the woodland is situated. Additionally, the percentage of forest cover in the surrounding landscape, the presence of ecological barriers such as roads, the ability of various species to cross the matrix surrounding the woodland and the proximity of adjacent habitats interact with woodland size in influencing the species assemblage within a woodland.
In the Grants Creek catchment (in 2014), one hundred and one (64 percent) of the 159 woodland patches are very small, being less than one hectare in size. Another 48 (30 percent) of the woodland patches ranging from one to less than 20 hectares in size tend to be dominated by edge-tolerant bird species. The remaining ten (six percent of) woodland patches range between 30 and 192 hectares in size. Nine of these patches contain woodland between 20 and 100 hectares and may support a few area-sensitive species and some edge intolerant species, but will be dominated by edge tolerant species.
Conversely, one (one percent) of the 159 woodland patches in the drainage area exceed the 100 plus hectare size needed to support most forest dependent, area sensitive birds and are large enough to support approximately 60 percent of edge-intolerant species. No patch tops 200 hectares, which according to the Environment Canada Guideline will support 80 percent of edge-intolerant forest bird species (including most area sensitive species) that prefer interior forest habitat conditions.
Table 10 presents a comparison of woodland patch size in 2008 and 2014 along with any changes that have occurred over that time. A decrease (of 17 ha) has been observed in the overall woodland patch area between the two reporting periods with most change occurring in the 20 to 50 woodland patch size class range. Six new woodland patches have been created as a result of the forest loss/gain portrayed in Figure 64, some of which has resulted in an increase in forest fragmentation across the catchment.
Table 10 Woodland patches in the Grants Creek catchment (2008 and 2014)
Woodland Patch Size Range (ha)
Woodland* Patches
Patch Change
2008
2014
2008 to 2014
Number
Area
Number
Area
Number
Area
Count
%
Ha
%
Count
%
Ha
%
Count
Ha
Less than 1
97
63
36
4
101
64
36
4
4
1 to 20
45
30
204
23
48
30
226
26
3
22
20 to 50
8
5
274
32
7
4
242
28
-1
-32
50 to 100
2
1
169
19
2
1
171
20
2
100 to 200
1
1
193
22
1
1
192
22
-1
Totals
153
100
876
100
159
100
867
100
6
-9
*Includes treed swamps
4.2.2 Woodland (Forest) Interior Habitat
The forest interior is habitat deep within woodlands. It is a sheltered, secluded environment away from the influence of forest edges and open habitats. Some people call it the “core” or the “heart” of a woodland. The presence of forest interior is a good sign of woodland health, and is directly related to the woodland’s size and shape. Large woodlands with round or square outlines have the greatest amount of forest interior. Small, narrow woodlands may have no forest interior conditions at all. Forest interior habitat is a remnant natural environment, reminiscent of the extensive, continuous forests of the past. This increasingly rare forest habitat is now a refuge for certain forest-dependent wildlife; they simply must have it to survive and thrive in a fragmented forest landscape (Conserving the Forest Interior. Ontario Extension Notes, 2000).
The Natural Heritage Reference Manual states that woodland interior habitat is usually defined as habitat more than 100 metres from the edge of the woodland and provides for relative seclusion from outside influences along with a moister, more sheltered and productive forest habitat for certain area sensitive species. Woodlands with interior habitat have centres that are more clearly buffered against the edge effects of agricultural activities or more harmful urban activities than those without.
In the Grants Creek catchment (in 2014), the 159 woodland patches contain 15 forest interior patches (Figure 64) that occupy two percent (56 ha.) of the catchment land area (which is less than the five percent of interior forest in the Tay River subwatershed). This is below the ten percent figure referred to in the Environment Canada Guideline that is considered to be the minimum threshold for supporting edge intolerant bird species and other forest dwelling species in the landscape.
Most patches (14) have less than 10 hectares of interior forest, nine of which have small areas of interior forest habitat less than one hectare in size. The remaining patch contains 30 hectares of interior forest. Between 2008 and 2014, there has been a small change in the number of woodland patches containing interior habitat with an overall loss of four hectares in the catchment (Table 11).
Table 11 Woodland interior in the Grants Creek catchment (2008 and 2014)
Woodland Interior Habitat Size Range (ha)
Woodland Interior
Interior Change
2008
2014
2008 to 2014
Number
Area
Number
Area
Number
Area
Count
Percent
Ha
Percent
Count
Percent
Ha
Percent
Count
Ha
Less than 1
8
53
4
7
9
60
4
7
1
1 to 10
6
40
26
44
5
33
23
40
-1
-3
10 to 30
1
7
30
49
1
7
29
53
-1
Totals
15
100
60
100
15
100
56
100
-4
4.3 Wetland Cover
Wetlands are habitats forming the interface between aquatic and terrestrial systems. They are among the most productive and biologically diverse habitats on the planet. By the 1980s, according to the Natural Heritage Reference Manual, 68 percent of the original wetlands south of the Precambrian Shield in Ontario had been lost through encroachment, land clearance, drainage and filling.
Wetlands perform a number of important ecological and hydrological functions and provide an array of social and economic benefits that society values. Maintaining wetland cover in a watershed provides many ecological, economic, hydrological and social benefits that are listed in the Reference Manual and which may include:
contributing to the stabilization of shorelines and to the reduction of erosion damage through the mitigation of water flow and soil binding by plant roots
mitigating surface water flow by storing water during periods of peak flow (such as spring snowmelt and heavy rainfall events) and releasing water during periods of low flow (this mitigation of water flow also contributes to a reduction of flood damage)
contributing to an improved water quality through the trapping of sediments, the removal and/or retention of excess nutrients, the immobilization and/or degradation of contaminants and the removal of bacteria
providing renewable harvesting of timber, fuel wood, fish, wildlife and wild rice
contributing to a stable, long-term water supply in areas of groundwater recharge and discharge
providing a high diversity of habitats that support a wide variety of plants and animals
acting as “carbon sinks” making a significant contribution to carbon storage
providing opportunities for recreation, education, research and tourism
Historically, the overall wetland coverage within the Great Lakes basin exceeded 10 percent, but there was significant variability among watersheds and jurisdictions, as stated in the Environment Canada Guideline. In the Rideau Valley Watershed, it has been estimated that pre-settlement wetland cover averaged 35 percent using information provided by Ducks Unlimited Canada (2010) versus the 21 percent of wetland cover existing in 2014 derived from DRAPE imagery analysis.
Figure 65 Wetland cover in the Grants Creek catchment (2014)
This decline in wetland cover is also evident in the Grants Creek catchment (as seen in Figure 65 and summarized in Table 12), where wetland was reported to cover 34 percent of the area prior to settlement, as compared to 16 percent in 2014. This represents a 54 percent loss of historic wetland cover. To maintain critical hydrological, ecological functions along with related recreational and economic benefits provided by these wetland habitats in the catchment, a “no net loss” of currently existing wetlands should be employed to ensure the continued provision of tangible benefits accruing from them to landowners and surrounding communities.
Table 12 Wetland cover in the Grants Creek catchment (Historic to 2014)
Wetland Cover
Pre-settlement
2008
2014
Change - Historic to 2014
Area
Area
Area
Area
Ha
Percent
Ha
Percent
Ha
Percent
Ha
Percent
Grants Creek
1063
34
491
16
490
16
-573
-54
Tay River
n/a
n/a
15280
19
15330
19
n/a
n/a
Rideau Valley
134115
35
n/a
n/a
82076
21
-52039
-39
4.4 Shoreline Cover
The riparian or shoreline zone is that special area where the land meets the water. Well-vegetated shorelines are critically important in protecting water quality and creating healthy aquatic habitats, lakes and rivers. Natural shorelines intercept sediments and contaminants that could impact water quality conditions and harm fish habitat in streams. Well established buffers protect the banks against erosion, improve habitat for fish by shading and cooling the water and provide protection for birds and other wildlife that feed and rear young near water. A recommended target (from the Environment Canada Guideline) is to maintain a minimum 30 metre wide vegetated buffer along at least 75 percent of the length of both sides of rivers, creeks and streams.
Figure 66 shows the extent of the ‘Natural’ vegetated riparian zone (predominantly wetland/woodland features) and ‘Other’ anthropogenic cover (crop/pastureland, roads/railways, settlements) along a 30-metre-wide area of land, both sides of the shoreline of Grants Creek and its tributaries in the Grants Creek catchment.
Figure 66 Natural and other riparian land cover in the Grants Creek catchment (2014)
This analysis shows that the riparian zone in the Grants Creek catchment is composed of wetland (34 percent), crop and pastureland (32 percent), woodland (25 percent), settlement (five percent), roads (two percent) and meadow-thicket (one percent). Along the many watercourses (including headwater streams) flowing into Grants Creek, the riparian buffer is composed of crop and pastureland (40 percent), wetland (27 percent), woodland (26 percent), settlement areas (four percent), roads (two percent) and meadow-thicket (one percent). Along Grants Creek itself, the riparian zone is composed of wetland (56 percent), woodland (27 percent), crop and pastureland (eight percent), settlement (six percent), transportation (two percent) and meadow-thicket (one percent). Additional statistics for the Grants Creek catchment are presented in Tables 13, 14 and 15 and show that there has been very little to no change in shoreline cover from 2008 to 2014.
Table 13 Riparian land cover in the Grants Creek catchment (2008 vs. 2014)
Riparian Land Cover
2008
2014
Change - 2008 to 2014
Area
Area
Area
Ha.
Percent
Ha.
Percent
Ha.
Percent
Wetland
125.09
34.11
124.97
34.07
-0.12
-0.04
> Unevaluated
(70.13)
(19.12)
(70.13)
(19.12)
(0.00)
(0.00)
> Evaluated
(54.96)
(14.99)
(54.84)
(14.95)
(-0.12)
(-0.04)
Crop & Pasture
119.30
32.53
118.47
32.31
-0.83
-0.22
Woodland
93.04
25.37
92.83
25.32
-0.21
-0.05
Settlement
17.44
4.76
18.38
5.01
0.94
0.25
Transportation
7.45
2.03
7.67
2.09
0.22
0.06
Meadow-Thicket
4.38
1.20
4.38
1.20
0.00
0.00
Table 14 Riparian land cover along Grants Creek (2008 vs. 2014)
Riparian Land Cover
2008
2014
Change - 2008 to 2014
Area
Area
Area
Ha.
Percent
Ha.
Percent
Ha.
Percent
Wetland
62.93
55.83
62.93
55.83
0.00
0.00
> Unevaluated
(21.94)
(19.47)
(21.94)
(19.47)
(0.00)
(0.00)
> Evaluated
(40.99)
(36.36)
(40.99)
(36.36)
(0.00)
(0.00)
Woodland
30.95
27.45
30.95
27.45
0.00
0.00
Crop & Pasture
9.48
8.41
9.40
8.34
-0.08
-0.07
Settlement
7.04
6.25
7.12
6.32
0.08
0.07
Transportation
1.62
1.44
1.62
1.44
0.00
0.00
Meadow-Thicket
0.70
0.62
0.70
0.62
0.00
0.00
Table 15 Riparian land cover along streams in the Grants Creek catchment (2008 vs. 2014)
5.0 Grants Creek Catchment: Stewardship and Water Resources Protection
The RVCA and its partners are working to protect and enhance environmental conditions in the Tay River Watershed. Figure 67 shows the location of all stewardship projects completed in the Grants Creek catchment.
Figure 67 Stewardship site locations in the Grants Creek catchment
5.1 Rural Clean Water
The Rural Clean Water Program provides technical and financial assistance to farmers and other rural landowners, to aid in the implementation of projects that protect water quality. Funding is granted to those projects that support best management practices for application in the protection and improvement of surface and ground water resources. The program also supports climate change adaptation and low impact development projects as well as educating rural landowners about environmental stewardship of private property. Examples of supported projects include livestock exclusion fencing, controlled tile drainage, cover crops, erosion control, well related projects, and many more. For a list of eligible projects and to apply for funding, see Rural Clean Water.
In the Grants Creek catchment from 2011 to 2016, two livestock fencing projects were completed; prior to this, five septic system repairs, five livestock fencing projects and one well upgrade had been completed. When combined, these projects are keeping 17.34 kilograms of Phosphorus out of our lakes, rivers and streams every year. Total value of all 13 projects is $55,005 with $29,509 of that amount funded through grant dollars from the RVCA.
5.2 Private Land Forestry
Forest cover and tree planting continues to be one of the most widely supported strategies to improve our environment. The many benefits of forest cover include carbon sequestration, flood mitigation and water quality improvement as well as providing wildlife habitat.
Through the RVCA's Trees for Tomorrow Program (and its predecessors), 39,050 trees were planted at five sites prior to 2011, resulting in the reforestation of 19 hectares. Total value of all projects in the Grants Creek catchment is $82,174 with $40,355 of that amount coming from fundraising sources. For more information about the Program and landowner eligibility, please see the following: Tree Planting in the Rideau Valley Watershed and Trees for Tomorrow.
An additional 25 butternut trees were planted through the RVCA Butternut Recovery Program as part of efforts to introduce healthy seedlings from tolerant butternuts into various locations across Eastern Ontario.
5.3 Shoreline Naturalization
Natural shoreline buffers rich in native plants are critically important to protecting the health of our lakes, rivers and streams. Shoreline vegetation protects water quality and aquatic habitat by intercepting potentially harmful contaminants such as nutrients, pollutants and sediment, regulating water temperatures, slowing runoff and providing important fish and wildlife habitat. Natural shorelines also help improve climate change resiliency by increasing flood storage and providing protection from erosion during extreme weather events.
As of the end of 2016, no shoreline projects had been carried out in the Grants Creek catchment. Landowners may wish to take advantage of the RVCA's Shoreline Naturalization Program to assist them with the naturalization of their shorelines to see the benefits noted above (and more).
5.4 Septic System Re-inspection
Septic system re-inspection is provided by the RVCA through the Mississippi Rideau Septic System Office at the request of Tay Valley Township. From 2004 to 2017, the service has performed 41 voluntary septic system re-inspections on 41 properties along Grants Creek in the Grants Creek catchment .
Remedial/maintenance work (i.e. pump outs and baffle replacements that generally do not require a permit) was advocated for 14 of the septic systems inspected along with one septic system replacement at another property.
5.5 Valley, Stream, Wetland and Hazard Lands
The Grants Creek catchment covers 31.1 square kilometres with 5.6 square kilometres (or 18 percent) of the drainage area being within the regulation limit of Ontario Regulation 174/06 (Figure 68), giving protection to wetland areas and river or stream valleys that are affected by flooding and erosion hazards.
Wetlands occupy 4.9 square kilometres (or 15.7 percent) of the catchment. Of these wetlands, 3.3 square kilometres (or 67.3 percent) are designated as provincially significant and included within the RVCA regulation limit. This leaves the remaining 1.6 square kilometres (or 32.7 percent) of wetlands in the catchment outside the regulated area limit.
Of the 63.2 kilometres of stream in the catchment, regulation limit mapping has been plotted along 12.5 kilometers of streams (representing 19.8 percent of all streams in the catchment). Some of these regulated streams (10.7 km) flow through regulated wetlands; the remaining five kilometres of regulated streams are located outside of those wetlands. Plotting of the regulation limit on the remaining 50.7 kilometres (or 80.2 percent) of streams requires identification of flood and erosion hazards and valley systems.
Within those areas of the Grants Creek catchment subject to the regulation (limit), efforts (have been made and) continue through RVCA planning and regulations input and review to manage the impact of development (and other land management practices) in areas where “natural hazards” are associated with rivers, streams, valley lands and wetlands. For areas beyond the regulation limit, protection of the catchment’s watercourses is only provided through the “alteration to waterways” provision of the regulation.
Figure 68 Regulated natural features and hazards in the Grants Creek catchment
5.6 Vulnerable Drinking Water Areas
The Town of Perth’s municipal drinking water Intake Protection Zone (IPZ), specifically IPZ-2 with a vulnerability score of 8 and 9 is found within the Grants Creek catchment (Figure 68). As per the Mississippi-Rideau Source Protection Plan, policies may affect future development within these areas. Under Section 59 of the Clean Water Act, 2006, future applications under the Building Code and the Planning Act may be screened by the Mississippi-Rideau Risk Management Office. Depending on the proposed activity, additional requirements or restrictions may apply. For more information, please contact the Mississippi-Rideau Risk Management Office at (613) 692-3571.
In addition, the Mississippi-Rideau Source Protection Plan has mapped the central part of the Grants Creek catchment as within a Significant Groundwater Recharge Area and identified all of the catchment as a Highly Vulnerable Aquifer. This means that the nature of the overburden (thin soils, fractured bedrock) does not provide a high level of protection for the underlying groundwater making the aquifer more vulnerable to contaminants released on the surface. Highly Vulnerable Aquifers characterise 89% of the Region and are considered moderate to low drinking water threats with certain policies that apply; mainly policies regarding waste disposal. All property owners are encouraged to use best management practices to protect sources of municipal drinking water. For more information on source protection best management practices, please visit Protecting Your Drinking Water.
6.0 Grants Creek Catchment: Accomplishments/Activities
Achievements noted by the Friends of the Tay Watershed Association (FoTW) are indicated by an asterisk.
Development
Local residents and the Friends of the Tay Watershed Association took an active role over a four-year period in monitoring municipal controls (lot size, setbacks etc.) for a 50 lot residential development on a sensitive sector of Grants Creek and the Tay River (SWP zone) in Glen Tay hamlet. As the first of anticipated future developments along these watercourses, the site conditions for development of the property were appropriate and set important precedents. The tests applied to the development along with information contained in the Glen Tay and Grants Creek catchment reports available from the RVCA provided a sound basis for the decisions.*
In-stream/Fish Habitat
5.4 kilometres of Grants Creek have been surveyed and ten headwaters are sampled once every six years by the RVCA using the Ontario Stream Assessment Protocol.
The report "Fish Habitat of the Tay River Watershed: Existing Conditions and Opportunities for Enhancement" was prepared in 2002 by MNR, RVCA, Parks Canada and DFO. A number of specific fish habitat enhancement projects are identified in the report to improve the fishery along Grants Creek (see pp.111-116).
Septic Inspections
41 voluntary septic system re-inspections have been conducted by the Mississippi Rideau Septic System Office on 41 properties in the Grants Creek catchment, as a service provided to Tay Valley Township since 2004.
Tree Planting
39,050 trees have been planted at five sites in the Grants Creek catchment by the RVCA Private Land Forestry Program, resulting in the reforestation of 19 hectares.
Water Quality
Five stream monitoring sites on Grants Creek are sampled yearly by the RVCA for 22 parameters at each location, six times a year, to assess surface chemistry water quality conditions.
Two Ontario Benthic Biomonitoring Network sites on Grants Creek are each sampled by the RVCA in the spring and fall of each year with three replicates, to assess instream biological water quality conditions.
Thirteen Rural Clean Water Program projects were completed by the RVCA Rural Clean Water Program.
The 2011 Grants Creek Catchment Report, including the detailed water quality monitoring information it contains, has been a major help in understanding this drainage area and its demands, as this catchment receives more comments of concern than any other watercourse in the Tay watershed. Specific examples of the value of RVCA surface water quality testing and reporting in the catchment report include its use when reviewing the impact of the auto-wrecking operation on the water quality of Grants Creek (located on the Upper Scotch Line Road at the Bowes Side Road) along with the effect of livestock access to Grants Creek at a number of sites.*
Waterway Planning and Management
The Tay Watershed Management Plan (2002) brought together a diverse group of watershed stakeholders to exchange information and opinions on the challenges facing the watershed. This forum focused the community on the need for managing the Tay Watershed, requiring positive cooperation amongst a range of stakeholders and helped develop a foundation of data and information on the watershed and resources against which later developments and trends are being measured and decisions are being made.
The Plan also led to the formation of the Friends of the Tay Watershed Association, who have been instrumental in implementing 20 of 24 management plan recommendations. In the opinion of the Association, one of the most significant measures of success for the water protection activities carried out in the Tay watershed is that there has never been a serious environmental pollution incident that threatened the area’s drinking water or its recreational waterbodies. To this day, the Friends of the Tay Watershed remain committed to preserving and enhancing the health of the Tay River watershed through their work.*
Achievements noted by the Friends of the Tay Watershed Association (FoTW) are indicated by an asterisk.
Headwaters/In-stream Habitat/Shorelines
Grants Creek catchment watercourses ( including Grants Creek) have 60 percent of the total length of their shoreline composed of natural vegetation. This is below the recommended 30 metre wide, naturally vegetated shoreline buffer target to be aimed for along 75 percent of the length of the catchment’s watercourses (see Section 4.4 of this report).
Grants Creek catchment headwater and tributary streams ( excluding Grants Creek) have 54 percent of the total length of their shoreline composed of natural vegetation. This is below the recommended 30 metre wide, naturally vegetated shoreline buffer target to be aimed for along 75 percent of the length of the catchment’s watercourses (see Section 4.4 of this report).
Six of ten sampled headwater sites have been modified (i.e., channelized)(see Section 3.4.2 of this report).
Fish habitat is fragmented and fish migration is hampered because of existing water control structures along Grants Creek. This has resulted in complaints being received by the Friends of the Tay Watershed over the years that low flow on Grants Creek is impacting in-water fish and wildlife, said to be caused by inadequate release(s) from the Pike Lake Dam during low water conditions.*
Fencing across Grants Creek has been reported as an impediment to the safe navigation of the watercourse in a canoe.*
Land Cover
Land cover has changed across the catchment (2008 to 2014) largely as a result of an increase in the area of settlement (32 ha.) and loss of crop and pastureland (23 ha.) and woodland (9 ha.)(see Section 4.1 of this report).
Wetlands have declined by fifty-four percent since European pre-settlement and now cover 16 percent (490 ha.) of the catchment (in 2014). Thirty-three percent (162 ha.) of these wetlands remain unevaluated/unregulated and although they are not under imminent threat from development activity, they do remain vulnerable to drainage and land clearing activities in the absence of any regulatory and planning controls that would otherwise protect them for the many important hydrological, social, biological and ecological functions/services/values they provide to landowners and the surrounding community (see Section 4.3 of this report).
Woodlands cover 28 percent of the catchment, which is less than the 30 percent of forest cover that is identified as the minimum threshold for sustaining forest birds and other woodland dependent species (see Section 4.2 of this report).
Water Levels
Complaints have been received over the years that low flow on Grants Creek is impacting in-water wildlife, said to be caused by inadequate release of water from the Pike Lake Dam during low water times. The Friends of the Tay Watershed has questioned dam management with MNR, and also MOE regarding the monitoring of the water taking permit at Maple View Golf Course. The issue appears to be simply, inadequate summer flow through the system, but dam flow monitoring needs more attention.*
Stream flows (high, low and base) and water levels are unrecorded along Grants Creek.
Water Quality
Surface chemistry water quality ratings along Grants Creek range from Poor to Very Good. Only one of the five sampling sites at the Glen Tay Road crossing has a water quality rating from Poor to Fair (the other four sites range between Fair and Very Good). The score at this site is largely influenced by high nutrient (TP/TKN) concentrations, occasional bacterial (E.coli) and metal (Aluminium) exceedances (see Section 2.1 of this report).
Instream biological water quality conditions in Grants Creek range from Poor at the Pike Lake Dam to Fair at the Glen Tay Road crossing. Samples are highly variable with benthic invertebrate species that are sensitive and moderately tolerant to high organic pollution levels (see Section 3.3.1 of this report).
Fourteen (of 41) Tay Valley Township voluntary septic system re-inspections conducted from 2004 to 2017 in the Grants Creek catchment revealed the need for additional maintenance/remedial work to be performed. Another inspection identified the need to replace the existing septic system. Those properties with concerns are identified in the yearly report submitted by the Mississippi Rideau Septic System Office to the Township.
The impact of the auto-wrecking operation beside Grants Creek along with livestock access to Grants Creek in the vicinity of the Upper Scotch Line (at the Bowes Side Road) have been a concern for decades and the source of public complaints.*
Actions noted by the Friends of the Tay Watershed Association (FoTW) are indicated by an asterisk.
Aquatic Habitat/Fisheries
Educate waterfront property owners about fish habitat requirements, spawning timing and near-shore and in-water activities that can disturb or destroy fish habitat and spawning sites.
Work with various partners, including landowners, the Friends of the Tay Watershed Association and Tay Valley Township on fish habitat enhancement projects in the Tay River watershed, building off of new knowledge and the recommendations as described in the report "Fish Habitat of the Tay River Watershed: Existing Conditions and Opportunities for Enhancement" (2002) prepared by MNR, RVCA, Parks Canada, and DFO.
Investigate public complaints about the low summer flow on Grants Creek to seek a better understanding of its impact on in-water fish and wildlife, said to be caused by inadequate release(s) from the Pike Lake Dam during low water conditions.*
Development
Work with approval authorities (Lanark County, Leeds Grenville and Lanark District Health Unit, Mississippi Rideau Septic System Office, RVCA and Tay Valley Township) and landowners to consistently implement current land use planning and development policies for water quality and shoreline protection adjacent to Grants Creek and headwater streams in the catchment (i.e., a minimum 30 metre development setback from water).
Explore ways and means to more effectively implement and enforce conditions of land-use planning and development approval to achieve net environmental gains (particularly with respect to rehabilitating or protecting naturally vegetated shorelines and water quality).
Encourage Committees of Adjustment to take advantage of technical and environmental information and recommendations forthcoming from planning and environmental professionals.
Ongoing education and dialogue regarding the regulatory floodplain, its implementation and the effect it has on development continues to represent an opportunity to assist the public in understanding the importance of planning, which respects this natural hazard.
Municipalities in the Tay Watershed are encouraged to strengthen natural heritage and water resources official plan policies and zoning provisions (pertaining to water setbacks, frontage and naturalized shorelines and wetland protection) where deemed appropriate.
Work with Lanark County, Tay Valley Township and agencies to ensure that development approvals around lakes and along watercourses take into consideration the protection of fish habitat (including the near-shore nursery and spawning habitat).
Utilise RVCA subwatershed and catchment reports to help develop, revise and implement official plan policies to protect surface water resources and the natural environment (including woodlands, wetlands and shoreline cover).
Land Cover
Consider reforestation of the Grants Creek catchment to raise the current level of forest cover (at 28 percent) above the recommended 30 percent minimum threshold that is needed to sustain woodland dependent species and woodland biodiversity on the landscape. Reaching this target will also help to improve the capacity of the forests in the catchment to reduce flooding and water-borne soil erosion, store more carbon and dampen the effects of the changing climate. Take advantage of the RVCA Trees for Tomorrow Program to achieve this on idle and/or marginal land.
Establish RVCA regulation limits around the 34 percent (162 ha.) of wetlands in the catchment that are unevaluated. Doing this will help protect landowners from natural hazards including mitigating surface water flow by storing water during periods of peak flow (such as spring snowmelt and heavy rainfall events) and releasing water during periods of low flow (this mitigation of water flow reduces flood damage), as well as contributing to the stabilisation of shorelines and to the reduction of soil erosion damage through water flow mitigation and plant soil binding/retention.
Shorelines
Take advantage of the RVCA Shoreline Naturalization Program to re-naturalize altered creek and stream shoreline identified in this report as “Unnatural Riparian Land Cover". Target shoreline restoration at sites shown in orange on the Riparian Land Cover map (see Figure 66 in Section 4.4 of this report) and on the Riparian Restoration Opportunities map (see Figure 54 in Section 3.3.14 of this report).Concentrate stewardship efforts along the headwater and tributary streams of Grants Creek in the catchment, which have 54 percent of the total length of their shoreline composed of natural vegetation (this is below the recommended 30 metre wide, naturally vegetated shoreline buffer target to be aimed for along 75 percent of the length of the catchment’s watercourses). Other stewardship opportunities in the catchment may be determined based on septic system inspections and surface water quality monitoring results.
Promote the use of bioengineering methods (using native shrub/tree planting, fascines, live stakes) as a shoreline erosion mitigation measure as well as a cost effective alternative to shoreline hardening (with rip rap, armour stone, gabion baskets, walls).
Educate landowners about the value and importance of natural shorelines and property best management practices with respect to shoreline use and development, septic system installation and maintenance and shoreline vegetation retention and enhancement (Leeds Grenville and Lanark District Health Unit, Mississippi Rideau Septic System Office, RVCA and Tay Valley Township).
Water Levels
Install stream flow and water level instrumentation along Grants Creek.
Water Quality
Consider further investigation of the Poor to Fairsurface chemistry water quality rating and Poor to Fairinstream biological water quality rating on Grants Creek as part of a review of RVCA's Baseline and Benthic Invertebrate surface water quality monitoring. As part of the investigation of the Poor to Fair results, consider a more extensive review of surface water quality along the reach of Grants Creek in the vicinity of the Upper Scotch Line (at the Bowes Side Road), adjacent to the auto-wrecking salvage yard.
Offer funding provided by the RVCA Rural Clean Water Program to landowners with potential projects that could improve water quality on Grants Creek and its tributaries (e.g., livestock fencing, septic system repair/replacement and streambank erosion control/stabilisation). Concentrate efforts at septic systems requiring remedial work or replacement, including the 15 identified as needing additional maintenance/remedial/replacement work since 2004. Target funding towards those properties where livestock access to Grants Creek continues and remains an ongoing concern to the public and agencies.*
Educate waterfront property owners about septic system care by providing information about sewage system maintenance (i.e., when to pump out septic systems and holding talks) through initiatives such as the Septic Savvy Workshop and services provided by the Mississippi Rideau Septic System Office.
Reduce pollutant loading to Grants Creek through education about the application of shoreline, stormwater and agricultural best management practices; also consider using low impact development (LID) methods to improve the quality and reduce the amount of stormwater runoff directly reaching the river ecosystem. This will be particularly beneficial in areas with extensive impervious surfaces (i.e., asphalt, concrete, buildings, and severely compacted soils) or on sensitive shoreline properties (with steep slopes/banks, shallow/impermeable soils).
The RVCA produces individual reports for 14 catchments in the Tay River subwatershed. Using data collected and analyzed by the RVCA through its watershed monitoring and land cover classification programs, surface water quality and in-stream conditions are reported for the Tay River, Tay Watershed lakes and Tay tributaries along with a summary of environmental conditions for the surrounding countryside every six years, which includes analysis of data collected through the programs along with local information provided by stakeholders up to 2017.
This information is used to better understand the effects of human activity on our water resources, allows us to better track environmental change over time and helps focus watershed management actions where they are needed the most to help sustain the ecosystem services (cultural, aesthetic and recreational values; provisioning of food, fuel and clean water; regulation of erosion/natural hazard protection and water purification; supporting nutrient/water cycling and habitat provision) provided by the catchment’s lands and forests and waters (Millennium Ecosystem Assessment 2005).
The following sections of this report are a compilation of that work for the Long Lake catchment.
86 square kilometres; occupies 11 percent of the Tay River subwatershed; two percent of the Rideau Valley watershed.
Geology/Physiography
Long Lake catchment resides within a transitionary area between the physiographic regions known as the Georgian Bay Fringe and the Algonquin Highlands. In the Tay River subwatershed, these ancient and hilly geologic regions are made up of such Precambrian rocks as marble, conglomerates, and dark or colour banded granite-like rocks. A veneer of glacial drift (glacial till, sand etc.) overlies the bedrock.
Municipal Coverage
Central Frontenac Township: (86 km2; 100% of catchment)
Stream Length
All tributaries (including headwater streams): 178 km
1.2 Vulnerable Areas
Aquifer Vulnerability
Mississippi-Rideau Source Water Protection program has mapped two small areas in this catchment, to the centre and southwest, as a Significant Groundwater Recharge Areas and all of the catchment as a Highly Vulnerable Aquifer. There are no Well-Head Protection Areas in the catchment.
Wetland Hydrology
A watershed model developed by the RVCA in 2009 was used to study the hydrologic function of wetlands in the Rideau Valley Watershed, including those found in the Long Lake catchment.
1.3 Conditions at a Glance
Fish Community/Thermal Regime
Warm and cool water recreational and baitfish fishery with 19 species observed in Stag, Stub and Uens Creek during 2016.
Headwater Features
Dominated by wetland and natural features with a few features that have been straightened, historically.
Instream/Riparian Habitat
Stub and Uens Creek: Low to high habitat complexity with increased habitat complexity observed in the upper reaches of each system within the catchment. Dissolved oxygen conditions on Uens Creek in the upper reach fall below the guideline to support warmwater aquatic biota; however, sections in the middle and lower reaches are acceptable for warmwater species. Stub Creek results show sections in the lower and upper reaches within the threshold to support warmwater aquatic biota; however, its middle reach falls below the recommended threshold to support warmwater aquatic biota.
Land Cover Type (2014)
Catchment
Woodland
Wetland
Water
Crop-Pasture
Meadow-Thicket
Transportation
Settlement
Percent
61
21
6
6
3
2
1
Land Cover Change (2008 to 2014)
Catchment
Woodland
Settlement
Hectares
-2
+2
Shoreline Cover Type (30 m. riparian area; 2014)
Catchment
Percent
Carnahan Lake
Percent
Long Lake
Percent
Streams*
Percent
Wetland
46
Woodland
95
Woodland
56
Wetland
52
Woodland
42
Settlement
2
Settlement
23
Woodland
37
Crop-Pasture
6
Wetland
2
Wetland
12
Crop-Pasture
7
Settlement
2
Transportation
1
Transportation
6
Transportation
2
Meadow-Thicket
2
---
---
Crop-Pasture
3
Meadow-Thicket
1
Transportation
2
---
---
---
---
Settlement
1
* (includes Stag, Stubb, Uens Creek)
Significant Natural Features
Long Lake Blue Calcite Provincial Area of Natural and Scientific Interest, Earth Science.
Species at Risk (Elemental Occurrence)
Status
Species at Risk
Status
Species at Risk
Endangered
American Ginseng
Henslow's Sparrow
Northern Myotis
Spotted Turtle
Threatened
Blanding's Turtle
Bobolink
Eastern Whip-poor-will
---
Special Concern
Snapping Turtle
---
---
---
Water Quality for the Protection of Aquatic Life (2006 to 2017)
Carnahan Lake
Long Lake
Stub Creek
Uens Creek
Poor to Fair
Fair to Good
Good
Fair
Water Wells
Approximately 200 operational private water wells in the Long Lake catchment. Groundwater uses are mainly domestic but also include livestock water supplies.
1.4 Catchment Care
Environmental Management
Three Environmental Compliance Approvals were sought in the catchment for private water supplies and sewage works.
Environmental Monitoring
Chemical surface (in-stream/lake) water quality collection by the RVCA since 2003 (see Section 2 of this report).
Fish survey and stream characterization survey by the RVCA on Stag, Stub and Uens Creek in 2016 included taking measurements and recording observations on instream habitat, bank stability, other attributes and preparing a temperature profile (see Section 3 of this report).
Thirty-three drainage feature assessments were conducted by the RVCA in 2016 at road crossings in the catchment. The protocol measures zero, first and second order headwater drainage features and is a rapid assessment method characterizing the amount of water, sediment transport, and storage capacity within headwater drainage features. (see Section 3.4 of this report).
Classification of Long Lake catchment land cover types derived by the RVCA from colour aerial photography that was acquired during the spring of 2008 and 2014 (see Section 4.1 of this report).
Groundwater chemistry information is available from the Ontario Geological Survey for one well (#13-AG-001) located in the catchment.
Stewardship
Two stewardship projects were completed by landowners with assistance from the RVCA (see Section 5 of this report).
Surface water quality conditions in the Long Lake catchment are monitored by the Rideau Valley Conservation Authority’s (RVCA) Watershed Watch Program and Baseline Water Quality Monitoring Program. Watershed Watch monitors watershed lakes to assess nutrient concentrations, water clarity, dissolved oxygen availability and pH. The baseline water quality program focuses on streams; data is collected for 22 parameters including nutrients (total phosphorus, total Kjeldahl nitrogen and ammonia), E. coli, metals (like aluminum and copper) and additional chemical/physical parameters (such as alkalinity, chlorides, pH and total suspended solids). Figure 2 shows the locations of monitoring sites in the catchment.
Figure 2 Water quality monitoring sites on Carnahan Lake, Long Lake, Stubbs Creek and Uens Creek
Water Quality Rating in the Long Lake Catchment
The water quality ratings scored high across this catchment and ranges from " Poor to Good" (Table 1). All ratings were determined by the Canadian Council of Ministers of the Environment (CCME) Water Quality Index. A “Poor” rating indicates that water quality is frequently threatened or impaired; conditions often depart from natural or desirable levels. A "Fair" rating indicates that water quality is usually protected but is occasionally threatened or impaired; conditions sometimes depart from natural or desirable levels. A rating of "Good" indicates that only a minor degree of threat or impairment is observed and conditions rarely depart from natural or desirable levels. Each parameter is evaluated against established guidelines to determine water quality conditions. Those parameters that frequently exceed guidelines are presented below. Data has been analyzed over the 2006-2017 period for general trends and conditions. Table 1 shows the overall rating for the monitored surface water quality sites within the catchment and Table 2 outlines the Water Quality Index (WQI) scores and their corresponding ratings.
Table 1 Water Quality Index ratings for the Long Lake Catchment
Site
Location
2006-2008
2009-2011
2012-2014
2015-2017
DP1
Long Lake
Good (88)
Fair (65)
Fair (77)
Fair (76)
DP1
Carnahan Lake
Fair (76)
Fair (65)
Poor (53)
Fair (77)
STU-01
Stubbs Creek at Babcock Rd
Fair (74)
Fair (73)
Good (82)
Good (82)
UEN-01
Uens Creek at Babcock Rd
Fair (70)
Poor (59)
Fair (69)
Fair (72)
Table 2 Water Quality Index ratings and corresponding index scores (RVCA terminology, original WQI category names in brackets)
Rating
Index Score
Very Good (Excellent)
95-100
Good
80-94
Fair
65-79
Poor (Marginal)
45-64
Very Poor (Poor)
0-44
2.1 Carnahan Lake Water Quality
Surface water quality conditions in Carnahan Lake have been monitored by RVCA’s Watershed Watch Program since 2004. Data from the deep point site (DP1) have been used to calculate the WQI rating for Carnahan Lake, which averaged “Poor-Fair” over the 2006-2017 period (Table 1). Moderate nutrient concentrations, periods of limited oxygen availability and generally clear water all influenced this rating. The following discussion explains how each of the monitored water quality parameters contributes to the lake’s water quality.
This report also considers data from five additional shoreline sites that are monitored around the lake. These sites have not been included in the calculation of the CCME WQI rating, as they are not monitored with the same frequency as the deep point site. However, they do provide important information on water quality conditions in the near shore areas. For locations of shoreline sites (A-E) please see Figure 2.
2.1.1. Carnahan Lake Nutrients
Total phosphorus (TP) is used as a primary indicator of excessive nutrient loading and contributes to abundant aquatic vegetation growth and depleted dissolved oxygen levels. The Provincial Water Quality Objective (PWQO) is used as the TP Guideline and states that in lakes, concentrations greater than 0.020 mg/l indicate an excessive amount of TP within the water column. Concentrations below 0.010 mg/l are generally considered to be minimal and unlikely to have problems associated with nutrient loading.
Total Kjeldahl nitrogen (TKN) is used as a secondary indicator of nutrient loading. RVCA uses a guideline of 0.500 mg/l to assess TKN[1] within surface waters.
Carnahan Lake at the Deep Point
TP and TKN sampling results collected by the RVCA are presented in Figures 3 to 6. Some variability has occurred in the sampled TP concentrations at this site (Figures 3 and 4); no significant trendwas observed in the 2006-2017 data set. Eighty percent of samples analyzed for TP were less than the TP guideline and the average concentration was 0.015 mg/l (Table 3). TKN concentration also showed variability, as with TP concentrations no significant change was observed (Figures 5 and 6). Sixty-eight percent of reported results were below the TKN guideline and the average TKN concentration was 0.460 mg/l (Table 3).
Overall, the data presented indicates that nutrient concentration may be considered moderate with occasional exceedances in the mid-lake, deep water site on Carnahan Lake.
Figure 3 Average total phosphorus concentrations at the deep point site (DP1) on Carnahan Lake, 2006-2017.
Figure 4 Distribution of total phosphorus concentrations at the deep point site (DP1) on Carnahan Lake, 2006-2017.
Figure 5 Average total Kjeldahl nitrogen concentrations at the deep point site (DP1) on Carnahan Lake, 2006-2017.
Figure 6 Distribution of total Kjeldahl nitrogen concentrations at the deep point site (DP1) on Carnahan Lake, 2006-2017.
Table 3 Summary of nutrient results for Carnahan Lake, 2006-2017
Total Phosphorous 2006-2017
Site
Average (mg/l)
Below Guideline
No. Samples
DP1
0.015
80%
44
Total Kjeldahl Nitrogen 2006-2017
Site
Average (mg/l)
Below Guideline
No. Samples
DP1
0.460
68%
44
Nutrients around Carnahan Lake
The average nutrient concentrations at monitored shoreline sites around the lake vary from year to year (Figures 7 and 8). Please note that in the 2006-2017 monitoring period sites A,C and E were monitored yearly; while sites B and D were only sampled in 2009 and 2014.
Average total phosphorous concentrations are below the TP guideline at the majority of sites throughout the monitoring period, with the exception of site A (Figure 7). This site monitors a shallow bay with inflow from a small creek. This creek runs through a significant wetland area and is likely bringing in naturally released nutrients from upstream. The low concentrations of TP at other monitored sites (Figure 7) provide support that nutrient loading is not a significant problem around the lake.
A similar pattern is observed in TKN data, specifically elevated concentrations at site A (Figure 8). Elevated results were also observed at all sites in 2009, this may be due to an external factor such as weather conditions that influenced the lake at the time of sampling.
Figure 7 Average total phosphorous concentrations at shoreline monitoring sites on Carnahan Lake, 2006-2017
Figure 8 Average total Kjeldahl nitrogen concentrations at shoreline monitoring sites on Carnahan Lake, 2006-2017
Summary of Carnahan Lake Nutrients
Carnahan Lake nutrient concentrations are generally below the guidelines. It is possible that occasional problems with nutrient enrichment (i.e. algal blooms or excessive plant growth) may be observed in some shallow, sheltered bays.
Efforts such as the diversion of runoff and enhanced shoreline buffers are important to continue to protect and enhance water quality, and reduce future nutrient increases-particularly in developed areas. Nutrient exceedances may be partially attributed to the natural aging of a lake and basin characteristics. All residents can help minimize their impact on the lake by reducing nutrient inputs through practices such as proper maintenance of septic systems, keeping shorelines natural and using phosphate free soaps and detergents. Promotion of sound stewardship and protection around lake is important to maintain and protect water quality conditions into the future.
2.1.2 Carnahan Lake Water Clarity
Water clarity is measured using a Secchi disk during each deep point sample. Table 4 summarizes the recorded depths with an average depth of 3.2 m and shows that 93 percent readings have exceeded the minimum PWQO of 2 m; indicating that algae in the water column is not at excessive levels (good water clarity). Less than 2 m will indicate overproduction in a lake or significant inputs to the water column that are limiting light availability. Figure 9 shows that measured depths range from 1.9 m to 5 m. No significant change was noted in Secchi depth over the 2006-2017 period.
Table 4 Summary of Secchi depths recorded at the deep point sites (DP1) on Carnahan Lake
Secchi 2006-2017
Site
Average (m)
Above Guideline
No. Samples
DP1
3.2
93%
43
Figure 9 Recorded Secchi depths at the deep point site (DP1) on Carnahan Lake, 2006-2017
Summary of Carnahan Lake Water Clarity
Waters in Carnahan Lake are usually clear and sufficient sunlight is able to penetrate the water column to support aquatic life and provide sufficient visibility for safe recreational use (boating, swimming).
2.1.3 Carnahan Lake Fish Habitat
Two other factors, dissolved oxygen/temperature and pH were also assessed to provide an overall sense of the health of Carnahan Lake from a fish habitat perspective.
2.1.3.1 Carnahan Lake Dissolved Oxygen and Temperature
The red bars in Figure 10 show the depths where suitable conditions exist for warm water fish species (temperature less than 25°C and dissolved oxygen greater than 4 mg/l) at the deep point site. The vertical axis represents the total lake depth at each site where the profile is taken. Suitable conditions typically were observed over the monitoring periods to about 5 m of the water column. Periods of very limited conditions were observed in the summers of 2009-2013, due to very warm water temperatures in the upper portion of the water column and depleted oxygen conditions at the deeper depths. Overall, no significant change was noted in conditions through the 2006-2017 period.
Figure 10 Depths suitable for warm water fish species at deep point site (DP1) on Carnahan Lake, 2006-2017.
2.1.3.2 Carnahan Lake pH
All samples (Figure 11) were within guidelines established by the Canadian Council of Minister's of the Environment which state that pH should be between 6.5 and 9 to protect aquatic life (Table 5). Biological activities such as increased photosynthesis from algal blooms and plant growth may influence pH in addition to anthropogenic activities.
Figure 11 pH concentrations at the deep point site (DP1) on Carnahan Lake, 2006-2017
Table 5 Summary of pH results at the deep point site (DP1) on Carnahan Lake, 2006-2017
pH 2006-2017
Site
Average (mg/l)
Within Guideline
No. Samples
DP1
7.7
100%
39
Summary of Water Quality for Fish Habitat in Carnahan Lake
Overall the water chemistry data at the deep point describes suitable habitat conditions for warm water fish species. pH conditions are within the range recommended for the protection of aquatic life. Overall, the data indicates a healthy environment for aquatic species.
2.1.4 Carnahan Lake E. Coli
E. coli is sampled at monitored shoreline sites twice each sampling season. E. coli data was not used in the calculations of the WQI rating for the lake due to differences in sampling frequency and site locations. E. coli data has been summarized in Table 10.
Throughout the 2006-2017 period the majority of samples collected by RVCA were below the E. coli guideline of 100 colony forming units (CFU) per 100 ml set by the PWQO; across the lake the count at the geometric mean was 8 CFU/100ml (Table 6). This provides support that there is little indication of bacterial contamination around the lake. Figure 12 show the distribution of counts across all shoreline sites. Counts at site A are elevated compared to other sites, this can likely be attributed to wildlife presence rather than sewage pollution.
Table 6 Summary of E. coli results for Carnahan Lake, 2006-2017.
E. coli 2006-2017
Site
Geometric mean (CFU/100ml)
Below Guideline
No. Samples
A-E
8
94%
89
Figure 12 E. coli counts at monitored shoreline sites on Carnahan Lake, 2006-2017
Summary of Bacterial Contamination
The results presented above indicate that bacterial contamination is not a significant concern in Carnahan Lake and the water should be safe for recreational use such as swimming and boating.
2.2 Long Lake Water Quality
Surface water quality conditions in Long Lake have been monitored by RVCA’s Watershed Watch Program since 2004. Data from the deep point site (DP1) have been used to calculate the WQI rating for Long Lake, which averaged “Fair-Good” over the 2006-2017 period (Table 1). Low-moderate nutrient concentrations, periods of limited oxygen availability and generally clear water all influenced this rating. The following discussion explains how each of the monitored water quality parameters contributes to the lake’s water quality.
This report also considers data from 10 additional shoreline sites that are monitored around the lake. These sites have not been included in the calculation of the CCME WQI rating, as they are not monitored with the same frequency as the deep point site. However, they do provide important information on water quality conditions in the near shore areas. For locations of shoreline sites (A-J) please see Figure 2.
2.2.1 Long Lake Nutrients
Total phosphorus (TP) is used as a primary indicator of excessive nutrient loading and contributes to abundant aquatic vegetation growth and depleted dissolved oxygen levels. The Provincial Water Quality Objective (PWQO) is used as the TP Guideline and states that in lakes, concentrations greater than 0.020 mg/l indicate an excessive amount of TP within the water column. Concentrations below 0.010 mg/l are generally considered to be minimal and unlikely to have problems associated with nutrient loading.
Total Kjeldahl nitrogen (TKN) is used as a secondary indicator of nutrient loading. RVCA uses a guideline of 0.500 mg/l to assess TKN[1] within surface waters.
Nutrients at the Long Lake Deep Point
TP and TKN sampling results collected by the RVCA are presented in Figures 13 to 16. Some variability has occurred in the sampled TP concentrations at this site (Figures 13 and 14); no significant trend[2] was observed in the 2006-2017 data set. Eighty-seven percent of samples analyzed for TP were less than the TP guideline and the average concentration was 0.014 mg/l (Table 7). TKN concentrations were fairly consistent, as with TP concentrations no significant change was observed (Figures 15 and 16). Eighty-seven percent of reported results were below the TKN guideline and the average TKN concentration was 0.416 mg/l (Table 7).
Overall, the data presented indicates that nutrient concentration may be considered moderate with occasional exceedances in the mid-lake, deep water site on Long Lake.
Figure 13 Average total phosphorus concentrations at the deep point site (DP1) on Long Lake, 2006-2017.
Figure 14 Distribution of total phosphorus concentrations at the deep point site (DP1) on Long Lake, 2006-2017.
Figure 15 Average total Kjeldahl nitrogen concentrations at the deep point site (DP1) on Long Lake, 2006-2017.
Figure 16 Distribution of total Kjeldahl nitrogen concentrations at the deep point site (DP1) on Long Lake, 2006-2017.
Table 7 Summary of nutrient results for Long Lake, 2006-2017
Total Phosphorous 2006-2017
Site
Average (mg/l)
Below Guideline
No. Samples
DP1
0.014
87%
45
Total Kjeldahl Nitrogen 2003-2008
Site
Average (mg/l)
Below Guideline
No. Samples
DP1
0.416
87%
45
Nutrients around Long Lake
The average nutrient concentrations at monitored shoreline sites around the lake vary from year to year (Figures 17 and 18). Please note that in the 2006-2017 monitoring period sites B, E, F and H were monitored yearly; while sites A, C, D, G, I and J were only sampled in 2009 and 2014.
Average total phosphorous concentrations are below the TP guideline at the majority of sites throughout the monitoring period (Figure 17), periods of elevated results were observed at site E in 2011, 2013 and 2017, site F in 2009 and site B in 2014. These three sites (E, F an B) are not persistently elevated therefore these few elevated samples are not likely to be of great concern. The low concentrations of TP at other monitored sites (Figure 17) provide support that nutrient loading is not a significant problem around the lake.
A similar pattern is observed in TKN data, specifically elevated concentrations at site E in 2011, 2013, 2014 and 2017 (Figure 18). Since site E is at the outflow of the lake, elevated counts may indicate higher loads associated with wet weather years.
Figure 17 Average total phosphorous concentrations at shoreline monitoring sites on Long Lake, 2006-2017
Figure 18 Average total Kjeldahl nitrogen concentrations at shoreline monitoring sites on Long Lake, 2006-2017
Summary of Long Lake Nutrients
Long Lake nutrient concentrations are generally below the guidelines. It is possible that occasional problems with nutrient enrichment (i.e. algal blooms or excessive plant growth) may be observed in some shallow, sheltered bays.
Efforts such as the diversion of runoff and enhanced shoreline buffers are important to continue to protect and enhance water quality, and reduce future nutrient increases-particularly in developed areas. Nutrient exceedances may be partially attributed to the natural aging of a lake and basin characteristics. All residents can help minimize their impact on the lake by reducing nutrient inputs through practices such as proper maintenance of septic systems, keeping shorelines natural and using phosphate free soaps and detergents. Promotion of sound stewardship and protection around lake is important to maintain and protect water quality conditions into the future.
2.2.2 Long Lake Water Clarity
Water clarity is measured using a Secchi disk during each deep point sample. Table 8 summarizes the recorded depths with an average depth of 3.1 m and shows that 80 percent of readings have exceeded the minimum PWQO of 2 m; indicating that algae in the water column is not at excessive levels (good water clarity). Less than 2 m will indicate overproduction in a lake or significant inputs to the water column that are limiting light availability. Figure 19 shows that measured depths range from 1.5 m to 4.6 m. A decline was observed in Secchi depths over the 2006-2017 data set, meaning that clarity in the water column has been reduced in this period.
Table 8 Summary of Secchi depths recorded at the deep point site (DP1) on Long Lake
Secchi 2006-2017
Site
Average (m)
Above Guideline
No. Samples
DP1
3.1
80%
44
Figure 19 Recorded Secchi depths at the deep point site (DP1) on Long Lake, 2006-2017
Summary of Long Lake Water Clarity
Waters in Long Lake are usually clear and sufficient sunlight is able to penetrate the water column to support aquatic life and provide sufficient visibility for safe recreational use (boating, swimming).
2.2.3 Long Lake Fish Habitat
Two other factors, dissolved oxygen/temperature and pH were also assessed to provide an overall sense of the health of Long Lake from a fish habitat perspective.
2.2.3.1 Long Lake Dissolved Oxygen and Temperature
The red bars in Figure 20 show the depths where suitable conditions exist for warm water fish species (temperature less than 25°C and dissolved oxygen greater than 4 mg/l) at the deep point site. The vertical axis represents the total lake depth at each site where the profile is taken. Suitable conditions typically were observed over the monitoring periods to about 8 m of the water column. Periods of very limited conditions were observed in the summers of 2009-2013, due to very warm water temperatures in the upper portion of the water column and depleted oxygen conditions at the deeper depths. Overall, no significant change was noted in conditions through the 2006-2017 period.
Figure 20 Depths suitable for warm water fish species at deep point site (DP1) on Long Lake, 2006-2017.
2.2.3.2 Long Lake pH
All samples (Figure 21) were within guidelines established by the Canadian Council of Minister's of the Environment which state that pH should be between 6.5 and 9 to protect aquatic life (Table 9). Biological activities such as increased photosynthesis from algal blooms and plant growth may influence pH in addition to anthropogenic activities.
Figure 21 pH concentrations at the deep point site (DP1) on Long Lake, 2006-2017
Table 9 Summary of pH results at the deep point site (DP1) on Long Lake, 2006-2017
pH 2006-2017
Site
Average (mg/l)
Within Guideline
No. Samples
DP1
7.8
100%
41
Summary of Water Quality for Fish Habitat in Long Lake
Overall the water chemistry data at the deep point describes suitable habitat conditions for warm water fish species. pH conditions are within the range recommended for the protection of aquatic life. Overall, the data indicates a healthy environment for aquatic species.
2.2.4 Long Lake E. Coli
E. coli is sampled at monitored shoreline sites twice each sampling season. E. coli data was not used in the calculations of the WQI rating for the lake due to differences in sampling frequency and site locations. E. coli data has been summarized in Table 10.
Throughout the 2006-2017 period all samples collected by RVCA were below the E. coli guideline of 100 colony forming units (CFU) per 100 ml set by the PWQO; across the lake the count at the geometric mean was 4 CFU/100ml (Table 6). This provides support that there is little indication of bacterial contamination around the lake. Figure 22 show the distribution of counts across all shoreline sites.
Table 10 Summary of E. coli results for Long Lake, 2006-2017.
E. coli 2006-2017
Site
Geometric mean (CFU/100ml)
Below Guideline
No. Samples
A-J
4
100%
137
Figure 22 E. coli counts at monitored shoreline sites on Long Lake, 2006-2017
Summary of Long Lake Bacterial Contamination
The results presented above indicate that bacterial contamination is not a significant concern in Long Lake and the water should be safe for recreational use such as swimming and boating.
2.3 Stubb Creek Water Quality
There is one water quality monitoring site on Stubb Creek (STU-01) (Figure 2). Water quality was determined to be “Good” (Table 1). The score at this site was largely influenced by occasionally elevated nutrient concentrations, iron and bacterial counts. For more information on the CCME WQI, please see the Tay River Subwatershed Report 2017.
2.3.1 Stubb Creek Nutrients
Total phosphorus (TP) is used as a primary indicator of excessive nutrient loading and may contribute to abundant aquatic vegetation growth and depleted dissolved oxygen levels. The Provincial Water Quality Objective (PWQO) is used as the TP Guideline and states that in streams concentrations greater than 0.030 mg/l indicate an excessive amount of TP.
Total Kjeldahl nitrogen (TKN) is used as a secondary indicator of nutrient loading. RVCA uses a guideline of 0.500 mg/l to assess TKN[1].
Tables 11 and 12 summarize average nutrient concentrations at the monitored sites within the Stubb Creek catchment and show the proportion of results that met the guidelines.
Table 11 Summary of total phosphorus results for Stubb Creek, 2006-2017 (Highlighted values indicate average concentrations exceed the guideline)
Total Phosphorus 2006-2017
Site
Average (mg/l)
Below Guideline
No. Samples
STU-01
0.040
72%
75
Table 12 Summary of total Kjeldahl nitrogen results for Stubb Creek, 2006-2017 (Highlighted values indicate average concentrations exceed the guideline)
Total Kjeldahl nitrogen 2006-2017
Site
Average (mg/l)
Below Guideline
No. Samples
STU-01
0.695
29%
75
Monitoring Site STU-01
Elevated TP results occurred occasionally at site STU-01 throughout the monitoring period; 72% of samples were below the guideline (Figure 24) and average concentrations are variable across the sampled months (Figure 23). Please note a significantly high sample in May of 2010 (Figure 24) has had a strong influence of the average May results (Figure 23) through the monitoring period. The average TP concentration was above the guideline of 0.030 mg/l at 0.040mg/l (Table 11).
The majority of TKN results have exceeded the guideline (Figure 26); 29 percent of samples were below the guideline. The average concentration was 0.695 mg/l and exceeded the guideline of 0.500 mg/l (Table 12). As with the TP data set, an elevated sample in May 2010 (Figure 26) has a strong influence on the monthly average for May (Figure 25). Average monthly samples generally exceeded the guideline with the exception of April and November.
There was no significant change in the sampled concentrations of TP or TKN at this site over the 2006-2017 period (Figure 24 and 26).
Figure 23 Average monthly total phosphorus concentrations in Stubb Creek, 2006-2017.
Figure 24 Distribution of total phosphorus concentrations in Stubb Creek, 2006-2017.
Figure 25 Average monthly total Kjeldahl nitrogen concentrations in Stubb Creek, 2006-2017.
Figure 26 Distribution of total Kjeldahl nitrogen concentrations in Stubb Creek, 2006-2017
Summary of Stubb Creek Nutrients
The data shows that periods of elevated nutrients occur occasionally in Stubb Creek. Elevated nitrogen is likely due to the influence of surrounding wetland areas. Wetlands are naturally rich in nitrogen and appear to be contributing to the concentrations in this creek. Though this is likely to be a natural condition it is important to reduce human impacts wherever possible. Strategies to reduce nutrient inputs may include diversion of runoff to the creek from surrounding developed areas (i.e. roadways) and enhanced shoreline buffers.
2.3.2 Stubb Creek E. coli
Escherichia coli (E. coli) is used as an indicator of bacterial pollution from human or animal waste; in elevated concentrations it can pose a risk to human health. The PWQO of 100 colony forming units/100 millilitres (CFU/100 ml) is used as a guideline. E. coli counts greater than this guideline indicate that bacterial contamination may be a problem within a waterbody.
Table 13 summarizes the geometric mean[2] for the monitored site on Stubb Creek and shows the proportion of samples that meet the E. coli guideline of 100 CFU/100 ml. The results of the geometric mean with respect to the guideline for the 2006-2017 period are shown in Figures 27 and 28.
Table 13 Summary of E. coli results for Stubb Creek, 2006-2017
E. coli 2006-2017
Site
Geometric Mean (CFU/100ml)
Below Guideline
No. Samples
STU-01
52
71%
75
Monitoring Site STU-01
E. coli counts at site STU-01 show that there has been no significant trend in bacterial counts (Figure 28). The count at the geometric mean was 52 (Table 13), and majority of results (71 percent) were below the E. coli guideline. Figure 27 shows that counts are generally highest from May to October; this can likely be attributed to warm weather and reduced flow conditions, the geometric mean did not exceed the guideline in any of the sampled months.
Figure 27 Geometric mean of monthly E. coli counts in Stubb Creek, 2006-2017
Figure 28 Distribution of E. coli counts in Stubb Creek, 2006-2017
Summary of Stubb Creek Bacterial Contamination
Bacterial contamination does not appear to be a significant concern in Stubb Creeks. As indicated by Figure 28 occasional exceedances above the guideline of 100 CFU/100ml have been observed. Best management practices such as enhancing shoreline buffers, limiting livestock access and minimizing runoff in both rural and developed areas can help to protect Stubb Creek into the future.
2.3.3 Stubb Creek Metals
Of the metals routinely monitored in Stubb Creek iron (Fe) occasionally reported concentrations above its respective Provincial Water Quality Objective of 0.300 mg/l. In elevated concentrations, this metal can have toxic effects on sensitive aquatic species.
Table 14 summarizes Fe concentrations within the creek as well as show the proportion of samples that meet guidelines. Figures 29 and 30 show Fe concentrations with respect to the guidelines for the monitoring period, 2006-2017.
Table 14 Summary of iron results in Stubb Creek from 2006-2017 (Highlighted values indicate average concentrations exceed the guideline)
Iron 2006-2017
Site
Average (mg/l)
Below Guideline
No. Samples
STU-01
0.711
37%
27
Monitoring Site STU-01
The average Fe concentrations in site STU-01 was 0.711 mg/l and exceeded the guideline (PWQO). Thirty-seven percent of samples were below the guideline and there was no significant change in Fe concentrations across the monitoring period (Table 14, Figure 30). Monthly concentrations were elevated through the summer months, with the highest concentrations observed in September (Figure 30).
Figure 29 Average monthly iron concentrations in Stubb Creek, 2006-2017.
Figure 30 Distribution of iron concentrations in Stubb Creek, 2006-2017.
Summary of Stubb Creek Metals
In Stubb Creek there is evidence of increased metal concentration above respective guidelines, it is quite likely that they are naturally occurring from groundwater inputs. Even so, continued efforts should be made to protect against possible pollution sources and implement best management practices to reduce any inputs such as storm water runoff from hardened surfaces to improve overall stream health and lessen downstream impacts.
2.4 Uens Creek Water Quality
There is one water quality monitoring site on Uens Creek (UEN-01) (Figure 1). Water quality was determined to be “Fair” (Table 1). The score at this site was largely influenced by frequently elevated nutrient concentrations, as well as elevated iron and bacterial counts. For more information on the CCME WQI, please see the Tay River Subwatershed Report 2017.
2.4.1 Uens Creek Nutrients
Total phosphorus (TP) is used as a primary indicator of excessive nutrient loading and may contribute to abundant aquatic vegetation growth and depleted dissolved oxygen levels. The Provincial Water Quality Objective (PWQO) is used as the TP Guideline and states that in streams concentrations greater than 0.030 mg/l indicate an excessive amount of TP.
Total Kjeldahl nitrogen (TKN) is used as a secondary indicator of nutrient loading. RVCA uses a guideline of 0.500 mg/l to assess TKN[1].
Tables 15 and 16 summarize average nutrient concentrations at the monitored site on Uen's Creek and show the proportion of results that met the guidelines.
Table 15 Summary of total phosphorus results for Uen Creek, 2006-2017 (Highlighted values indicate average concentrations exceed the guideline)
Total Phosphorus 2006-2017
Site
Average (mg/l)
Below Guideline
No. Samples
UEN-01
0.047
38%
77
Table 16 Summary of total Kjeldahl nitrogen results for the Uen Creek, 2006-2017 (Highlighted values indicate average concentrations exceed the guideline)
Total Kjeldahl nitrogen 2006-2017
Site
Average (mg/l)
Below Guideline
No. Samples
UEN-01
0.860
8%
75
Monitoring Site UEN-01
Elevated TP results occurred regularly at site UEN-01 throughout the 2006-2017 period; only 38% of samples were below the guideline (Figure 32). Average concentrations increased throughout the summer months and into the early fall (Figure 31). Please note a significantly high sample in October 2013 (Figure 32) has had a strong influence of the average October results (Figure 31) through the monitoring period. The average TP concentration was above the guideline of 0.030 mg/l at 0.047 mg/l (Table 15).
The majority of TKN results have exceeded the guideline (Figure 34). Very few samples (8 percent) were below the guideline. The average concentration was 0.860 mg/l and exceeded the guideline of 0.500 mg/l (Table 16). Concentrations appear to be the lowest in the early spring and increase through the summer months (Figure 33).
There was no significant change in the sampled concentrations of TP or TKN at this site over the 2006-2017 period (Figure 32 and 34).
Figure 31 Average monthly total phosphorus concentrations in Uen Creek, 2006-2017.
Figure 32 Distribution of total phosphorus concentrations in Uen Creek, 2006-2017.
Figure 33 Average monthly total Kjeldahl nitrogen concentrations in Uen Creek, 2006-2017.
Figure 34 Distribution of total Kjeldahl nitrogen concentrations in Uen Creek, 2006-2017
Summary of Uens Creek Nutrients
Results of the monitored site on Uen Creek shows that periods of nutrient enrichment are a feature of this creek, particularly with respect to nitrogen. Elevated nutrients may result in nutrient loading downstream. High nutrient concentrations can help stimulate the growth of algae blooms and other aquatic vegetation in a waterbody and deplete oxygen levels as the vegetation dies off. Development in this area is also minimal but best management practices such as minimizing storm water runoff, enhanced shoreline buffers, minimizing/discontinuing the use of fertilizers and restricting livestock access in both surrounding agricultural and developed areas can help to reduce additional nutrient enrichment both within this creek.
2.4.2 Uens Creek Escherichia coli
Escherichia coli (E. coli) is used as an indicator of bacterial pollution from human or animal waste; in elevated concentrations it can pose a risk to human health. The PWQO of 100 colony forming units/100 millilitres (CFU/100 ml) is used as a guideline. E. coli counts greater than this guideline indicate that bacterial contamination may be a problem within a waterbody.
Table 17 summarizes the geometric mean[2] for the monitored site on Uen Creek and shows the proportion of samples that meet the E. coli guideline of 100 CFU/100 ml. The results of the geometric mean with respect to the guideline for the 2006-2017 period are shown in Figures 35 and 36.
Table 17 Summary of E. coli results for Uen Creek, 2006-2017
E. coli 2012-2017
Site
Geometric Mean (CFU/100ml)
Below Guideline
No. Samples
UEN-01
41
74%
76
Monitoring Site UEN-01
E. coli counts at site UEN-01 show that there has been no significant trend in bacterial counts (Figure 36). The count at the geometric mean was 41 (Table 17), and majority of results (74 percent) were below the E. coli guideline. Figure 35 shows that counts are generally highest during the summer months; this can likely be attributed to warm weather and reduced flow conditions, the geometric mean did not exceed the guideline in any of the sampled months.
Figure 35 Geometric mean of monthly E. coli counts in Uen Creek, 2006-2017
Figure 36 Distribution of E. coli counts in Uen Creek, 2006-2017
Summary of Uens Creek Bacterial Contamination
Bacterial contamination does not appear to be a significant concern in Uen Creeks. As indicated by Figure 36 occasional exceedances above the guideline of 100 CFU/100ml have been observed. Best management practices such as enhancing shoreline buffers, limiting livestock access and minimizing runoff in both rural and developed areas can help to protect Uen Creek into the future.
2.4.3 Uens Creek Metals
Of the metals routinely monitored in Uen Creek iron (Fe) occasionally reported concentrations above its respective Provincial Water Quality Objective of 0.300 mg/l. In elevated concentrations, this metal can have toxic effects on sensitive aquatic species.
Table 18 summarizes Fe concentrations within the creek as well as show the proportion of samples that meet guidelines. Figures 37 and 38 show Fe concentrations with respect to the guidelines for the monitoring period, 2006-2017.
Table 18 Summary of iron results in Uen Creek from 2006-2017 (Highlighted values indicate average concentrations exceed the guideline)
Iron 2006-2017
Site
Average (mg/l)
Below Guideline
No. Samples
UEN-01
1.39
25%
28
Monitoring Site UEN-01
The average Fe concentration in site UEN-01 was 1.390 mg/l and exceeded the guideline (PWQO). Only 25 percent of samples were below the guideline and there was no significant change in Fe concentrations across the monitoring period (Table 18, Figure 38). Monthly concentrations are highly influenced by samples in May 2010 and August 2012 (Figures 37 and 38). The majority of samples analyzed for metals have been collected in April and August to capture metal concentrations in high and low flow conditions.
Figure 37 Average monthly iron concentrations in Uen Creek, 2006-2017.
Figure 38 Distribution of iron concentrations in Uen Creek, 2006-2017.
Summary ofUens Creek metals
In Uen creek there is evidence of increased metal concentration above respective guidelines, it is quite likely that the largest source of Fe is naturally occurring from groundwater inputs. Even so, continued efforts should be made to protect against possible pollution sources and implement best management practices to reduce any inputs such as storm water runoff from hardened surfaces to improve overall stream health and lessen downstream impacts.
[1] No Ontario guideline for TKN is presently available; however, waters not influenced by excessive organic inputs typically range from 0.100 to 0.500 mg/l, Environment Canada (1979) Water Quality Sourcebook, A Guide to Water Quality Parameters, Inland Waters Directorate, Water Quality Branch, Ottawa, Canada
[2] A type of mean or average, which indicates the central tendency or typical value of a set of numbers by using the product of their values (as opposed to the arithmetic mean which uses their sum). It is often used to summarize a variable that varies over several orders of magnitude, such as E. coli counts.
The Stream Characterization Program evaluated two tributaries in the Long Lake catchment in 2016. A total of 2.2 kilometres along Stub Creek was surveyed in the middle of June, while 2.5 kilometres along Uens Creek was assessed in July and August.
During the summer and fall of 2016, the Rideau Valley watershed experienced periods of severe drought. Precipitation levels were measured at less than 40% of the long-term average, as the water supply was unable to meet local demand. The lack of rainfall affected the success and function of farm crops, municipal and private wells, lawns and gardens, navigation and ultimately the health of our lakes, rivers and streams.
Low water conditions were readily observed throughout the watershed, as many of the streams were highly fragmented or completely dry. Aquatic species such as amphibians, fish and macroinvertebrates were affected, as suitable habitat may have been limited. Fragmentation of habitat was observed in sections along Stag, Stub and Uens Creek during drought conditions in 2016.
Photo along Stag Creek showing fragmentation of aquatic habitat during the drought in the Fall of 2016
3.1 Uens Creek and Stub Creek Overbank Zone
3.1.1 Riparian Buffer Land Cover Evaluation
The quality of the riparian area increases with the width, complexity and linear extent of its vegetation along a stream or creek. A complex riparian community consists of diverse plant species native to the site, with multiple age-classes providing vertical structural diversity along a watercourse.
Here is a list of watershed benefits from a healthy riparian buffer zone:
Reduces the amount of pollutants that reach the stream from surface runoff
Helps reduce and mitigates erosion
Provides a microclimate that is cooler during the summer months providing cooler water for aquatic organisms
Provides large wood structure from fallen trees and limbs that form instream cover, create pools, stabilize the streambed, and provide habitat for aquatic organisms
Provides organic material for stream biota that, among other functions, is the base of the food chain in lower order streams
Provides habitat for terrestrial insects that drop in the stream and become food for fish and travel corridors for other terrestrial animals
Dissipates energy during flood events
Often provides the only refuge areas for fish during out-of-bank flows (behind trees, stumps, and logs)
Figure 39 demonstrates the buffer conditions of the left and right banks separately. Uens Creek had a buffer of greater than 30 meters along 100 percent of the left bank and 88 percent of the right bank.
Figure 39 Riparian Buffer Evaluation along Uens Creek
Figure 40 shows that Stub Creek had a buffer of greater than 30 meters along 100 percent of the left bank and 98 percent of the right bank.
Figure 40 Riparian Buffer Evaluation along Stub Creek
3.1.2 Riparian Buffer Alterations
Alterations within the riparian buffer were assessed within three distinct shoreline zones (0-5m, 5-15m, 15-30m), and evaluated based on the dominant vegetative community and/or land cover type (Figure 41). The riparian buffer zone along Uens and Stub Creek were found to be dominated by wetland, forest and scrubland conditions.
Figure 41 Riparian buffer alterations along Uens and Stub Creek
3.1.3 Adjacent Land Use
Surrounding land use is considered from the beginning to end of the survey section (100m) and up to 100m on each side of the river. Land use outside of this area is not considered for the surveys but is nonetheless part of the subwatershed and will influence the creek.
The RVCA’s Stream Characterization Program identifies seven different land uses along Uens Creek (Figure 42). Wetland habitat was dominant at 60 percent of sections surveyed; scrubland habitat was found at 56 percent of sections, 52 percent forested habitat, while 40 percent was classified as meadow habitat in the adjacent lands along Uens Creek. The remaining land use consisted of active agriculture, residential and infrastructure in the form of road crossings.
Figure 42 Land Use along Uens Creek
The RVCA’s Stream Characterization Program identifies four different land uses along Stub Creek (Figure 43). Wetland habitat was dominant at 64 percent of sections surveyed; forested habitat was found at 55 percent of sections and 14 percent of sections had scrubland habitat in the adjacent lands along Stub Creek. The remaining land use consisted of infrastructure in the form of road crossings.
Figure 43 Land Use along Stub Creek
3.2 Uens Creek and Stub Creek Shoreline Zone
3.2.1 Instream Erosion
Stream erosion is the process by which water erodes and transports sediments, resulting in dynamic flows and diverse habitat conditions. Excessive erosion can result in drastic environmental changes, as habitat conditions, water quality and aquatic life are all negatively affected. Bank stability was assessed as the overall extent of each section with “unstable” shoreline conditions. These conditions are defined by the presence of significant exposed soils/roots, minimal bank vegetation, severe undercutting, slumping or scour and potential failed erosion measures. The majority of Stub Creek had no evidence of erosion observed along the surveyed sections, however there was one location with moderate levels of erosion observed (Figure 44). Uens Creek was more variable in relation to erosion levels along the system with low levels of erosion to one location with high erosion levels observed.
Figure 44 Erosion levels along Uens and Stub Creek
3.2.2 Undercut Stream Banks
Stream bank undercuts can provide excellent cover habitat for aquatic life, however excessive levels can be an indication of unstable shoreline conditions. Bank undercut was assessed as the overall extent of each surveyed section with overhanging bank cover present. Figure 45 shows that Uens and Stub Creek had highly variable conditions ranging from no undercut stream banks to high levels observed.
Figure 45 Undercut stream banks along Uens and Stub Creek
3.2.3 Stream Shading
Grasses, shrubs and trees all contribute towards shading a stream. Shade is important in moderating stream temperature, contributing to food supply and helping with nutrient reduction within a stream. Stream cover is assessed as the total coverage area in each section that is shaded by overhanging trees/grasses and tree canopy, at greater than 1m above the water surface. Figure 46 shows highly variable levels of stream shading along Uens and Stub Creek.
Figure 46 Stream shading observations along Uens and Stub Creek
3.2.4 Instream Wood Structure
Forested shorelines provide essential complex habitat through the perpetual process of shoreline trees falling into the water. This continuous recruitment of trees creates a wood-based physical structure in the littoral zone that is common on natural systems. Insects, fish, amphibians, birds, and other animals have also evolved with this abundance of near shore wood and it is essential to their life cycles. With increased development along many waterways, forested lakeshores have been altered and wood-based physical structure in many waterways has been reduced. It is important to restore this essential habitat to aquatic ecosystems.
Shoreline Protection
Protects shorelines by providing a barrier from wind and wave erosion
Reduces sedimentation of the water caused by shoreline slumping due to bank erosion
Allows detritus to collect and settle on the lake or creek bed providing the substrate structure required for native aquatic vegetation to establish and outcompete invasive species
Food Source
Wood complexes are an important food source for invertebrates
Small fish feed on the abundance of invertebrates that are found around these structures
Larger fish, waterfowl and shorebirds all benefit from the abundance of invertebrates and small fish feeding around woody structures in the littoral zone
Cover
Cover from predators is essential for many fish and animals to successfully complete their life cycle
The nooks and crannies of wood complexes offer critters safety from predators while at the same time concentrating prey to make predators more efficient
Wood provides the structure on which many species must lay or attach their eggs, therefore these complexes provide quality spawning and nesting habitat
Diversity
Wood complexes in the littoral zone provide unique edge habitat along the shoreline
Edge habitats contain more species diversity and higher concentrations of species than the adjoining habitats themselves will have
Figure 47 shows that the majority of Stub Creek had high to moderate levels of instream structure along the system. Uens Creek was highly variable with low to high levels of in water trees and branches observed along the majority of the system.
Figure 47 Instream wood structure along Uens and Stub Creek
Instream wood structure located along Stub Creek
3.2.5 Overhanging Wood Structure
Trees and branches that are less than one meter from the surface of the water are defined as overhanging. Overhanging branches and trees provide a food source, nutrients and shade which helps to moderate instream water temperatures. Figure 48 shows the systems are highly variable with no overhanging branches and trees where the system is wide and is dominated by wetland habitat to areas in the middle reach of Uens Creek with high levels of overhanging wood structure. Stub creek had low levels of overhanging wood structure along the majority of the system as it is dominated by wide wetland habitat conditions.
Figure 48 Overhanging wood structure along Uens and Stub Creek
3.2.6 Anthropogenic Alterations
Stream alterations are classified based on specific functional criteria associated with the flow conditions, the riparian buffer and potential human influences.
Figure 49 shows seventy six percent of Uens Creek remains “unaltered” with no anthropogenic alterations. Twenty four percent of Uens Creek was classified as natural with minor anthropogenic changes. The minor alterations along Uens Creek were in the form of road crossings. There were no sections that were classified as being altered or highly altered.
Figure 49 Anthropogenic alterations along Uens Creek
Figure 50 shows ninety five percent of Stub Creek remains “unaltered” with no anthropogenic alterations. Five percent of Stub Creek was classified as natural with minor anthropogenic changes. The minor alterations along Stub Creek were in the form of road crossings. There were no sections that were classified as being altered or highly altered.
Figure 50 Anthropogenic alterations along Stub Creek
3.3 Uens Creek and Stub Creek Instream Aquatic Habitat
3.3.1 Habitat Complexity
Habitat complexity is a measure of the overall diversity of habitat types and features within a stream. Streams with high habitat complexity support a greater variety of species niches, and therefore contribute to greater diversity. Factors such as substrate, flow conditions (pools, riffles) and cover material (vegetation, wood structure, etc.) all provide crucial habitat to aquatic life. Habitat complexity is assessed based on the presence of boulder, cobble and gravel substrates, as well as the presence of instream woody material. Low to high habitat complexity was identified for Uens and Stub Creek (Figure 51).
Figure 51 Habitat complexity along Uens and Stub Creek
3.3.3 Instream Substrate
Diverse substrate is important for fish and benthic invertebrate habitat because some species have specific substrate requirements and for example will only reproduce on certain types of substrate. The absence of diverse substrate types may limit the overall diversity of species within a stream. Figure 52 shows the dominant substrate type observed for each section surveyed along Uens and Stub Creek.
Figure 52 shows the dominant substrate type along Uens and Stub Creek
Figure 53 shows the overall presence of various substrate types observed along Uens Creek. Substrate conditions were highly diverse along Uens Creek with all substrate types being recorded at various locations along the creek. Silt was the dominant substrate recorded in 96% of survey sections.
Figure 53 Instream substrate along Uens Creek
Figure 54 shows the overall presence of various substrate types observed along Stub Creek. Substrate conditions were somewhat diverse along Stub Creek with all substrate types being recorded at various locations along the creek. Silt and clay substrates were dominant along Stub Creek.
Figure 54 Instream substrate along Stub Creek
3.3.4 Instream Morphology
Pools and riffles are important habitat features for aquatic life. Riffles are fast flowing areas characterized by agitation and overturn of the water surface. Riffles thereby play a crucial role in contributing to dissolved oxygen conditions and directly support spawning for some fish species. They are also areas that support high benthic invertebrate populations which are an important food source for many aquatic species. Pools are characterized by minimal flows, with relatively deep water and winter/summer refuge habitat for aquatic species. Runs are moderately shallow, with unagitated surfaces of water and areas where the thalweg (deepest part of the channel) is in the center of the channel. Figure 55 shows where riffle habitat occurs along Uens and Stub Creek.
Figure 55 Instream riffle habitat locations along Uens and Stub Creek
Figure 56 shows that Uens Creek has highly variable instream morphology: 64 percent of sections recorded runs, 52 percent pools and 16 percent riffles. Figure 57 shows that Uens Creek has a somewhat variable instream morphology: 95 percent of sections recorded pools, 27 percent runs and 23 percent riffles.
Figure 56 Instream morphology along Uens Creek
Figure 57 Instream morphology along Stub Creek
3.3.5 Vegetation Type
Instream vegetation provides a variety of functions and is a critical component of the aquatic ecosystem. Aquatic plants promote stream health by:
Providing direct riparian/instream habitat
Stabilizing flows reducing shoreline erosion
Contributing to dissolved oxygen through photosynthesis
Maintaining temperature conditions through shading
For example emergent plants along the shoreline can provide shoreline protection from wave action and important rearing habitat for species of waterfowl. Submerged plants provide habitat for fish to find shelter from predator fish while they feed. Floating plants such as water lilies shade the water and can keep temperatures cool while reducing algae growth. Figure 58 shows the dominant vegetation type observed for each section surveyed along Uens and Stub Creek.
Figure 58 Dominant vegetation type along Uens and Stub Creek
The plant community structure was extremely diverse along Uens Creek. Narrow leafed emergents were observed in 96 percent of sections, algae was observed in 76 percent of survey sections, submerged plants were present in 68 percent of the survey sections, 44 percent for floating plants, 12 percent free floating plants, 60 percent broad leaved emergents and robust emergents were observed in 44 percent of sections surveyed. Figure 59 depicts the plant community structure for Uens Creek.
Figure 59 Vegetation type observations along Uens Creek
The plant community structure was fairly diverse along Stub Creek. Narrow leafed emergents were observed in 100 percent of sections, 73 percent for floating plants, submerged plants were present in 64 percent of the survey sections, algae was observed in 55 percent of survey sections, 50 percent free floating plants and 45 percent broad leaved emergents. Figure 60 depicts the plant community structure for Stub Creek.
Figure 60 Vegetation type observations along Stub Creek
3.3.6 Instream Vegetation Abundance
Instream vegetation is an important factor for a healthy stream ecosystem. Vegetation helps to remove contaminants from the water, contributes oxygen to the stream, and provides habitat for fish and wildlife. Too much vegetation can also be detrimental. Figure 61 demonstrates that Uens Creek reach had normal to common levels of vegetation recorded at 36 and 44 percent of stream surveys. Extensive levels of vegetation were observed in 64 percent of the surveyed sections, while 20 percent of sections had areas with no vegetation.
Figure 61 Instream vegetation abundance along Uens Creek
Figure 62 demonstrates that Stub Creek reach had normal to common levels of vegetation recorded at only 14 and 9 percent of stream surveys. Low levels of vegetation were observed in 23 percent of survey sections. Extensive levels of vegetation were observed in 64 percent of the surveyed sections, while 9 percent of sections had areas with no vegetation.
Figure 62 Instream vegetation abundance along Stub Creek
3.3.7 Invasive Species
Invasive species can have major implications on streams and species diversity. Invasive species are one of the largest threats to ecosystems throughout Ontario and can out compete native species, having negative effects on local wildlife, fish and plant populations. Sixty percent of the sections surveyed along Uens Creek had invasive species. The invasive species observed in Uens Creek were European frogbit, purple loosestrife, banded mystery snail, common/glossy buckthorn and Manitoba maple. Sixty four percent of the sections surveyed along Stub Creek had invasive species. The invasive species observed in Stubs Creek was European frogbit. This invasive aquatic plant dominated areas where extensive vegetation conditions were observed along Stub Creek. Invasive species abundance (i.e. the number of observed invasive species per section) was assessed to determine the potential range/vector of many of these species (Figure 63).
Figure 63 Invasive species abundance along Uens and Stub Creek
3.3.8 Water Chemistry
During the stream characterization survey, a YSI probe is used to collect water chemistry information. Dissolved oxygen (DO), specific conductivity (SPC) and pH are measured at the start and end of each section.
3.3.8.1 Dissolved Oxygen
Dissolved oxygen is a measure of the amount of oxygen dissolved in water. The Canadian Environmental Quality Guidelines of the Canadian Council of Ministers of the Environment (CCME) suggest that for the protection of aquatic life the lowest acceptable dissolved oxygen concentration should be 6 mg/L for warmwater biota and 9.5 mg/L for coldwater biota (CCME, 1999).
The average dissolved oxygen level observed within Uens Creek was 5.2mg/L which is below the recommended level for warmwater biota (Figure 64). The lower and middle reaches of Uens Creek were within the threshold to support warmwater biota. The upper reaches fell below the recommended threshold to support warmwater aquatic biota.
Figure 64 Dissolved oxygen ranges along Uens Creek
The average dissolved oxygen level observed within Stub Creek was 5.5mg/L which is below the recommended level for warmwater biota (Figure 65). The lower and upper reaches of Stub Creek were within the threshold to support warmwater biota. The middle reaches fell below the recommended threshold to support warmwater aquatic biota.
Figure 65 Dissolved oxygen ranges along Stub Creek
3.3.8.2 Conductivity
Conductivity in streams is primarily influenced by the geology of the surrounding environment, but can vary drastically as a function of surface water runoff. Currently there are no CCME guideline standards for stream conductivity; however readings which are outside the normal range observed within the system are often an indication of unmitigated discharge and/or stormwater input.
The average conductivity observed within the main stem of Uens Creek was 297.1 µs/cm. Figure 66 shows the conductivity readings for Uens Creek.
Figure 66 Specific conductivity ranges along Uens Creek
The average conductivity observed within the main stem of Stub Creek was 153.6µs/cm. Figure 67 shows the conductivity readings for Stub Creek.
Figure 67 Specific conductivity ranges along Stub Creek
3.3.8.3 pH
Based on the PWQO for pH, a range of 6.5 to 8.5 should be maintained for the protection of aquatic life. Average pH values along Uens Creek averaged 7.22 thereby meeting the provincial standard (Figure 68).
Figure 68 pH ranges along Uens Creek
Average pH values along Stub Creek averaged 7.01 thereby meeting the provincial standard (Figure 69).
Figure 69 pH ranges along Stub Creek
3.3.8.4 Oxygen Saturation (%)
Oxygen saturation is measured as the ratio of dissolved oxygen relative to the maximum amount of oxygen that will dissolve based on the temperature and atmospheric pressure. Well oxygenated water will stabilize at or above 100% saturation, however the presence of decaying matter/pollutants can drastically reduce these levels. Oxygen input through photosynthesis has the potential to increase saturation above 100% to a maximum of 500%, depending on the productivity level of the environment. In order to represent the relationship between concentration and saturation, the measured values have been summarized into 6 classes:
Dissolved oxygen conditions on Uens Creek were somewhat variable along the system (Figure 70). Sections in the lower reach fell below the guideline to support warmwater biota, however sections in the middle reach were acceptable for warm/cool water species. Stub Creek had mixed results with areas that ranged from meeting the guideline to support warmwater biota and areas that fell below the guideline to support warmwater biota.
Figure 70 A bivariate assessment of dissolved oxygen concentration (mg/L) and saturation (%) in Uens and Stub Creek
3.3.8.5 Specific Conductivity Assessment
Specific conductivity (SPC) is a standardized measure of electrical conductance, collected at or corrected to a water temperature of 25⁰C. SPC is directly related to the concentration of ions in water, and is commonly influenced by the presence of dissolved salts, alkalis, chlorides, sulfides and carbonate compounds. The higher the concentration of these compounds, the higher the conductivity. Common sources of elevated conductivity include storm water, agricultural inputs and commercial/industrial effluents.
In order to summarize the conditions observed, SPC levels were evaluated as either normal, moderately elevated or highly elevated. These categories correspond directly to the degree of variation (i.e. standard deviation) at each site relative to the average across the system.
Normal levels were maintained along the majority of both creeks; however there were several areas with moderate levels of conductivity and one area on Stub Creek with high levels of conductivity observed (Figure 71).
Figure 71 Relative specific conductivity levels along Uens and Stub Creek
3.3.9 Thermal Regime
Many factors can influence fluctuations in stream temperature, including springs, tributaries, precipitation runoff, discharge pipes and stream shading from riparian vegetation. Water temperature is used along with the maximum air temperature (using the Stoneman and Jones method) to classify a watercourse as either warm water, cool water or cold water. Figure 72 shows where the thermal sampling sites were located on Uens and Stub Creek.
Figure 72 Temperature logger locations along Uens and Stub Creek
Each point on the two following graphs represents a temperature that meets the following criteria:1) Sampling dates are between July 1st and September 7th 2) Sampling date is preceded by two consecutive days above 24.5 °C, with no rain 3) Water temperatures are collected at 4pm and 4) Air temperature is recorded as the max temperature for that day.
Analysis of the data collected indicates that Uens Creek is classified as a warm water system with cool water reaches (Figure 73).
Figure 73 Temperature logger data for the sites on Uens Creek
Analysis of the data collected indicates that Stub Creek is classified as a cool water system with cool to warm water reaches (Figure 74).
Figure 74 Temperature logger data for the sites on Stub Creek
3.3.10 Groundwater
Groundwater discharge areas can influence stream temperature, contribute nutrients, and provide important stream habitat for fish and other biota. During stream surveys, indicators of groundwater discharge are noted when observed. Indicators include: springs/seeps, watercress, iron staining, significant temperature change and rainbow mineral film. Figure 75 shows areas where one or more of the above groundwater indicators were observed during stream surveys and headwater assessments.
Figure 75 Groundwater indicators observed in the Long Lake catchment
3.3.11 Fish Community
The Long Creek catchment is classified as a mixed community of warm and cool water recreational and baitfish fishery with 19 species observed (Table 19). Figure 76 shows where the listed species were observed in the watershed in 2016 and historically.
Table 19 Fish species observed in the Long Lake catchment
Fish Species
Scientific Name
Fish code
Historical
2016
blacknose shiner
Notropis heterolepis
BnShi
X
X
bluegill
Lepomis macrochirus
Blueg
X
bluntnose minnow
Pimephales notatus
BnMin
X
brassy minnow
Hybognathus hankinsoni
BrMin
X
X
brook stickleback
Culaea inconstans
BrSti
X
X
brown bullhead
Ameiurus nebulosus
BrBul
X
X
bullhead catfishes
Ameiurus sp.
CATFI
X
carps and minnows
Cyprinidae
CA_MI
X
central mudminnow
Umbra limi
CeMud
X
X
creek chub
Semotilus atromaculatus
CrChu
X
X
etheostoma sp.
etheostoma sp.
EthSp
X
fathead minnow
Pimephales promelas
FhMin
X
X
finescale dace
Phoxinus neogaeus
FsDac
X
X
golden shiner
Notemigonus crysoleucas
GoShi
X
X
iowa darter
Etheostoma exile
IoDar
X
X
largemouth bass
Micropterus salmoides
LmBas
X
northern pike
Esox lucius
NoPik
X
northern redbelly dace
Chrosomus eos
NRDac
X
X
pumpkinseed
Lepomis gibbosus
Pumpk
X
X
sunfish family
Lepomis sp.
LepSp
X
walleye
Sander vitreus
Walle
X
yellow perch
Perca flavescens
YePer
X
X
TOTAL Species
19
16
Figure 76 Fish community sampling observations in the Long Lake Catchment
3.3.12 Migratory Obstructions
It is important to know locations of migratory obstructions because these can prevent fish from accessing important spawning and rearing habitat. Migratory obstructions can be natural or manmade, and they can be permanent or seasonal. Figure 77 shows the migration barriers in the Long Lake catchment at the time of the survey in 2016. There were seven perched/blocked culverts, five wood debris dams and two natural grade barriers within the catchment.
Figure 77 Migratory obstructions in the Long Lake catchment
3.3.13 Beaver Dam Locations
Overall beaver dams create natural changes in the environment. Some of the benefits include providing habitat for wildlife, flood control and silt retention. Additional benefits come from bacterial decomposition of wood material used in the dams which removes excess nutrient and toxins. Beaver dams can also result in flooding of agricultural lands and may be potential barriers to fish migration. Several beaver dams were identified in the Long Lake catchment area in 2016 (Figure 78).
Figure 78 Beaver dam type and locations in the Long Lake catchment
3.4 Long Lake Catchment Headwater Drainage Feature Assessment
3.4.1 Headwaters Sampling Locations
The RVCA Stream Characterization program assessed Headwater Drainage Features for the Long Lake catchment in 2016. This protocol measures zero, first and second order headwater drainage features (HDF). It is a rapid assessment method characterizing the amount of water, sediment transport, and storage capacity within headwater drainage features (HDF). RVCA is working with other Conservation Authorities and the Ministry of Natural Resources and Forestry to implement the protocol with the goal of providing standard datasets to support science development and monitoring of headwater drainage features. An HDF is a depression in the land that conveys surface flow. Additionally, this module provides a means of characterizing the connectivity, form and unique features associated with each HDF (OSAP Protocol, 2013). In 2016 the program sampled 33 sites at road crossings in the Long Lake catchment area (Figure 79).
Figure 79 Location of the headwater sampling site in the Long Lake catchment
A spring photo of the headwater sample site in the Long Lake catchment located on Long Lake Road
A summer photo of the headwater sample site in the Long Lake catchment located on Long Lake Road
3.4.2 Headwater Feature Type
The headwater sampling protocol assesses the feature type in order to understand the function of each feature. The evaluation includes the following classifications: defined natural channel, channelized or constrained, multi-thread, no defined feature, tiled, wetland, swale, roadside ditch and pond outlet. By assessing the values associated with the headwater drainage features in the catchment area we can understand the ecosystem services that they provide to the watershed in the form of hydrology, sediment transport, and aquatic and terrestrial functions. The headwater drainage features in the Long Lake catchment are predominantly dominated by natural and wetland features. Figure 80 shows the feature type of the primary feature at the sampling locations.
Figure 80 Headwater feature types in the Long Lake catchment
3.4.3 Headwater Feature Flow
The observed flow condition within headwater drainage features can be highly variable depending on timing relative to the spring freshet, recent rainfall, soil moisture, etc. Flow conditions are assessed in the spring and in the summer to determine if features are perennial and flow year round, if they are intermittent and dry up during the summer months or if they are ephemeral systems that do not flow regularly and generally respond to specific rainstorm events or snowmelt. Flow conditions in headwater systems can change from year to year depending on local precipitation patterns. Figure 81 shows the observed flow condition at the sampling locations in the Long Lake catchment in 2016.
Figure 81 Headwater feature flow conditions in the Long Lake catchment
A spring photo of the headwater sample site in the Long Lake catchment located on McLean Road
A summer photo of the headwater sample site in the Long Lake catchment located on McLean Road
3.4.4 Feature Channel Modifications
Channel modifications were assessed at each headwater drainage feature sampling location. Modifications include channelization, dredging, hardening and realignments. The Long Lake catchment area had a majority of features with no channel modifications with the exception of three sites having mixed modifications and two having been historically dredged or straightened. Figure 82 shows the channel modifications observed at the sampling locations for the Long Lake catchment.
Figure 82 Headwater feature channel modifications in the Long Lake catchment
3.4.5 Headwater Feature Vegetation
Headwater feature vegetation evaluates the type of vegetation that is found within the drainage feature. The type of vegetated within the channel influences the aquatic and terrestrial ecosystem values that the feature provides. For some types of headwater features the vegetation within the feature plays a very important role in flow and sediment movement and provides wildlife habitat. The following classifications are evaluated no vegetation, lawn, wetland, meadow, scrubland and forest. Figure 83 depicts the dominant vegetation observed at the sampled headwater sites in the Long Lake catchment.
Figure 83 Headwater feature vegetation types in the Long Lake catchment
3.4.6 Headwater Feature Riparian Vegetation
Headwater riparian vegetation evaluates the type of vegetation that is found along the adjacent lands of a headwater drainage feature. The type of vegetation within the riparian corridor influences the aquatic and terrestrial ecosystem values that the feature provides to the watershed. Figure 84 depicts the type of riparian vegetation observed at the sampled headwater sites in the Long Lake catchment. The majority of the headwater drainage features are classified as having natural riparian vegetation with only six features having altered vegetation.
Figure 84 Headwater feature riparian vegetation types in the Long Lake catchment
3.4.7 Headwater Feature Sediment Deposition
Assessing the amount of recent sediment deposited in a channel provides an index of the degree to which the feature could be transporting sediment to downstream reaches (OSAP, 2013). Evidence of excessive sediment deposition might indicate the requirement to follow up with more detailed targeted assessments upstream of the site location to identify potential best management practices to be implemented. Sediment deposition ranged from none to substantial for the headwater sites sampled in the Long Lake catchment area. Figure 85 depicts the degree of sediment deposition observed at the sampled headwater sites in the Long Lake catchment. Sediment deposition conditions ranged from no sediment deposition to extensive.
Figure 85 Headwater feature sediment deposition in the Long Lake catchment
3.4.8 Headwater Feature Upstream Roughness
Feature roughness will provide a measure of the amount of materials within the bankfull channel that could slow down the velocity of water flowing within the headwater feature (OSAP, 2013). Materials on the channel bottom that provide roughness include vegetation, wood structure and boulders/cobble substrates. Roughness can provide benefits in mitigating downstream erosion on the headwater drainage feature and the receiving watercourse by reducing velocities. Roughness also provides important habitat conditions for aquatic organisms. Figure 86 shows that the feature roughness conditions at the sampling locations in the Long Lake catchment were highly variable ranging from minimal to extreme.
Figure 86 Headwater feature roughness in the Long Lake catchment
Land cover and any change in coverage that has occurred over a six year period is summarized for the Long Lake catchment using spatially continuous vector data representing the catchment during the spring of 2008 and 2014. This dataset was developed by the RVCA through heads-up digitization of 20cm DRAPE ortho-imagery at a 1:4000 scale and details the surrounding landscape using 10 land cover classes.
4.1 Long Lake Catchment Land Cover/Change
As shown in Table 20 and Figure 1, the dominant land cover type in 2014 is woodland.
Table 20 Land cover in the Long Lake catchment (2008 vs. 2014)
Land Cover
2008
2014
Change - 2008 to 2014
Area
Area
Area
Ha
Percent
Ha
Percent
Ha
Percent
Woodland*
5208
61
5206
61
-2
Wetland **
1822
21
1822
21
>Unevaluated
(1822)
(21)
(1822)
(21)
(0)
(0)
Water
510
6
510
6
Crop and Pasture
491
6
491
6
Meadow-Thicket
227
3
227
3
Transportation
173
2
173
2
Settlement
126
1
128
1
2
* Does not include treed swamps ** Includes treed swamps
From 2008 to 2014, there was an overall change of three hectares (from one land cover class to another). Most of the change in the Long Lake catchment is a result of the conversion of woodland to settlement (Figure 87).
Figure 87 Land cover change in the Long Lake catchment (2008 to 2014)
Table 21 provides a detailed breakdown of all land cover change that has taken place in the Long Lake catchment between 2008 and 2014.
Table 21 Land cover change in the Long Lake catchment (2008 to 2014)
Land Cover
Change - 2008 to 2014
Area
Ha.
Percent
Woodland to Settlement
2.2
79.7
Crop and Pasture to Woodland
0.3
10.4
Wooded Area to Unevaluated Wetland
0.3
9.8
4.2 Woodland Cover
In the Environment Canada Guideline (Third Edition) entitled “How Much Habitat Is Enough?” (hereafter referred to as the “Guideline”) the opening narrative under the Forest Habitat Guidelines section states that prior to European settlement, forest was the predominant habitat in the Mixedwood Plains ecozone. The remnants of this once vast forest now exist in a fragmented state in many areas (including the Rideau Valley watershed) with woodland patches of various sizes distributed across the settled landscape along with higher levels of forest cover associated with features such as the Frontenac Axis (within the on-Shield areas of the Rideau Lakes and Tay River subwatersheds). The forest legacy, in terms of the many types of wildlife species found, overall species richness, ecological functions provided and ecosystem complexity is still evident in the patches and regional forest matrices (found in the Tay River subwatershed and elsewhere in the Rideau Valley watershed). These ecological features are in addition to other influences which forests have on water quality and stream hydrology including reducing soil erosion, producing oxygen, storing carbon along with many other ecological services that are essential not only for wildlife but for human well-being.
The Guideline also notes that forests provide a great many habitat niches that are in turn occupied by a great diversity of plant and animal species. They provide food, water and shelter for these species - whether they are breeding and resident locally or using forest cover to help them move across the landscape. This diversity of species includes many that are considered to be species at risk. Furthermore, from a wildlife perspective, there is increasing evidence that the total forest cover in a given area is a major predictor of the persistence and size of bird populations, and it is possible or perhaps likely that this pattern extends to other flora and fauna groups. The overall effect of a decrease in forest cover on birds in fragmented landscapes is that certain species disappear and many of the remaining ones become rare, or fail to reproduce, while species adapted to more open and successional habitats, as well as those that are more tolerant to human-induced disturbances in general, are able to persist and in some cases thrive. Species with specialized-habitat requirements are most likely to be adversely affected. The overall pattern of distribution of forest cover, the shape, area and juxtaposition of remaining forest patches and the quality of forest cover also play major roles in determining how valuable forests will be to wildlife and people alike.
The current science generally supports minimum forest habitat requirements between 30 and 50 percent, with some limited evidence that the upper limit may be even higher, depending on the organism/species phenomenon under investigation or land-use/resource management planning regime being considered/used.
As shown in Figure 88, 61 percent of the Long Lake catchment contains 5206 hectares of upland forest and 47 hectares of lowland forest (treed swamps) versus the 47 percent of woodland cover in the Tay River subwatershed. This is greater than the 30 percent of forest cover that is identified as the minimum threshold required to sustain forest birds according to the Guideline and which may only support less than one half of potential species richness and marginally healthy aquatic systems. When forest cover drops below 30 percent, forest birds tend to disappear as breeders across the landscape.
Figure 88 Woodland cover and forest interior in the Long Lake catchment (2014)
4.2.1 Woodland (Patch) Size
According to the Ministry of Natural Resources’ Natural Heritage Reference Manual (Second Edition), larger woodlands are more likely to contain a greater diversity of plant and animal species and communities than smaller woodlands and have a greater relative importance for mobile animal species such as forest birds.
Bigger forests often provide a different type of habitat. Many forest birds breed far more successfully in larger forests than they do in smaller woodlots and some rely heavily on forest interior conditions. Populations are often healthier in regions with more forest cover and where forest fragments are grouped closely together or connected by corridors of natural habitat. Small forests support small numbers of wildlife. Some species are “area-sensitive” and tend not to inhabit small woodlands, regardless of forest interior conditions. Fragmented habitat also isolates local populations, especially small mammals, amphibians and reptiles with limited mobility. This reduces the healthy mixing of genetic traits that helps populations survive over the long run (Conserving the Forest Interior. Ontario Extension Notes, 2000).
The Environment Canada Guideline also notes that for forest plants that do not disperse broadly or quickly, preservation of some relatively undisturbed large forest patches is needed to sustain them because of their restricted dispersal abilities and specialized habitat requirements and to ensure continued seed or propagation sources for restored or regenerating areas nearby.
The Natural Heritage Reference Manual continues by stating that a larger size also allows woodlands to support more resilient nutrient cycles and food webs and to be big enough to permit different and important successional stages to co-exist. Small, isolated woodlands are more susceptible to the effects of blowdown, drought, disease, insect infestations, and invasions by predators and non-indigenous plants. It is also known that the viability of woodland wildlife depends not only on the characteristics of the woodland in which they reside, but also on the characteristics of the surrounding landscape where the woodland is situated. Additionally, the percentage of forest cover in the surrounding landscape, the presence of ecological barriers such as roads, the ability of various species to cross the matrix surrounding the woodland and the proximity of adjacent habitats interact with woodland size in influencing the species assemblage within a woodland.
In the Long Lake catchment (in 2014), one hundred and twenty-five (50 percent) of the 248 woodland patches are very small, being less than one hectare in size. Another 93 (38 percent) of the woodland patches ranging from one to less than 20 hectares in size tend to be dominated by edge-tolerant bird species. The remaining 30 (12 percent of) woodland patches range between 20 and 1677 hectares in size. Seventeen of these patches contain woodland between 20 and 100 hectares and may support a few area-sensitive species and some edge intolerant species, but will be dominated by edge tolerant species.
Conversely, thirteen (five percent) of the 248 woodland patches in the drainage area exceed the 100 plus hectare size needed to support most forest dependent, area sensitive birds and are large enough to support approximately 60 percent of edge-intolerant species. Five patches top 200 hectares, which according to the Environment Canada Guideline will support 80 percent of edge-intolerant forest bird species (including most area sensitive species) that prefer interior forest habitat conditions.
Table 22 presents a comparison of woodland patch size in 2008 and 2014 along with any changes that have occurred over that time. A decrease (of three hectares) has been observed in the overall woodland patch area between the two reporting periods.
Table 22 Woodland patches in the Long Lake catchment (2008 and 2014)
Woodland Patch Size Range (ha)
Woodland* Patches
Patch Change
2008
2014
2008 to 2014
Number
Area
Number
Area
Number
Area
Count
Percent
Ha
Percent
Count
Percent
Ha
Percent
Count
Ha
Less than 1
127
51
49
1
125
50
48
1
-2
-1
1 to 20
92
37
342
6
93
38
342
6
1
20 to 50
10
4
296
6
10
4
295
6
-1
50 to 100
7
3
529
10
7
3
529
10
100 to 200
8
3
1190
23
8
3
1190
23
Greater than 200
5
2
2849
54
5
2
2848
54
-1
Totals
249
100
5255
100
248
100
5252
100
-1
-3
*Includes treed swamps
4.2.2 Woodland (Forest) Interior Habitat
The forest interior is habitat deep within woodlands. It is a sheltered, secluded environment away from the influence of forest edges and open habitats. Some people call it the “core” or the “heart” of a woodland. The presence of forest interior is a good sign of woodland health, and is directly related to the woodland’s size and shape. Large woodlands with round or square outlines have the greatest amount of forest interior. Small, narrow woodlands may have no forest interior conditions at all. Forest interior habitat is a remnant natural environment, reminiscent of the extensive, continuous forests of the past. This increasingly rare forest habitat is now a refuge for certain forest-dependent wildlife; they simply must have it to survive and thrive in a fragmented forest landscape (Conserving the Forest Interior. Ontario Extension Notes, 2000).
The Natural Heritage Reference Manual states that woodland interior habitat is usually defined as habitat more than 100 metres from the edge of the woodland and provides for relative seclusion from outside influences along with a moister, more sheltered and productive forest habitat for certain area sensitive species. Woodlands with interior habitat have centres that are more clearly buffered against the edge effects of agricultural activities or more harmful urban activities than those without.
In the Long Lake catchment (in 2014), the 273 woodland patches contain 37 forest interior patches (Figure 47) that occupy 11 percent (908 ha.) of the catchment land area (which is greater than the five percent of interior forest in the Tay River subwatershed). This is greater than the ten percent figure referred to in the Environment Canada Guideline that is considered to be the minimum threshold for supporting edge intolerant bird species and other forest dwelling species in the landscape.
Most patches (21) have less than 10 hectares of interior forest, nine of which have small areas of interior forest habitat less than one hectare in size. The remaining 16 patches contain interior forest between 12 and 258 hectares in area. Between 2008 and 2014, a small loss of two hectares of interior forest was observed in the Long Lake catchment (Table 23).
Table 23 Woodland interior in the Long Lake catchment (2008 and 2014)
Woodland Interior Habitat Size Range (ha)
Woodland Interior
Interior Change
2008
2014
2008 to 2014
Number
Area
Number
Area
Number
Area
Count
Percent
Ha
Percent
Count
Percent
Ha
Percent
Count
Ha
Less than 1
9
24
2
<1
9
24
2
<1
1 to 10
12
33
44
5
12
32
43
5
-1
10 to 30
8
22
163
18
8
22
162
18
-1
30 to 50
4
11
149
16
4
10
149
16
50 to 100
2
5
123
14
2
6
123
14
Greater than 100
2
5
429
47
2
6
429
47
Totals
37
100
910
100
37
100
908
100
-2
4.3 Wetland Cover
Wetlands are habitats forming the interface between aquatic and terrestrial systems. They are among the most productive and biologically diverse habitats on the planet. By the 1980s, according to the Natural Heritage Reference Manual, 68 percent of the original wetlands south of the Precambrian Shield in Ontario had been lost through encroachment, land clearance, drainage and filling.
Wetlands perform a number of important ecological and hydrological functions and provide an array of social and economic benefits that society values. Maintaining wetland cover in a watershed provides many ecological, economic, hydrological and social benefits that are listed in the Reference Manual and which may include:
contributing to the stabilization of shorelines and to the reduction of erosion damage through the mitigation of water flow and soil binding by plant roots
mitigating surface water flow by storing water during periods of peak flow (such as spring snowmelt and heavy rainfall events) and releasing water during periods of low flow (this mitigation of water flow also contributes to a reduction of flood damage)
contributing to an improved water quality through the trapping of sediments, the removal and/or retention of excess nutrients, the immobilization and/or degradation of contaminants and the removal of bacteria
providing renewable harvesting of timber, fuel wood, fish, wildlife and wild rice
contributing to a stable, long-term water supply in areas of groundwater recharge and discharge
providing a high diversity of habitats that support a wide variety of plants and animals
acting as “carbon sinks” making a significant contribution to carbon storage
providing opportunities for recreation, education, research and tourism
Historically, the overall wetland coverage within the Great Lakes basin exceeded 10 percent, but there was significant variability among watersheds and jurisdictions, as stated in the Environment Canada Guideline. In the Rideau Valley Watershed, it has been estimated that pre-settlement wetland cover averaged 35 percent using information provided by Ducks Unlimited Canada (2010) versus the 21 percent of wetland cover existing in 2014 derived from DRAPE imagery analysis.
Figure 89 Wetland cover in the Long Lake catchment (2014)
Reliable, pre-settlement wetland cover data is unavailable for the Long Lake catchment; however, data for the years 2008 and 2014 is available and shows that wetland cover remains unchanged at 21 percent in 2014 (as indicated in Table 24 and shown in Figure 89). To maintain critical hydrological, ecological functions along with related recreational and economic benefits provided by these wetland habitats in the catchment, a “no net loss” of currently existing wetlands should be employed to ensure the continued provision of tangible benefits accruing from them to landowners and surrounding communities.
Table 24 Wetland cover in the Long Lake catchment (2014)
Wetland Cover
Pre-settlement
2008
2014
Change - Historic to 2014
Area
Area
Area
Area
Ha
Percent
Ha
Percent
Ha
Percent
Ha
Percent
Long Lake
n/a
n/a
1822
21
1822
21
n/a
n/a
Tay River
n/a
n/a
15280
19
15330
19
n/a
n/a
Rideau Valley
134115
35
n/a
n/a
82076
21
-52039
-39
4.4 Shoreline Cover
The riparian or shoreline zone is that special area where the land meets the water. Well-vegetated shorelines are critically important in protecting water quality and creating healthy aquatic habitats, lakes and rivers. Natural shorelines intercept sediments and contaminants that could impact water quality conditions and harm fish habitat in streams. Well established buffers protect the banks against erosion, improve habitat for fish by shading and cooling the water and provide protection for birds and other wildlife that feed and rear young near water. A recommended target (from the Environment Canada Guideline) is to maintain a minimum 30 metre wide vegetated buffer along at least 75 percent of the length of both sides of rivers, creeks and streams.
Figure 90 shows the extent of the ‘Natural’ vegetated riparian zone (predominantly wetland/woodland features) and ‘Other’ anthropogenic cover (crop/pastureland, roads/railways, settlements) along a 30-metre-wide area of land around Carnahan and Long Lake, other lakes and along both sides of the shoreline of Stag, Stub and Uens Creek and the many unnamed watercourses (including headwater streams) found in the Long Lake catchment.
Figure 90 Natural and other riparian land cover in the Long Lake catchment (2014)
This analysis shows that the Long Lake catchment riparian buffer is composed of wetland (46 percent), woodland (42 percent), crop and pastureland (six percent), transportation routes (two percent), settlement (two percent) and meadow-thicket (two percent). Along the many watercourses (including Stag, Stub and Uens along with headwater streams) flowing into Long and Carnahan Lake, the riparian buffer is composed of wetland (52 percent), woodland (37 percent), crop and pastureland (seven percent), transportation routes (two percent), meadow-thicket (one percent) and settlement areas (one percent).
Around Long Lake itself, the shoreline buffer is dominated by woodland (56 percent) and cottages, houses and camps (23 percent) with the remainder comprised of wetland (12 percent), roads (six percent) and crop and pastureland (three percent). The shoreline buffer around CarnahanLake is dominated by woodland (95 percent) with the remainder comprised of cottages and houses (two percent), wetland (two percent) and roads (less than one percent).
Additional statistics for the Long Lake catchment are presented in Tables 25 to 28 and show that there has been little to no change in shoreline cover from 2008 to 2014.
Table 25 Riparian land cover in the Long Lake catchment (2008 vs. 2014)
Riparian Land Cover
2008
2014
Change - 2008 to 2014
Area
Area
Area
Ha.
Percent
Ha.
Percent
Ha.
Percent
Wetland
516.12
46.00
516.28
46.01
0.16
0.01
> Unevaluated
(516.12)
(46.00)
(516.28)
(46.01)
(0.16)
(0.01)
Woodland
472.87
42.15
472.49
42.11
-0.38
-0.04
Crop & Pasture
69.38
6.18
69.38
6.18
0.00
0.00
Transportation
23.45
2.09
23.45
2.09
0.00
0.00
Settlement
22.43
2.00
22.64
2.02
0.21
0.02
Meadow-Thicket
17.75
1.58
17.75
1.58
0.00
0.00
Table 26 Riparian land cover around Long Lake (2008 vs. 2014)
Riparian Land Cover
2008.00
2014.00
Change - 2008 to 2014
Area
Area
Area
Ha.
Percent
Ha.
Percent
Ha.
Percent
Woodland
34.22
56.35
34.22
56.35
0.00
0.00
Settlement
13.82
22.77
13.82
22.77
0.00
0.00
Wetland
7.43
12.24
7.43
12.24
0.00
0.00
> Unevaluated
7.43
12.24
7.43
12.24
0.00
0.00
Transportation
3.58
5.89
3.58
5.89
0.00
0.00
Crop and Pasture
1.65
2.71
1.65
2.71
0.00
0.00
Meadow-Thicket
0.02
0.03
0.02
0.03
0.00
0.00
Table 27 Riparian land cover around Carnahan Lake (2008 vs. 2014)
Riparian Land Cover
2008
2014
Change - 2008 to 2014
Area
Area
Area
Ha.
Percent
Ha.
Percent
Ha.
Percent
Woodland
21.43
95.41
21.33
94.96
-0.10
-0.45
Wetland
0.47
2.10
0.47
2.10
0.00
0.00
> Unevaluated
(0.47)
(2.10)
(0.47)
(2.10)
(0.00)
(0.00)
Settlement
0.45
1.99
0.55
2.45
0.10
0.46
Transportation
0.11
0.49
0.11
0.49
0.00
0.00
Table 28 Riparian land cover along streams in the Long Lake catchment (2008 vs. 2014)
5.0 Long Lake Catchment: Stewardship and Water Resources Protection
The RVCA and its partners are working to protect and enhance environmental conditions in the Tay River Watershed. Figure 91 shows the location of all stewardship projects completed in the Long Lake catchment.
Figure 91 Stewardship site locations in the Long Lake catchment
5.1 Rural Clean Water
The Rural Clean Water Program provides technical and financial assistance to farmers and other rural landowners, to aid in the implementation of projects that protect water quality. Funding is granted to those projects that support best management practices for application in the protection and improvement of surface and ground water resources. The program also supports climate change adaptation and low impact development projects as well as educating rural landowners about environmental stewardship of private property. Examples of supported projects include livestock exclusion fencing, controlled tile drainage, cover crops, erosion control, well related projects, and many more. For a list of eligible projects and to apply for funding, see Rural Clean Water.
In the Long Lake catchment from 2011 to 2016, one well upgrade was completed at a total value of $1,437 with $500 of that amount funded through grant dollars from the RVCA.
5.2 Private Land Forestry
Forest cover and tree planting continues to be one of the most widely supported strategies to improve our environment. The many benefits of forest cover include carbon sequestration, flood mitigation and water quality improvement as well as providing wildlife habitat.
Through the RVCA's Trees for Tomorrow Program (and its predecessors), 3,000 trees were planted at one site resulting in the reforestation of two hectares. Total project value is $4,938 with $4,090 of that amount coming from fundraising sources. For more information about the Program and landowner eligibility, please see the following: Tree Planting in the Rideau Valley Watershed and Trees for Tomorrow.
5.3 Shoreline Naturalization
Natural shoreline buffers rich in native plants are critically important to protecting the health of our lakes, rivers and streams. Shoreline vegetation protects water quality and aquatic habitat by intercepting potentially harmful contaminants such as nutrients, pollutants and sediment, regulating water temperatures, slowing runoff and providing important fish and wildlife habitat. Natural shorelines also help improve climate change resiliency by increasing flood storage and providing protection from erosion during extreme weather events.
As of the end of 2016, no shoreline projects had been carried out in the Long Lake catchment. Landowners may wish to take advantage of the RVCA's Shoreline Naturalization Program to assist them with the naturalization of their shorelines to see the benefits noted above (and more).
5.4 Fish and Wetland Habitat
The Long Lake Property Owners' Association has completed four walleye spawning bed enhancement projects since 2011: three on Long Lake and one on Drew's Creek. A fifth project was also completed by the Ministry of Natural Resources Stewardship Rangers Program in 2001/2002. Two of the spawning bed projects were funded under the MNR Community Fisheries and Wildlife Improvement Program.
5.5 Valley, Stream, Wetland and Hazard Lands
The Long Lake catchment covers 85.6 square kilometres and contains 18 square kilometres of wetland along with 177.9 kilometres of stream. None of these natural features are subject to the regulation limit of Ontario Regulation 174/06 (Figure 92) for the protection of wetland areas and river or stream valleys that are affected by flooding and erosion hazards.
For areas where no regulation limit exists, protection of the catchment’s watercourses is provided through the “alteration to waterways” provision of the regulation.
Figure 92 Regulated natural features and hazards in the Long Lake catchment
5.6 Vulnerable Drinking Water Areas
Mississippi-Rideau Source Water Protection program has mapped two small areas in this catchment, to the Center and southwest, as a Significant Groundwater Recharge Areas and all of the catchment as a Highly Vulnerable Aquifer. This means that the nature of the overburden (thin soils, fractured bedrock) does not provide a high level of protection for the underlying groundwater making the aquifer more vulnerable to contaminants released on the surface. There are no Well-Head Protection Areas in the catchment.
The Mississippi-Rideau Source Protection Plan includes policies that focus on the protection of groundwater region-wide due to the fact that most of the region, which encompasses the Mississippi and Rideau watersheds, is considered Highly Vulnerable Aquifer. For detailed maps and policies that have been developed to protect drinking water sources, visit the Mississippi-Rideau Source Protection Region website.
Specific accomplishments noted by the Long Lake community to improve the lake ecosystem are indicated by an asterisk.
Long Lake and Catchment Health
Septic Inspections
The Long Lake Property Owners Association has been involved in joint submissions - with several other lake associations - made to the Township of Central Frontenac in support of a septic system re-inspection program and continues to support this initiative.*
Tree Planting
3000 trees have been planted at one site in the Long Lake catchment by the RVCA Private Land Forestry Program, resulting in the reforestation of two hectares.
Water Quality
Carnahan Lake and Long Lake are sampled yearly by the RVCA for five parameters, four times a year along with two stream sampling sites to assess surface chemistry water quality conditions: Stub and Uens Creeks are sampled yearly for 22 parameters, six times a year.
One Rural Clean Water Program project was completed by the RVCA Rural Clean Water Program.
Long Lake and Catchment Habitat
Fish Habitat Improvement
Five walleye fish habitat improvement projects have been completed on Long Lake: one in 2001/2002 and four since 2011. The Long Lake Property Owners' Association has carried out three of these walleye spawning bed enhancement projects on Long Lake and one other on Drew's Creek, which feeds into the lake. Prior to these projects being done by the LLPOA, the Ministry of Natural Resources Stewardship Rangers Program also completed a walleye spawning bed enhancement project on the lake. Two of three spawning bed projects completed by the LLPOA were funded under the MNR Community Fisheries and Wildlife Improvement Program.*
In-stream Habitat
2.2 kilometres of Stub Creek and 2.5 kilometres of Uens Creek have been surveyed along with 33 headwaters sites being sampled by the RVCA Stream Characterization Program.
Specific challenges and issues noted by the Long Lake community are indicated by an asterisk.
Development
Waterfront property development is occurring primarily through the transformation of traditional, seasonal cottages into larger year-round dwellings. This transition is taking place either through re-development of an existing cottage lot or incremental alterations (additions, sleeping cabins, gazebos, decks, sheds, boat houses, garages, lawns, shoreline modifications, docks), all of which may put additional stress on the sensitive shoreline zone and the lake along with potential, added septic system loading.
Many waterfront properties contain existing non-conforming dwellings with respect to minimum water frontage and lot area and are often located within 30 metres of the water that require minor variances for expansion and/or reconstruction of dwellings where standard development setbacks from water are difficult to achieve. In these cases, of which there are many, staff at the Township of Central Frontenac and the Conservation Authority often meet with resistance and push back when attempts are made to implement standards for development setbacks, vegetated shorelines and septic systems.
Monitoring implementation of conditions of planning and regulatory approvals is challenging due to a lack of resources.
Headwaters/In-water Habitat/Shorelines
Walleye spawning shoals on Long Lake are beginning to show an increase in slime-like aquatic growth which may, over-in time, affect walleye breeding success. Funding demise of MNR's Community Fisheries and Wildlife Improvement Program has put plans on hold for future Long Lake fish improvement projects to tackle this.*
Long Lake residents and the lake ecosystem benefit from over four miles of undeveloped shoreline. This situation could change if the current landowners were to sell their land for waterfront development.*
Long Lake has 68 percent of its shoreline composed of natural vegetation. This is below the 75 percent target that is recommended by experts for the protection of the catchment’s waterbodies and watercourses, 30 metres back from the shoreline of streams, rivers and lakes (see Section 4.4 of this report).
Seven of thirty-three sampled headwater sites in the catchment have been modified (four are channelized, two are swales and one is tiled)(see Section 3.4.2 of this report).
Littoral zone mapping identifying substrate type, vegetation and habitat features along with opportunities for shoreline enhancement is unavailable for Carnahan and Long Lakes.
Lake Planning
This report outlines some issues and concerns regarding the health of the Long Lake catchment. However, there is limited knowledge of the overall issues and concerns about natural resource management along with their use and the health of Carnahan Lake, Long Lake and its watershed.
The Carnahan Lake Association and the Long Lake Association might consider working together with their lake residents to undergo the lake planning process. The lake planning process allows for valuable information about the current health of the lake and its watershed, as well as an overview of all the issues and concerns facing the lake to be collected together. The lake planning process requires involvement and input from the whole lake community which includes lake residents, users, local government, non-governmental organizations, agency partners and other stakeholders. The process ensures that the lake community’s issues and concerns are gathered into one action-oriented document, which can guide the many stakeholders that care about the lake ecosystem to help tackle lake health concerns in partnership.
Land Cover
Land cover has changed across the catchment (2008 to 2014) as a result of an increase in the area of settlement (2 ha.) and loss of woodland (2 ha.)(see Section 4.1 of this report)
Woodlands cover 20 percent of the catchment. This is below the 30 percent of forest cover that is identified as the minimum threshold for sustaining forest birds and other woodland dependent species (see Section 4.2 of this report).
Wetlands cover 21 percent (1822 ha.) of the catchment (in 2014). One hundred percent (1822 ha.) of these wetlands remain unevaluated and unregulated and although they are not under imminent threat from development activity, they do remain vulnerable to drainage and land clearing activities in the absence of any regulatory and planning controls that would otherwise protect them for the many important hydrological, social, biological and ecological functions/services/values they provide to landowners and the surrounding community (see Section 4.3 of this report).
Water Quality
Carnahan Lake surface chemistry water quality rating ranges from Poor to Fair (see Section 2.1 of this report).
Long Lake surface chemistry water quality rating ranges from Fair to Good (see Section 2.2 of this report).
There is concern over the increase in slime-like aquatic growth on shoreline rocks and structures in Long Lake. The RVCA annual water quality reports in the last several years indicate that 25 percent of the samples taken have a higher concentration of nitrogen than the provincial recommended standard for recreational water quality, although the average of samples remains lower than this standard.*
Stub Creek surface chemistry water quality does not exhibit any sampling concerns (see Section 2.3 of this report).
Uens Creek surface chemistry water quality rating ranges from Poor to Fair (see Section 2.4 of this report).
Stag, Stubb and Uens Creeks instream biological water quality conditions are unavailable due to unsuitable benthic invertebrate sample locations.
No septic system re-inspection program (mandatory or voluntary) is in effect, currently.*
Specific opportunities noted by the Long Lake community to improve the lake ecosystem are indicated by an asterisk.
Long Lake and Catchment Health
Development
Work with approval authorities (Central Frontenac Township, Frontenac County, Kingston Frontenac Lennox and Addington Health Unit, Mississippi Rideau Septic System Office and RVCA) and waterfront property owners (including the Carnahan Lake Association and Long Lake Property Owners' Association) to consistently implement current land use planning and development policies for water quality and shoreline protection adjacent to Carnahan and Long Lake and headwater streams in the catchment (i.e., a minimum 30 metre development setback from water).
Explore ways and means to more effectively enforce and implement conditions of land-use planning and development approval to achieve net environmental gains (particularly with respect to rehabilitating or protecting naturally vegetated shorelines and water quality).
Encourage Committee of Adjustment to take advantage of technical and environmental information and recommendations forthcoming from planning and environmental professionals.
Municipalities in the Tay Watershed are encouraged to strengthen natural heritage and water resources official plan policies and zoning provisions (pertaining to water setbacks, frontage and naturalized shorelines and wetland protection) where deemed appropriate.
Work with Central Frontenac Township, Frontenac County and agencies to ensure that development approvals around lakes and along watercourses take into consideration the protection of fish habitat (including the near-shore nursery and spawning habitat).
Municipal and agency planners together with development proponents are to use the 2014 Site Evaluation Guidelines to inform decision-making about the application of development setbacks on lots with shallow soils/bedrock, steep slopes and sparse vegetation cover along with the use of the appropriate, development related, best management practices.
Utilize RVCA subwatershed and catchment reports to help develop/revise official plan policies to protect surface water resources and the natural environment (including woodlands, wetlands and shoreline cover).
Establish RVCA regulation limits around the 100 percent (1822 ha.) of wetlands in the catchment that are unevaluated. Doing this will help protect landowners from natural hazards including mitigating surface water flow by storing water during periods of peak flow (such as spring snowmelt and heavy rainfall events) and releasing water during periods of low flow (this mitigation of water flow reduces flood damage), as well as contributing to the stabilization of shorelines and to the reduction of soil erosion damage through water flow mitigation and plant soil binding/retention
Shorelines
Long Lake Property Owners Association may wish to approach the two landowners on the lake who own over four miles of natural shoreline to see if they might consider an ecological gift of their lands. This would help to maintain and protect the lake's long term health for future generations.*
Take advantage of the RVCA Shoreline Naturalization Program to re-naturalize altered creek, lake and stream shoreline identified in this report as “Unnatural Riparian Land Cover". Concentrate stewardship efforts on Long Lake waterfront properties shown in orange on the Riparian Land Cover map (see Figure 90 in Section 4.4 in this report).Other stewardship opportunities in the catchment may be determined based on septic system inspections and surface water quality monitoring results.
Promote the use of bioengineering methods (using native shrub/tree planting, fascines, live stakes) as a shoreline erosion mitigation measure as well as a cost effective alternative to shoreline hardening (with rip rap, armour stone, gabion baskets, walls)
Educate landowners about the value and importance of natural shorelines and property best management practices with respect to shoreline use and development, septic system installation and maintenance and shoreline vegetation retention and enhancement (Carnahan Lake Association, Central Frontenac Township, Frontenac County, Kingston Frontenac Lennox and Addington Health Unit, Long Lake Property Owners' Association, Mississippi Rideau Septic System Office and RVCA).
Water Quality
Long Lake Property Owners' Association supports working with the Township of Central Frontenac to establish a septic system inspection program on Long Lake along with an associated educational program.*
Consider further investigation of the 1) Poor to Fair surface chemistry water quality rating on Carnahan Lake; 2) Fair to Good surface chemistry water quality rating on Long Lake and 3) Fair surface chemistry water quality rating in Uens Creek as part of a review of RVCA's Watershed Watch and Baseline surface water quality monitoring.
Offer funding provided by the RVCA Rural Clean Water Program to landowners with potential projects that could improve water quality on Carnahan and Long Lakes and their tributaries, including Uens Creek (e.g., livestock fencing, septic system repair/replacement and streambank erosion control/stabilisation).
Educate waterfront property owners about septic system care and maintenance by providing information about sewage system maintenance (i.e., when to pump out septic systems and holding talks) through initiatives such as the Septic Savvy Workshop and services provided by the Mississippi Rideau Septic System Office.
Reduce pollutant loadings to Carnahan and Long Lake through education about the application of shoreline, stormwater and agricultural best management practices; also consider using low impact development (LID) methods to improve the quality and reduce the amount of stormwater runoff directly reaching the lake ecosystem. This will be particularly beneficial in areas with extensive impervious surfaces (i.e., asphalt, concrete, buildings, and severely compacted soils) or on sensitive waterfront properties (with steep slopes/banks, shallow/impermeable soils).
Long Lake and Catchment Habitat
Aquatic Habitat/Fisheries/Wildlife
Long Lake Property Owners' Association is looking into what government programs may exist to once again complete spawning bed enhancement projects and other fish and wildlife habitat improvements, which it will be asking the RVCA to advise on.*
Educate waterfront property owners about: 1) fish habitat requirements, spawning timing and near-shore and in-water activities that can disturb or destroy fish habitat and spawning sites 2) the causes of excessive algae and aquatic vegetation growth (see the RVCA publication entitled Algae and Aquatic Plant Educational Manual) and 3) healthy lake ecosystems and associated water level fluctuations in a natural environment.
Lake Planning
Carnahan Lake Association and the Long Lake Property Owners' Association may wish to consider a lake planning process to develop a Lake Plan that:
Is an action plan developed by a lake community that identifies and preserves the natural and social characteristics that are valued by the lake community for future generations
Helps to promote community discussion, education and action
Sets goals and objectives for the protection and enhancement of the lake
Recommends land use policies/practices that influence development on the lake
Promotes stewardship actions to improve the environmental conditions of a lake so it can be enjoyed by future generations.
Consider the need for a community-driven lake management plan for Carnahan Lake and Long Lake that can:
Bring the lake community together
Engage the community beyond the lake residents and lake association members and develops partnership
Identify and bring together common values and concerns
Provide a baseline of data on water quality, shoreline development, fisheries management, etc., that can help to inform water resources management, land use planning and stewardship actions
Range in complexity from a comprehensive living document to a simplified list of priorities that can be carried out by the lake community to protect the lake environment.
Figure 1 Land cover in the Otty Lake catchment (2014)
The RVCA produces individual reports for 14 catchments in the Tay River subwatershed. Using data collected and analysed by the RVCA through its watershed monitoring and land cover classification programs, surface water quality and in-stream conditions are reported for the Tay River, Tay Watershed lakes and Tay tributaries along with a summary of environmental conditions for the surrounding countryside every six years, which includes analysis of data collected through the programs along with local information provided by stakeholders up to 2017.
This information is used to better understand the effects of human activity on our water resources, allows us to better track environmental change over time and helps focus watershed management actions where they are needed the most to help sustain the ecosystem services (cultural, aesthetic and recreational values; provisioning of food, fuel and clean water; regulation of erosion/natural hazard protection and water purification; supporting nutrient/water cycling and habitat provision) provided by the catchment’s lands and forests and waters (Millennium Ecosystem Assessment 2005).
Figure 1 shows the geographic extent of the Otty Lake catchment along with its land cover classes. The Table of Contents provides a hyper-linked list of the articles that have been prepared for the Otty Lake Catchment Report.
52.8 square kilometres; occupies 6.6 percent of the Tay River subwatershed; 1.2 percent of the Rideau Valley watershed.
Geology/Physiography
The Otty Lake catchment resides within part of the physiographic region known as the Algonquin Highlands. In the Tay River Subwatershed, this ancient and hilly geologic region is made up of such Precambrian rocks as marble, conglomerates, and dark or colour banded granite-like rocks. A large area of younger sandstone flanks the catchment’s northern boundary. A veneer of glacial drift (glacial till, sand etc.) overlies the bedrock.
Municipal Coverage
Drummond/North Elmsley Township (18.7 km2; 35.4% of catchment)
Tay Valley Township (34.0 km2; 64.4% of catchment)
Town of Perth (0.1 km2; 0.2% of catchment)
Stream Length
All watercourses (including headwater streams): 98.6 km.
1.2 Vulnerable Areas
Aquifer Vulnerability
The Mississippi-Rideau Source Water Protection program has mapped the north boundary of this catchment as a Significant Groundwater Recharge Area and all of the catchment as a Highly Vulnerable Aquifer. There are no Well-Head Protection Areas in the catchment.
Wetland Hydrology
A watershed model developed by the RVCA in 2009 was used to study the hydrologic function of wetlands in the Rideau Valley Watershed, including those found in the Otty Lake catchment.
1.3 Conditions at a Glance
Fish Community/Thermal Regime
Warm and cool water recreational and baitfish fishery with 19 species observed in Jebbs Creek during 2016.
Headwater Drainage Features
Primarily classified as wetland and natural features with minimal modifications.
Instream/Riparian Habitat
Jebbs Creek: Low to high habitat complexity with increased habitat complexity observed in the lower and upper reaches of the system within the catchment along with a healthy diversity of plant types and levels throughout the surveyed sections; however, there are areas of extensive plant growth (64 percent) which are dominated by the invasive aquatic plant, European frogbit. Dissolved oxygen conditions in Jebbs Creek vary along the system for both warm and coolwater fish species.
Land Cover Change (2008 to 2014)
Catchment
Woodland
Crop-Pasture
Meadow-Thicket
Settlement
Hectares
-7
-3
-1
+11
Land Cover Type (2014)
Catchment
Woodland
Wetland
Water
Crop-Pasture
Settlement
Transportation
Meadow-Thicket
Percent
41
21
14
13
5
3
3
Shoreline Cover Type (30 m. riparian area; 2014)
Catchment
%
Jebbs
Creek
%
McLaren
Lake
%
Otty
Lake
%
Streams*
%
Wetland
44
Wetland
83
Woodland
51
Woodland
48
Wetland
51
Woodland
37
Woodland
10
Wetland
49
Settlement
35
Woodland
32
Settlement
8
Settlement
5
---
---
Wetland
14
Crop-Pasture
12
Crop-Pasture
8
Transportation
1
---
---
Transportation
3
Transportation
2
Transportation
2
Crop-Pasture
1
---
---
---
---
Settlement
2
Meadow-Thicket
1
---
---
---
---
---
---
Meadow-Thicket
1
*Excludes Jebbs Creek
Significant Natural Features
Tay Marsh Provincially Significant Wetland
Tay Marsh Regional Candidate Area of Natural and Scientific Interest, Life Science.
Species at Risk (Elemental Occurrence)
Species at Risk
Status
Blanding's Turtle
Threatened
Black Tern
Special Concern
Eastern Milksnake
Special Concern
Eastern Musk Turtle
Special Concern
Northern Map Turtle
Special Concern
Snapping Turtle
Special Concern
Water Quality for the Protection of Aquatic Life
Water Quality Source
Jebbs Creek
McLaren Lake
Otty Lake
Surface Chemistry
Good
Poor to Fair
Fair to Good
Instream Biological
Poor to Fair
---
---
Jebbs Creek: Benthic invertebrate samples are dominated by species that are moderately to highly tolerant of high organic pollution levels.
Water Wells
Approximately 620 operational private water wells in the Otty Lake catchment. Groundwater uses are mainly domestic.
Wetland Cover
Wetlands are reported to have covered 31 percent of the Otty Lake catchment prior to European settlement, as compared to 21 percent (or 11.1 square kilometres) of the area in 2014. This represents a 31 percent (or 5.0 square kilometre) loss of historic wetland cover.Fourteen percent of the remaining wetlands are regulated leaving 86 percent (or 9.5 square kilometers) unregulated.
1.4 Catchment Care
Environmental Management
The Otty Lake Association prepared the Otty Lake Management Plan (2008) to provide a summary of what is known about the Otty Lake catchment along with the community’s vision for the lake and a list of its main concerns and actions to address them. This has been followed-up with the release of the Otty Lake Five-year Review (2014) and annual State of the Lake Reports initiated by the OLA in 2014, which is a comprehensive report providing information regarding water quality, the lake fishery, wildlife habitat, shoreline planting initiatives, the amounts of zebra mussels and algae, among many other topics.
Development along Jebbs Creek (Rideau Ferry Road to the Tay River) and in, and adjacent to, the Tay Marsh Provincially Significant Wetland in the catchment is subject to Ontario Regulation 174-06 (entitled “Development, Interference with Wetlands and Alterations to Shorelines and Watercourses”) that protects the hydrologic function of the wetland and also protects landowners and their property from natural hazards (flooding, fluctuating water table, unstable soils) associated with them.
Three Environmental Compliance Approvals were sought in the catchment for waste management sites and an industrial sewage works.
Environmental Monitoring
Chemical surface (in-stream/lake) water quality collection by the RVCA since 2003; prior to this date, the Otty Lake Association has coordinated/undertaken other chemical water quality analysis (see Section 2 of this report).
Benthic invertebrate (aquatic insect) surface (in-stream) water quality collection by the RVCA in Jebbs Creek since 2005 (see Section 3.3.1 of this report).
Fish survey and stream characterization survey by the RVCA on Jebbs Creek in 2016 included taking measurements and recording observations on instream habitat, bank stability, other attributes and preparing a temperature profile (see Section 3 of this report).
Otty Lake shoreline assessed as majority regenerative (236 properties; 49 percent); majority ornamental (172 properties; 36 percent) and majority natural (74 properties; 15 percent) by the Love Your lake Program.
Thirty-two drainage feature assessments were conducted by the RVCA in 2016 at road crossings in the catchment. The protocol measures zero, first and second order headwater drainage features and is a rapid assessment method characterizing the amount of water, sediment transport, and storage capacity within headwater drainage features (see Section 3.4 of this report).
Classification of Otty Lake catchment land cover types derived by the RVCA from colour aerial photography that was acquired during the spring of 2008 and 2014 (see Section 4.1 of this report).
The Mississippi Rideau Septic System Office has conducted 348 mandatory septic system re-inspections on 250 properties around Otty Lake from 2012 to 2017 and nine voluntary septic system re-inspections on seven properties around McLaren and Mud Lake from 2004 to 2017 (see Section 5.5 of this report).
Groundwater chemistry information is available from the Ontario Geological Survey for one well (#13-AG-022) located in the catchment
Stewardship
Sixty-four stewardship projects were completed by landowners with assistance from the RVCA (see Section 5 of this report).
Surface water quality conditions in the Otty Lake catchment are monitored by the Rideau Valley Conservation Authority’s (RVCA) Watershed Watch Program and Baseline Water Quality Monitoring Program. Watershed Watch monitors watershed lakes to assess nutrient concentrations, water clarity, dissolved oxygen availability and pH. The baseline water quality program focuses on streams; data is collected for 22 parameters including nutrients (total phosphorus and total Kjeldahl nitrogen), Escherichia coli (E. coli), metals (like aluminium and copper) and additional chemical/physical parameters (such as alkalinity, chlorides, pH and total suspended solids). Figure 2 shows the locations of monitoring sites in the catchment.
Figure 2 Water quality monitoring sites on Otty Lake, McLaren Lake and Jebbs Creek
Water Quality Rating in the Otty Lake Catchment
The water quality ratings across this catchment range from "Poor to Good" (Table 1); with a rating of "Poor to Fair in McLaren Lake; "Fair to Good" in Otty Lake and "Good" in Jebbs Creek as determined by the Canadian Council of Ministers of the Environment (CCME) Water Quality Index. "Poor" indicates that water quality is frequently threatened or impaired with conditions that often depart from natural or desirable levels. A "Fair" rating indicates that water quality is usually protected but is occasionally threatened or impaired; conditions sometimes depart from natural or desirable levels. A rating of "Good" indicates that only a minor degree of threat or impairment is observed and conditions rarely depart from natural or desirable levels. Each parameter is evaluated against established guidelines to determine water quality conditions. Those parameters that frequently exceed guidelines are presented below. Data has been analysed over the 2006-2017 period for general trends and conditions. Table 1 shows the overall rating for the monitored surface water quality sites within the catchment and Table 2 outlines the Water Quality Index (WQI) scores and their corresponding ratings.
Table 1 Water Quality Index ratings for the Otty Lake Catchment; scores from which ratings were determined are shown in brackets.
Site
Location
2006-2008
2009-2011
2012-2014
2015-2017
JEB-01
Jebbs Creek at Rideau Ferry Rd.
Good (87)
Good (83)
Good (87)
Good (92)
DP1
Otty Lake
Fair (77)
Good (88)
Good (88)
Fair (77)
DP1
McLaren Lake
Poor (59)
Fair (72)
Poor (61)
Poor (50)
Table 2 Water Quality Index ratings and corresponding index scores (RVCA terminology, original WQI category names in brackets)
Rating
Index Score
Very Good (Excellent)
95-100
Good
80-94
Fair
65-79
Poor (Marginal)
45-64
Very Poor (Poor)
0-44
2.1 Otty Lake Water Quality
Surface water quality conditions in Otty Lake have been monitored by RVCA’s Watershed Watch Program since 2002. Data from the deep point site (DP1) has been used to calculate the WQI rating for Otty Lake, which ranged from Fair to Good over the 2006-2017 period (Table 1). Moderate nutrient concentrations, good oxygen availability and clear water all influenced this rating. The following discussion explains how each of the monitored water quality parameters contributes to the lake’s water quality.
This report also considers data from eight additional shoreline sites that are monitored around the lake. These sites have not been included in the calculation of the CCME WQI rating, as they are not monitored with the same frequency as the deep point site. However, they do provide important information on water quality conditions in the near shore areas. For locations of shoreline sites (A-H) please see Figure 2. Additional resources also include the extensive data collected by the Otty Lake Association (OLA) and results from the Ontario Ministry of the Environment Lake Partner Program (LPP); the results from these programs have been incorporated in this discussion to support the results produced by RVCA.
2.1.1 Otty Lake Nutrients
Total phosphorus (TP) is used as a primary indicator of excessive nutrient loading and contributes to abundant aquatic vegetation growth and depleted dissolved oxygen levels. The Provincial Water Quality Objective (PWQO) is used as the TP Guideline and states that in lakes, concentrations greater than 0.020 mg/l indicate an excessive amount of TP within the water column. Concentrations below 0.010 mg/l are generally considered to be minimal and unlikely to have problems associated with nutrient loading.
Total Kjeldahl nitrogen (TKN) is used as a secondary indicator of nutrient loading. RVCA uses a guideline of 0.500 mg/l to assess TKN[1]within surface waters.
Nutrients at the Otty Lake Deep Point
TP and TKN sampling results collected by the RVCA are presented in Figures 3 to 6. Variability has occurred in the sampled TP concentrations at this site (Figure 3 and 4), however no significant trend[2]was observed in the 2006-2017 dataset. Eighty-nine percent of samples analysed for TP were less than the TP guideline and the average concentration was 0.013 mg/l (Table 3). TKN concentration also showed variability and similar to TP results no significant change was observed (Figures 5 and 6). Ninety-three percent of reported results were below the TKN guideline and the average TKN concentration was 0.411 mg/l (Table 3).
Figure 3 Total phosphorus sampling results at the deep point site (DP1) on Otty Lake, 2006-2017
Figure 4 Average total phosphorus results at the deep point site (DP1) on Otty Lake, 2006-2017
Figure 5 Total Kjeldahl nitrogen sampling results at the deep point site (DP1) on Otty Lake, 2006-2017
Figure 6 Average total Kjeldahl nitrogen results at the deep point site (DP1) on Otty Lake, 2006-2017
Table 3 Summary of nutrient results for Otty Lake over the monitoring periods, 2006-2017
Total Phosphorous 2006-2017
Site
Average (mg/l)
Below Guideline
No. Samples
Source
DP1
0.013
89%
45
RVCA
DP1
0.012
90%
30
OLA
DP1
0.013
98%
130
LPP
Total Kjeldahl Nitrogen 2006-2017
Total Kjeldahl Nitrogen 2003-2008
Total Kjeldahl Nitrogen 2003-2008
Total Kjeldahl Nitrogen 2003-2008
Total Kjeldahl Nitrogen 2003-2008
Site
Average (mg/l)
Below Guideline
No. Samples
Source
DP1
0.411
93%
45
RVCA
DP1
0.510
53%
30
OLA
Table 3 also summarises nutrient data from the OLA and LPP monitoring programs. Please note that the OLA data set was only available from 2012-2017 and has fewer samples; also the LPP does not sample for TKN, therefore no data is available to compare results for that parameter. There was no significant difference found in the average TP concentration across the three monitoring programs; the same result was found when comparing the TKN results for RVCA and OLA[3]. Comparably to the RVCA data set, there was no indication of a change (trend) in the nutrient concentrations over the monitoring period in the OLA data set. The LPP TP data did show a slight decreasing trend in TP concentrations from 2006-2017. The increased number of samples (duplicates collected at the deep point) appear to have reduced the variability in this data set and perhaps made the trend more evident.
Overall, the data presented indicates that nutrient concentrations may be considered moderate with occasional instances of exceedances in the mid-lake, deep water site on Otty Lake.
Nutrients around Otty Lake
The average nutrient concentrations at monitored shoreline sites around the lake vary from year to year (Figures 7 and 8). Please note that in the 2006-2017 monitoring period sites A, B, C and E were sampled yearly; while sites D, F, G and H were only sampled in 2007, 2012 and 2017.
Average total phosphorous concentrations are below the TP guideline at the majority of sites; with the exception of site A, which typically shows exceedances (Figure 7). Site A is at the head of Marl Bay where Jebbs Creek narrows and is also the outflow of the lake; the cumulative flow through this portion of the lake dominated by wetland features may result in elevated nutrients at this site. No significant trend was noted in concentrations over the monitoring period.
Average TKN concentrations were also below the guideline at the majority of monitored sites; again, an exception to this is site A and E (Figure 8). Site E is located near the outflow of McLaren Lake which has had persistently elevated TKN levels due to the influence of wetlands that flow into that waterbody.
Figure 7 Average total phosphorus concentrations at RVCA shoreline monitoring sites on Otty Lake, 2006-2017
Figure 8 Average total Kjeldahl nitrogen concentrations at RVCA shoreline monitoring sites on Otty Lake, 2006-2017
Summary of Otty Lake Nutrients
Otty Lake nutrient concentrations are generally below the guidelines, with few exceedances. It is possible that occasional problems with nutrient enrichment (i.e. algal blooms or excessive plant growth) may be observed in shallow, sheltered bays.
Efforts such as the diversion of runoff and enhanced shoreline buffers are important to continue to protect and enhance water quality, and reduce future nutrient increases. Nutrient exceedances may be partially attributed to the natural aging of a lake and basin characteristics. All residents can help minimise their impact on the lake by reducing nutrient inputs through practices such as proper maintenance of septic systems, keeping shorelines natural and using phosphate free soaps and detergents. Promotion of sound stewardship and protection around lake are important to maintain and protect water quality conditions into the future.
2.1.2 Otty Lake Water Clarity
Water clarity is measured using a Secchi disk during each deep point sample. Table 4 summarises the recorded depths with an average depth of 5.8 m and shows that all readings have exceeded the minimum PWQO of 2 m indicating that algae in the water column is not at excessive levels (good water clarity). Less than 2 m will indicate overproduction in a lake or significant inputs to the water column that are limiting light availability. Figure 9 shows that no individual reading has been below the guideline and measured depths range from 3.1 m to 9 m. A decreasing trend was observed within the 2006-2017 data set, indicating that Secchi depths have been reduced over this period. It should be noted that Secchi depths in many waterbodies have been influenced by the colonization of zebra mussels resulting in clearer waters than may have been seen prior to the introduction of this species; zebra mussels have been reported in Otty Lake since 2005. The declining trend may be attributed to the population dynamics of this species as minimal changes have been noted in other monitored parameters (i.e. nutrients, pH, dissolved oxygen conditions).
Table 4 Summary of Secchi depths recorded at the deep point site (DP1) on Otty Lake, 2006-2017
Secchi depth 2006-2017
Site
Average (mg/l)
Below Guideline
No. Samples
DP1
5.8
100%
41
Figure 9 Recorded Secchi depths at the deep point site (DP1) on Otty Lake, 2006-2017
Summary of Otty Lake Water Clarity
Waters in Otty Lake are very clear and sufficient sunlight is able to penetrate the water column to support aquatic life and provide sufficient visibility for safe recreational use (boating, swimming).
2.1.3 Otty Lake Fish Habitat
Two other factors, dissolved oxygen/temperature and pH were also assessed to provide an overall sense of the health of Otty Lake from a fish habitat perspective.
2.1.3.1 Otty Lake Dissolved Oxygen and Temperature
The red bars in Figure 10 show the depths where suitable conditions exist for warm water fish species (temperature less than 25°C and dissolved oxygen greater than 4 mg/l) at the deep point site. The vertical axis represents the total lake depth at each site where the profile is taken. Suitable conditions typically decline throughout the summer to about 10 m of the water column, a very small portion of the water column met the requirements in the late summer of 2006 and 2016. Overall, no significant change was noted in conditions through the 2006-2017 period.
Figure 10 Depths suitable for warm water fish species at the monitored deep point site (DP1)
2.1.3.2 Otty Lake pH
pH is a basic water quality parameter used to assess the acidity of water, an important factor for aquatic life. Figure 11 shows monitored pH values over the 2006-2017 period.
Figure 11 pH concentrations at the deep point site (DP1) on Otty Lake, 2006-2017
The majority of samples for the monitored period are within guidelines established by the Canadian Council of Minister's of the Environment which state that pH should be between 6.5 and 9 to protect aquatic life (Table 5). Surface water’s that are found to be more alkaline (higher pH) are common in many regions of the Tay River subwatershed and can generally be attributed to the geology rather than anthropogenic activities. Biological activities such as increased photosynthesis from algal blooms and plant growth may also influence pH.
Table 5 Summary of pH results at the deep point site (DP1) on Otty Lake, 2006-2017.
pH 2006-2017
Site
Average (mg/l)
Within Guideline
No. Samples
DP1
8.22
100%
41
Summary of Water Quality for Fish Habitat in Otty Lake
Overall the water chemistry data at the deep point describes suitable habitat conditions for fish species such as bass, walleye and pike. There is some evidence that the warming of the water column in the late summer/fall and limited oxygen availability at deeper depths may minimise the amount of habitat for some more sensitive species. pH conditions are within the end of the range recommended for the protection of aquatic life. Overall, the data indicates a healthy environment for aquatic species.
2.1.4 Otty Lake E. Coli
The RVCA samples for E. coli at their monitored shoreline sites twice each sampling season. E. coli data was not used in the calculations of the WQI rating for the lake due to differences in sampling frequency and site locations. E. coli data has been collected by both RVCA and OLA and is summarised in Table 6. The OLA samples for E. coli at 31 sites in Otty Lake, generally one to three times annually.
Throughout the 2006-2017 period 96 percent of samples collected by RVCA were below the E. coli guideline of 100 colony forming units (CFU) per 100 ml set by the PWQO; across the lake the count at the geometric mean [2] was 4 CFU/100ml (Table 6). The OLA E. coli data set also showed that the geometric mean of E. coli counts around the lake are minimal (2 CFU/100ml) with 99 percent of samples below the guideline (Table 6); providing further support for little indication of bacterial contamination around the lake.
Table 6 Summary of E. coli results for Otty Lake, 2006-2017
E. coli 2006-2017
Site
Geometric mean (CFU/100ml)
Below Guideline
No. Samples
Source
Otty Lake
4
96%
122
RVCA
Otty Lake
2
99%
324
OLA
Figure 12 E. coli counts at RVCA monitored shoreline sites on Otty Lake, 2006-2017
Figure 12 shows the distribution of counts across all RVCA shoreline sites. Site E, generally has higher results than other sites, but is not consistently elevated and should not be a cause for concern. All sites fell well below the guideline of 100 CFU/100ml.
Summary of Otty Lake Bacterial Contamination
The results presented above indicate that bacterial contamination is not a significant concern in Otty Lake and the water should be safe for recreational use such as swimming and boating.
2.2 McLaren Lake Water Quality
Surface water quality conditions in McLaren Lake have been monitored by RVCA’s Watershed Watch Program since 2006. Data from the deep point site (DP1) has been used to calculate the WQI rating which ranged from "Poor-Fair" in the 2006-2017 period (Table 1). Moderate to elevated nutrient concentrations and periods of limited oxygen availability influenced this rating. The following discussion explains how each of the monitored water quality parameters contributes to the lake’s water quality.
2.2.1 McLaren Lake Nutrients
Total phosphorus (TP) is used as a primary indicator of excessive nutrient loading and contributes to abundant aquatic vegetation growth and depleted dissolved oxygen levels. The Provincial Water Quality Objective (PWQO) is used as the TP Guideline and states that in lakes, concentrations greater than 0.020 mg/l indicate an excessive amount of TP within the water column. Concentrations below 0.010 mg/l are generally considered to be minimal and unlikely to have problems associated with nutrient loading.
Total Kjeldahl nitrogen (TKN) is used as a secondary indicator of nutrient loading. RVCA uses a guideline of 0.500 mg/l to assess TKN[1]within surface waters.
Nutrients at the McLaren Lake Deep Point
TP and TKN sampling results are presented in Figures 13 to 16. Variability has occurred in the sampled TP concentrations at this site (Figure 13 and 14), however no significant trend was observed in the 2006-2017 dataset. Seventy-two percent of samples analyzed for TP were less than the TP guideline and the average concentration was 0.017 mg/l (Table 3).[5]TKN concentrations were also variable over the monitoring period; as with TP results no significant change was observed (Figures 15 and 16). Most sample results exceeded the guideline (only 13 percent were below 0.500 mg/l) and the average TKN concentration was elevated at 0.636 mg/l (Table 3).
Figure 13 Total phosphorus sampling results at the deep point site (DP1) on McLaren Lake, 2006-2017
Figure 14 Average total phosphorus sampling results at the deep point site (DP1) on McLaren Lake, 2006-2017
Figure 15 Total Kjeldahl nitrogen sampling results at the deep point site (DP1) on McLaren Lake, 2006-2017
Figure 16 Average total Kjeldahl nitrogen sampling results at the deep point site (DP1) on McLaren Lake, 2006-2017
Table 7 Summary of nutrient results for McLaren Lake over 2006-2017 monitoring period (Highlighted values indicate average concentrations that exceed the guideline.)
Total Phosphorous 2006-2017
Site
Average (mg/l)
Below Guideline
No. Samples
DP1
0.017
72%
48
Total Kjeldahl Nitrogen 2006-2017
Site
Average (mg/l)
Below Guideline
No. Samples
DP1
0.636
13%
48
Summary of McLaren Lake Nutrients
Overall, the data presented indicates that nutrient concentrations may be considered to range from moderate to elevated with regard to nitrogen. This can be attributed to the wetland area that drains into McLaren Lake; wetlands hold high levels of nutrients in their soils which may be flushed into the lake during periods of higher flows. Though development around the lake is fairly minimal, efforts by property owners such as the diversion of runoff and enhanced shoreline buffers are important to continue to protect and enhance water quality and reduce future nutrient increases. All residents can help minimise their impact on the lake by reducing nutrient inputs through practices such as proper maintenance of septic systems, keeping shorelines natural and using phosphate free soaps and detergents.
2.2.2 McLaren Lake Water Clarity
Water clarity is measured using a Secchi disk during each deep point sample. Table 8 summarises the recorded depths with an average depth of 3.09 and shows that the majority (98 percent) of readings have exceeded the minimum PWQO of 2 m indicating that algae in the water column is not at excessive levels (good water clarity). Less than 2 m will indicate overproduction in a lake or significant inputs to the water column that are limiting light availability. Figure 17 shows recorded readings relative to the guideline; measured depths range from 1.78 m to 5 m. As with Otty Lake, a decreasing trend was observed within the 2006-2017 data set, indicating that reduced Secchi depths are becoming more common. It should be noted that Secchi depths in many waterbodies have been influenced by the colonization of zebra mussels resulting in clearer waters than may have been seen prior to the introduction of this species; zebra mussels were first reported in McLaren Lake in 2006. The declining trend may be attributed to the population dynamics of this species as no other changes have been noted in other monitored parameters (i.e. nutrients, pH, dissolved oxygen conditions).
Table 8 Summary of Secchi depths recorded at the deep point site (DP1) on McLaren Lake, 2006-2017
Secchi 2006-2017
Site
Average (m)
Below Guideline
No. Samples
DP1
3.09
98%
43
Figure 17 Recorded Secchi depths at the deep point site (DP1) on McLaren Lake, 2006-2017
Summary of McLaren Lake Water Clarity
Waters in McLaren Lake are clear and sufficient sunlight is able to penetrate the water column to support aquatic life and provide sufficient visibility for safe recreational use (boating, swimming).
2.2.3 McLaren Lake Fish Habitat
Two other factors, dissolved oxygen/temperature and pH were also assessed to provide an overall sense of the health of McLaren Lake from a fish habitat perspective.
2.2.3.1 McLaren Lake Dissolved Oxygen and Temperature
The red bars in Figures 18 show the depths where suitable conditions exist for warm water fish species (temperature less than 25°C and dissolved oxygen greater than 4 mg/l) at the monitored deep point site. The vertical axis represents the total lake depth at the site where the profile is taken. Suitable conditions typically decline throughout the summer to about 4 m in the water column; this is generally due to very low oxygen availability below this depth. Overall, no significant change was noted in conditions between the 2006-2017 period.
Figure 18 Depths suitable for warm water fish species at the deep point site (DP1) on McLaren Lake, 2006-2017
2.2.3.2 McLaren Lake pH
pH is a basic water quality parameter used to assess the acidity of water, an important factor for aquatic life. Figure 19 shows monitored pH values over the 2006-2017 period.
Figure 19 pH concentrations at the deep point site (DP1) on McLaren Lake, 2006-2017
All results were within the guideline established by the Canadian Council of Minister's of the Environment which state that pH should be between 6.5 and 9 to protect aquatic life (Table 9).
Table 9 Summary of pH results at the deep point (DP) site on McLaren Lake, 2006-2017
pH 2006-2017
Site
Average (mg/l)
Within Guideline
No. Samples
DP1
8.02
100%
41
Summary of Water Quality in McLaren Lake for Fish Habitat
Overall the water chemistry data at the deep point describes suitable habitat conditions for warm water fish species. The limited oxygen availability at deeper depths may limit the success of some sensitive fish populations or aquatic species. pH conditions are within the end of the range recommended for the protection of aquatic life.
2.3 Jebbs Creek Water Quality
There is one stream site on Jebbs Creek monitored in the Otty Lake catchment (JEB-01, Figure 2). Analysis of the data is based on samples collected from 2006 to 2017. Water quality at this site is reported as “Good” (Table 1) as determined by the Canadian Council of Ministers of the Environment Water Quality Index (CCME WQI). The score at this due to the majority of monitored parameters having results below established guidelines. For more information on the CCME WQI, please see the Tay River Subwatershed Report. Only those parameters with exceedances that influenced the rating will be discussed in the following sections.
2.3.1 Jebbs Creek Nutrients
Total phosphorus (TP) is used as a primary indicator of excessive nutrient loading and may contribute to abundant aquatic vegetation growth and depleted dissolved oxygen levels. The Provincial Water Quality Objective (PWQO) is used as the TP Guideline and states that in streams concentrations greater than 0.030 mg/l indicate an excessive amount of TP.
Total Kjeldahl nitrogen (TKN) is used as a secondary indicator of nutrient loading. RVCA uses a guideline of 0.500 mg/l to assess TKN [1]within surface waters.
Tables 10 and 11 summarise average nutrient concentrations at the monitored site on Jebbs Creek and show the proportion of results that meet the guidelines.
Table 10 Summary of total phosphorous results for Jebbs Creek, 2006-2017.
Total Phosphorus 2006-2017
Site
Average (mg/l)
Below Guideline
No. Samples
JEB-01
0.022
90%
70
Table 11 Summary of total Kjeldahl nitrogen results for Jebbs Creek, 2006-2017 (Highlighted values indicate average concentrations that exceed the guideline.)
Total Kjeldahl Nitrogen 2006-2017
Site
Average (mg/l)
Below Guideline
No. Samples
JEB-01
0.633
29%
70
The majority of TP results (90 percent) were below the guideline with an average concentration of 0.022 mg/l (Table 10). There is not much seasonal variability observed at the site apart from elevated results observed in September (Figure 20). There was one result of 0.150 mg/l collected in September of 2011 that was significantly elevated and should not be considered representative of conditions (Figure 21). Please note that no samples are collected over the winter months. Overall there was no significant trend in the monitoring data throughout the 2006-2017 period (Figure 21).
Figure 20 Average monthly total phosphorus concentrations in Jebbs Creek, 2006-2017.
Figure 21 Distribution of total phosphorus concentrations in Jebbs Creek, 2006-2017.
TKN results show that the bulk of results exceeded the guideline (Figure 23); 29 percent of samples were below the guideline and the average concentration was elevated at 0.633 mg/l (Table 11). TKN concentrations appear to increase throughout the summer months (Figure 22). However, as with TP results, a single elevated sample in September of 2011 is influencing the monthly average concentration (Figures 22 & 23). Overall there was no significant trend in the monitoring data throughout the 2006-2017 period (Figure 23).
Figure 22 Average monthly total Kjeldahl nitrogen concentration in Jebbs Creek, 2006-2017
Figure 23 Distribution of total Kjeldahl nitrogen concentrations in Jebbs Creek, 2006-2017
Summary of Jebbs Creek Nutrients
The data shows that nutrient enrichment is a feature of Jebbs Creek with regards to TKN. This is likely due to the influence of surrounding wetland areas. Wetlands are naturally rich in nitrogen and appear to be contributing to the concentrations in this creek. Though this is likely to be a natural condition it is important to reduce human impacts wherever possible. Strategies to reduce nutrient inputs may include diversion of runoff to the creek from surrounding developed areas (i.e. residences and roadways) and enhanced shoreline buffers.
2.3.2 Jebbs Creek E. Coli
E. coli is used as an indicator of bacterial pollution from human or animal waste; in elevated concentrations it can pose a risk to human health. The PWQO of 100 colony forming units/100 milliliters (CFU/100 ml) is used to assess E. coli. Counts greater than this guideline indicate that bacterial contamination may be a problem within a waterbody.
Table 12 summarises the geometric mean[4]for the monitored site on Jebbs Creek and shows the proportion of samples that meet the E. coli guideline of 100 CFU/100 ml. The monthly geometric mean with respect to the guideline for the 2006-2017 period is shown in Figure 24 and distribution of sampled counts is shown in Figure 25.
Table 12 Summary of E. coli results for Jebbs Creek, 2006-2017
E. coli 2006-2017
Site
Geometric Mean (CFU/100ml)
Below Guideline
No. Samples
JEB-01
34
81%
70
E. coli results at site JEB-01 indicate bacterial counts are typically below (81 percent) the E. coli guideline, similarly the count at geometric mean is 34 CFU/100ml (Table 12). E. coli counts are typically highest during the summer months as warmer temperatures are needed for bacteria to survive (Figure 24). Results have varied for each sampled year, but no trend was observed across the 2006-2017 period (Figure 25).
Figure 24 Geometric mean of monthly E. coli counts in Jebbs Creek, 2006-2017
Figure 25 Distribution of E. coli counts in Jebbs Creek, 2006-2017
Summary of Jebbs Creek Bacterial Contamination
Results indicate that bacterial contamination is not a concern in Jebbs Creek. The count at the geometric mean is below the PWQO for both monitoring periods and a limited number of counts exceeding the guideline have been observed. The elevated samples that do occur are most likely due to wildlife and can be considered natural variability in the aquatic ecosystem. However, good stewardship practices should be maintained throughout the drainage area to protect both Jebbs Creek and the Tay River downstream; this includes properly maintaining septic systems, enhancing shoreline buffers and restricting livestock access; all are actions that can help to protect water quality conditions in Jebbs Creek.
[1]No Ontario guideline for TKN is presently available; however, waters not influenced by excessive organic inputs typically range from 0.100 to 0.500 mg/l, Environment Canada (1979) Water Quality Sourcebook, A Guide to Water Quality Parameters, Inland Waters Directorate, Water Quality Branch, Ottawa, Canada.
[2]Trends in the data were assessed using the Mann-Kendall trend test and Sens slope statistic.
[3]Comparisons of means was done using the two sample t-test, variances were assessed using the F test. Permutation tests of difference in means and the Wilcoxon Rank Sum on differences in medians was also used to evaluate the data sets.
[4]A type of mean or average, which indicates the central tendency or typical value of a set of numbers by using the product of their values (as opposed to the arithmetic mean which uses their sum). It is often used to summarise a variable that varies over several orders of magnitude, such as E. coli counts.
[5]One result from June 8, 2009 of 0.091 mg/l has been removed from the dataset, as this result differs significantly from the dataset. It is likely an outlier and may have been influenced by a contaminated sample, sample error or analytical error.
The RVCA Stream Characterization Program evaluated 3.9 km of Jebbs Creek in 2016. A total of 39 stream survey assessments were completed in the month of June and the first week of July.
During the summer and fall of 2016, the Rideau Valley watershed experienced periods of severe drought. Precipitation levels were measured at less than 40% of the long-term average, as the water supply was unable to meet local demand. The lack of rainfall affected the success and function of farm crops, municipal and private wells, lawns and gardens, navigation and ultimately the health of our lakes, rivers and streams.
Low water conditions were readily observed throughout the watershed, as many of the streams were highly fragmented or completely dry (see photo below). Aquatic species such as amphibians, fish and benthic invertebrates were affected, as suitable habitat may have been limited.
Fragmentation of habitat was observed along Jebbs Creek at the Perth Wildlife Reserve during the summer and fall of 2016
3.1 Jebbs Creek Overbank Zone
3.1.1 Riparian Buffer Evaluation
The quality of the riparian area increases with the width, complexity and linear extent of its vegetation along a stream or creek. A complex riparian community consists of diverse plant species native to the site, with multiple age-classes providing vertical structural diversity along a watercourse.
Here is a list of watershed benefits from a healthy riparian buffer zone:
Reduces the amount of pollutants that reach the stream from surface runoff
Helps reduce and mitigate erosion
Provides a microclimate that is cooler during the summer months providing cooler water for aquatic organisms
Provides large wood structure from fallen trees and limbs that form instream cover, create pools, stabilize the streambed, and provide habitat for aquatic organisms
Provides organic material for stream biota that, among other functions, is the base of the food chain in lower order streams
Provides habitat for terrestrial insects that drop in the stream and become food for fish and travel corridors for other terrestrial animals
Dissipates energy during flood events
Often provides the only refuge areas for fish during out-of-bank flows (behind trees, stumps, and logs)
Figure 26 demonstrates the buffer conditions of the left and right banks separately. Jebbs Creek had a buffer of greater than 30 meters along 91 percent of the right bank and 97 percent of the left bank.
Figure 26 Riparian Buffer Evaluation along Jebbs Creek
3.1.2 Riparian Buffer Alterations
Alterations within the riparian buffer were assessed within three distinct shoreline zones (0-5m, 5-15m, 15-30m), and evaluated based on the dominant vegetative community and/or land cover type (Figure 27). The riparian buffer zone along Jebbs Creek was found to be dominated by forest and wetland conditions along the riparian corridor.
Figure 27 Riparian buffer alterations along Jebbs Creek
3.1.3 Adjacent Land Use
The RVCA’s Stream Characterization Program identifies seven different land uses along Jebbs Creek (Figure 28). Surrounding land use is considered from the beginning to end of the survey section (100m) and up to 100m on each side of the river. Land use outside of this area is not considered for the surveys but is nonetheless part of the subwatershed and will influence the creek. Natural areas made up 96 percent of the stream, characterised by forest, scrubland, meadow and wetland. Wetland habitat was dominant in the adjacent lands along Jebbs Creek at 84 percent of the surveyed sections. The remaining land use consisted of industrial/commercial, residential and other in the form of hydro infrastructure.
Figure 28 Land Use along Jebbs Creek
3.2 Jebbs Creek Shoreline Zone
3.2.1 Instream Erosion
Stream erosion is the process by which water erodes and transports sediments, resulting in dynamic flows and diverse habitat conditions. Excessive erosion can result in drastic environmental changes, as habitat conditions, water quality and aquatic life are all negatively affected. Bank stability was assessed as the overall extent of each section with “unstable” shoreline conditions. These conditions are defined by the presence of significant exposed soils/roots, minimal bank vegetation, severe undercutting, slumping or scour and potential failed erosion measures. The majority of Jebbs Creek had low levels of erosion with the exception of one location along the system which had moderate levels of erosion near the confluence with the Tay marsh (Figure 29).
Figure 29 Stream erosion levels along Jebbs Creek
3.2.2 Undercut Stream Banks
Stream bank undercuts can provide excellent cover habitat for aquatic life, however excessive levels can be an indication of unstable shoreline conditions. Bank undercut was assessed as the overall extent of each surveyed section with overhanging bank cover present. Figure 30 shows that Jebbs Creek had low levels of undercut banks along the majority of the system which is typical for systems that are dominated by riverine wetland habitat along the shoreline.
Figure 30 Undercut stream banks along Jebbs Creek
3.2.3 Stream Shading
Grasses, shrubs and trees all contribute towards shading a stream. Shade is important in moderating stream temperature, contributing to food supply and helping with nutrient reduction within a stream. Stream cover is assessed as the total coverage area in each section that is shaded by overhanging trees/grasses and tree canopy, at greater than one metre above the water surface. Figure 31 shows highly variable conditions of none to high levels of stream shading along Jebbs Creek.
Figure 31 Stream shading along Jebbs Creek
3.2.4 Instream Wood Structure
Forested shorelines provide essential complex habitat through the perpetual process of shoreline trees falling into the water. This continuous recruitment of trees creates a wood-based physical structure in the littoral zone that is common on natural systems. Insects, fish, amphibians, birds, and other animals have also evolved with this abundance of near shore wood and it is essential to their life cycles. With increased development along many waterways, forested lakeshores have been altered and wood-based physical structure in many waterways has been reduced. It is important to restore this essential habitat to aquatic ecosystems.
Shoreline Protection
Protects shorelines by providing a barrier from wind and wave erosion
Reduces sedimentation of the water caused by shoreline slumping due to bank erosion
Allows detritus to collect and settle on the lake or creek bed providing the substrate structure required for native aquatic vegetation to establish and outcompete invasive species
Food Source
Wood complexes are an important food source for invertebrates
Small fish feed on the abundance of invertebrates that are found around these structures
Larger fish, waterfowl and shorebirds all benefit from the abundance of invertebrates and small fish feeding around woody structures in the littoral zone
Cover
Cover from predators is essential for many fish and animals to successfully complete their life cycle
The nooks and crannies of wood complexes offer critters safety from predators while at the same time concentrating prey to make predators more efficient
Wood provides the structure on which many species must lay or attach their eggs, therefore these complexes provide quality spawning and nesting habitat
Diversity
Wood complexes in the littoral zone provide unique edge habitat along the shoreline
Edge habitats contain more species diversity and higher concentrations of species than the adjoining habitats themselves will have
Figure 32 shows that the majority of Jebbs Creek had low to moderate levels of instream wood structure in the form of branches and trees along the system.
Figure 32 Instream wood structure along Jebbs Creek
3.2.5 Overhanging Wood Structure
Trees and branches that are less than one meter from the surface of the water are defined as overhanging. Overhanging wood structure provide a food source, nutrients and shade which helps to moderate instream water temperatures. Figure 33 shows the system is dominated by low to moderate levels of overhanging branches and trees along Jebbs Creek.
Figure 33 Overhanging trees and branches along Jebbs Creek
3.2.6 Anthropogenic Alterations
Stream alterations are classified based on specific functional criteria associated with the flow conditions, the riparian buffer and potential human influences. Figure 34 shows 74 percent of Jebbs Creek remains “unaltered” with no anthropogenic alterations. Eighteen percent of Jebbs Creek was classified as natural with minor anthropogenic changes, while eight percent was considered altered. The alterations along Jebbs Creek were in the form of a road crossing and areas with reduced natural buffers.
Figure 34 Anthropogenic alterations along Jebbs Creek
3.3 Jebbs Creek Instream Aquatic Habitat
3.3.1 Benthic Invertebrates
Freshwater benthic invertebrates are animals without backbones that live on the stream bottom and include crustaceans such as crayfish, molluscs and immature forms of aquatic insects. Benthos represent an extremely diverse group of aquatic animals and exhibit wide ranges of responses to stressors such as organic pollutants, sediments and toxicants, which allows scientists to use them as bioindicators. As part of the Ontario Benthic Biomonitoring Network (OBBN), the RVCA has been collecting benthic invertebrates at the Perth Wildlife Reserve site on Jebbs Creek since 2003. Monitoring data is analysed for each sample site and the results are presented using the Family Biotic Index, Family Richness and percent Ephemeroptera, Plecoptera and Trichoptera. There were no values recorded for the Fall of 2016 due to extreme drought conditions therefore no samples could be collected.
OBBN sample location at the Perth Wildlife Reserve in the spring of 2016
Hilsenhoff Family Biotic Index
The Hilsenhoff Family Biotic Index (FBI) is an indicator of organic and nutrient pollution and provides an estimate of water quality conditions for each site using established pollution tolerance values for benthic invertebrates. FBI results for the Jebbs Creek catchment sample location at the Perth Wildlife Reserve are summarised by year from 2005 to 2016. “Fair” to “Poor” water quality conditions were observed at the Jebbs Creek sample location (Figure 35) using a grading scheme developed by Conservation Authorities in Ontario for benthic invertebrates.
Figure 35 Hilsenhoff Family Biotic Index at the Perth Wildlife Reserve sample location
Family Richness
Family Richness measures the health of the community through its diversity and increases with increasing habitat diversity suitability and healthy water quality conditions. Family Richness is equivalent to the total number of benthic invertebrate families found within a sample. The Jebbs Creek site is reported to have “Fair” family richness (Figure 36).
Figure 36 Family Richness at the Jebbs at the Perth Wildlife Reserve location
EPT
Ephemeroptera (Mayflies), Plecoptera (Stoneflies), and Trichoptera (Caddisflies) are species considered to be very sensitive to poor water quality conditions. A high abundance of these organisms is generally an indication of good water quality conditions at a sample location. The community structure is typically dominated by species that are moderately tolerant and tolerant to poorer water quality conditions at the Jebbs Creek sample location. As a result, the EPT indicates that the Jebbs Creek sample location is reported to have “Fair” to “Poor” water quality (Figure 37) from 2005 to 2016.
Figure 37 EPT at the Jebbs Creek at the Perth Wildlife Reserve sample location
Conclusion
Overall the Jebbs Creek sample location aquatic habitat conditions from a benthic invertebrate perspective is considered “Fair to Poor” from 2005 to 2016 as the samples are dominated by species that are moderately tolerant and tolerant to high organic pollution levels.
3.3.2 Habitat Complexity
Habitat complexity is a measure of the overall diversity of habitat types and features within a stream. Streams with high habitat complexity support a greater variety of species niches, and therefore contribute to greater diversity. Factors such as substrate, flow conditions (pools, riffles) and cover material (vegetation, wood structure, etc.) all provide crucial habitat to aquatic life. Habitat complexity is assessed based on the presence of boulder, cobble and gravel substrates, as well as the presence of instream woody material.
Low to high habitat complexity was identified for Jebbs Creek (Figure 38). Regions with increased habitat complexity were observed in the lower and upper reaches of the system within the catchment.
Figure 38 Habitat complexity along Jebbs Creek
3.3.3 Instream Substrate
Diverse substrate is important for fish and benthic invertebrate habitat because some species have specific substrate requirements and for example will only reproduce on certain types of substrate. The absence of diverse substrate types may limit the overall diversity of species within a stream. Figure 39 shows the overall presence of various substrate types observed along Jebbs Creek. Substrate conditions were somewhat diverse along Jebbs Creek with all substrate types being recorded at various locations along the creek. Silt was the dominant substrate type observed along Jebbs Creek which is consistent with riverine wetland habitat. Figure 40 shows the dominant substrate type observed for each section surveyed along Jebbs Creek.
Figure 39 Instream substrate along Jebbs Creek
Figure 40 shows the dominant substrate type along Jebbs Creek
3.3.4 Instream Morphology
Pools and riffles are important habitat features for aquatic life. Riffles are fast flowing areas characterised by agitation and overturn of the water surface. Riffles thereby play a crucial role in contributing to dissolved oxygen conditions and directly support spawning for some fish species. They are also areas that support high benthic invertebrate populations which are an important food source for many aquatic species. Pools are characterised by minimal flows, with relatively deep water and winter/summer refuge habitat for aquatic species. Runs are moderately shallow, with unagitated surfaces of water and areas where the thalweg (deepest part of the channel) is in the centre of the channel. Figure 41 shows that Jebbs Creek is fairly uniform; 100 percent of sections recorded runs, five percent riffles and 33 percent of sections contained pool habitat. Figure 42 shows where the limited riffle habitat areas were observed along Jebbs Creek.
Figure 41 Instream morphology along Jebbs Creek
Figure 42 Riffle habitat locations along Jebbs Creek
3.3.5 Vegetation Type
Instream vegetation provides a variety of functions and is a critical component of the aquatic ecosystem. Aquatic plants promote stream health by:
Providing direct riparian/instream habitat
Stabilising flows reducing shoreline erosion
Contributing to dissolved oxygen through photosynthesis
Maintaining temperature conditions through shading
For example emergent plants along the shoreline can provide shoreline protection from wave action and important rearing habitat for species of waterfowl. Submerged plants provide habitat for fish to find shelter from predator fish while they feed. Floating plants such as water lilies shade the water and can keep temperatures cool while reducing algae growth. Floating plants were observed in 95% of sections surveyed, algae was observed in 90% of sections, narrow leaved emergents were present in 72% of the sections surveyed, while free floating plants were observed in 44% of surveyed sections. Broad leaved emergents were observed in 44% of sections, submerged plants in 56% and robust emergents in 15% of sections surveyed. Figure 43 depicts the plant community structure for Jebbs Creek. Figure 44 shows the dominant vegetation type observed for each section surveyed along the Jebbs Creek catchment.
Figure 43 Vegetation type along Jebbs Creek
Figure 44 Dominant vegetation type along Jebbs Creek
3.3.6 Instream Vegetation Abundance
Instream vegetation is an important factor for a healthy stream ecosystem. Vegetation helps to remove contaminants from the water, contributes oxygen to the stream, and provides habitat for fish and wildlife. Too much vegetation can also be detrimental. Figure 45 demonstrates that the Jebbs Creek reach had normal to common levels of vegetation recorded at 36 and 90 percent of stream surveys. Extensive levels of vegetation were observed along 64 percent of the surveyed sections and were consistent with areas dominated by the invasive plant known as European Frogbit.
Figure 45 Instream vegetation abundance along Jebbs Creek
3.3.7 Invasive Species
Invasive species can have major implications on streams and species diversity. Invasive species are one of the largest threats to ecosystems throughout Ontario and can out compete native species, having negative effects on local wildlife, fish and plant populations. One hundred percent of the sections surveyed along Jebbs Creek reach contained invasive species. The invasive species observed in Jebbs Creek were European frogbit and banded mystery snail. Invasive species abundance (i.e. the number of observed invasive species per section) was assessed to determine the potential range/vector of many of these species (Figure 46).
Figure 46 Invasive species abundance along Jebbs Creek
3.3.8 Water Chemistry
During the stream characterization survey, a YSI probe is used to collect water chemistry information. Dissolved oxygen (DO), specific conductivity (SPC) and pH are measured at the start and end of each section.
3.3.8.1 Dissolved Oxygen
Dissolved oxygen is a measure of the amount of oxygen dissolved in water. The Canadian Environmental Quality Guidelines of the Canadian Council of Ministers of the Environment (CCME) suggest that for the protection of aquatic life the lowest acceptable dissolved oxygen concentration should be 6 mg/L for warmwater biota and 9.5 mg/L for coldwater biota (CCME, 1999). Figure 47 shows that the dissolved oxygen in Jebbs Creek supports warmwater and in certain locations coldwater biota along the system. The average dissolved oxygen levels observed within Jebbs Creek was 9.5mg/L which is well above the recommended levels for warmwater biota.
Figure 47 Dissolved oxygen ranges in Jebbs Creek
3.3.8.2 Conductivity
Conductivity in streams is primarily influenced by the geology of the surrounding environment, but can vary drastically as a function of surface water runoff. Currently there are no CCME guideline standards for stream conductivity; however readings which are outside the normal range observed within the system are often an indication of unmitigated discharge and/or stormwater input. The average conductivity observed within the main stem of Jebbs Creek was 262.5 µs/cm. Figure 48 shows the conductivity readings for Jebbs Creek.
Figure 48 Specific conductivity ranges in Jebbs Creek
3.3.8.3 pH
Based on the PWQO for pH, a range of 6.5 to 8.5 should be maintained for the protection of aquatic life. Average pH values for Jebbs Creek averaged 7.94 thereby meeting the provincial standard (Figure 49).
Figure 49 pH ranges in Jebbs Creek
3.3.8.4 Oxygen Saturation (%)
Oxygen saturation is measured as the ratio of dissolved oxygen relative to the maximum amount of oxygen that will dissolve based on the temperature and atmospheric pressure. Well oxygenated water will stabilise at or above 100% saturation, however the presence of decaying matter/pollutants can drastically reduce these levels. Oxygen input through photosynthesis has the potential to increase saturation above 100% to a maximum of 500%, depending on the productivity level of the environment. In order to represent the relationship between concentration and saturation, the measured values have been summarised into 6 classes:
Dissolved oxygen conditions in Jebbs Creek varied along the system for both warm and coolwater species (Figure 50).
Figure 50 A bivariate assessment of dissolved oxygen concentration (mg/L) and saturation (%) in Jebbs Creek
3.3.8.5 Specific Conductivity Assessment
Specific conductivity (SPC) is a standardised measure of electrical conductance, collected at or corrected to a water temperature of 25⁰C. SPC is directly related to the concentration of ions in water, and is commonly influenced by the presence of dissolved salts, alkalis, chlorides, sulfides and carbonate compounds. The higher the concentration of these compounds, the higher the conductivity. Common sources of elevated conductivity include storm water, agricultural inputs and commercial/industrial effluents.
In order to summarise the conditions observed, SPC levels were evaluated as either normal, moderately elevated or highly elevated. These categories correspond directly to the degree of variation (i.e. standard deviation) at each site relative to the average across the system.
Normal levels were maintained along the majority of Jebbs Creek, however there were moderately elevated areas in the middle reaches (Figure 51).
Figure 51 Relative specific conductivity levels along Jebbs Creek
3.3.9 Thermal Regime
Many factors can influence fluctuations in stream temperature, including springs, tributaries, precipitation runoff, discharge pipes and stream shading from riparian vegetation. Water temperature is used along with the maximum air temperature (using the Stoneman and Jones method) to classify a watercourse as either warm water, cool water or cold water. Figure 52 shows where the thermal sampling site was located on Jebbs Creek. Analysis of the data collected indicates that Jebbs Creek is classified as a warm water system (Figure 53).
Figure 52 Temperature logger location on Jebbs Creek
Figure 53 Temperature logger data for the site on Jebbs Creek
Each point on the graph represents a temperature that meets the following criteria:
Sampling dates between July 1st and September 7th
Sampling date is preceded by two consecutive days above 24.5 °C, with no rain
Water temperatures are collected at 4pm
Air temperature is recorded as the max temperature for that day
3.3.10 Groundwater
Groundwater discharge areas can influence stream temperature, contribute nutrients, and provide important stream habitat for fish and other biota. During stream surveys, indicators of groundwater discharge are noted when observed. Indicators include: springs/seeps, watercress, iron staining, significant temperature change and rainbow mineral film. Figure 54 shows areas where one or more of the above groundwater indicators were observed during stream surveys and headwater drainage feature assessments.
Figure 54 Groundwater indicators observed in the Otty Lake catchment
3.3.11 Fish Community
The Otty Lake catchment is classified as a mixed community of warm and cool water recreational and baitfish fishery with 19 species observed. Figure 55 shows the historical and 2016 fish sampling locations in the catchment.
Figure 55 Otty Lake catchment fish community
Table 13 is a list of species observed in the watershed historically and during the 2016 sampling effort.
Table 13 Fish species observed in the Otty Lake catchment
Fish Species
Scientific Name
Fish code
Historical
2016
banded killifish
Fundulus diaphanus
BaKil
X
bluegill
Lepomis macrochirus
Blueg
X
X
bluntnose minnow
Pimephales notatus
BnMin
X
brook stickleback
Culaea inconstans
BrSti
X
brown bullhead
Ameiurus nebulosus
BrBul
X
X
burbot
Lota lota
Burbo
X
central mudminnow
Umbra limi
CeMud
X
common shiner
Luxilus cornutus
CoShi
X
X
creek chub
Semotilus atromaculatus
CrChu
X
etheostoma sp.
etheostoma sp.
EthSp
X
fallfish
Semotilus corporalis
Fallf
X
X
golden shiner
Notemigonus crysoleucas
GoShi
X
X
greater redhorse
Moxostoma valenciennesi
GrRed
X
largemouth bass
Micropterus salmoides
LmBas
X
northern pike
Esox lucius
NoPik
X
pumpkinseed
Lepomis gibbosus
Pumpk
X
X
rock bass
Ambloplites rupestris
RoBas
X
X
smallmouth bass
Micropterus dolomieu
SmBas
X
white sucker
Catostomus commersonii
WhSuc
X
X
yellow bullhead
Ameiurus natalis
YeBul
X
TOTAL Species
19
9
RVCA staff setting a fyke net at County Road 1 on Jebbs Creek in May 2016
Greater redhorse (Moxostoma valenciennesi) captured and released while fyke netting on Jebbs Creek adjacent to the Perth Wildlife Reserve
3.3.12 Migratory Obstructions
Migratory obstructions represent limitations to fish dispersal within a system and may restrict access to important spawning and rearing habitat. Migratory obstructions can be natural or manmade, and they can be permanent or seasonal. Figure 56 shows the migratory obstructions observed for the Otty Lake catchment.
Figure 56 Migratory obstructions in the Otty Lake catchment
3.3.13 Beaver Dams
Overall beaver dams create natural changes in the environment. Some of the benefits include providing habitat for wildlife, flood control, and silt retention. Additional benefits come from bacterial decomposition of woody material used in the dams which removes excess nutrient and toxins. Beaver dams can also result in flooding of agricultural fields and may also be considered potential barriers to fish migration. Figure 57 shows the types of beaver dams that were identified on the surveyed portions of Jebbs Creek in 2016.
Figure 57 Beaver Dam locations in the Otty Lake catchment
3.4 Headwater Drainage Feature Assessment
3.4.1 Headwaters Sampling Locations
The RVCA Stream Characterization program assessed Headwater Drainage Features for the Otty Lake catchment in 2017. This protocol measures zero, first and second order headwater drainage features (HDF). It is a rapid assessment method characterizing the amount of water, sediment transport, and storage capacity within headwater drainage features (HDF). RVCA is working with other Conservation Authorities and the Ministry of Natural Resources and Forestry to implement the protocol with the goal of providing standard datasets to support science development and monitoring of headwater drainage features. An HDF is a depression in the land that conveys surface flow. Additionally, this module provides a means of characterizing the connectivity, form and unique features associated with each HDF (OSAP Protocol, 2013). In 2017 the program sampled 32 sites at road crossings in the Otty Lake catchment area (Figure 58).
Figure 58 Location of the headwater sampling sites in the Otty Lake catchment
3.4.2 Headwater Feature Type
The headwater sampling protocol assesses the feature type in order to understand the function of each feature. The evaluation includes the following classifications: defined natural channel, channelized or constrained, multi-thread, no defined feature, tiled, wetland, swale, roadside ditch and pond outlet. By assessing the values associated with the headwater drainage features in the catchment area we can understand the ecosystem services that they provide to the watershed in the form of hydrology, sediment transport, and aquatic and terrestrial functions. The headwater drainage features in the Otty Lake catchment are primarily classified as wetland and natural features. Figure 59 shows the feature type of the primary feature at the sampling locations.
Figure 59 Headwater feature types in the Otty Lake catchment
A spring photo of the headwater sample site on Mackler Side Road
A summer photo of the headwater sample site on Mackler Side Road
3.4.3 Headwater Feature Flow
The observed flow condition within headwater drainage features can be highly variable depending on timing relative to the spring freshet, recent rainfall, soil moisture, etc. Flow conditions are assessed in the spring and in the summer to determine if features are perennial and flow year round, if they are intermittent and dry up during the summer months or if they are ephemeral systems that do not flow regularly and generally respond to specific rainstorm events or snowmelt. Flow conditions in headwater systems can change from year to year depending on local precipitation patterns. Figure 60 shows the observed flow condition at the sampling locations in the Otty Lake catchment in 2017.
Figure 60 Headwater feature flow conditions in the Otty Lake catchment
3.4.4 Feature Channel Modifications
Channel modifications were assessed at each headwater drainage feature sampling location. Modifications include channelization, dredging, hardening and realignments. Figure 61 shows the channel modifications observed at the sampling locations for the Otty Lake. The majority of the headwater features had no modifications observed at the sample locations.
Figure 61 Headwater feature channel modifications in the Otty Lake catchment
3.4.5 Headwater Feature Vegetation
Headwater feature vegetation evaluates the type of vegetation that is found within the drainage feature. The type of vegetation within the channel influences the aquatic and terrestrial ecosystem values that the feature provides. For some types of headwater features the vegetation within the feature plays a very important role in flow and sediment movement and provides fish and wildlife habitat. The following classifications are evaluated no vegetation, lawn, wetland, meadow, scrubland and forest. The features assessed were classified as being dominated by wetland and meadow. Figure 62 depicts the dominant vegetation observed at the sampled headwater sites in the Otty Lake catchment.
Figure 62 Headwater feature vegetation types in the Otty Lake catchment
3.4.6 Headwater Feature Riparian Vegetation
Headwater riparian vegetation evaluates the type of vegetation that is found along the adjacent lands of a headwater drainage feature. The type of vegetation within the riparian corridor influences the aquatic and terrestrial ecosystem values that the feature provides to the watershed. The sample locations were dominated by natural vegetation. Figure 63 depicts the type of riparian vegetation observed at the sampled headwater sites in the Otty Lake catchment.
Figure 63 Headwater feature riparian vegetation types in the Otty Lake catchment
3.4.7 Headwater Feature Sediment Deposition
Assessing the amount of recent sediment deposited in a channel provides an index of the degree to which the feature could be transporting sediment to downstream reaches (OSAP, 2013). Evidence of excessive sediment deposition might indicate the requirement to follow up with more detailed targeted assessments upstream of the site location to identify potential best management practices to be implemented. Conditions ranged from no deposition observed to extensive deposition recorded. Figure 64 depicts the degree of sediment deposition observed at the sampled headwater sites in the Otty Lake catchment.
Figure 64 Headwater feature sediment deposition in the Otty Lake catchment
3.4.8 Headwater Feature Upstream Roughness
Feature roughness will provide a measure of the amount of materials within the bankfull channel that could slow down the velocity of water flowing within the headwater feature (OSAP, 2013). Materials on the channel bottom that provide roughness include vegetation, woody debris and boulders/cobble substrates. Roughness can provide benefits in mitigating downstream erosion on the headwater drainage feature and the receiving watercourse by reducing velocities. Roughness also provides important habitat conditions to aquatic organisms. Figure 65 shows the feature roughness conditions at the sampling location in the Otty Lake catchment.
Figure 65 Headwater feature roughness in the Otty Lake catchment
Land cover and any change in coverage that has occurred over a six year period is summarised for the Otty Lake catchment using spatially continuous vector data representing the catchment during the spring of 2008 and 2014. This dataset was developed by the RVCA through heads-up digitization of 20cm DRAPE ortho-imagery at a 1:4000 scale and details the surrounding landscape using 10 land cover classes.
4.1 Otty LakeCatchment Change
As shown in Table 14 and Figure 1 (see the Introduction section of this report), the dominant land cover type in 2014 is woodland.
Table 14 Land cover in the Otty Lake catchment (2008 vs. 2014)
Land Cover
2008
2014
Change - 2008 to 2014
Area
Area
Area
Ha
Percent
Ha
Percent
Ha
Percent
Woodland*
2140
41
2133
41
-7
Wetland **
1112
21
1112
21
>Evaluated
(159)
(3)
(159)
(3)
(0)
(0)
>Unevaluated
(953)
(18)
(953)
(18)
(0)
(0)
Water
766
14
766
14
Crop and Pasture
696
13
693
13
-3
Settlement
252
5
263
5
11
Transportation
167
3
167
3
Meadow-Thicket
152
3
151
3
-1
* Does not include treed swamps ** Includes treed swamps
From 2008 to 2014, there was an overall change of 11 hectares (from one land cover class to another). Most of the change in the Otty Lake catchment is a result of the conversion of crop and pastureland, meadow-thicket and woodland to settlement (Figure 66).
Figure 66 Land cover change in the Otty Lake catchment (2008 to 2014)
Table 15 provides a detailed breakdown of all land cover change that has taken place in the Otty Lake catchment between 2008 and 2014.
Table 15 Land cover change in the Otty Lake catchment (2008 to 2014)
Land Cover
Change - 2008 to 2014
Area
Ha.
Percent
Woodland to Settlement
6.9
62.5
Crop and Pasture to Settlement
3
27.6
Meadow-Thicket to Settlement
0.9
8
Woodland to Transportation
0.1
1.3
Woodland to Crop and Pasture
0.1
0.6
4.2 Woodland Cover
In the Environment Canada Guideline (Third Edition) entitled “How Much Habitat Is Enough?” (hereafter referred to as the “Guideline”) the opening narrative under the Forest Habitat Guidelines section states that prior to European settlement, forest was the predominant habitat in the Mixedwood Plains ecozone. The remnants of this once vast forest now exist in a fragmented state in many areas (including the Rideau Valley watershed) with woodland patches of various sizes distributed across the settled landscape along with higher levels of forest cover associated with features such as the Frontenac Axis (within the on-Shield areas of the Rideau Lakes and Tay River subwatersheds). The forest legacy, in terms of the many types of wildlife species found, overall species richness, ecological functions provided and ecosystem complexity is still evident in the patches and regional forest matrices (found in the Tay River subwatershed and elsewhere in the Rideau Valley watershed). These ecological features are in addition to other influences which forests have on water quality and stream hydrology including reducing soil erosion, producing oxygen, storing carbon along with many other ecological services that are essential not only for wildlife but for human well-being.
The Guideline also notes that forests provide a great many habitat niches that are in turn occupied by a great diversity of plant and animal species. They provide food, water and shelter for these species - whether they are breeding and resident locally or using forest cover to help them move across the landscape. This diversity of species includes many that are considered to be species at risk. Furthermore, from a wildlife perspective, there is increasing evidence that the total forest cover in a given area is a major predictor of the persistence and size of bird populations, and it is possible or perhaps likely that this pattern extends to other flora and fauna groups. The overall effect of a decrease in forest cover on birds in fragmented landscapes is that certain species disappear and many of the remaining ones become rare, or fail to reproduce, while species adapted to more open and successional habitats, as well as those that are more tolerant to human-induced disturbances in general, are able to persist and in some cases thrive. Species with specialised habitat requirements are most likely to be adversely affected. The overall pattern of distribution of forest cover, the shape, area and juxtaposition of remaining forest patches and the quality of forest cover also play major roles in determining how valuable forests will be to wildlife and people alike.
The current science generally supports minimum forest habitat requirements between 30 and 50 percent, with some limited evidence that the upper limit may be even higher, depending on the organism/species phenomenon under investigation or land-use/resource management planning regime being considered/used.
As shown in Figure 67, 41 percent of the Otty Lake catchment contains 2133 hectares of upland forest and 42 hectares of lowland forest (treed swamps) versus the 47 percent of woodland cover in the Tay River subwatershed. This is greater than the 30 percent of forest cover that is identified as the minimum threshold required to sustain forest birds according to the Guideline and which may only support less than one half of potential species richness and marginally healthy aquatic systems. When forest cover drops below 30 percent, forest birds tend to disappear as breeders across the landscape.
Figure 67 Woodland cover and forest interior in the Otty Lake catchment (2014)
4.2.1 Woodland (Patch) Size
According to the Ministry of Natural Resources’ Natural Heritage Reference Manual (Second Edition), larger woodlands are more likely to contain a greater diversity of plant and animal species and communities than smaller woodlands and have a greater relative importance for mobile animal species such as forest birds.
Bigger forests often provide a different type of habitat. Many forest birds breed far more successfully in larger forests than they do in smaller woodlots and some rely heavily on forest interior conditions. Populations are often healthier in regions with more forest cover and where forest fragments are grouped closely together or connected by corridors of natural habitat. Small forests support small numbers of wildlife. Some species are “area-sensitive” and tend not to inhabit small woodlands, regardless of forest interior conditions. Fragmented habitat also isolates local populations, especially small mammals, amphibians and reptiles with limited mobility. This reduces the healthy mixing of genetic traits that helps populations survive over the long run (Conserving the Forest Interior. Ontario Extension Notes, 2000).
The Environment Canada Guideline also notes that for forest plants that do not disperse broadly or quickly, preservation of some relatively undisturbed large forest patches is needed to sustain them because of their restricted dispersal abilities and specialised habitat requirements and to ensure continued seed or propagation sources for restored or regenerating areas nearby.
The Natural Heritage Reference Manual continues by stating that a larger size also allows woodlands to support more resilient nutrient cycles and food webs and to be big enough to permit different and important successional stages to co-exist. Small, isolated woodlands are more susceptible to the effects of blowdown, drought, disease, insect infestations, and invasions by predators and non-indigenous plants. It is also known that the viability of woodland wildlife depends not only on the characteristics of the woodland in which they reside, but also on the characteristics of the surrounding landscape where the woodland is situated. Additionally, the percentage of forest cover in the surrounding landscape, the presence of ecological barriers such as roads, the ability of various species to cross the matrix surrounding the woodland and the proximity of adjacent habitats interact with woodland size in influencing the species assemblage within a woodland.
In the Otty Lake catchment (in 2014), one hundred and forty-eight (52 percent) of the 285 woodland patches are very small, being less than one hectare in size. Another 121 (42 percent) of the woodland patches ranging from one to less than 20 hectares in size tend to be dominated by edge-tolerant bird species. The remaining 16 (six percent of) woodland patches range between 22 and 709 hectares in size. Thirteen of these patches contain woodland between 20 and 100 hectares and may support a few area-sensitive species and some edge intolerant species, but will be dominated by edge tolerant species.
Conversely, three (one percent) of the 285 woodland patches in the drainage area exceed the 100 plus hectare size needed to support most forest dependent, area sensitive birds and are large enough to support approximately 60 percent of edge-intolerant species. One patch tops 200 hectares, which according to the Environment Canada Guideline will support 80 percent of edge-intolerant forest bird species (including most area sensitive species) that prefer interior forest habitat conditions.
Table 16 presents a comparison of woodland patch size in 2008 and 2014 along with any changes that have occurred over that time. A decrease (of seven hectares) has been observed in the overall woodland patch area between the two reporting periods with most change occurring in the 1 to 20 woodland patch size class range.
Table 16 Woodland patches in the Otty Lake catchment (2008 and 2014)
Woodland Patch Size Range (ha)
Woodland* Patches
Patch Change
2008
2014
2008 to 2014
Number
Area
Number
Area
Number
Area
Count
Percent
Ha
Percent
Count
Percent
Ha
Percent
Count
Ha
Less than 1
142
51
56
3
148
52
57
3
6
1
1 to 20
122
43
631
29
121
42
625
29
-1
-6
20 to 50
11
4
384
17
11
4
384
18
50 to 100
2
1
172
8
2
1
172
8
100 to 200
2
1
228
10
2
1
228
10
Greater than 200
1
<1
711
33
1
<1
709
32
-2
Totals
280
100
2182
100
285
100
2175
100
5
-7
*Includes treed swamps
4.2.2 Woodland (Forest) Interior Habitat
The forest interior is habitat deep within woodlands. It is a sheltered, secluded environment away from the influence of forest edges and open habitats. Some people call it the “core” or the “heart” of a woodland. The presence of forest interior is a good sign of woodland health, and is directly related to the woodland’s size and shape. Large woodlands with round or square outlines have the greatest amount of forest interior. Small, narrow woodlands may have no forest interior conditions at all. Forest interior habitat is a remnant natural environment, reminiscent of the extensive, continuous forests of the past. This increasingly rare forest habitat is now a refuge for certain forest-dependent wildlife; they simply must have it to survive and thrive in a fragmented forest landscape (Conserving the Forest Interior. Ontario Extension Notes, 2000).
The Natural Heritage Reference Manual states that woodland interior habitat is usually defined as habitat more than 100 metres from the edge of the woodland and provides for relative seclusion from outside influences along with a moister, more sheltered and productive forest habitat for certain area sensitive species. Woodlands with interior habitat have centres that are more clearly buffered against the edge effects of agricultural activities or more harmful urban activities than those without.
In the Otty Lake catchment (in 2014), the 285 woodland patches contain 26 forest interior patches (Figure 67) that occupy three percent (147 ha.) of the catchment land area (which is less than the five percent of interior forest in the Tay River Subwatershed). This is below the ten percent figure referred to in the Environment Canada Guideline that is considered to be the minimum threshold for supporting edge intolerant bird species and other forest dwelling species in the landscape.
Most patches (23) have less than 10 hectares of interior forest, fifteen of which have small areas of interior forest habitat less than one hectare in size. The remaining three patches contain interior forest between 11 and 90 hectares in area. Between 2008 and 2014, there has been a small change in the number of woodland patches containing interior habitat with an overall loss of four hectares in the catchment (Table 17).
Table 17 Woodland interior in the Otty Lake catchment (2008 and 2014)
Woodland Interior Habitat Size Range (ha)
Woodland Interior
Interior Change
2008
2014
2008 to 2014
Number
Area
Number
Area
Number
Area
Count
Percent
Ha
Percent
Count
Percent
Ha
Percent
Count
Ha
Less than 1
15
56
3
2
15
58
3
2
1 to 10
9
33
28
19
8
30
25
17
-1
-3
10 to 30
2
7
29
19
2
8
29
20
50 to 100
1
4
91
60
1
4
90
61
-1
Totals
27
100
151
100
26
100
147
100
-1
-4
4.3 Wetland Cover
Wetlands are habitats forming the interface between aquatic and terrestrial systems. They are among the most productive and biologically diverse habitats on the planet. By the 1980s, according to the Natural Heritage Reference Manual, 68 percent of the original wetlands south of the Precambrian Shield in Ontario had been lost through encroachment, land clearance, drainage and filling.
Wetlands perform a number of important ecological and hydrological functions and provide an array of social and economic benefits that society values. Maintaining wetland cover in a watershed provides many ecological, economic, hydrological and social benefits that are listed in the Reference Manual and which may include:
contributing to the stabilisation of shorelines and to the reduction of erosion damage through the mitigation of water flow and soil binding by plant roots
mitigating surface water flow by storing water during periods of peak flow (such as spring snowmelt and heavy rainfall events) and releasing water during periods of low flow (this mitigation of water flow also contributes to a reduction of flood damage)
contributing to an improved water quality through the trapping of sediments, the removal and/or retention of excess nutrients, the immobilization and/or degradation of contaminants and the removal of bacteria
providing renewable harvesting of timber, fuel wood, fish, wildlife and wild rice
contributing to a stable, long-term water supply in areas of groundwater recharge and discharge
providing a high diversity of habitats that support a wide variety of plants and animals
acting as “carbon sinks” making a significant contribution to carbon storage
providing opportunities for recreation, education, research and tourism
Historically, the overall wetland coverage within the Great Lakes basin exceeded 10 percent, but there was significant variability among watersheds and jurisdictions, as stated in the Environment Canada Guideline. In the Rideau Valley Watershed, it has been estimated that pre-settlement wetland cover averaged 35 percent using information provided by Ducks Unlimited Canada (2010) versus the 21 percent of wetland cover existing in 2014, derived from DRAPE imagery analysis.
Figure 68 Wetland cover in the Otty Lake catchment (Historic to 2014)
This decline in wetland cover is also evident in the Otty Lake catchment (as seen in Figure 68 and summarised in Table 18), where wetland was reported to cover 31 percent of the area prior to settlement, as compared to 21 percent in 2014. This represents a 31 percent loss of historic wetland cover. To maintain critical hydrological, ecological functions along with related recreational and economic benefits provided by these wetland habitats in the catchment, a “no net loss” of currently existing wetlands should be employed to ensure the continued provision of tangible benefits accruing from them to landowners and surrounding communities.
Table 18 Wetland cover in the Otty Lake catchment (Historic to 2014)
Wetland Cover
Pre-settlement
2008
2014
Change - Historic to 2014
Area
Area
Area
Area
Ha
Percent
Ha
Percent
Ha
Percent
Ha
Percent
Otty Lake
1616
31
1112
21
1112
21
-504
-31
Tay River
n/a
n/a
15280
19
15330
19
n/a
n/a
Rideau Valley
134115
35
n/a
n/a
82076
21
-52039
-39
4.4 Shoreline Cover
The riparian or shoreline zone is that special area where the land meets the water. Well-vegetated shorelines are critically important in protecting water quality and creating healthy aquatic habitats, lakes and rivers. Natural shorelines intercept sediments and contaminants that could impact water quality conditions and harm fish habitat in streams. Well established buffers protect the banks against erosion, improve habitat for fish by shading and cooling the water and provide protection for birds and other wildlife that feed and rear young near water. A recommended target (from the Environment Canada Guideline) is to maintain a minimum 30 metre wide vegetated buffer along at least 75 percent of the length of both sides of rivers, creeks and streams.
Figure 69 shows the extent of the ‘Natural’ vegetated riparian zone (predominantly wetland/woodland features) and ‘Other’ anthropogenic cover (crop/pastureland, roads/railways, settlements) along a 30-metre-wide area of land around Otty and McLaren Lake, other lakes and along both sides of the shoreline of Jebbs Creek and the many unnamed watercourses (including headwater streams) found in the Otty Lake catchment.
Figure 69 Natural and other riparian land cover in the Otty Lake catchment (2014)
This analysis shows that the OttyLake catchment riparian buffer is composed of wetland (44 percent), woodland (37 percent), crop and pastureland (eight percent), settlement (eight percent), roads (two percent) and meadow-thicket (one percent). Along the many watercourses (including headwater streams) flowing into Otty and McLaren Lake, the riparian buffer is composed of wetland (51 percent), woodland (32 percent), crop and pastureland (12 percent), roads (two percent), settlement areas (two percent) and meadow-thicket (one percent).
Around OttyLake itself, the shoreline buffer is dominated by woodland (48 percent) and cottages, houses and camps (35 percent) with the remainder comprised of wetland (14 percent), roads (three percent) and crop and pastureland (less than one percent). The shoreline buffer around McLaren Lake is dominated by woodland (51 percent) and wetland (49 percent). Along Jebbs Creek, the riparian zone is composed of wetland (83 percent), woodland (ten percent), settlement (five percent), crop and pastureland (one percent) and roads (one percent).
Additional statistics for the Otty Lake catchment are presented in Tables 19 to 23 and show that there has been little to no change in shoreline cover from 2008 to 2014.
Table 19 Riparian land cover in the Otty Lake Creek catchment (2008 vs. 2014)
Riparian Land Cover
2008
2014
Change - 2008 to 2014
Area
Area
Area
Ha.
Percent
Ha.
Percent
Ha.
Percent
Wetland
269.59
43.76
269.59
43.76
0.00
0.00
> Unevaluated
(266.25)
(43.22)
(266.25)
(43.22)
(0.00)
(0.00)
> Evaluated
(3.34)
(0.54)
(3.34)
(0.54)
(0.00)
(0.00)
Woodland
224.96
36.52
224.64
36.47
-0.32
-0.05
Crop & Pasture
52.20
8.47
52.10
8.46
-0.10
-0.01
Settlement
48.06
7.80
48.48
7.87
0.42
0.07
Transportation
14.10
2.29
14.10
2.29
0.00
0.00
Meadow-Thicket
7.13
1.16
7.13
1.16
0.00
0.00
Table 20 Riparian land cover around Otty Lake (2008 vs. 2014)
Riparian Land Cover
2008
2014
Change - 2008 to 2014
Area
Area
Area
Ha.
Percent
Ha.
Percent
Ha.
Percent
Woodland
53.59
47.92
53.38
47.73
-0.21
-0.19
Settlement
38.59
34.51
38.87
34.76
0.28
0.25
Wetland
15.22
13.62
15.22
13.62
0.00
0.00
> Unevaluated
(15.22)
(13.62)
(15.22)
(13.62)
(0.00)
(0.00)
Transportation
3.62
3.24
3.62
3.24
0.00
0.00
Crop and Pasture
0.79
0.71
0.72
0.65
-0.07
-0.06
Table 21 Riparian land cover around McLaren Lake (2008 vs. 2014)
Riparian Land Cover
2008
2014
Change - 2008 to 2014
Area
Area
Area
Ha.
Percent
Ha.
Percent
Ha.
Percent
Woodland
4.82
50.68
4.82
50.68
0.00
0.00
Wetland
4.69
49.32
4.69
49.32
0.00
0.00
> Unevaluated
(4.69)
(49.32)
(4.69)
(49.32)
(0.00)
(0.00)
Table 22 Riparian land cover along Jebbs Creek (2008 vs. 2014)
Riparian Land Cover
2008
2014
Change - 2008 to 2014
Area
Area
Area
Ha.
Percent
Ha.
Percent
Ha.
Percent
Wetland
20.6
83.41
20.6
83.41
0.00
0.00
> Unevaluated
(20.55)
(83.22)
(20.55)
(83.22)
(0.00)
(0.00)
>Evaluated
(0.05)
(0.19)
(0.05)
(0.19)
(0.00)
(0.00)
Woodland
2.52
10.22
2.52
10.22
0.00
0.00
Settlement
1.14
4.63
1.14
4.63
0.00
0.00
Crop & Pasture
0.27
1.1
0.27
1.1
0.00
0.00
Transportation
0.16
0.64
0.16
0.64
0.00
0.00
Table 23 Riparian land cover along streams in the Otty Lake Catchment (2008 vs. 2014)
5.0 Otty Lake Catchment: Stewardship and Water Resources Protection
The RVCA and its partners are working to protect and enhance environmental conditions in the Tay River Watershed. Figure 70 shows the location of all stewardship projects completed in the Otty Lake catchment.
Figure 70 Stewardship site locations in the Otty Lake catchment
5.1 Rural Clean Water
The Rural Clean Water Program provides technical and financial assistance to farmers and other rural landowners, to aid in the implementation of projects that protect water quality. Funding is granted to those projects that support best management practices for application in the protection and improvement of surface and ground water resources. The program also supports climate change adaptation and low impact development projects as well as educating rural landowners about environmental stewardship of private property. Examples of supported projects include livestock exclusion fencing, controlled tile drainage, cover crops, erosion control, well related projects, and many more. For a list of eligible projects and to apply for funding, see Rural Clean Water.
In the Otty Lake catchment from 2011 to 2016, seven septic system repairs, two erosion control projects, one windbreak/buffer and one well upgrade were completed; prior to this, eight septic system repairs, eight well upgrades, three education initiatives, one manure storage facility, one milkhouse wastewater treatment project, one well decommissioning, one well replacement and one livestock fencing project had been completed. When combined, these projects are keeping 26.41 kilograms of Phosphorus out of our lakes, rivers and streams every year. Total value of all 35 projects is $325,662 with $64,241 of that amount funded through grant dollars from the RVCA.
5.2 Private Land Forestry
Forest cover and tree planting continues to be one of the most widely supported strategies to improve our environment. The many benefits of forest cover include carbon sequestration, flood mitigation and water quality improvement as well as providing wildlife habitat.
Through the RVCA's Trees for Tomorrow Program (and its predecessors), 5,800 trees were planted at two sites from 2011 to 2016; prior to this, 9,747 trees were planted at six sites. In total, 15,547 trees have been planted resulting in the reforestation of seven hectares. Total project value of all eight projects in the Otty Lake catchment is $35,523 with $25,029 of that amount coming from fundraising sources. For more information about the Program and landowner eligibility, please see the following: Tree Planting in the Rideau Valley Watershed and Trees for Tomorrow.
An additional 191 butternut trees were planted through the RVCA Butternut Recovery Program at 42 project locations, as part of efforts to introduce healthy seedlings from tolerant butternuts into various locations across Eastern Ontario.
5.3 Shoreline Naturalization
Natural shoreline buffers rich in native plants are critically important to protecting the health of our lakes, rivers and streams. Shoreline vegetation protects water quality and aquatic habitat by intercepting potentially harmful contaminants such as nutrients, pollutants and sediment, regulating water temperatures, slowing runoff and providing important fish and wildlife habitat. Natural shorelines also help improve climate change resiliency by increasing flood storage and providing protection from erosion during extreme weather events.
Though the RVCA’s Shoreline Naturalization Program, landowners (private and public property owners) have naturalized more than 2.3 km of shoreline in the Tay Watershed by planting over 10,563 native trees and shrubs at 96 sites since 2008. In the Otty Lake catchment, a total of 2,506 native trees and shrubs have been planted along 407 metres of shoreline at an average buffer width of three metres for a total project value of $19,479. A number of these projects have been undertaken in partnership with community groups. The Program has also provided the Otty Lake Association with 1,500 native tree, shrubs and wildflowers that have been distributed to property owners around Otty Lake and supported a Toronto Dominion Friends of the Environment Tree Day hosted by RVCA at the Perth Wildlife Reserve, which saw the planting of 300 trees and shrubs by local volunteers in 2016. This was followed up in 2017 by a volunteer group planting native wildflowers at the Perth Wildlife Reserve to enhance the butterfly garden for local pollinators.
5.4 Fish and Wetland Habitat Improvement
Two fish and wetland improvement projects have been completed in the Otty Lake catchment in recent years: 1) The Otty Lake Association collaborated with the Rideau Valley Conservation Authority on the Otty Lake Fish Habitat Enhancement project to improve the recreational fishery for smallmouth bass and 2) The Jebbs Creek Wetland Embayment was completed by the RVCA to enhance fish and wetland habitat along Jebbs Creek. Sixteen hundred square metres of fish habitat were created and 15 volunteers planted a mixture of 125 native trees and shrubs and trees around the new wetland feature.
5.5 Septic System Re-inspection
Septic system re-inspection is provided by the RVCA through the Mississippi Rideau Septic System Office at the request of Drummond/North Elmsley and Tay Valley Townships.
Since 2004, the service has performed 357 mandatory and voluntary septic system re-inspections on 257 properties in the Otty Lake catchment, of which, nine voluntary inspections were conducted on seven properties around McLaren and Mud Lake (with only one system needing remedial work) along with 348 mandatory re-inspectionson 250 properties around Otty Lake. Remedial/maintenance work (i.e. pump outs and baffle replacements that generally do not require a permit) was advocated for 18 of those inspections on Otty Lake, septic system replacements required at another seven properties along with more information being requested during another two inspections.
5.6 Valley, Stream, Wetland and Hazard Lands
The Otty Lake catchment covers 53 square kilometres with 3.5 square kilometres (or seven percent) of the drainage area being within the regulation limit of Ontario Regulation 174/06 (Figure 71), giving protection to wetland areas and river or stream valleys that are affected by flooding and erosion hazards.
Wetlands occupy 11 square kilometres (or 21 percent) of the catchment. Of these wetlands, two square kilometres (or 18 percent) are designated as provincially significant and included within the RVCA regulation limit. This leaves the remaining 9 sq. km (or 82 percent) of wetlands in the catchment outside the regulated area limit.
Of the 98.6 kilometres of stream in the catchment, regulation limit mapping has been plotted along 5.6 kilometres of streams (representing six percent of all streams in the catchment). Some of these regulated streams (0.6 km) flow through regulated wetlands; the remaining five kilometres of regulated streams are located outside of those wetlands. Plotting of the regulation limit on the remaining 93 kilometres (or 94 percent) of streams requires identification of flood and erosion hazards and valley systems.
Within those areas of the Otty Lake catchment subject to the regulation (limit), efforts (have been made and) continue through RVCA planning and regulations input and review to manage the impact of development (and other land management practices) in areas where “natural hazards” are associated with rivers, streams, valley lands and wetlands. For areas beyond the regulation limit, protection of the catchment’s watercourses is only provided through the “alteration to waterways” provision of the regulation.
Figure 71 Regulated natural features and hazards in the Otty Lake catchment
5.7 Vulnerable Drinking Water Areas
Mississippi-Rideau Source Water Protection Program has mapped the north boundary of the Otty Lake catchment as a Significant Groundwater Recharge Areas and all of the catchment as a Highly Vulnerable Aquifer. This means that the nature of the overburden (thin soils, fractured bedrock) does not provide a high level of protection for the underlying groundwater making the aquifer more vulnerable to contaminants released on the surface. There are no Well-Head protection Areas in the catchment.
The Mississippi-Rideau Source Protection Plan includes policies that focus on the protection of groundwater region-wide due to the fact that most of the region, which encompasses the Mississippi and Rideau watersheds, is considered Highly Vulnerable Aquifer. For detailed maps and policies that have been developed to protect drinking water sources, visit the Mississippi-Rideau Source Protection Region website.
Developed by the Otty Lake Association and its partners, the Otty Lake Management Plan (2008) and Five-year Review (2014) provide information on many aspects of the lake environment, as well as issues of concern and actions to be taken to maintain and improve the long-term health of the lake. The following list includes some of the accomplishments of the Otty Lake Association and residents that have implications for the well-being of the land and water resources of the lake ecosystem. Specific achievements of the Otty Lake community are indicated by an asterisk.
Otty Lake and Catchment Health
Flood Risk
The 1:100 year flood elevation is available for Otty Lake and can be utilized as an additional factor to be considered when assessing site specific development setbacks.
Septic Inspections
Mandatory septic re-inspection programs for shoreline properties on Otty Lake were introduced by the Townships of Tay Valley in 2012 and Drummond/North Elmsley in 2013. This action was supported by the Otty Lake Association (OLA). A properly functioning septic system is important to reduce bacteria and nutrient inputs to the lake.*
357 mandatory and voluntary septic system re-inspections have been conducted by the Mississippi Rideau Septic System Office on 257 properties around McLaren, Mud and Otty Lake, as a service provided to Drummond/North Elmsley and Tay Valley Townships since 2004.
Shoreline Assessment Report
In 2013, an assessment of the Otty Lake shoreline was carried out under the Love Your Lake Program. Out of the 482 properties assessed, 74 (15 percent) were classified as majority natural, 172 (36 percent) as majority ornamental and 236 (49 percent) as majority regenerative. It is recognised that ornamental or degraded waterfronts will contribute additional nutrients and sediments to a waterbody such as Otty Lake.
Love Your Lake shoreline assessment reports were provided to all property owners regarding the state of their waterfront. These individual reports are confidential and provide recommendations for reducing the impact on lake water quality. An overall assessment of lake shorelines was also made available and an improvement in the naturalization of shorelines was noted in a comparison with a previous survey done in 2005.*
Shoreline Naturalization
In 2009 the OLA introduced a program of offering shoreline plants to Otty Lake residents at subsidized cost with assistance from the RVCA. The choice of plants and the number and size of plants on offer has varied from year-to-year. As of 2017, 1,825 shrubs and trees and 295 native wildflowers have been distributed to lake residents.*
2,506 native trees and shrubs have been planted at 21 project sites along 407 metres of shoreline with services provided by the RVCA Shoreline Naturalization Program.
Tree Planting
11,550 trees have been planted at three sites in the Otty Lake catchment by the RVCA Private Land Forestry Program, resulting in the reforestation of seven hectares.
Water Quality
Volunteers from the Otty Lake Association (OLA) conduct an ongoing E.coli sampling program taking 50 or more samples annually at locations around the lake. Results are generally very good, well within the provincial standard for swimming. These OLA volunteers also participate in the MOECC Lake Partner Program sampling for Total Phosphorus and measuring Secchi depths. Additional sampling for phosphorus and nitrogen is done by OLA volunteers to supplement the RVCA and the Lake Partner Program. The OLA Lake Steward maintains a water quality database that is made available to the RVCA.*
McLaren Lake and Otty Lake are each sampled yearly by the RVCA for five parameters, four times a year along with one stream site on Jebbs Creek being sampled yearly for 22 parameters, six times a year to assess surface chemistry water quality conditions.
One Ontario Benthic Biomonitoring Network site on Jebbs Creek is sampled yearly by the RVCA in the spring and fall of each year with three replicates, to assess instream biological water quality conditions.
21 Rural Clean Water projects were completed by the RVCA Rural Clean Water Program.
Zebra Mussel Monitoring
A program for monitoring Zebra Mussels on collection platforms deployed around Otty Lake was initiated by the OLA in 2014. The abundance of the mussels is cyclic and had declined by 2017.*
Otty Lake and Catchment Habitat
Calendars
The OLA has produced calendars most years featuring the flora or fauna of the Otty Lake watershed. These calendars usually have a stewardship focus and help promote living in harmony with the natural aspects of the lake environment.*
Construction of Wood Duck Nesting and Bat Boxes
In 2015 and 2016 OLA volunteers, with the help of the RVCA, constructed bird and bat boxes. Seventeen wood duck boxes, 15 swallow/bluebird boxes and 26 bat boxes were assembled. These boxes were made available to lake residents and installed at various locations around the lake.*
Fish Habitat
Over a period of four years starting in 2013, a major fish habitat enhancement project was undertaken at Otty Lake. This work was led by the RVCA and the OLA with many community volunteers. Spawning beds for smallmouth bass were constructed during the first three years. Nests for both smallmouth and largemouth bass were constructed in 2016. Approximately 275 nests were constructed along with the deployment of underwater brush bundles. The occupancy of the nests during the spawning season increased to 55 % by 2016, a remarkable success rate.*
The report "Fish Habitat of the Tay River Watershed: Existing Conditions and Opportunities for Enhancement" was prepared in 2002 by MNR, RVCA, Parks Canada and DFO. A number of specific fish habitat enhancement projects are identified in the report to improve the fishery in Otty Lake and along Jebbs Creek (see pp.117-123).
In-stream Habitat
3.9 kilometres of Jebbs Creek have been surveyed and 32 headwaters sites are sampled once every six years by the RVCA Stream Characterisation Program.
Loon Survey
A loon mapping survey was initiated in April 2016 and is managed by an OLA volunteer. Loon observations noted by lake residents and cottagers are forwarded to the volunteer who incorporates the observations into a map. This map is updated on a regular basis and can be viewed on the OLA website. Annual observations of loons and their offspring on Otty Lake have been reported to Bird Studies Canada/Canadian Lake Loon Survey since 1991.*
Otty Lake Community Feedback
Bear Aware Workshop
In 2017 a black bear awareness workshop was organised by the OLA. A representative of the Ministry of Natural Resources and Forestry was the speaker; over 40 people attended.*
State of the Lake Report
An annual State of the Lake Report was initiated by the OLA in 2014. This comprehensive report provides information regarding water quality, the lake fishery, wildlife habitat, shoreline planting initiatives, the amounts of zebra mussels and algae, among many other topics.*
Website, Newsletter and Summer Information Package
The OLA continues its long standing practice of communicating with lake residents through a newsletter published three times a year and an annual Information Package which is delivered to lake residents by an OLA Area Counsellor. The Otty Lake Association maintains an extensive website for lake residents.*
Otty Lake Association Leadership
Lake Planning
In 2013 a five-year review of the Otty Lake Management Plan was undertaken. Over 200 lake residents and cottagers participated in the associated survey. The results of this review were used to provide guidance to the OLA in developing activities and programs identified by members of the lake community.*
Liaison with Other Lake Associations
The OLA continues to liaise with other local lake associations through its participation in the Lake Networking Group.*
Management of Lake Activities
The OLA has an active 15 member board that meets four times a year. A team of Area Counsellors facilitates interaction between the Board and lake residents and cottagers. A well-attended AGM is held in July.*
Developed by the Otty Lake Association and its partners, the Otty Lake Management Plan (2008) and Five-year Review (2014) provide information on many aspects of the lake environment, as well as issues of concern identified by the lake community that could threaten the long-term health of the lake. The following list includes some of those identified issues that have implications for the water and land resources of the lake ecosystem. Specific issues noted by the lake community are indicated by an asterisk.
Development
Waterfront property development is occurring primarily through the transformation of traditional, seasonal cottages into larger year-round dwellings. This transition is taking place either through re-development of an existing cottage lot or incremental alterations (additions, sleeping cabins, gazebos, decks, sheds, boat houses, garages, lawns, shoreline modifications, docks), all of which may put additional stress on the sensitive shoreline zone and the lake along with potential, added septic system loading.
Many waterfront properties contain existing non-conforming dwellings with respect to minimum water frontage and lot area and are often located within 30 metres of the water that require minor variances for expansion and/or reconstruction of dwellings where standard development setbacks from water are difficult to achieve. In these cases, of which there are many, staff at Drummond/North Elmsley and Tay Valley Townships and the Conservation Authority often meet with resistance and push back when attempts are made to implement standards for development setbacks, vegetated shorelines and septic systems.
Monitoring implementation of conditions of planning and regulatory approvals is challenging due to a lack of resources.
Headwaters/In-Water Habitat/Shorelines
Otty Lakehas 62 percent of its shoreline composed of natural vegetation. This is below the 75 percent target that is recommended by experts for the protection of the catchment’s waterbodies and watercourses, 30 metres back from the shoreline of streams, rivers and lakes (see Section 4.4 of this report).
Otty Lake has seen a small increase in the area of settlement (0.28 ha.) along its shoreline between 2008 and 2014, due primarily to a loss of woodland.
Six of thirty-two sampled headwater sites in the catchment have been modified (three are channelized, three are roadside ditches)(see Section 3.4.2 of this report).
Littoral zone mapping identifying substrate type, vegetation and habitat features along with opportunities for shoreline enhancement is unavailable for Otty Lake.
Land Cover
Land cover has changed across the catchment (2008 to 2014) largely as a result of an increase in the area of settlement (11 ha.) and loss of woodland (7 ha.) and crop and pastureland (3 ha.)(see Section 4.1 of this report).
Wetlands have declined by thirty-one percent since European pre-settlement and now cover 21 percent (1112 ha.) of the catchment (in 2014). Eighty-six percent (953 ha.) of these wetlands remain unevaluated and unregulated and although they are not under imminent threat from development activity, they do remain vulnerable to drainage and land clearing activities in the absence of any regulatory and planning controls that would otherwise protect them for the many important hydrological, social, biological and ecological functions/services/values they provide to landowners and the surrounding community (see Section 4.3 of this report).
Water Quality
Jebbs Creek surface chemistry water quality does not exhibit any sampling concerns (see Section 2.3 of this report).
McLaren Lake surface chemistry water quality rating ranges from Poor to Fair (see Section 2.2 of this report).
Otty Lake surface chemistry water quality rating ranges from Fair to Good (see Section 2.1 of this report).
Jebbs Creek instream biological water quality conditions range from Poor to Fair (see Section 3.3.1 of this report).
Twenty-five (of 348) Tay Valley Township mandatory septic system inspections conducted from 2004 to 2017 on Otty Lake revealed the need for remedial work on 18 systems and replacements for seven systems. More information was supplied to two other landowners with septic system issues. Those properties with concerns are identified in the yearly report submitted by the Mississippi Rideau Septic System Office to the Township.
One (of nine) Tay Valley Township voluntary septic system inspections conducted from 2004 to 2017 on McLaren and Mud Lake revealed the need for remedial work to be performed. Those properties with concerns are identified in the yearly report submitted by the Mississippi Rideau Septic System Office to the Township.
Developed by the Otty Lake Association and its partners, the Otty Lake Management Plan (2008) and Five-year Review (2014) provide information on many aspects of the lake environment, as well as actions to maintain and improve the long-term health of the lake. The following list includes some of those identified actions that have implications for the land and water resources of the lake ecosystem. Specific opportunities noted by the Otty Lake community are indicated by an asterisk.
Otty Lake and Catchment Health
Development
Work with approval authorities (Drummond/North Elmsley Township, Lanark County, Leeds Grenville and Lanark District Health Unit, Mississippi Rideau Septic System Office, RVCA and Tay Valley Township) and waterfront property owners (including the McLaren Lake community and Otty Lake Association) to consistently implement current land use planning and development policies for water quality and shoreline protection adjacent to Jebbs Creek, McLaren Lake, Otty Lake and headwater streams in the catchment (i.e., a minimum 30 metre development setback from water).
Explore ways and means to more effectively enforce and implement conditions of land-use planning and development approval to achieve net environmental gains (particularly with respect to rehabilitating or protecting naturally vegetated shorelines and water quality).
Encourage Committees of Adjustment to take advantage of technical and environmental information and recommendations forthcoming from planning and environmental professionals.
Municipalities in the Tay Watershed are encouraged to strengthen natural heritage and water resources official plan policies and zoning provisions (pertaining to water setbacks, frontage and naturalized shorelines and wetland protection) where deemed appropriate.
Work with Drummond/North Elmsley Township, Lanark County, Tay Valley Township and agencies to ensure that development approvals around lakes and along watercourses take into consideration the protection of fish habitat (including the near-shore nursery and spawning habitat).
Municipal and agency planners together with development proponents are to use the 2014 Site Evaluation Guidelines to inform decision-making about the application of development setbacks on lots with shallow soils/bedrock, steep slopes and sparse vegetation cover along with the use of the appropriate, development related, best management practices.
Utilise RVCA subwatershed and catchment reports to help develop/revise official plan policies to protect surface water resources and the natural environment (including woodlands, wetlands and shoreline cover).
Use 1:100 year flood elevation information now available for Otty Lake as an additional factor to be considered when assessing development setbacks at the shoreline and protecting property owners from flood hazards.
Establish RVCA regulation limits around the 86 percent (953 ha.) of wetlands in the catchment that are unevaluated. Doing this will help protect landowners from natural hazards including mitigating surface water flow by storing water during periods of peak flow (such as spring snowmelt and heavy rainfall events) and releasing water during periods of low flow (this mitigation of water flow reduces flood damage), as well as contributing to the stabilisation of shorelines and to the reduction of soil erosion damage through water flow mitigation and plant soil binding/retention.
Shorelines
Implement Otty Lake shoreline improvement recommendations from the 2013 Love Your Lake Program waterfront assessments.*
Take advantage of the RVCA Shoreline Naturalization Program to re-naturalize altered creek, lake and stream shoreline identified in this report as “Unnatural Riparian Land Cover". Concentrate stewardship efforts on Otty Lake waterfront properties shown in orange on the Riparian Land Cover map (see Figure 69 in Section 4.4 in this report).Other stewardship opportunities in the catchment may be determined based on septic system inspections and surface water quality monitoring results.
Promote the use of bioengineering methods (using native shrub/tree planting, fascines, live stakes) as a shoreline erosion mitigation measure as well as a cost effective alternative to shoreline hardening (with rip rap, armour stone, gabion baskets, walls)
Educate landowners about the value and importance of natural shorelines and property best management practices with respect to shoreline use and development, septic system installation and maintenance and shoreline vegetation retention and enhancement (Drummond/North Elmsley Township, Leeds Grenville and Lanark District Health Unit, McLaren Lake community, Mississippi Rideau Septic System Office, Otty Lake Landowners’ Association, RVCA and Tay Valley Township).
Water Quality
Consider further investigation of the 1) Fair to Goodsurface chemistry water quality rating on Otty Lake; 2) Poor to Fairsurface chemistry water quality rating on McLaren Lake and 3) Poor to Fairinstream biological water quality rating in Jebbs Creek, as part of a review of RVCA's Watershed Watch, Baseline and Benthic Invertebrate surface water quality monitoring.
Offer funding provided by the RVCA Rural Clean Water Program to landowners with potential projects that could improve water quality on McLaren, Mud and Otty Lakes and their tributaries (e.g., livestock fencing, septic system repair/replacement and streambank erosion control/stabilisation). Concentrate efforts at septic systems requiring remedial work or replacement, including the 26 identified as needing additional maintenance/remedial/replacement work since 2004.
Educate waterfront property owners about septic system care by providing information about sewage system maintenance (i.e., when to pump out septic systems and holding talks) through initiatives such as the Septic Savvy Workshop and services provided by the Mississippi Rideau Septic System Office.
Reduce pollutant loading to Otty Lake through education about the application of shoreline, stormwater and agricultural best management practices; also consider using low impact development (LID) methods to improve the quality and reduce the amount of stormwater runoff directly reaching the lake ecosystem. This will be particularly beneficial in areas with extensive impervious surfaces (i.e., asphalt, concrete, buildings, and severely compacted soils) or on sensitive waterfront properties (with steep slopes/banks, shallow/impermeable soils).
Otty Lake and Catchment Habitat
Aquatic Habitat/Fisheries/Wildlife
Educate waterfront property owners about: 1) fish habitat requirements, spawning timing and near-shore and in-water activities that can disturb or destroy fish habitat and spawning sites 2) the causes of excessive algae and aquatic vegetation growth (see the RVCA publication entitled Algae and Aquatic Plant Educational Manual) and 3) healthy lake ecosystems and associated water level fluctuations in a natural environment.
Work with the Otty Lake Association on fish and wildlife habitat improvement.
Otty Lake Association Leadership
Lake Planning
Conduct a ten-year review of the Otty Lake Management Plan (2008), scheduled for completion in the summer of 2018. This review will also use a survey of lake residents and cottagers to provide feedback on topics of interest and importance and help establish opportunities for future action on Otty Lake.*
Continue the annual Otty Lake State of the Lake Report. This comprehensive report on lake health and OLA initiatives in the Lake Watershed will continue to serve as an important source of information for the lake community.*
The Otty Lake Association will lead the coordination of the implementation of the recommendations of the updated Otty Lake Management Plan (2018).*
Use the information contained in the Tay River Subwatershed Report 2017 and Otty Lake Catchment Report 2017 to assist with implementation of the updated Otty Lake Management Plan (2018).
The RVCA produces individual reports for 14 catchments in the Tay River subwatershed. Using data collected and analyzed by the RVCA through its watershed monitoring and land cover classification programs, surface water quality and in-stream conditions are reported for the Tay River, Tay Watershed lakes and Tay tributaries along with a summary of environmental conditions for the surrounding countryside every six years, which includes analysis of data collected through the programs along with local information provided by stakeholders up to 2017.
This information is used to better understand the effects of human activity on our water resources, allows us to better track environmental change over time and helps focus watershed management actions where they are needed the most to help sustain the ecosystem services (cultural, aesthetic and recreational values; provisioning of food, fuel and clean water; regulation of erosion/natural hazard protection and water purification; supporting nutrient/water cycling and habitat provision) provided by the catchment’s lands and forests and waters (Millennium Ecosystem Assessment 2005).
The following sections of this report are a compilation of that work for the Pike Lake catchment.
62 square kilometres; occupies eight percent of the Tay River subwatershed; one percent of the Rideau Valley watershed.
Geology/Physiography
The Pike Lake Catchment resides within part of the physiographic region known as the Algonquin Highlands. In the Tay River Subwatershed, this ancient and hilly geologic region is made up of such Precambrian rocks as marble, conglomerates, and dark or colour banded granite-like rocks. A veneer of glacial drift (glacial till, sand etc.) overlies the bedrock.
Municipal Coverage
Rideau Lakes Township: (37 km2; 59% of catchment)
Tay Valley Township: (25 km2; 41% of catchment)
Stream Length
All tributaries (including headwater streams): 198 km
1.2 Vulnerable Areas
Aquifer Vulnerability
Mississippi-Rideau Source Water Protection program has mapped only one very small part of this catchment as a Significant Groundwater Recharge Areas and all of the catchment as a Highly Vulnerable Aquifer (HVA). There are no Well-Head Protection Areas in the catchment.
Wetland Hydrology
A watershed model developed by the RVCA in 2009 was used to study the hydrologic function of wetlands in the Rideau Valley Watershed, including those found in the Pike Lake catchment.
1.3 Conditions at a Glance
Aggregates
One aggregate license within this catchment along with a sand and gravel area of tertiary significance.
Fish Community/Thermal Regime
Warm and cool water recreational and baitfish fishery. The fish community has not been sampled along streams and headwater drainage features in the Pike Lake catchment.
Headwater Drainage Features
Dominated by wetland and natural features with a few features that have been straightened, historically.
Land Cover Change (2008 to 2014)
Catchment
Woodland
Crop-Pasture
Meadow-Thicket
Wetland
Settlement
Hectares
-4
-2
-1
+5
+4
Land Cover Type (2014)
Catchment
Woodland
Wetland
Water
Crop-Pasture
Meadow-Thicket
Transportation
Settlement
Percent
52
20
11
8
4
3
2
Shoreline Cover Type (30 m. riparian area; 2014)
Catchment
%
Crosby Lake
%
Little Crosby Lake
%
Pike Lake
%
Streams
%
Woodland
50
Woodland
56
Woodland
64
Woodland
54
Woodland
47
Wetland
39
Settlement
41
Wetland
24
Settlement
29
Wetland
44
Settlement
4
Wetland
2
Settlement
6
Wetland
15
Crop-Pasture
3
Crop-Pasture
3
Transportation
1
Transportation
3
Transportation
2
MeadowThicket
3
MeadowThicket
3
---
---
MeadowThicket
3
---
---
Transportation
2
Transportation
1
---
---
---
---
---
---
Settlement
1
Significant Natural Features
Black Creek-Westport Bog Provincially Significant Wetland
Crosby Lake and Creek Provincially Significant Wetland (Complex)
Species at Risk (Elemental Occurrence)
Status
Species at Risk
Threatened
Blanding's Turtle
Bobolink
Eastern Meadowlark
Least Bittern
Special Concern
Eastern Milksnake
Eastern Musk Turtle
Eastern Ribbonsnake
Snapping Turtle
Water Quality for the Protection of Aquatic Life (2006 to 2017)
Crosby Lake
Little Crosby Lake
Pike Lake
Kevan Drain
Fair
Fair to Good
Very Good
Poor to Good
Water Wells
Approximately 250 operational private water wells in the Pike Lake catchment. Groundwater uses are mainly domestic but also include livestock and public water supplies, municipal uses and heating and cooling.
Wetland Cover
Wetlands are reported to have covered 21 percent of the Port Elmsley catchment prior to European settlement, as compared to 20 percent (or 12.2 square kilometres) of the area in 2014. This represents a six percent (or 0.8 square kilometre) loss of historic wetland cover. Thirty-five percent of the remaining wetlands are regulated leaving 65 percent (or 7.9 square kilometers) unregulated.
1.4 Catchment Care
Environmental Management
The Pike Lake Community Association prepared the Draft Report on the State of Pike Lake and its Watershed (2009) to provide a summary of what is currently known about the Pike Lake catchment along with the community’s vision for the lake and a list of its main concerns and actions to address them. This has been followed-up with the release of the Pike Lake Stewardship Handbook in 2011, containing the community’s vision for the lake, along with a list of its main concerns and actions to address them.
Development in, and adjacent to, the Black Creek-Westport Bog Provincially Significant Wetland and Crosby Lake and Creek Provincially Significant Wetland Complex in the catchment is subject to Ontario Regulation 174-06 (entitled “Development, Interference with Wetlands and Alterations to Shorelines and Watercourses”) that protects the hydrologic function of the wetland and also protects landowners and their property from natural hazards (flooding, fluctuating water table, unstable soils) associated with them.
Environmental Monitoring
Chemical surface (in-stream) water quality collection by the RVCA since 2003 (see Section 2 of this report).
Nineteen drainage feature assessments were conducted by the RVCA in 2016 at road crossings in the catchment. The protocol measures zero, first and second order headwater drainage features and is a rapid assessment method characterizing the amount of water, sediment transport, and storage capacity within headwater drainage features (see Section 3.1 of this report).
Classification of Pike Lake catchment land cover types derived by the RVCA from colour aerial photography that was acquired during the spring of 2008 and 2014 (see Section 4.1 of this report).
The Mississippi Rideau Septic System Office has conducted 255 septic system re-inspections (mandatory and voluntary) on 180 properties around Pike Lake from 2004 to 2017 and 61 voluntary septic system re-inspections on 58 properties around Crosby and Little Crosby Lake from 2007 to 2017 (see Section 5.5 of this report).
Groundwater chemistry information is available from the Ontario Geological Survey for one well (#13-AG-001) located in the catchment.
Stewardship
Twenty-five stewardship projects were completed by landowners with assistance from the RVCA (see Section 5 of this report).
Surface water quality conditions in the Pike Lake catchment are monitored by the Rideau Valley Conservation Authority’s (RVCA) Watershed Watch Program. Watershed Watch monitors watershed lakes to assess nutrient concentrations, water clarity, dissolved oxygen availability and pH. Figure 2 shows the locations of monitoring sites in the catchment.
Figure 2 Water quality monitoring sites on Crosby, Little Crosby and Pike Lakes
Water Quality Rating in the Pike Lake Catchment
The water quality ratings across this catchment range from "Fair to Very Good" (Table 1); with a rating of "Fair” in Crosby Lake, "Fair to Good" in Little Crosby Lake and "Very Good" in Pike Lake, as determined by the Canadian Council of Ministers of the Environment (CCME) Water Quality Index.
A "Fair" rating indicates that water quality is usually protected but is occasionally threatened or impaired; conditions sometimes depart from natural or desirable levels. A rating of "Good" indicates that only a minor degree of threat or impairment is observed and conditions rarely depart from natural or desirable levels. “Very Good" indicates water quality is protected with a virtual absence of threat or impairment; conditions are very close to natural or pristine levels.
Each water quality parameter is evaluated against established guidelines to determine water quality conditions. Those parameters that frequently exceed guidelines are presented below. Data has been analyzed over the 2006-2017 period for general trends and conditions. Table 1 shows the overall rating for the monitored surface water quality sites within the catchment and Table 2 outlines the Water Quality Index (WQI) scores and their corresponding ratings.
Table 1 Water Quality Index ratings for the Pike Lake Catchment
Site
Location
2006-2008
2009-2011
2012-2014
2015-2017
DP1
Crosby Lake
Very Good (100)
Fair (77)
Fair (77)
Fair (77)
DP1
Little Crosby Lake
Good (88)
Fair (76)
Fair (77)
Good (88)
DP1
Pike Lake
Very Good (100)
Fair (77)
Very Good (100)
Very Good (100)
Table 2 Water Quality Index ratings and corresponding index scores (RVCA terminology, original WQI category names in brackets)
Rating
Index Score
Very Good (Excellent)
95-100
Good
80-94
Fair
65-79
Poor (Marginal)
45-64
Very Poor (Poor)
0-44
2.1 Crosby Lake Water Quality
Surface water quality conditions in Crosby Lake have been monitored by RVCA’s Watershed Watch Program since 2006. Data from the deep point site (DP1) has been used to calculate the WQI rating for Crosby Lake, which averaged “Fair” over the 2006-2017 period (Table 1). Moderate nutrient concentrations, good oxygen availability and clear water all influenced this rating. The following discussion explains how each of the monitored water quality parameters contributes to the lake’s water quality.
This report also considers data from eight additional shoreline sites that are monitored around the lake. These sites have not been included in the calculation of the CCME WQI rating, as they are not monitored with the same frequency as the deep point site. However, they do provide important information on water quality conditions in the near shore areas. For locations of shoreline sites (A-H) please see Figure 2.
2.1.1 Nutrients
Total phosphorus (TP) is used as a primary indicator of excessive nutrient loading and contributes to abundant aquatic vegetation growth and depleted dissolved oxygen levels. The Provincial Water Quality Objective (PWQO) is used as the TP Guideline and states that in lakes, concentrations greater than 0.020 mg/l indicate an excessive amount of TP within the water column. Concentrations below 0.010 mg/l are generally considered to be minimal and unlikely to have problems associated with nutrient loading.
Total Kjeldahl nitrogen (TKN) is used as a secondary indicator of nutrient loading. RVCA uses a guideline of 0.500 mg/l to assess TKN[1]within surface waters.
Nutrients at the Crosby Lake Deep Point
TP and TKN sampling results collected by the RVCA are presented in Figures 3 to 6. Some variability has occurred in the sampled TP concentrations at this site (Figure 3 and 4), and a decreasing trend[2] was observed in the 2006-2017 data set. Eighty-nine percent of samples analyzed for TP were less than the TP guideline and the average concentration was 0.012 mg/l (Table 3). TKN concentration also showed variability though no significant change was observed (Figures 5 and 6). Eighty-nine percent of reported results were below the TKN guideline and the average TKN concentration was 0.396 mg/l (Table 3).
Figure 3 Total phosphorus sampling results at the deep point site (DP1) on Crosby Lake, 2006-2017
Figure 4 Average total phosphorus results at the deep point site (DP1) on Crosby Lake, 2006-2017
Figure 5 Total Kjeldahl nitrogen sampling results at the deep point site (DP1) on Crosby Lake, 2006-2017.
Figure 6 Average total Kjeldahl nitrogen sampling results at the deep point site (DP1) on Crosby Lake, 2006-2017.
Table 3 Summary of nutrient results for Crosby Lake over the monitoring period, 2006-2017
Total Phosphorous 2006-2017
Site
Average (mg/l)
Below Guideline
No. Samples
DP1
0.011
89%
48
Total Kjeldahl Nitrogen 2006-2017
Site
Average (mg/l)
Below Guideline
No. Samples
DP1
0.371
89%
48
Overall, the data presented indicates that nutrient concentration may be considered low with occasional exceedances in the mid-lake, deep water site on Crosby Lake.
Nutrients around Crosby Lake
The average nutrient concentrations at monitored shoreline sites around the lake vary from year to year (Figures 7 and 8). Please note that in the 2006-2017 monitoring period sites C, E and H were monitored yearly; while sites A, B, D, F, and G were only sampled in 2006, 2011 and 2016.
Average total phosphorous concentrations are below the TP guideline at all of sites. Average TKN concentrations were also below the guideline at all sites (Figure 8). Site G did show elevated concentrations in 2016, though results are comparable to other sites in the years when monitored.
Figure 7 Average total phosphorous concentrations at shoreline monitoring sites on Crosby Lake, 2006-2017
Figure 8 Average total phosphorous concentrations at shoreline monitoring sites on Crosby Lake, 2006-2017
Summary of Crosby Lake Nutrients
Crosby Lake nutrient concentrations are generally below the guidelines, with few exceedances. It is possible that occasional problems with nutrient enrichment (i.e. algal blooms or excessive plant growth) may be observed in shallow, sheltered bays.
Efforts such as the diversion of runoff and enhanced shoreline buffers are important to continue to protect and enhance water quality, and reduce future nutrient increases. Nutrient exceedances may be partially attributed to the natural aging of a lake and basin characteristics. All residents can help minimize their impact on the lake by reducing nutrient inputs through practices such as proper maintenance of septic systems, keeping shorelines natural and using phosphate free soaps and detergents. Promotion of sound stewardship and protection around lake is important to maintain and protect water quality conditions into the future.
2.1.2 Crosby Lake Water Clarity
Water clarity is measured using a Secchi disk during each deep point sample. Table 4 summarizes the recorded depths with an average depth of 4.3 m and shows that all readings have exceeded the minimum PWQO of 2 m indicating that algae in the water column is not at excessive levels (good water clarity). Less than 2 m will indicate overproduction in a lake or significant inputs to the water column that are limiting light availability. Figure 9 shows that no individual reading has been below the guideline and measured depths range from 2.5 m to 8.5 m. A decreasing trend was observed within the 2006-2017 data set, indicating that Secchi depths have been reduced over this period.
Table 4 Summary of Secchi depths recorded at the deep point site (DP1) on Crosby Lake, 2006-2017.
Secchi 2006-2017
Site
Average (m)
Above Guideline
No. Samples
DP1
4.3
100%
35
Figure 9 Recorded Secchi depths at the deep point site (DP1) on Crosby Lake, 2006-2017.
Summary of Crosby Lake Water Clarity
Waters in Crosby Lake are very clear and sufficient sunlight is able to penetrate the water column to support aquatic life and provide sufficient visibility for safe recreational use (boating, swimming).
2.1.3 Crosby Lake Fish Habitat
Two other factors, dissolved oxygen/temperature and pH were also assessed to provide an overall sense of the health of Crosby Lake from a fish habitat perspective.
2.1.3.1 Crosby Lake Dissolved Oxygen and Temperature
The red bars in Figure 10 show the depths where suitable conditions exist for warm water fish species (temperature less than 25°C and dissolved oxygen greater than 4 mg/l) at the deep point site. The vertical axis represents the total lake depth at each site where the profile is taken. Suitable conditions typically decline throughout the summer to about 12 m of the water column. Overall, no significant change was noted in conditions through the 2006-2017 period.
Figure 10 Depths suitable for warm water fish species at deep point site (DP1) on Crosby Lake, 2006-2017.
2.1.3.2 Crosby Lake pH
pH is a basic water quality parameter used to assess the acidity of water, an important factor for aquatic life. Figure 11 shows monitored pH values over the 2006-2017 period.
Figure 11 pH concentrations at the deep point site on Crosby Lake, 2006-2017
The majority of samples for both time periods were within guidelines established by the Canadian Council of Minister's of the Environment which state that pH should be between 6.5 and 9 to protect aquatic life (Table 5). Surface water’s that are found to be more alkaline (higher pH) are common in many regions of the Tay River subwatershed and can generally be attributed to the geology rather than anthropogenic activities. Biological activities such as increased photosynthesis from algal blooms and plant growth may also influence pH.
Table 5 Summary of pH results at the deep point site (DP1) on Crosby Lake, 2006-2017.
pH 2006-2017
Site
Average (mg/l)
Within Guideline
No. Samples
DP1
7.9
97%
33
Summary of Water Quality for Fish Habitat in Crosby Lake
Overall the water chemistry data at the deep point describes suitable habitat conditions for warm water fish species such as yellow perch, walleye and pike. There is some evidence that the warming of the water column in the late summer/fall may limit the amount of habitat for some sensitive species. pH conditions are typically on the upper end of the range recommended for the protection of aquatic life. Overall, the data indicates a healthy environment for aquatic species.
2.1.4 Crosby Lake E. Coli
E. coli is sampled at monitored shoreline sites twice each sampling season. E. coli data was not used in the calculations of the WQI rating for the lake due to differences in sampling frequency and site locations. E. coli data has been summarized in Table 6. Throughout the 2006-2017 period 100 percent of samples collected by RVCA were below the E. coli guideline of 100 colony forming units (CFU) per 100 ml set by the PWQO; across the lake the count at the geometric mean was 3 CFU/100ml (Table 6). This provides support that there is little indication of bacterial contamination around the lake.
Table 6 Summary of E. coli results for Crosby Lake, 2006-2017.
E. coli 2006-2017
Site
Geometric mean (CFU/100ml)
Below Guideline
No. Samples
A-E
3
100%
112
Figure 12 Geometric mean of shoreline sites monitored on Crosby Lake, 2006-2017.
Figure 12 show the distribution of counts across all shoreline sites. All sites fell well below the guideline of 100 CFU/100ml.
Summary of Crosby Lake Bacterial Contamination
The results presented above indicate that bacterial contamination is not a significant concern in Crosby Lake and the water should be safe for recreational use such as swimming and boating.
2.2 Little Crosby Lake Water Quality
Surface water quality conditions in Little Crosby Lake have been monitored by RVCA’s Watershed Watch Program since 2006. Data from the deep point site (DP1) has been used to calculate the WQI rating for Little Crosby Lake, which averaged “Fair-Good” over the 2006-2017 period (Table 1). Moderate nutrient concentrations, good oxygen availability and clear water all influenced this rating. The following discussion explains how each of the monitored water quality parameters contributes to the lake’s water quality.
This report also considers data from two additional shoreline sites that are monitored around the lake. These sites have not been included in the calculation of the CCME WQI rating, as they are not monitored with the same frequency as the deep point site. However, they do provide important information on water quality conditions in the near shore areas. For locations of shoreline sites (A and B) please see Figure 2.
2.2.1 Little Crosby Lake Nutrients
Total phosphorus (TP) is used as a primary indicator of excessive nutrient loading and contributes to abundant aquatic vegetation growth and depleted dissolved oxygen levels. The Provincial Water Quality Objective (PWQO) is used as the TP Guideline and states that in lakes, concentrations greater than 0.020 mg/l indicate an excessive amount of TP within the water column. Concentrations below 0.010 mg/l are generally considered to be minimal and unlikely to have problems associated with nutrient loading.
Total Kjeldahl nitrogen (TKN) is used as a secondary indicator of nutrient loading. RVCA uses a guideline of 0.500 mg/l to assess TKN[1]within surface waters.
Nutrients at the Little Crosby Lake Deep Point
TP and TKN sampling results collected by the RVCA are presented in Figures 13 to 16. Some variability has occurred in the sampled TP concentrations at this site (Figure 13 and 14), and a decreasing trend[2] was observed in the 2006-2017 dataset. Eighty-five percent of samples analyzed for TP were less than the TP guideline and the average concentration was 0.014 mg/l (Table 7). TKN concentrations were more consistent, with no significant trend through the monitoring period (Figures 15 and 16). Eighty-nine percent of reported results were below the TKN guideline and the average TKN concentration was 0.390 mg/l (Table 7).
Figure 13 Total phosphorus sampling results at the deep point site (DP1) on Little Crosby Lake, 2006-2017
Figure 14 Average total phosphorus results at the deep point site (DP1) on Little Crosby Lake, 2006-2017
Figure 15 Total Kjeldahl nitrogen sampling results at the deep point site (DP1) on Little Crosby Lake, 2006-2017.
Figure 16 Average total Kjeldahl nitrogen sampling results at the deep point site (DP1) on Little Crosby Lake, 2006-2017.
Table 7 Summary of nutrient results for Little Crosby Lake over the monitoring period, 2006-2017
Total Phosphorous 2006-2017
Site
Average (mg/l)
Below Guideline
No. Samples
DP1
0.014
85%
40
Total Kjeldahl Nitrogen 2006-2017
Site
Average (mg/l)
Below Guideline
No. Samples
DP1
0.390
90%
40
Overall, the data presented indicates that nutrient concentration may be considered low with few exceedances in the mid-lake, deep water site on Little Crosby Lake
Nutrients around Little Crosby Lake
The average nutrient concentrations at monitored shoreline sites around the lake vary from year to year (Figures 17 and 18). Please note that in the 2006-2017 monitoring period sites A and B were only sampled in 2006, 2011 and 2016.
Average total phosphorous concentrations varied across the three years of monitoring data. Site B reported very high results in 2016 as well as elevated results in 2011 (Figure 17). This site is influenced by agricultural lands which may influence concentrations; particularly during runoff events. Average TKN concentrations were generally below the guideline, with the exception of site B in 2016 (Figure 18); as noted in the discussion regarding TP results this results may be attributed to the surrounding landscape.
Figure 17 Average total phosphorous concentrations at shoreline monitoring sites on Little Crosby Lake, 2006-2017
Figure 18 Average total phosphorous concentrations at shoreline monitoring sites on Little Crosby Lake, 2006-2017
Summary of Little Crosby Lake Nutrients
Little Crosby Lake nutrient concentrations are generally below the guidelines, with few exceedances. It is possible that occasional problems with nutrient enrichment (i.e. algal blooms or excessive plant growth) may be observed in shallow, sheltered bays.
Efforts such as the diversion of runoff and enhanced shoreline buffers are important to continue to protect and enhance water quality, and reduce future nutrient increases. Nutrient exceedances may be partially attributed to the natural aging of a lake and basin characteristics. All residents can help minimize their impact on the lake by reducing nutrient inputs through practices such as proper maintenance of septic systems, keeping shorelines natural and using phosphate free soaps and detergents. Promotion of sound stewardship and protection around lake is important to maintain and protect water quality conditions into the future.
2.2.2 Little Crosby Lake Water Clarity
Water clarity is measured using a Secchi disk during each deep point sample. Table 8 summarizes the recorded depths with an average depth of 4.3 m and shows that all readings have exceeded the minimum PWQO of 2 m indicating that algae in the water column is not at excessive levels (good water clarity). Less than 2 m will indicate overproduction in a lake or significant inputs to the water column that are limiting light availability. Figure 19 shows that no individual reading has been below the guideline and measured depths range from 2 m to 7.5 m. A decreasing trend was observed within the 2006-2017 data set, indicating that Secchi depths have been reduced over this period.
Table 8 Summary of Secchi depths recorded at the deep point site (DP1) on Little Crosby Lake, 2006-2017.
Secchi 2006-2017
Site
Average (m)
Above Guideline
No. Samples
DP1
4.3
100%
35
Figure 19 Recorded Secchi depths at the deep point site (DP1) on Little Crosby Lake, 2006-2017.
Summary of Little Crosby Lake Water Clarity
Waters in Crosby Lake are very clear and sufficient sunlight is able to penetrate the water column to support aquatic life and provide sufficient visibility for safe recreational use (boating, swimming).
2.2.3 Little Crosby Lake Fish Habitat
Two other factors, dissolved oxygen/temperature and pH were also assessed to provide an overall sense of the health of Little Crosby Lake from a fish habitat perspective.
2.2.3.1 Dissolved Oxygen and Temperature
The red bars in Figure 20 show the depths where suitable conditions exist for warm water fish species (temperature less than 25°C and dissolved oxygen greater than 4 mg/l) at the deep point site. The vertical axis represents the total lake depth at each site where the profile is taken. Suitable conditions typically decline throughout the summer to about 7 m of the water column. Overall, no significant change was noted in conditions through the 2006-2017 period.
Figure 20 Depths suitable for warm water fish species at deep point site (DP1) on Little Crosby Lake, 2006-2017.
2.2.3.2 Little Crosby Lake pH
pH is a basic water quality parameter used to assess the acidity of water, an important factor for aquatic life. Figure 21 shows monitored pH values over the 2006-2017 period.
Figure 21 pH concentrations at the deep point site on Little Crosby Lake, 2006-2017
The majority of samples for both time periods were within guidelines established by the Canadian Council of Minister's of the Environment which state that pH should be between 6.5 and 9 to protect aquatic life (Table 9). Surface water’s that are found to be more alkaline (higher pH) are common in many regions of the Tay River subwatershed and can generally be attributed to the geology rather than anthropogenic activities. Biological activities such as increased photosynthesis from algal blooms and plant growth may also influence pH.
Table 9 Summary of pH results at the deep point site (DP1) on Little Crosby Lake, 2006-2017.
pH 2006-2017
Site
Average (mg/l)
Within Guideline
No. Samples
DP1
7.85
100%
38
Summary of Water Quality for Fish Habitat in Little Crosby Lake
Overall the water chemistry data at the deep point describes suitable habitat conditions for warm water fish species such as yellow perch, walleye and pike. There is some evidence that the warming of the water column in the late summer/fall may limit the amount of habitat for some sensitive species in this shallow lake. pH conditions are typically within the range recommended for the protection of aquatic life. Overall, the data indicates a healthy environment for aquatic species.
2.2.4 Little Crosby Lake E. Coli
E. coli is sampled at monitored shoreline sites twice each sampling season. E. coli data was not used in the calculations of the WQI rating for the lake due to differences in sampling frequency and site locations. E. coli data has been summarized in Table 10. Throughout the 2006-2017 period 100 percent of samples collected by RVCA were below the E. coli guideline of 100 colony forming units (CFU) per 100 ml set by the PWQO; across the lake the count at the geometric mean was 4 CFU/100ml (Table 10). This provides support that there is little indication of bacterial contamination around the lake.
Table 10 Summary of E. coli results for Little Crosby Lake, 2006-2017.
E. coli 2006-2017
Site
Geometric mean (CFU/100ml)
Below Guideline
No. Samples
A-B
4
100%
14
Figure 22 Geometric mean of shoreline sites monitored on Little Crosby Lake, 2006-2017.
Figure 22 show the distribution of counts across all shoreline sites. All sites fell well below the guideline of 100 CFU/100ml.
Summary of Little Crosby Lake Bacterial Contamination
The results presented above indicate that bacterial contamination is not a significant concern in Little Crosby Lake and the water should be safe for recreational use such as swimming and boating.
2.3 Pike Lake Water Quality
Surface water quality conditions in Pike Lake have been monitored by RVCA’s Watershed Watch Program since 2006. Data from the deep point site (DP1) has been used to calculate the WQI rating for Pike Lake, which averaged “Very Good" over the 2006-2017 period (Table 1). Low nutrient concentrations, good oxygen availability and clear water all influenced this rating. The following discussion explains how each of the monitored water quality parameters contributes to the lake’s water quality.
This report also considers data from eight additional shoreline sites that are monitored around the lake. These sites have not been included in the calculation of the CCME WQI rating, as they are not monitored with the same frequency as the deep point site. However, they do provide important information on water quality conditions in the near shore areas. For locations of shoreline sites (A-H, K) please see Figure 1.
2.3.1 Pike Lake Nutrients
Total phosphorus (TP) is used as a primary indicator of excessive nutrient loading and contributes to abundant aquatic vegetation growth and depleted dissolved oxygen levels. The Provincial Water Quality Objective (PWQO) is used as the TP Guideline and states that in lakes, concentrations greater than 0.020 mg/l indicate an excessive amount of TP within the water column. Concentrations below 0.010 mg/l are generally considered to be minimal and unlikely to have problems associated with nutrient loading.
Total Kjeldahl nitrogen (TKN) is used as a secondary indicator of nutrient loading. RVCA uses a guideline of 0.500 mg/l to assess TKN[1]within surface waters.
Nutrients at the Pike Lake Deep Point
TP and TKN sampling results collected by the RVCA are presented in Figures 23 to 26. Some variability has occurred in the sampled TP concentrations at this site (Figure 23 and 24), with no significant trend[2] was observed in the 2006-2017 data set. Ninety-eight percent of samples analyzed for TP were less than the TP guideline and the average concentration was 0.011 mg/l (Table 11). TKN concentration also showed variability though no significant change was observed (Figures 25 and 26). Ninety-eight percent of reported results were also below the TKN guideline and the average TKN concentration was 0.371 mg/l (Table 11).
Figure 23 Total phosphorus sampling results at the deep point site (DP1) on Pike Lake, 2006-2017
Figure 24 Average total phosphorus results at the deep point site (DP1) on Pike Lake, 2006-2017
Figure 25 Total Kjeldahl nitrogen sampling results at the deep point site (DP1) on Pike Lake, 2006-2017.
Figure 26 Average total Kjeldahl nitrogen sampling results at the deep point site (DP1) on Pike Lake, 2006-2017.
Table 11 Summary of nutrient results for Pike Lake over the monitoring period, 2006-2017
Total Phosphorous 2006-2017
Site
Average (mg/l)
Below Guideline
No. Samples
DP1
0.011
89%
48
Total Kjeldahl Nitrogen 2006-2017
Site
Average (mg/l)
Below Guideline
No. Samples
DP1
0.371
89%
48
Overall, the data presented indicates that nutrient concentration may be considered low with occasional exceedances in the mid-lake, deep water site on Pike Lake.
Nutrients around Pike Lake
The average nutrient concentrations at monitored shoreline sites around the lake vary from year to year (Figures 27 and 28). Please note that in the 2006-2017 monitoring period sites A, D, F and G were monitored yearly; while sites B, C, E, G, H and K were only sampled in 2006, 2011 and 2016.
Average total phosphorous concentrations are below the TP guideline at all of sites, with the exception of site D. Site D drains a significant wetland area and Stanleyville dump, this location has previously been investigated due to consistently elevated nutrient concentrations at this location. At that time nothing was found to explain the elevated results other than the influence of nutrient attenuation by the wetlands. Similar results were also observed in TKN concentrations, which were also below the guideline at all sites with the exception of site D (Figure 28).
Figure 27 Average total phosphorous concentrations at shoreline monitoring sites on Pike Lake, 2006-2017
Figure 28 Average total phosphorous concentrations at shoreline monitoring sites on Pike Lake, 2006-2017
Summary of Pike Lake Nutrients
Pike Lake nutrient concentrations are generally below the guidelines, with few exceedances. It is possible that occasional problems with nutrient enrichment (i.e. algal blooms or excessive plant growth) may be observed in shallow, sheltered bays such as site D.
Efforts such as the diversion of runoff and enhanced shoreline buffers are important to continue to protect and enhance water quality, and reduce future nutrient increases. Nutrient exceedances may be partially attributed to the natural aging of a lake and basin characteristics. All residents can help minimize their impact on the lake by reducing nutrient inputs through practices such as proper maintenance of septic systems, keeping shorelines natural and using phosphate free soaps and detergents. Promotion of sound stewardship and protection around lake is important to maintain and protect water quality conditions into the future.
2.3.2 Pike Lake Water Clarity
Water clarity is measured using a Secchi disk during each deep point sample. Table 12 summarizes the recorded depths with an average depth of 4.5 m and shows that all readings have exceeded the minimum PWQO of 2 m indicating that algae in the water column is not at excessive levels (good water clarity). Less than 2 m will indicate overproduction in a lake or significant inputs to the water column that are limiting light availability. Figure 9 shows that no individual reading has been below the guideline and measured depths range from 2.0 m to 7.0 m. A decreasing trend was observed within the 2006-2017 data set, indicating that Secchi depths have been reduced over this period.
Table 12 Summary of Secchi depths recorded at the deep point site (DP1) on Pike Lake, 2006-2017.
Secchi 2006-2017
Site
Average (m)
Above Guideline
No. Samples
DP1
4.5
98%
47
Figure 29 Recorded Secchi depths at the deep point site (DP1) on Pike Lake, 2006-2017.
Summary of Pike Lake Water Clarity
Waters in Pike Lake are very clear and sufficient sunlight is able to penetrate the water column to support aquatic life and provide sufficient visibility for safe recreational use (boating, swimming).
2.3.3 Pike Lake Fish Habitat
Two other factors, dissolved oxygen/temperature and pH were also assessed to provide an overall sense of the health of Pike Lake from a fish habitat perspective.
2.3.3.1 Pike Lake Dissolved Oxygen and Temperature
The red bars in Figure 30 show the depths where suitable conditions exist for warm water fish species (temperature less than 25°C and dissolved oxygen greater than 4 mg/l) at the deep point site. The vertical axis represents the total lake depth at each site where the profile is taken. Suitable conditions typically decline throughout the summer to about 20 m of the water column. Overall, no significant change was noted in conditions through the 2006-2017 period.
Figure 30 Depths suitable for warm water fish species at deep point site (DP1) on Pike Lake, 2006-2017.
2.3.3.2 Pike Lake pH
pH is a basic water quality parameter used to assess the acidity of water, an important factor for aquatic life. Figure 31 shows monitored pH values over the 2006-2017 period.
Figure 31 pH concentrations at the deep point site on Pike Lake, 2006-2017
The majority of samples for both time periods were within guidelines established by the Canadian Council of Minister's of the Environment which state that pH should be between 6.5 and 9 to protect aquatic life (Table 5). Surface water’s that are found to be more alkaline (higher pH) are common in many regions of the Tay River subwatershed and can generally be attributed to the geology rather than anthropogenic activities. Biological activities such as increased photosynthesis from algal blooms and plant growth may also influence pH.
Table 13 Summary of pH results at the deep point site (DP1) on Pike Lake, 2006-2017.
pH 2006-2017
Site
Average (mg/l)
Within Guideline
No. Samples
DP1
8.00
100%
39
Summary of Water Quality for Fish Habitat in Pike Lake
Overall the water chemistry data at the deep point describes suitable habitat conditions for warm water fish species such as yellow perch, walleye and pike. There is some evidence that the warming of the water column in the late summer/fall may limit the amount of habitat for some sensitive species. pH conditions are within the range recommended for the protection of aquatic life. Overall, the data indicates a healthy environment for aquatic species.
2.3.4 Pike Lake E. Coli
E. coli is sampled at monitored shoreline sites twice each sampling season. E. coli data was not used in the calculations of the WQI rating for the lake due to differences in sampling frequency and site locations. E. coli data has been summarized in Table 14. Throughout the 2006-2017 period 100 percent of samples collected by RVCA were below the E. coli guideline of 100 colony forming units (CFU) per 100 ml set by the PWQO; across the lake the count at the geometric mean was 4 CFU/100ml (Table 14). This provides support that there is little indication of bacterial contamination around the lake.
Table 14 Summary of E. coli results for Pike Lake, 2006-2017.
E. coli 2006-2017
Site
Geometric mean (CFU/100ml)
Below Guideline
No. Samples
A-K
4
100%
124
Figure 32 Geometric mean of shoreline sites monitored on Pike Lake, 2006-2017.
Figure 32 shows the distribution of E. coli counts across all shoreline sites. All sites fell well below the guideline of 100 CFU/100ml.
Summary of Pike Lake Bacterial Contamination
The results presented above indicate that bacterial contamination is not a significant concern in Pike Lake and the water should be safe for recreational use such as swimming and boating.
[1] No Ontario guideline for TKN is presently available; however, waters not influenced by excessive organic inputs typically range from 0.100 to 0.500 mg/l, Environment Canada (1979) Water Quality Sourcebook, A Guide to Water Quality Parameters, Inland Waters Directorate, Water Quality Branch, Ottawa, Canada
[2] Trends in the data were assessed using the Mann-Kendall trend test and Sens slope statistic.
[3] A type of mean or average, which indicates the central tendency or typical value of a set of numbers by using the product of their values (as opposed to the arithmetic mean which uses their sum). It is often used to summarize a variable that varies over several orders of magnitude, such as E. coli counts.
3.1 Pike Lake Headwater Drainage Features Assessment
3.1.1 Headwater Sampling Locations
The RVCA Stream Characterization program assessed Headwater Drainage Features for the Pike Lake catchment in 2017. This protocol measures zero, first and second order headwater drainage features (HDF). It is a rapid assessment method characterizing the amount of water, sediment transport, and storage capacity within headwater drainage features (HDF). RVCA is working with other Conservation Authorities and the Ministry of Natural Resources and Forestry to implement the protocol with the goal of providing standard datasets to support science development and monitoring of headwater drainage features. An HDF is a depression in the land that conveys surface flow. Additionally, this module provides a means of characterizing the connectivity, form and unique features associated with each HDF (OSAP Protocol, 2013). In 2017 the program sampled 19 sites at road crossings in the Pike Lake catchment area (Figure 33).
Figure 33 Location of the headwater sampling sites in the Pike Lake catchment
3.1.2 Headwater Feature Type
The headwater sampling protocol assesses the feature type in order to understand the function of each feature. The evaluation includes the following classifications: defined natural channel, channelized or constrained, multi-thread, no defined feature, tiled, wetland, swale, roadside ditch and pond outlet. By assessing the values associated with the headwater drainage features in the catchment area we can understand the ecosystem services that they provide to the watershed in the form of hydrology, sediment transport, and aquatic and terrestrial functions. The headwater drainage features in the Pike Lake catchment are predominantly natural and wetland features. Figure 34 shows the feature type of the primary feature at the sampling locations.
Figure 34 Headwater feature types in the Pike Lake catchment
3.1.3 Headwater Feature Flow
The observed flow condition within headwater drainage features can be highly variable depending on timing relative to the spring freshet, recent rainfall, soil moisture, etc. Flow conditions are assessed in the spring and in the summer to determine if features are perennial and flow year round, if they are intermittent and dry up during the summer months or if they are ephemeral systems that do not flow regularly and generally respond to specific rainstorm events or snowmelt. Flow conditions in headwater systems can change from year to year depending on local precipitation patterns. Figure 35 shows the observed flow condition at the sampling locations in the Pike Lake catchment in 2017.
Figure 35 Headwater feature flow conditions in the Pike Lake catchment
A spring photo of the headwater sample site in the Pike Lake catchment located on Stanleyville Road
A summer photo of the headwater sample site in the Pike Lake catchment located on Stanleyville Road
3.1.4 Headwater Feature Channel Modifications
Channel modifications were assessed at each headwater drainage feature sampling location. Modifications include channelization, dredging, hardening and realignments. The Pike Lake catchment area had a majority of features with no channel modifications observed, two locations had mixed modifications and one had been historically channelized. Figure 36 shows the channel modifications observed at the sampling locations for the Pike Lake catchment.
Figure 36 Headwater feature channel modifications in the Pike Lake catchment
3.1.5 Headwater Feature Vegetation
Headwater feature vegetation evaluates the type of vegetation that is found within the drainage feature. The type of vegetated within the channel influences the aquatic and terrestrial ecosystem values that the feature provides. For some types of headwater features the vegetation within the feature plays a very important role in flow and sediment movement and provides fish/wildlife habitat. The following classifications are evaluated no vegetation, lawn, wetland, meadow, scrubland and forest. Figure 37 depicts the dominant vegetation observed at the sampled headwater sites in the Pike Lake catchment.
Figure 37 Headwater feature vegetation types in the Pike Lake catchment
3.1.6 Headwater Feature Riparian Vegetation
Headwater riparian vegetation evaluates the type of vegetation that is found along the adjacent lands of a headwater drainage feature. The type of vegetation within the riparian corridor influences the aquatic and terrestrial ecosystem values that the feature provides to the watershed. Figure 38 depicts the type of riparian vegetation observed at the sampled headwater sites in the Pike Lake catchment. The majority of the headwater drainage features are classified as having natural riparian vegetation with only four features having altered vegetation typically in the form of ornamental grass or agricultural crops in the riparian zone.
Figure 38 Headwater feature riparian vegetation types in the Pike Lake catchment
3.1.7 Headwater Feature Sediment Deposition
Assessing the amount of recent sediment deposited in a channel provides an index of the degree to which the feature could be transporting sediment to downstream reaches (OSAP, 2013). Evidence of excessive sediment deposition might indicate the requirement to follow up with more detailed targeted assessments upstream of the site location to identify potential best management practices to be implemented. Sediment deposition ranged from none to substantial for the headwater sites sampled in the Pike Lake catchment area. Figure 39 depicts the degree of sediment deposition observed at the sampled headwater sites in the Pike Lake catchment. Sediment deposition conditions ranged from no sediment deposition to substantial levels of deposition.
Figure 39 Headwater feature sediment deposition in the Pike Lake catchment
3.1.8 Headwater Feature Upstream Roughness
Feature roughness will provide a measure of the amount of materials within the bankfull channel that could slow down the velocity of water flowing within the headwater feature (OSAP, 2013). Materials on the channel bottom that provide roughness include vegetation, wood structure and boulders/cobble substrates. Roughness can provide benefits in mitigating downstream erosion on the headwater drainage feature and the receiving watercourse by reducing velocities. Roughness also provides important habitat conditions for aquatic organisms. Figure 40 shows that the feature roughness conditions at the sampling locations in the Pike Lake catchment were variable ranging from moderate to extreme roughness conditions.
Figure 40 Headwater feature roughness in the Pike Lake catchment
Land cover and any change in coverage that has occurred over a six year period is summarized for the Pike Lake catchment using spatially continuous vector data representing the catchment during the spring of 2008 and 2014. This dataset was developed by the RVCA through heads-up digitization of 20cm DRAPE ortho-imagery at a 1:4000 scale and details the surrounding landscape using 10 land cover classes.
4.1 Pike Lake Catchment Change
As shown in Table 15 and Figure 1, the dominant land cover type across the Pike Lake catchment drainage basin in 2014 is woodland.
Table 15 Land cover in the Pike Lake catchment (2008 vs. 2014)
Land Cover
2008
2014
Change - 2008 to 2014
Area
Area
Area
Ha
Percent
Ha
Percent
Ha
Percent
Woodland*
3251
52
3247
52
-4
Wetland **
1215
20
1220
20
5
>Evaluated
(428)
(7)
(428)
(7)
(0)
(0)
>Unevaluated
(787)
(13)
(792)
(13)
(5)
(0)
Water
705
11
705
11
Crop and Pasture
493
8
491
8
-2
Meadow-Thicket
249
4
248
4
-1
Transportation
179
3
179
3
Settlement
155
2
159
2
4
Aggregate
3
<1
3
<1
* Does not include treed swamps ** Includes treed swamps
From 2008 to 2014, there was an overall change of eight hectares (from one land cover class to another). Most of the change in the Pike Lake catchment is a result of the conversion of crop and pastureland to settlement and woodland reverting to wetland (Figure 41).
Figure 41 Land cover change in the Pike Lake catchment (2014)
Table 16 provides a detailed breakdown of all land cover change that has taken place in the Pike Lake catchment between 2008 and 2014.
Table 16 Land cover change in the Pike Lake catchment (2008 to 2014)
Land Cover
Change - 2008 to 2014
Area
Ha.
Percent
Crop and Pasture to Settlement
2.7
34.9
Woodland to Unevaluated Wetland
2.4
31.7
Meadow-Thicket to Settlement
1.0
13.6
Woodland to Settlement
0.8
11
Meadow-Thicket to Unevaluated Wetland
0.3
4.5
Woodland to Crop and Pasture
0.2
3.2
Crop and Pasture to Unevaluated Wetland
0.1
1.1
4.2 Woodland Cover
In the Environment Canada Guideline (Third Edition) entitled “How Much Habitat Is Enough?” (hereafter referred to as the “Guideline”) the opening narrative under the Forest Habitat Guidelines section states that prior to European settlement, forest was the predominant habitat in the Mixedwood Plains ecozone. The remnants of this once vast forest now exist in a fragmented state in many areas (including the Rideau Valley watershed) with woodland patches of various sizes distributed across the settled landscape along with higher levels of forest cover associated with features such as the Frontenac Axis (within the on-Shield areas of the Rideau Lakes and Tay River subwatersheds). The forest legacy, in terms of the many types of wildlife species found, overall species richness, ecological functions provided and ecosystem complexity is still evident in the patches and regional forest matrices (found in the Tay River subwatershed and elsewhere in the Rideau Valley watershed). These ecological features are in addition to other influences which forests have on water quality and stream hydrology including reducing soil erosion, producing oxygen, storing carbon along with many other ecological services that are essential not only for wildlife but for human well-being.
The Guideline also notes that forests provide a great many habitat niches that are in turn occupied by a great diversity of plant and animal species. They provide food, water and shelter for these species - whether they are breeding and resident locally or using forest cover to help them move across the landscape. This diversity of species includes many that are considered to be species at risk. Furthermore, from a wildlife perspective, there is increasing evidence that the total forest cover in a given area is a major predictor of the persistence and size of bird populations, and it is possible or perhaps likely that this pattern extends to other flora and fauna groups. The overall effect of a decrease in forest cover on birds in fragmented landscapes is that certain species disappear and many of the remaining ones become rare, or fail to reproduce, while species adapted to more open and successional habitats, as well as those that are more tolerant to human-induced disturbances in general, are able to persist and in some cases thrive. Species with specialized-habitat requirements are most likely to be adversely affected. The overall pattern of distribution of forest cover, the shape, area and juxtaposition of remaining forest patches and the quality of forest cover also play major roles in determining how valuable forests will be to wildlife and people alike.
The current science generally supports minimum forest habitat requirements between 30 and 50 percent, with some limited evidence that the upper limit may be even higher, depending on the organism/species phenomenon under investigation or land-use/resource management planning regime being considered/used.
As shown in Figure 42, 52 percent of the Pike Lake catchment contains 3247 hectares of upland forest and 35 hectares of lowland forest (treed swamps) versus the 47 percent of woodland cover in the Tay River subwatershed. This is greater than the 30 percent of forest cover that is identified as the minimum threshold required to sustain forest birds according to the Guideline and which may only support less than one half of potential species richness and marginally healthy aquatic systems. When forest cover drops below 30 percent, forest birds tend to disappear as breeders across the landscape.
Figure 42 Woodland cover and forest interior in the Pike Lake catchment (2014)
4.2.1 Woodland (Patch) Size
According to the Ministry of Natural Resources’ Natural Heritage Reference Manual (Second Edition), larger woodlands are more likely to contain a greater diversity of plant and animal species and communities than smaller woodlands and have a greater relative importance for mobile animal species such as forest birds.
Bigger forests often provide a different type of habitat. Many forest birds breed far more successfully in larger forests than they do in smaller woodlots and some rely heavily on forest interior conditions. Populations are often healthier in regions with more forest cover and where forest fragments are grouped closely together or connected by corridors of natural habitat. Small forests support small numbers of wildlife. Some species are “area-sensitive” and tend not to inhabit small woodlands, regardless of forest interior conditions. Fragmented habitat also isolates local populations, especially small mammals, amphibians and reptiles with limited mobility. This reduces the healthy mixing of genetic traits that helps populations survive over the long run (Conserving the Forest Interior. Ontario Extension Notes, 2000).
The Environment Canada Guideline also notes that for forest plants that do not disperse broadly or quickly, preservation of some relatively undisturbed large forest patches is needed to sustain them because of their restricted dispersal abilities and specialized habitat requirements and to ensure continued seed or propagation sources for restored or regenerating areas nearby.
The Natural Heritage Reference Manual continues by stating that a larger size also allows woodlands to support more resilient nutrient cycles and food webs and to be big enough to permit different and important successional stages to co-exist. Small, isolated woodlands are more susceptible to the effects of blowdown, drought, disease, insect infestations, and invasions by predators and non-indigenous plants. It is also known that the viability of woodland wildlife depends not only on the characteristics of the woodland in which they reside, but also on the characteristics of the surrounding landscape where the woodland is situated. Additionally, the percentage of forest cover in the surrounding landscape, the presence of ecological barriers such as roads, the ability of various species to cross the matrix surrounding the woodland and the proximity of adjacent habitats interact with woodland size in influencing the species assemblage within a woodland.
In the Pike Lake catchment (in 2014), one hundred and ninety (59 percent) of the 323 woodland patches are very small, being less than one hectare in size. Another 108 (33 percent) of the woodland patches ranging from one to less than 20 hectares in size tend to be dominated by edge-tolerant bird species. The remaining 25 (eight percent of) woodland patches range between 20 and 513 hectares in size. Eighteen of these patches contain woodland between 20 and 100 hectares and may support a few area-sensitive species and some edge intolerant species, but will be dominated by edge tolerant species.
Conversely, seven (two percent) of the 323 woodland patches in the drainage area exceed the 100 plus hectare size needed to support most forest dependent, area sensitive birds and are large enough to support approximately 60 percent of edge-intolerant species. Three patches top 200 hectares, which according to the Environment Canada Guideline will support 80 percent of edge-intolerant forest bird species (including most area sensitive species) that prefer interior forest habitat conditions.
Table 17 presents a comparison of woodland patch size in 2008 and 2014 along with any changes that have occurred over that time. A decrease (of five hectares) has been observed in the overall woodland patch area between the two reporting periods.
Table 17 Woodland patches in the Pike Lake catchment (2008 and 2014)
Woodland Patch Size Range (ha)
Woodland* Patches
Patch Change
2008
2014
2008 to 2014
Number
Area
Number
Area
Number
Area
Count
Percent
Ha
Percent
Count
Percent
Ha
Percent
Count
Ha
Less than 1
188
59
68
2
190
59
68
2
2
1 to 20
108
34
439
13
108
33
437
13
-2
20 to 50
13
4
400
12
13
4
399
12
-1
50 to 100
5
1
349
11
5
2
349
11
100 to 200
4
1
622
19
4
1
622
19
Greater than 200
3
1
1408
43
3
1
1406
43
-2
Totals
321
100
3286
100
323
100
3281
100
2
-5
*Includes treed swamps
4.2.2 Woodland (Forest) Interior Habitat
The forest interior is habitat deep within woodlands. It is a sheltered, secluded environment away from the influence of forest edges and open habitats. Some people call it the “core” or the “heart” of a woodland. The presence of forest interior is a good sign of woodland health, and is directly related to the woodland’s size and shape. Large woodlands with round or square outlines have the greatest amount of forest interior. Small, narrow woodlands may have no forest interior conditions at all. Forest interior habitat is a remnant natural environment, reminiscent of the extensive, continuous forests of the past. This increasingly rare forest habitat is now a refuge for certain forest-dependent wildlife; they simply must have it to survive and thrive in a fragmented forest landscape (Conserving the Forest Interior. Ontario Extension Notes, 2000).
The Natural Heritage Reference Manual states that woodland interior habitat is usually defined as habitat more than 100 metres from the edge of the woodland and provides for relative seclusion from outside influences along with a moister, more sheltered and productive forest habitat for certain area sensitive species. Woodlands with interior habitat have centres that are more clearly buffered against the edge effects of agricultural activities or more harmful urban activities than those without.
In the Pike Lake catchment (in 2014), the 323 woodland patches contain 28 forest interior patches (Figure 42) that occupy four percent (271 ha.) of the catchment land area (which is less than the five percent of interior forest in the Tay River Subwatershed). This is below the ten percent figure referred to in the Environment Canada Guideline that is considered to be the minimum threshold for supporting edge intolerant bird species and other forest dwelling species in the landscape.
Most patches (22) have less than 10 hectares of interior forest, 12 of which have small areas of interior forest habitat less than one hectare in size. The remaining six patches contain interior forest between 11 and 84 hectares in area. A decrease (of two hectares) has been observed in the overall area of woodland interior between 2008 and 2014, as shown in Table 18.
Table 18 Woodland interior in the Pike Lake catchment (2008 and 2014)
Woodland Interior Habitat Size Range (ha)
Woodland Interior
Interior Change
2008
2014
2008 to 2014
Number
Area
Number
Area
Number
Area
Count
Percent
Ha
Percent
Count
Percent
Ha
Percent
Count
Ha
Less than 1
13
45
4
1
12
43
3
1
-1
-1
1 to 10
10
35
46
17
10
36
47
17
1
10 to 30
3
10
46
17
3
11
45
17
-1
30 to 50
1
3
39
14
1
3
39
14
50 to 100
2
7
138
51
2
7
137
51
-1
Totals
29
100
273
100
28
100
271
100
-1
-2
4.3 Wetland Cover
Wetlands are habitats forming the interface between aquatic and terrestrial systems. They are among the most productive and biologically diverse habitats on the planet. By the 1980s, according to the Natural Heritage Reference Manual, 68 percent of the original wetlands south of the Precambrian Shield in Ontario had been lost through encroachment, land clearance, drainage and filling.
Wetlands perform a number of important ecological and hydrological functions and provide an array of social and economic benefits that society values. Maintaining wetland cover in a watershed provides many ecological, economic, hydrological and social benefits that are listed in the Reference Manual and which may include:
contributing to the stabilization of shorelines and to the reduction of erosion damage through the mitigation of water flow and soil binding by plant roots
mitigating surface water flow by storing water during periods of peak flow (such as spring snowmelt and heavy rainfall events) and releasing water during periods of low flow (this mitigation of water flow also contributes to a reduction of flood damage)
contributing to an improved water quality through the trapping of sediments, the removal and/or retention of excess nutrients, the immobilization and/or degradation of contaminants and the removal of bacteria
providing renewable harvesting of timber, fuel wood, fish, wildlife and wild rice
contributing to a stable, long-term water supply in areas of groundwater recharge and discharge
providing a high diversity of habitats that support a wide variety of plants and animals
acting as “carbon sinks” making a significant contribution to carbon storage
providing opportunities for recreation, education, research and tourism
Historically, the overall wetland coverage within the Great Lakes basin exceeded 10 percent, but there was significant variability among watersheds and jurisdictions, as stated in the Environment Canada Guideline. In the Rideau Valley Watershed, it has been estimated that pre-settlement wetland cover averaged 35 percent using information provided by Ducks Unlimited Canada (2010) versus the 21 percent of wetland cover existing in 2014 derived from DRAPE imagery analysis.
Figure 43 Wetland cover in the Pike Lake catchment (Historic to 2014)
This decline in wetland cover is also evident in the Pike Lake catchment (as seen in Figure 43 and summarized in Table 19), where wetland was reported to cover 21 percent of the area prior to settlement, as compared to 20 percent in 2014. This represents a six percent loss of historic wetland cover. To maintain critical hydrological, ecological functions along with related recreational and economic benefits provided by these wetland habitats in the catchment, a “no net loss” of currently existing wetlands should be employed to ensure the continued provision of tangible benefits accruing from them to landowners and surrounding communities.
Table 19 Wetland cover in the Pike Lake catchment (Historic to 2014)
Wetland Cover
Pre-settlement
2008
2014
Change - Historic to 2014
Area
Area
Area
Area
Ha
Percent
Ha
Percent
Ha
Percent
Ha
Percent
Pike Lake
1303
21
1215
20
1220
20
-84
-6
Tay River
n/a
n/a
15280
19
15330
19
n/a
n/a
Rideau Valley
134115
35
n/a
n/a
82076
21
-52039
-39
4.4 Shoreline Cover
The riparian or shoreline zone is that special area where the land meets the water. Well-vegetated shorelines are critically important in protecting water quality and creating healthy aquatic habitats, lakes and rivers. Natural shorelines intercept sediments and contaminants that could impact water quality conditions and harm fish habitat in streams. Well established buffers protect the banks against erosion, improve habitat for fish by shading and cooling the water and provide protection for birds and other wildlife that feed and rear young near water. A recommended target (from the Environment Canada Guideline) is to maintain a minimum 30 metre wide vegetated buffer along at least 75 percent of the length of both sides of rivers, creeks and streams.
Figure 44 shows the extent of the ‘Natural’ vegetated riparian zone (predominantly wetland/woodland features) and ‘Other’ anthropogenic cover (crop/pastureland, roads/railways, settlements) along a 30-metre-wide area of land around Crosby, Little Crosby and Pike Lake and along both sides of the shoreline of the many unnamed watercourses (including headwater streams) found in the Pike Lake catchment.
Figure 44 Natural and other riparian land cover in the Pike Lake catchment
This analysis shows that the Pike Lake catchment riparian buffer is composed of woodland (50 percent),wetland (39 percent), settlement areas (four percent), crop and pastureland (three percent), meadow-thicket (three percent) and roads (one percent). Along the many watercourses (including headwater streams) flowing into Crosby, Little Crosby and Pike Lakes, the riparian buffer is composed of woodland (47 percent), wetland (44 percent), crop and pastureland (three percent), meadow-thicket (three percent), roads (two percent), and settlement areas (one percent).
Around Pike Lake itself, the shoreline buffer is dominated by woodland (54 percent) and cottages, houses and camps (29 percent) with the remainder comprised of wetland (15 percent) and roads (two percent). Similarly, the shoreline buffer around Crosby Lake is dominated by woodland (56 percent) and cottages, houses and camps (41percent) with the remainder comprised of wetland (two percent) and roads (one percent). Around Little Crosby Lake, the shoreline buffer is dominated by woodland (64 percent) and wetland (24 percent) with only six percent occupied by cottages and houses and the remainder comprised of roads (three percent) and meadow-thicket (three percent) .
Additional statistics for the Pike Lake catchment and Crosby, Little Crosby and Pike Lake itself are presented in Tables 20 to 24 and show that there has been very little change in shoreline cover from 2008 to 2014.
Table 20 Riparian land cover in the Pike Lake catchment (2008 vs. 2014)
Riparian Land Cover
2008
2014
Change - 2008 to 2014
Area
Area
Area
Ha.
Percent
Ha.
Percent
Ha.
Percent
Woodland
601.68
49.93
599.76
49.77
-1.92
-0.16
Wetland
467.84
38.82
470.04
39.00
2.20
0.18
> Unevaluated
(344.79)
(28.61)
(346.99)
(28.79)
(2.20)
(0.18)
> Evaluated
(123.05)
(10.21)
(123.05)
(10.21)
(0.00)
(0.00)
Settlement
48.39
4.02
48.92
4.06
0.53
0.04
Crop & Pasture
34.99
2.90
34.76
2.88
-0.23
-0.02
Meadow-Thicket
33.65
2.79
33.32
2.77
-0.33
-0.02
Transportation
18.29
1.52
18.29
1.52
0.00
0.00
Table 21 Riparian land cover around Pike Lake (2008 vs. 2014)
Riparian Land Cover
2008
2014
Change - 2008 to 2014
Area
Area
Area
Ha.
Percent
Ha.
Percent
Ha.
Percent
Woodland
41.12
54.53
41.03
54.41
-0.09
-0.12
Settlement
21.49
28.50
21.58
28.62
0.09
0.12
Wetland
11.33
15.04
11.33
15.04
0.00
0.00
> Unevaluated
(10.39)
(13.79)
(10.39)
(13.79)
(0.00)
(0.00)
>Evaluated
(0.94)
(1.25)
(0.94)
(1.25)
(0.00)
(0.00)
Transportation
1.36
1.81
1.36
1.81
0.00
0.00
Meadow-Thicket
0.08
0.11
0.08
0.11
0.00
0.00
Crop & Pasture
0.01
0.02
0.01
0.02
0.00
0.00
Table 22 Riparian land cover around Crosby Lake (2008 vs. 2014)
Riparian Land Cover
2008
2014
Change - 2008 to 2014
Area
Area
Area
Ha.
Percent
Ha.
Percent
Ha.
Percent
Woodland
24.53
55.83
24.53
55.83
0.00
0.00
Settlement
17.89
40.71
17.89
40.71
0.00
0.00
Wetland
0.85
1.94
0.85
1.94
0.00
0.00
> Unevaluated
(0.76)
(1.73)
(0.76)
(1.73)
(0.00)
(0.00)
> Evaluated
(0.09)
(0.21)
(0.09)
(0.21)
(0.00)
(0.00)
Transportation
0.67
1.53
0.67
1.53
0.00
0.00
Table 23 Riparian land cover around Little Crosby Lake (2008 vs. 2014)
Riparian Land Cover
2008
2014
Change - 2008 to 2014
Area
Area
Area
Ha.
Percent
Ha.
Percent
Ha.
Percent
Woodland
8.98
65.98
8.78
64.47
-0.20
-1.51
Wetland
3.22
23.66
3.22
23.66
0.00
0.00
>Unevaluated
(3.22)
(23.66)
(3.22)
(23.66)
(0.00)
(0.00)
Settlement
0.59
4.37
0.80
5.89
0.21
1.52
Transportation
0.44
3.27
0.44
3.27
0.00
0.00
Meadow-Thicket
0.36
2.71
0.36
2.71
0.00
0.00
Table 24 Riparian land cover along streams in the Pike Lake Catchment (2008 vs. 2014)
5.0 Pike Lake Catchment: Stewardship and Water Resources Protection
The RVCA and its partners are working to protect and enhance environmental conditions in the Tay River Watershed. Figure 45 shows the location of all stewardship projects completed in the Pike Lake catchment.
Figure 45 Stewardship site locations in the Pike Lake catchment
5.1 Rural Clean Water
The Rural Clean Water Program provides technical and financial assistance to farmers and other rural landowners, to aid in the implementation of projects that protect water quality. Funding is granted to those projects that support best management practices for application in the protection and improvement of surface and ground water resources. The program also supports climate change adaptation and low impact development projects as well as educating rural landowners about environmental stewardship of private property. Examples of supported projects include livestock exclusion fencing, controlled tile drainage, cover crops, erosion control, well related projects, and many more. For a list of eligible projects and to apply for funding, see Rural Clean Water.
In the Pike Lake catchment from 2011 to 2016, two septic system repairs, two erosion control projects, two windbreaks/buffers, one well upgrade and one fuel storage and handling facility were completed; prior to this, seven septic system repairs and two well upgrades had been completed. When combined, these projects are keeping 4.81 kilograms of Phosphorus out of our lakes, rivers and streams every year. Total value of all 17 projects is $128,554 with $18,779 of that amount funded through grant dollars from the RVCA.
5.2 Private Land Forestry
Forest cover and tree planting continues to be one of the most widely supported strategies to improve our environment. The many benefits of forest cover include carbon sequestration, flood mitigation and water quality improvement as well as providing wildlife habitat.
Through the RVCA's Trees for Tomorrow Program (and its predecessors), 11,000 trees were planted at two sites from 2011 to 2016; prior to this, 10,930 trees were planted at three sites. In total, 21,930 trees have been planted resulting in the reforestation of 12 hectares. Total project value of all five projects in the Pike Lake catchment is $49,735 with $44,549 of that amount coming from fundraising sources. For more information about the Program and landowner eligibility, please see the following: Tree Planting in the Rideau Valley Watershed and Trees for Tomorrow.
An additional 110 butternut trees were planted through the RVCA Butternut Recovery Program as part of efforts to introduce healthy seedlings from tolerant butternuts into various locations across Eastern Ontario.
5.3 Shoreline Naturalization
Natural shoreline buffers rich in native plants are critically important to protecting the health of our lakes, rivers and streams. Shoreline vegetation protects water quality and aquatic habitat by intercepting potentially harmful contaminants such as nutrients, pollutants and sediment, regulating water temperatures, slowing runoff and providing important fish and wildlife habitat. Natural shorelines also help improve climate change resiliency by increasing flood storage and providing protection from erosion during extreme weather events.
Though the RVCA’s Shoreline Naturalization Program, landowners (private and public property owners) have naturalized more than 2.3 kilometres of shoreline in the Tay Watershed by planting over 10,563 native trees and shrubs at 96 sites since 2008.
In the Pike Lake catchment, 814 native trees and shrubs have been planted along 180 metres of shoreline for a total project value of $9,507.
5.4 Septic System Re-inspection
Septic system re-inspection is provided by the RVCA through the Mississippi Rideau Septic System Office at the request of Rideau Lakes and Tay Valley Townships. From 2004 to 2017, the service has performed 316 mandatory and voluntary septic system re-inspections on 237 properties in the Pike Lake catchment, of which, 61 voluntary re-inspections were conducted on 58 properties around Crosby and Little Crosby Lake along with 255 mandatory re-inspections at 180 properties around Pike Lake.
Remedial/maintenance work (i.e. pump outs and baffle replacements that generally do not require a permit) was advocated for 34 of the Crosby and Little Crosby Lake re-inspections with more information being requested during four other inspections; no septic system replacements were identified as being needed at the Crosby and Little Crosby Lake inspections. On Pike Lake, remedial/maintenance work was recommended during 64 inspections, septic system replacements required at eight inspections along with more information being requested during another seven inspections.
5.5 Fish Habitat Improvement
Three fish habitat projects have been completed in Pike Lake with funding provided by the Ministry of Natural Resources Community Fisheries and Wildlife Involvement Program. The Pike Lake Community Association applied for and received $4000.00 for these improvements in 2012.
5.6 Valley, Stream, Wetland and Hazard Lands
The Pike Lake catchment covers 62 square kilometres with 11.6 square kilometres (or 19 percent) of the drainage area being within the regulation limit of Ontario Regulation 174/06 (Figure 46), giving protection to wetland areas and river or stream valleys that are affected by flooding and erosion hazards.
Wetlands occupy 12 square kilometres (or 23 percent) of the catchment. Of these wetlands, four square kilometres (or 33 percent) are designated as provincially significant and included within the RVCA regulation limit. This leaves the remaining 8 sq. km (or 67 percent) of wetlands in the catchment outside the regulated area limit.
Of the 197.7 kilometres of stream in the catchment, regulation limit mapping has been plotted along 39.7 kilometers of streams (representing 20 percent of all streams in the catchment). Some of these regulated streams (27.9 km) flow through regulated wetlands; the remaining 11.9 kilometres of regulated streams are located outside of those wetlands. Plotting of the regulation limit on the remaining 157.9 kilometres (or 80 percent) of streams requires identification of flood and erosion hazards and valley systems.
Within those areas of the Pike Lake catchment subject to the regulation (limit), efforts (have been made and) continue through RVCA planning and regulations input and review to manage the impact of development (and other land management practices) in areas where “natural hazards” are associated with rivers, streams, valley lands and wetlands. For areas beyond the regulation limit, protection of the catchment’s watercourses is only provided through the “alteration to waterways” provision of the regulation.
Figure 46 Regulated natural features and hazards in the Pike Lake catchment
5.7 Vulnerable Drinking Water Areas
Mississippi-Rideau Source Water Protection Program has mapped only one very small part of the Pike Lake catchment as a Significant Groundwater Recharge Areas and all of the catchment as a Highly Vulnerable Aquifer. This means that the nature of the overburden (thin soils, fractured bedrock) does not provide a high level of protection for the underlying groundwater making the aquifer more vulnerable to contaminants released on the surface. There are no Well-Head Protection Areas in the catchment.
The Mississippi-Rideau Source Protection Plan includes policies that focus on the protection of groundwater region-wide due to the fact that most of the region, which encompasses the Mississippi and Rideau watersheds, is considered Highly Vulnerable Aquifer. For detailed maps and policies that have been developed to protect drinking water sources, visit the Mississippi-Rideau Source Protection Region website.
Developed by the Pike Lake Community Association and volunteers, the Report on the State of Pike Lake and its Watershed (2009) and the Keeping Pike Lake Healthy Stewardship Handbook (2011) provide information on many aspects of the lake environment, as well as issues of concern and actions to be taken to maintain and improve the long-term health of the lake. The following list includes some of the accomplishments of the Pike Lake Community Association and residents that have implications for the well-being of the land and water resources of the lake ecosystem. Specific achievements of the Pike Lake community are indicated by an asterisk.
Pike Lake and Catchment Health
Invasive Species
Pike Lake Community Association applied for and received funding from the Ministry of Natural Resources (MNR) and installed signage at the public boat launch to raise awareness about practices to reduce the spread of invasive species.*
Septic Inspections
Pike Lake Community Association promotes the importance of proper septic system maintenance in news articles and stewardship reports in the Pike Lake Post and at the Pike Lake AGM.*
Pike Lake Community Association sponsored and promoted a free workshop, “Be Septic Savvy” (2012) in partnership with Tay Valley Township, the Mississippi Valley Conservation Authority, the Lake Networking Group and the Otty Lake Association.*
316 mandatory and voluntary septic system re-inspections have been conducted by the Mississippi-Rideau Septic System Office on 237 properties in the Pike Lake catchment as a service provided to Rideau Lakes and Tay Valley Townships, since 2004.
Shoreline Naturalization
Importance of keeping shorelines natural is intertwined with news articles and stewardship reports in the Pike Lake Post and at the Pike Lake AGM. Examples include information articles on “Naturalized Shoreline” and grant opportunities featured in the 2011, 2012 and 2013 Pike Lake Post.*
814 native trees and shrubs have been planted at 13 project sites by the RVCA Shoreline Naturalization Program at an average buffer width of three metres along 180 metres of shoreline.
Tree Planting
21930 trees have been planted at five sites in the Pike Lake catchment by the RVCA Private Land Forestry Program, resulting in the reforestation of 12 hectares.
Water Quality
Pike Lake Community Association (PLCA) has participated annually in the RVCA Watershed Watch Program since it began in 2001.*
Pike Lake Steward has provided annual reports of water quality at the PLCA Annual General Meeting and prepared a summary report of water quality results from 2001-2010 in the 2011 Pike Lake Post newsletter, along with a feature article on water quality testing in the 2015 newsletter.*
Pike Lake water quality monitoring data from 2001-2015 is posted on pikelake.ca.*
Pike Lake Community Association promoted the use of phosphate-free soaps and cleaners in the Lake Steward’s report at the 2013 Pike Lake AGM.*
Crosby Lake, Elbow Lake and little Crosby Lake are each sampled yearly by the RVCA for five parameters, four times a year.
Seven Rural Clean Water Program projects were completed by the RVCA Rural Clean Water Program.
Pike Lake and Catchment Habitat
Fish Habitat
Pike Lake Community Association applied for and received $4000.00 through the Ministry of Natural Resources Community Fisheries and Wildlife Involvement Program to create three walleye spawning beds (2012).*
In-Water Habitat
Pike Lake Community Association article on research into algae and aquatic plant growth featured in the 2015 Pike Lake Post. PLCA invited the RVCA to speak about Algae Watch (Aquatic Vegetation Research Project) and learn about potentially harmful algae blooms (2013). An interactive display board on algae was featured at the 2016 Pike Lake Boatilla.*
Nineteen headwaters sites are sampled once every six years by the RVCA Stream Characterisation Program.
Island Habitat
Pike Lake Community Association worked with the Ministry of Natural Resources to identify suitable campsites on Pike Lake crown land islands. PLCA applied for and received funding from MNR and installed signage at boat launch promoting responsible camping. Installed tent symbol sign on Big Island where camping is permitted and no camping signs for islands MNR advises are too small for healthy camping.*
Loon Survey
Pike Lake Community Association participated in the Canadian Lakes Loon Survey (2012-present) and promotes responsible loon viewing following survey protocols and reports the observations in the Pike Lake Post and at the Pike Lake AGM. Survey results promote discussion of threats to loons and other waterfowl.*
Pike Lake Association Leadership
Municipal Liaison
Pike Lake Community Association invited the Reeve of Tay Valley Township to the Pike Lake AGM every year to speak about municipal issues and events affecting Pike Lake residents.*
Pike Lake Community Association provided input based on Lake Stewardship Handbook to Tay Valley Township’s Official Plan Review (2014) with a copy included in 2014 Pike Lake Post.*
Pike Lake Education
Pike Lake Community Association established a sub-committee which presented a guide, “Watch your Wake” included with 2013 Pike Lake Post and on the PLCA website. This has been distributed and shared as an example for boaters on Pike Lake and other lakes.*
Private donor on Pike Lake funded “slow” signs at sensitive locations with input from MNR and Transport Canada. Obtained funding from MNR for signage at public boat launch (2012).*
Pike Lake Community Association hosted “Bug Talk” at Boatilla 2015, where participants young and old learned about the invertebrates that live at the shoreline.*
Pike Lake Community Association raised awareness about Eurasian Milfoil and how it can spread as part of the Pike Lake Steward’s report at the 2014 Pike Lake AGM.*
Each year, the Pike Lake Post includes a feature article in the “Science for the Family” section: the Northern Pike (2012), Canadian Beaver (2013), Common Loon (2014), Great Blue Heron (2015) and Ticks and Lyme Disease (2016).*
Copies of the Pike Lake Post, Pike Lake State of the Lake Report, and of “Keeping Pike Lake Healthy” are available on the PLCA website for easy access and reprinting.*
Lake Planning
Pike Lake Community Association prepared the State of Pike Lake and its Watershed (2009) report that provides a summary of what is currently known about the Pike Lake watershed and which describes how that information relates to the issues that are important to people who enjoy the lake. Members of the Pike Lake community will use this information to develop actions and recommendations that help ensure the long-term health of Pike Lake and its watershed.*
Pike Lake Community Association prepared the Pike Lake Stewardship Handbook "Keeping Pike Lake Healthy" (2011) that provides an overview of Pike Lake, a summary of the key issues facing Pike Lake, and simple, inexpensive, and effective actions residents - individually and collectively - can take to keep Pike Lake healthy for present and future generations. It draws on the outcomes of the several-year process in which Pike Lakers identified issues affecting the present and future quality of the water and the Pike Lake environment more generally, and discusses how to preserve and improve the water quality and the lake environment.*
Pike Lake Community Association summarized the actions taken by the lake association in the report "Pike Lake Stewardship Update 2011-2016" that provides suggestions of potential actions to take moving forward. Since 2011, the PLCA has undertaken stewardship actions each year that have addressed the three priorities of water quality, natural environment and development pressures.*
Developed by the Pike Lake Community Association and volunteers, the Report on the State of Pike Lake and its Watershed (2009) and the Keeping Pike Lake Healthy Stewardship Handbook (2011) provide information on many aspects of the lake environment, as well as issues of concern identified by the lake community that could threaten the long-term health of the lake. The following list includes some of those identified issues that have implications for the land and water resources of the lake ecosystem. Specific issues noted by the lake community are indicated by an asterisk.
Development
Potential impacts to the lake environment from secondary shoreline development (i.e. second tier) is an ongoing concern.*
Waterfront property development is occurring primarily through the transformation of traditional, seasonal cottages into larger year-round dwellings. This transition is taking place either through re-development of an existing cottage lot or incremental alterations (additions, sleeping cabins, gazebos, decks, sheds, boat houses, garages, lawns, shoreline modifications, docks), all of which may put additional stress on the sensitive shoreline zone and the lake along with potential, added septic system loading.
Many waterfront properties contain existing non-conforming dwellings with respect to minimum water frontage and lot area and are often located within 30 metres of the water that require minor variances for expansion and/or reconstruction of dwellings where standard development setbacks from water are difficult to achieve. In these cases, of which there are many, staff at Rideau Lakes and Tay Valley Townships and the Conservation Authority often meet with resistance and push back when attempts are made to implement standards for development setbacks, vegetated shorelines and septic systems.
Monitoring implementation of conditions of planning and regulatory approvals is challenging due to a lack of resources.
Headwaters/In-Water Habitat/Shorelines
Introduction of invasive species (e.g., Eurasian Milfoil, Zebra Mussel) to Pike Lake and the control of their spread.*
Pike Lake has 69 percent of its shoreline composed of natural vegetation. This is below the 75 percent target that is recommended by experts for the protection of the catchment’s waterbodies and watercourses, 30 metres back from the shoreline of streams, rivers and lakes (see Section 4.4 of this report).
Crosby Lake has 58 percent of its shoreline composed of natural vegetation. This is below the 75 percent target that is recommended by experts for the protection of the catchment’s waterbodies and watercourses, 30 metres back from the shoreline of streams, rivers and lakes (see Section 4.4 of this report).
Little Crosby Lake has seen a small increase in the area of settlement (0.21 ha.) along its shoreline between 2008 and 2014, due to a loss of woodland (see Section 4.4 of this report).
Pike Lake has seen a small increase in the area of settlement (0.09 ha.) along its shoreline between 2008 and 2014, due to a loss of woodland (see Section 4.4 of this report).
Four of nineteen sampled headwater sites in the catchment have been modified (three are channelized; one is a roadside ditch)(see Section 3.4.2 of this report).
Littoral zone mapping identifying substrate type, vegetation and habitat features along with opportunities for shoreline enhancement is unavailable for Crosby, Little Crosby and Pike Lakes.
Lake Planning
Nine key issues identified by lake residents in the Report on the State of Pike Lake and its Watershed (2009): 1) Water quality 2) Development pressures 3) Conservation and protection of the natural environment 4) Impacts of motor vehicles 5) Crown land 6) Mining concerns 7) Aquatic vegetation 8) Water levels 9) Fisheries health.*
Land Cover
Land cover has changed across the catchment (2008 to 2014) largely as a result of an increase in the area of wetland (5 ha.) and settlement (4 ha.) and loss of woodland (4 ha.), crop and pastureland (2 ha.) and meadow-thicket (1 ha.)(see Section 4.1 of this report).
Wetlands have declined by six percent since European pre-settlement and now cover 20 percent (1220 ha.) of the catchment (in 2014). Sixty-five percent (792 ha.) of these wetlands remain unevaluated and unregulated and although they are not under imminent threat from development activity, they do remain vulnerable to drainage and land clearing activities in the absence of any regulatory and planning controls that would otherwise protect them for the many important hydrological, social, biological and ecological functions/services/values they provide to landowners and the surrounding community (see Section 4.3 of this report).
Mis/overuse of the Crown Land islands in the lake, including fire danger and garbage from camping activity.*
Water Levels
Management of water levels on Pike Lake for waterfront property owners; in particular, flooding in the spring and late fall and the lack of adequate drainage at its outlet to Grants Creek.*
Water Quality
Algal blooms are a source of concern for Pike Lake residents.*
Stanleyville Dump remains a concern to residents of Pike Lake for its potential impact on surface and groundwater quality.*
Crosby Lake surface chemistry water quality rating ranges from Fair to Good (see Section 2.1 of this report).
Little Crosby Lake surface chemistry water quality rating is Fair. The score at this site is largely influenced by occasional high nutrient concentrations, bacterial pollution and metal (aluminum) exceedances (see Section 2.2 of this report).
Pike Lake surface chemistry water quality does not exhibit any sampling concerns (see Section 2.3 of this report).
Seventy-two (of 255) Tay Valley Township mandatory septic system inspections conducted from 2004 to 2017 on Pike Lake revealed the need for remedial work (on 64 systems) and replacements (of eight systems) to be performed. An additional seven inspections require more information to be provided to landowners. Those properties with concerns are identified in the yearly report submitted by the Mississippi Rideau Septic System Office to the Township.
Thirty-four (of 61) Rideau Lakes Township voluntary septic system re-inspections conducted from 2007 to 2017 on Crosby and Little Crosby Lake revealed the need for remedial/maintenance work to be performed on 34 septic systems and no replacements. An additional four inspections require more information to be provided to landowners. Those properties with concerns are identified in the yearly report submitted by the Mississippi Rideau Septic System Office to the Township.
Wildlife
Protection of the Pike Lake loon population from human activity (e.g., from watercraft incursions; fishing and hunting residues).*
Developed by the Pike Lake Community Association and its partners, the Report on the State of Pike Lake and its Watershed (2009) and the Keeping Pike Lake Healthy Stewardship Handbook (2011) provide information on many aspects of the lake environment, as well as actions and opportunities to maintain and improve the long-term health of the lake. The following list includes some of those identified actions and opportunities that have implications for the land and water resources of the lake ecosystem. Specific actions and opportunities noted by the Pike Lake community are indicated by an asterisk.
Pike Lake and Catchment Health
Development
Work with approval authorities (Lanark County, Leeds Grenville and Lanark District Health Unit, Mississippi Rideau Septic System Office, Rideau Lakes and Tay Valley Townships) and waterfront property owners (including the Crosby Lake Association, Little Crosby Lake community, Pike Lake Community Association and RVCA) to consistently implement current land use planning and development policies for water quality and shoreline protection adjacent to Crosby, Little Crosby and Pike Lakes and headwater streams in the catchment (i.e., a minimum 30 metre development setback from water).
Explore ways and means to more effectively enforce and implement conditions of land-use planning and development approval to achieve net environmental gains (particularly with respect to rehabilitating or protecting naturally vegetated shorelines and water quality).
Encourage Committees of Adjustment to take advantage of technical and environmental information and recommendations forthcoming from planning and environmental professionals.
Municipalities in the Tay Watershed are encouraged to strengthen natural heritage and water resources official plan policies and zoning provisions (pertaining to water setbacks, frontage and naturalized shorelines and wetland protection) where deemed appropriate.
Work with Lanark County, Rideau Lakes and Tay Valley Townships and agencies to ensure that development approvals around lakes and along watercourses take into consideration the protection of fish habitat (including the near-shore nursery and spawning habitat).
Municipal and agency planners together with development proponents are to use the 2014 Site Evaluation Guidelines to inform decision-making about the application of development setbacks on lots with shallow soils/bedrock, steep slopes and sparse vegetation cover along with the use of the appropriate, development related, best management practices.
Utilize RVCA subwatershed and catchment reports to help develop/revise official plan policies to protect surface water resources and the natural environment (including woodlands, wetlands and shoreline cover).
Establish RVCA regulation limits around the 65 percent (792 ha.) of wetlands in the catchment that are unevaluated. Doing this will help protect landowners from natural hazards including mitigating surface water flow by storing water during periods of peak flow (such as spring snowmelt and heavy rainfall events) and releasing water during periods of low flow (this mitigation of water flow reduces flood damage), as well as contributing to the stabilization of shorelines and to the reduction of soil erosion damage through water flow mitigation and plant soil binding/retention.
Shorelines
Pike Lake Community Association will continue to promote the RVCA Shoreline Naturalization Program because well-vegetated shorelines are one of the most effective ways to protect water quality. Planting shrubs and plants - which won’t block the lake view - will:*
trap runoff and excess nutrients
discourage growth of algae and aquatic plants
provide shelter and food for wildlife
support spawning beds for fish
shade and cool water
reduce erosion
Identify possible demonstration sites (i.e., crown or private land volunteered by landowner) for shoreline naturalization. Pike Lake Community Association could provide volunteers to do the plantings and follow-up monitoring.*
Host plant day to promote naturalized shorelines and to make native plants accessible to the Pike Lake Community Association membership.*
Take advantage of the RVCA Shoreline Naturalization Program to re-naturalize altered creek, lake and stream shoreline identified in this report as “Unnatural Riparian Land Cover". Concentrate stewardship efforts on Crosby Lake and Pike Lake waterfront properties shown in orange on the Riparian Land Cover map (see Figure 44 in Section 4.4 of this report).Other stewardship opportunities in the catchment may be determined based on septic system inspections and surface water quality monitoring results.
Promote the use of bioengineering methods (using native shrub/tree planting, fascines, live stakes) as a shoreline erosion mitigation measure as well as a cost effective alternative to shoreline hardening (with rip rap, armour stone, gabion baskets, walls)
Educate landowners about the value and importance of natural shorelines and property best management practices with respect to shoreline use and development, septic system installation and maintenance and, shoreline vegetation retention and enhancement (Crosby Lake Association, Lanark County, Leeds Grenville and Lanark District Health Unit, Little Crosby Lake community, Mississippi Rideau Septic System Office, Pike Lake Community Association, RVCA, Rideau Lakes and Tay Valley Townships).
Water Quality
Pike Lake Community Association (PLCA) will continue to work with the RVCA Watershed Watch Program to collect and analyse water samples every summer - a critical tool in tracking the health of the lake - and report the results to the PLCA through the Pike Lake Post and the PLCA website. A follow-up on the results will occur as appropriate, as well as examining the merits of increasing the number of sites sampled.*
Continue to educate landowners about the causes of excessive algae and aquatic vegetation growth and the need to reduce total phosphorus inputs to Pike Lake through good stewardship practices.*
Examine value of further partnering with a data management organisation (e.g., Water Rangers) to have data mapped and easily accessible to Pike Lake Community Association membership and the public.*
Provide a summary of outcomes of voluntary and mandatory septic re-inspection programs on catchment lakes over a five year period.*
Consider further investigation of the 1) Fairsurface chemistry water quality rating on Little Crosby Lake and 2) Fair to Goodsurface chemistry water quality rating on Crosby Lake as part of a review of RVCA's Watershed Watch, Baseline and Benthic Invertebrate surface water quality monitoring.
Promote the septic system re-inspection program offered by the Mississippi Rideau Septic System Office on behalf of Rideau Lakes and Tay Valley Townships.
Offer funding provided by the RVCA Rural Clean Water Program to landowners with potential projects that could improve water quality on Crosby, Little Crosby and Pike Lakes and their tributaries (e.g., livestock fencing, septic system repair/replacement and streambank erosion control/stabilisation). Concentrate efforts at septic systems requiring remedial work or replacement, including the 106 identified as needing additional maintenance/remedial/replacement work since 2004.
Educate waterfront property owners about septic system care by providing information about sewage system maintenance (i.e., when to pump out septic systems and holding talks) through initiatives such as the Septic Savvy Workshop and services provided by the Mississippi Rideau Septic System Office.
Reduce pollutant loadings to Crosby, Little Crosby and Pike Lakes through education about the application of shoreline, stormwater and agricultural best management practices; also consider using low impact development (LID) methods to improve the quality and reduce the amount of stormwater runoff directly reaching the lake ecosystem. This will be particularly beneficial in areas with extensive impervious surfaces (i.e., asphalt, concrete, buildings, and severely compacted soils) or on sensitive waterfront properties (with steep slopes/banks, shallow/impermeable soils).
Pike Lake and Catchment Habitat
Aquatic Habitat/Fisheries/Wildlife
Raise awareness about risks of invasive species in the Pike Lake Post and website (e.g., feature article) and at special events.*
Carry-on with annual clean-up of crown owned islands in Pike Lake and check-up of camp sites. Install additional signage about camping etiquette, permissions and restrictions, as required.*
Promote participation in Canadian Lakes Loon Survey and other Bird Survey programs to increase robustness of observations at Pike Lake. Should findings indicate three successive years of no nesting, consider installing loon nesting platforms to provide suitable habitat.*
Install the third outstanding walleye spawning bed, off Wilson Island in Pike Lake.*
Educate waterfront property owners about: 1) fish habitat requirements, spawning timing and near-shore and in-water activities that can disturb or destroy fish habitat and spawning sites 2) the causes of excessive algae and aquatic vegetation growth (see the RVCA publication entitled Algae and Aquatic Plant Educational Manual) and 3) healthy lake ecosystems and associated water level fluctuations in a natural environment.
Crosby and Pike Lake Association Leadership
Lake Planning
Pike Lake Association is leading the implementation of the many "Possible Next Steps" listed in the report "Pike Lake Stewardship Update 2011-2016" that provides suggestions of potential actions to take moving forward. Since 2011, the Pike Lake Community Association has undertaken stewardship actions each year that have addressed the three priorities of water quality, natural environment and development pressures.*
Use the information contained in the Tay River Subwatershed Report 2017 and Pike Lake Catchment Report 2017 to assist with a review/update of the State of Pike Lake and its Watershed (2009) report.
Crosby Lake Association may wish to consider a lake planning process to develop a Lake Plan that: • Is an action plan developed by a lake community that identifies and preserves the natural and social characteristics that are valued by the lake community for future generations • Helps to promote community discussion, education and action • Sets goals and objectives for the protection and enhancement of the lake • Recommends land use policies/practices that influence development on the lake • Promotes stewardship actions to improve the environmental conditions of a lake so it can be enjoyed by future generations.
Municipal Liason
Invite the Reeve of Tay Valley Township to the Pike Lake AGM to speak about municipal issues and events affecting Pike Lake residents.*
Pike Lake Education
Review Pike Lake signage to identify other sensitive areas and hazards for potential marking, and mark as appropriate.*
Host workshops and facilitate naturalist activities promoting knowledge of the Pike Lake environment. Note that the Boatilla (or a similar event) is an excellent venue for such activities.*
Continue to solicit input and article ideas from Pike Lake Community Association membership and include features in the “Science for the Family” section of the Pike Lake Post.*
Invite special guest speakers to the Pike Lake AGM to talk about lake health and protection.*
Promote environmentally friendly boating with the “Watch your Wake” guide prepared by the Pike Lake Community Association.*
Make copies of the Pike Lake Post, Pike Lake State of the Lake Report and Keeping Pike Lake Healthy accessible on the Pike Lake Community Association website.*
Figure 1 Land cover in the Rudsdale Creek catchment
The RVCA produces individual reports for 14 catchments in the Tay River subwatershed. Using data collected and analyzed by the RVCA through its watershed monitoring and land cover classification programs, surface water quality and in-stream conditions are reported for the Tay River, Tay Watershed lakes and Tay tributaries along with a summary of environmental conditions for the surrounding countryside every six years, which includes analysis of data collected through the programs along with local information provided by stakeholders up to 2017.
This information is used to better understand the effects of human activity on our water resources, allows us to better track environmental change over time and helps focus watershed management actions where they are needed the most to help sustain the ecosystem services (cultural, aesthetic and recreational values; provisioning of food, fuel and clean water; regulation of erosion/natural hazard protection and water purification; supporting nutrient/water cycling and habitat provision) provided by the catchment’s lands and forests and waters (Millennium Ecosystem Assessment 2005).
The following sections of this report are a compilation of that work for the Rudsdale Creek catchment.
Table of Contents: Rudsdale Creek Catchment Report
The Rudsdale Creek Catchment resides within part of the physiographic region known as the Algonquin Highlands. In the Tay River Subwatershed, this ancient and hilly geologic region is made up of such Precambrian rocks as marble, conglomerates, and dark or colour banded granite-like rocks. An area of younger sandstone is located within the southern section of the catchment. A veneer of glacial drift (glacial till, sand etc.) overlies the bedrock except in the southern part of the catchment where bedrock is overlain by larger expanses of glacial till and clay. A geologic fault may run through the eastern section of the catchment.
Drainage Area
62 square kilometers:occupies 7.8 percent of the Tay River subwatershed and 1.5 percent of the Rideau Valley watershed.
Stream Length
All tributaries (including headwater streams): 132.7 kilometres
1.2 Vulnerable Areas
Aquifer Vulnerability
The Mississippi-Rideau Source Water Protection Program has mapped the southern part of this catchment as a Significant Groundwater Recharge Area (SGRA) and all of the catchment as a Highly Vulnerable Aquifer (HVA). There are no Well-Head Protection Areas in the catchment.
Wetland Hydrology
A watershed model developed by the RVCA in 2009 was used to study the hydrologic function of wetlands in the Rideau Valley Watershed, including those found in the Rudsdale Creek catchment.
1.3 Conditions at a Glance
Aggregates
Four aggregate licenses in the Rudsdale Creek catchment along with some sand and gravel areas of secondary and tertiary significance.
Fish Community/Thermal Regime
Warm and cool water recreational and baitfish fishery with 23 species observed in Rudsdale Creek during 2017.
Headwater Drainage Features
Primary classified as wetland and natural features with minimal modifications.
Instream/Riparian Habitat
Rudsdale Creek: Low to high habitat complexity was identified for Rudsdale Creek. Regions with increased habitat complexity were observed in the lower reaches of the system within the catchment. Rudsdale Creek has a healthy diversity of plant types and levels throughout most of the surveyed sections; however there were areas with extensive vegetation which can have an impact on oxygen levels. Dissolved oxygen conditions along Rudsdale Creek varied along the system with sections in the lower reaches below levels to support aquatic life as well as areas in its upper reaches that support warm and cool water species .
Land Cover Change - Rudsdale Creek Catchment (2008 to 2014)
Catchment
Crop-Pasture
Woodland
Meadow-Thicket
Settlement
Aggregate
Wetland
Hectares
-4
-3
-3
+5
+2
+2
Land Cover Type - Rudsdale Creek Catchment (2014)
Catchment
Woodland
Crop-Pasture
Wetland
Settlement
Meadow-Thicket
Transportation
Water
Aggregate
Percent
47
26
16
4
3
3
1
<1
Shoreline Cover Type (30 m. riparian area; 2014)
Catchment-Wide
Percent
Rudsdale Creek
Percent
Streams*
Percent
Wetland
39
Wetland
59
Woodland
40
Woodland
37
Woodland
18
Wetland
35
Crop-Pasture
18
Crop-Pasture
13
Crop-Pasture
20
Transportation
2
Meadow-Thicket
5
Transportation
2
Meadow-Thicket
2
Transportation
3
Settlement
2
Settlement
2
Settlement
2
Meadow-Thicket
1
Aggregate
<1
---
---
---
---
*Excludes Rudsdale Creek
Significant Natural Features
N/A
Species at Risk (Elemental Occurrence)
Status
Species at Risk
Threatened
Blanding's Turtle
Bobolink
Eastern Meadowlark
Least Bittern
Water Quality for the Protection of Aquatic Life
Water Quality Source
Rudsdale Creek
Surface Chemistry
Fair to Good
Instream Biological
Poor
Rudsdale Creek: Benthic invertebrate samples are dominated by species that are tolerant to high organic pollution levels at the Lanark County Road 6 monitoring location.
Water Wells
Approximately 345 operational, private water wells are to be found in the Rudsdale Creek catchment. Groundwater uses are mainly domestic but also include industrial, livestock and public water supplies.
Wetland Cover
Wetlands are reported to have covered 33 percent of the Rudsdale Creek catchment prior to European settlement, as compared to 16 percent (or 10 square kilometres) of the area in 2014. This represents a 51 percent (or 10 square kilometre) loss of historic wetland cover. All are unevaluated and unregulated.
1.4 Catchment Care
Environmental Management
Rudsdale Creek and its tributaries are protected through the “alteration to waterways” provision of Ontario Regulation 174-06 (entitled “Development, Interference with Wetlands and Alterations to Shorelines and Watercourses”) that protects landowners and their property from natural hazards (flooding, fluctuating water table, unstable soils) associated with them.
Environmental Monitoring
Chemical surface (in-stream/lake) water quality collection by the RVCA since 2003 (see Section 2 of this report).
Benthic invertebrate (aquatic insect) surface (in-stream) water quality collection by the RVCA in Rudsdale Creek since 2003 (see Section 3.3.1 of this report).
Fish survey and stream characterization survey by the RVCA on Rudsdale Creek in 2016 taking measurements and recording observations on instream habitat, bank stability, other attributes and preparing a temperature profile (see Section 3 of this report).
Thirty-two drainage feature assessments were conducted by the RVCA in 2017 at road crossings in the catchment. The protocol measures zero, first and second order headwater drainage features and is a rapid assessment method characterizing the amount of water, sediment transport, and storage capacity within headwater drainage features. (see Section 3.4 of this report).
Classification of Rudsdale Creek catchment land cover classes using data acquired during the spring of 2008 and 2014 from colour aerial photography (see Section 4.1 of this report).
Provincial groundwater level and chemistry, air pressure and precipitation data is available from an MOE Provincial Groundwater Monitoring Network site located near Glen Tay (W083). Provincial groundwater chemistry information is also available from one Ontario Geological Survey well (#13-AG-002) in this catchment.
Stewardship
Twenty-one stewardship projects undertaken (see Section 5 of this report).
2.0 Rudsdale Creek Catchment: Water Quality Conditions
Surface water quality conditions in the Rudsdale Creek catchment are monitored by the Rideau Valley Conservation Authority's (RVCA) Baseline Water Quality Program. The baseline water quality program focuses on streams; data is collected for 22 parameters including nutrients (total phosphorus, total Kjeldahl nitrogen and ammonia), E. coli, metals (like aluminum and copper) and additional chemical/physical parameters (such as alkalinity, chlorides, pH and total suspended solids). Figure 2 shows the locations of monitoring sites in the catchment.
Figure 2 Water quality monitoring sites on the Rudsdale Creek in the Rudsdale Creek Catchment
2.1 Rudsdale Creek: Water Quality Rating
There is one monitored water quality site on Rudsdale Creek in the Rudsdale Creek Catchment (RUD-01). The RVCA's water quality rating for it ranges from “Fair to Good” (Table 1) as determined by the Canadian Council of Ministers of the Environment (CCME) Water Quality Index.
A “Fair” rating indicates that water quality is usually protected but is occasionally threatened or impaired; conditions sometimes depart from natural or desirable levels. A rating of "Good" indicates that only a minor degree of threat or impairment is observed and conditions rarely depart from natural or desirable levels.
Each parameter is evaluated against established guidelines to determine water quality conditions. Those parameters that frequently exceed guidelines are presented below.
Data has been analyzed over the 2006-2017 period for general trends and conditions. Table 1 shows the overall rating for the monitored surface water quality sites within the catchment and Table 2 outlines the Water Quality Index (WQI) scores and their corresponding ratings.
Table 1 Water Quality Index ratings for the Rudsdale Creek Catchment
Site
Location
2006-2008
2009-2011
2012-2014
2015-2017
RUD-01
Rudsdale Creek at County Rd 6
Fair (65)
Fair (74)
Fair (79)
Good (86)
Table 2 Water Quality Index ratings and corresponding index scores (RVCA terminology, original WQI category names in brackets)
Rating
Index Score
Very Good (Excellent)
95-100
Good
80-94
Fair
65-79
Poor (Marginal)
45-64
Very Poor (Poor)
0-44
2.1.1 Rudsdale Creek: Nutrients
Total phosphorus (TP) is used as a primary indicator of excessive nutrient loading and may contribute to abundant aquatic vegetation growth and depleted dissolved oxygen levels. The Provincial Water Quality Objective (PWQO) is used as the TP Guideline and states that in streams concentrations greater than 0.030 mg/l indicate an excessive amount of TP.
Total Kjeldahl nitrogen (TKN) is used as a secondary indicator of nutrient loading. RVCA uses a guideline of 0.500 mg/l to assess TKN[1] concentrations in the Jock River.
Tables 3 and 4 summarize average nutrient concentrations at monitored sites within the Rudsdale Creek catchment and show the proportion of results that meet the guidelines.
Table 3 Summary of total phosphorus results for the Rudsdale Creek catchment from 2006-2017 (Highlighted values indicate average concentrations exceed the guideline)
Total Phosphorus 2006-2017
Site
Average (mg/l)
Below Guideline
No. Samples
STU-01
0.032
46%
71
Table 4 Summary of total Kjeldahl nitrogen results for the Rudsdale Creek catchment from 2006-2017 (Highlighted values indicate average concentrations exceed the guideline)
Total Kjeldahl nitrogen 2006-2017
Site
Average (mg/l)
Below Guideline
No. Samples
RUD-01
0.835
10%
71
Monitoring Site RUD-01
Elevated TP results occurred regularly at site RUD-01 throughout the monitoring period; 46% of samples were below the guideline (Figure 4). Average concentrations exceeded the guideline during the summer months, with lower concentrations (below guideline) observed in April and November (Figure 3). The average TP concentration was just above the guideline of 0.030 mg/l at 0.032 mg/l (Table 3).
The majority of TKN results have also exceeded the guideline (Figure 6); only 10 percent of samples were below the guideline. The average concentration was 0.835 mg/l and exceeded the guideline of 0.500 mg/l (Table 4). Average monthly data showed a similar pattern to TP results, with the highest concentrations observed during the summer months, and lower concentrations in April and November (Figure 5).
There was no significant change[2] in the sampled concentrations of TP or TKN at this site over the 2006-2017 period (Figures 4 and 6).
Figure 3 Average monthly total phosphorus concentrations in Rudsdale Creek, 2006-2017.
Figure 4 Distribution of total phosphorus concentrations in Rudsdale Creek, 2006-2017.
Figure 5 Average monthly total Kjeldahl nitrogen concentrations in Rudsdale Creek, 2006-2017.
Figure 6 Distribution of total Kjeldahl nitrogen concentrations in Rudsdale Creek, 2006-2017
Summary of Rudsdale Creek Nutrients
Results of the monitored site on Rudsdale Creek shows that nutrient enrichment is a feature of this creek. Elevated nutrients may result in nutrient loading downstream and to the Tay River. High nutrient concentrations can help stimulate the growth of algae blooms and other aquatic vegetation in a waterbody and deplete oxygen levels as the vegetation dies off. It should be noted that this creek is fed by extensive wetlands; this wetland complex is naturally nutrient rich and is likely a notable contributor to naturally elevated nutrient conditions. Development in this area is also minimal but there is a large portion of agricultural land; best management practices such as minimizing storm water runoff, enhanced shoreline buffers, minimizing/discontinuing the use of fertilizers and restricting livestock access in both surrounding agricultural and developed areas can help to reduce additional nutrient enrichment within this creek.
2.1.2 Rudsdale Creek E. coli
Escherichia coli (E. coli) is used as an indicator of bacterial pollution from human or animal waste; in elevated concentrations it can pose a risk to human health. The PWQO of 100 colony forming units/100 millilitres (CFU/100 ml) is used as a guideline. E. coli counts greater than this guideline indicate that bacterial contamination may be a problem within a waterbody.
Table 5 summarizes the geometric mean[3] for the monitored site on Rudsdale Creek and shows the proportion of samples that meet the E. coli guideline of 100 CFU/100 ml. The results of the geometric mean with respect to the guideline for the 2006-2017 period are shown in Figures 7 and 8.
Table 5 Summary of E. coli results for Rudsdale Creek from 2006-2017
E. coli 2012-2017
Site
Geometric Mean (CFU/100ml)
Below Guideline
No. Samples
RUD-01
56
68%
71
Monitoring Site RUD-01
E. coli counts at site RUD-01 show that there has been no significant trend in bacterial counts (Figure 8). The count at the geometric mean was 56 CFU/100ml (Table 5), and majority of results (68 percent) were below the E. coli guideline. Figure 7 shows that counts are generally highest in late summer (August); this can likely be attributed to warm weather and reduced flow conditions.
Figure 7 Geometric mean of monthly E. coli counts in Rudsdale Creek, 2006-2017
Figure 8 Distribution of E. coli counts in Rudsdale Creek, 2006-2017
Summary of Rudsdale Creek Bacterial Contamination
Bacterial contamination does not appear to be a significant concern in Rudsdale Creek. As indicated by Figure 8 occasional exceedances above the guideline of 100 CFU/100ml have been observed. Best management practices such as enhancing shoreline buffers, limiting livestock access and minimizing runoff in both rural and developed areas can help to protect Rudsdale Creek into the future.
2.1.3 Rudsdale Creek: Metals
Of the metals routinely monitored in Rudsdale Creek, iron (Fe) occasionally reported concentrations above its respective Provincial Water Quality Objective of 0.300 mg/l. In elevated concentrations, this metal can have toxic effects on sensitive aquatic species.
Table 6 summarizes Fe concentrations within the creek as well as show the proportion of samples that meet guidelines. Figures 9 and 10 show Fe concentrations with respect to the guidelines for the monitoring period, 2006-2017.
Table 6 Summary of iron results in Rudsdale Creek from 2006-2017 (Highlighted values indicate average concentrations exceed the guideline)
Iron 2006-2017
Site
Average (mg/l)
Below Guideline
No. Samples
RUD-01
0.503
43%
56
Monitoring Site RUD-01
The average Fe concentrations in site RUD-01 was 0.503 mg/l and exceeded the guideline (PWQO). Forty-three percent of samples were below the guideline and there was no significant change in Fe concentrations across the monitoring period (Table 6, Figure 10). Monthly concentrations were elevated through the summer months (Figure 9).
Figure 9 Average monthly iron concentrations in Rudsdale Creek, 2006-2017.
Figure 10 Distribution of iron concentrations in Rudsdale Creek, 2006-2017.
Summary of Rudsdale Creek Metals
In Rudsdale Creek there is evidence of increased metal concentration above respective guidelines, it is quite likely that they are naturally occurring from groundwater inputs. Even so, continued efforts should be made to protect against possible pollution sources and implement best management practices to reduce any inputs such as storm water runoff from hardened surfaces to improve overall stream health and lessen downstream impacts.
1 No Ontario guideline for TKN is presently available; however, waters not influenced by excessive organic inputs typically range from 0.100 to 0.500 mg/l, Environment Canada (1979) Water Quality Sourcebook, A Guide to Water Quality Parameters, Inland Waters Directorate, Water Quality Branch, Ottawa, Canada.
2 Trends in the data were assessed using the Mann-Kendall trend test and Sens slope statistic.
3 A type of mean or average, which indicates the central tendency or typical value of a set of numbers by using the product of their values (as opposed to the arithmetic mean which uses their sum). It is often used to summarize a variable that varies over several orders of magnitude, such as E. coli counts.
The Stream Characterization Program evaluated 3.3 km of Rudsdale Creek in 2016. A total of 33 stream survey assessments were completed in the middle of June and July.
During the summer and fall of 2016, the Rideau Valley watershed experienced periods of severe drought. Precipitation levels were measured at less than 40% of the long-term average, as the water supply was unable to meet local demand. The lack of rainfall affected the success and function of farm crops, municipal and private wells, lawns and gardens, navigation and ultimately the health of our lakes, rivers and streams.
Low water conditions were readily observed throughout the watershed, as many of the streams were highly fragmented or completely dry. Aquatic species such as amphibians, fish and macro invertebrates were affected, as suitable habitat may have been limited. Fragmentation of habitat was observed in certain sections along Rudsdale Creek during the drought conditions in 2016.
Rudsdale Creek at Christie Lake Road during the drought in the Fall of 2016
3.1 Rudsdale Creek Overbank Zone
3.1.1 Riparian Buffer Evaluation
The quality of the riparian area increases with the width, complexity and linear extent of its vegetation along a stream or creek. A complex riparian community consists of diverse plant species native to the site, with multiple age-classes providing vertical structural diversity along a watercourse.
Here is a list of watershed benefits from a healthy riparian buffer zone:
Reduces the amount of pollutants that reach the stream from surface runoff
Helps reduce and mitigates erosion
Provides a microclimate that is cooler during the summer months providing cooler water for aquatic organisms
Provides large wood structure from fallen trees and limbs that form instream cover, create pools, stabilize the streambed, and provide habitat for aquatic organisms
Provides organic material for stream biota that, among other functions, is the base of the food chain in lower order streams
Provides habitat for terrestrial insects that drop in the stream and become food for fish and travel corridors for other terrestrial animals
Dissipates energy during flood events
Often provides the only refuge areas for fish during out-of-bank flows (behind trees, stumps, and logs)
Figure 11 demonstrates the buffer conditions of the left and right banks separately. Rudsdale Creek had a buffer of greater than 30 meters along 93 percent of the left bank and 89 percent of the right bank.
Figure 11 Riparian Buffer Evaluation along Rudsdale Creek
3.1.2 Riparian Buffer Alterations
Alterations within the riparian buffer were assessed within three distinct shoreline zones (0-5m, 5-15m, 15-30m), and evaluated based on the dominant vegetative community and/or land cover type (Figure 12). The riparian buffer zone along Rudsdale Creek was found to be dominated by scrubland, forest and wetland conditions. There were two areas that had altered riparian zone conditions along the watercourse.
Figure 12 Riparian buffer alterations along Rudsdale Creek
3.1.3 Adjacent Land Use
The RVCA’s Stream Characterization Program identifies six different land uses along Rudsdale Creek (Figure 13). Surrounding land use is considered from the beginning to end of the survey section (100m) and up to 100m on each side of the river. Land use outside of this area is not considered for the surveys but is nonetheless part of the subwatershed and will influence the creek. Scrubland habitat was dominant at 88 percent; wetland habitat was observed in the adjacent lands along Rudsdale Creek at 58 percent of the surveyed sections, 45 percent forest and 15 percent meadow habitat. The remaining land use consisted of industrial/commercial and infrastructure in the form of reduced shoreline buffer areas and road crossings.
Figure 13 Land Use along Rudsdale Creek
3.2 Rudsdale Creek Shoreline Zone
3.2.1 Instream Erosion
Stream erosion is the process by which water erodes and transports sediments, resulting in dynamic flows and diverse habitat conditions. Excessive erosion can result in drastic environmental changes, as habitat conditions, water quality and aquatic life are all negatively affected. Bank stability was assessed as the overall extent of each section with “unstable” shoreline conditions. These conditions are defined by the presence of significant exposed soils/roots, minimal bank vegetation, severe undercutting, slumping or scour and potential failed erosion measures. The majority of Rudsdale Creek had no erosion observed along the surveyed sections with two reaches having low to moderate levels of erosion in the middle to lower reach (Figure 14).
Figure 14 Erosion levels along Rudsdale Creek
3.2.2 Undercut Stream Banks
Stream bank undercuts can provide excellent cover habitat for aquatic life, however excessive levels can be an indication of unstable shoreline conditions. Bank undercut was assessed as the overall extent of each surveyed section with overhanging bank cover present. Figure 15 shows that Rudsdale Creek had no observed undercut banks along the majority of the system, however there were several sections in the middle to lower reaches with low levels of undercut banks.
Figure 15 Undercut stream banks along Rudsdale Creek
3.2.3 Stream Shading
Grasses, shrubs and trees all contribute towards shading a stream. Shade is important in moderating stream temperature, contributing to food supply and helping with nutrient reduction within a stream. Stream cover is assessed as the total coverage area in each section that is shaded by overhanging trees/grasses and tree canopy, at greater than 1m above the water surface. Figure 16 shows low levels of stream shading along the majority of Rudsdale Creek in the upper reaches, which is consistent with wide open water wetland habitat conditions. There were several sections in the lower reaches, where the channel narrows, that had high to moderate levels of stream shading along the creek.
Figure 16 Stream shading along Rudsdale Creek
3.2.4 Instream Wood Structure
Forested shorelines provide essential complex habitat through the perpetual process of shoreline trees falling into the water. This continuous recruitment of trees creates a wood-based physical structure in the littoral zone that is common on natural systems. Insects, fish, amphibians, birds, and other animals have also evolved with this abundance of near shore wood and it is essential to their life cycles. With increased development along many waterways, forested lakeshores have been altered and wood-based physical structure in many waterways has been reduced. It is important to restore this essential habitat to aquatic ecosystems.
Shoreline Protection
Protects shorelines by providing a barrier from wind and wave erosion
Reduces sedimentation of the water caused by shoreline slumping due to bank erosion
Allows detritus to collect and settle on the lake or creek bed providing the substrate structure required for native aquatic vegetation to establish and outcompete invasive species
Food Source
Wood complexes are an important food source for invertebrates
Small fish feed on the abundance of invertebrates that are found around these structures
Larger fish, waterfowl and shorebirds all benefit from the abundance of invertebrates and small fish feeding around woody structures in the littoral zone
Cover
Cover from predators is essential for many fish and animals to successfully complete their life cycle
The nooks and crannies of wood complexes offer critters safety from predators while at the same time concentrating prey to make predators more efficient
Wood provides the structure on which many species must lay or attach their eggs, therefore these complexes provide quality spawning and nesting habitat
Diversity
Wood complexes in the littoral zone provide unique edge habitat along the shoreline
Edge habitats contain more species diversity and higher concentrations of species than the adjoining habitats themselves will have
Figure 17 shows that the majority of Rudsdale Creek had low levels along the majority of the system with one location in the upper reaches having high levels of instream wood structure in the form of branches and trees along the system.
Figure 17 Instream wood structure along Rudsdale Creek
3.2.5 Overhanging Wood Structure
Trees and branches that are less than one meter from the surface of the water are defined as overhanging. Wood structure provides a food source, nutrients and shade which helps to moderate instream water temperatures. Figure 18 shows the system is highly variable with no overhanging branches and trees where the system is wide and is dominated by wetland habitat to an area in the lower reach that has high levels of overhanging wood structure along Rudsdale Creek.
Figure 18 Overhanging wood structure along Rudsdale Creek
3.2.6 Anthropogenic Alterations
Stream alterations are classified based on specific functional criteria associated with the flow conditions, the riparian buffer and potential human influences. Figure 19 shows nine percent of Rudsdale Creek remains “unaltered” with no anthropogenic alterations. Seventy three percent of Rudsdale Creek was classified as natural with minor anthropogenic changes while eighteen percent was considered altered. The alterations along Rudsdale Creek were in the form of buffer/shoreline modifications and road crossings. There were no sections that were classified as being highly altered.
Figure 19 Anthropogenic alterations along Rudsdale Creek
3.3 Rudsdale Creek Instream Aquatic Habitat
3.3.1 Benthic Invertebrates
Freshwater benthic invertebrates are animals without backbones that live on the stream bottom and include crustaceans such as crayfish, molluscs and immature forms of aquatic insects. Benthos represent an extremely diverse group of aquatic animals and exhibit wide ranges of responses to stressors such as organic pollutants, sediments and toxicants, which allows scientists to use them as bioindicators. As part of the Ontario Benthic Biomonitoring Network (OBBN), the RVCA has been collecting benthic invertebrates at the County Road 6 site since 2003. Monitoring data is analyzed for each sample site and the results are presented using the Family Biotic Index, Family Richness and percent Ephemeroptera, Plecoptera and Trichoptera.
Hilsenhoff Family Biotic Index
The Hilsenhoff Family Biotic Index (FBI) is an indicator of organic and nutrient pollution and provides an estimate of water quality conditions for each site using established pollution tolerance values for benthic invertebrates. FBI results for the Rudsdale Creek catchment at the County Road 6 sample location is summarized by year. “Fair” to “Poor” water quality conditions were observed at the Rudsdale Creek sample location (Figure 20) using a grading scheme developed by Conservation Authorities in Ontario for benthic invertebrates.
Figure 20 Hilsenhoff Family Biotic Index at the County Road 6 sample location
Family Richness
Family Richness measures the health of the community through its diversity and increases with increasing habitat diversity suitability and healthy water quality conditions. Family Richness is equivalent to the total number of benthic invertebrate families found within a sample. The County Road 6 location is reported to have “Fair” family richness (Figure 21).
Figure 21 Family Richness on Rudsdale Creek at the County Road 6 sample location
EPT
Ephemeroptera (Mayflies), Plecoptera (Stoneflies), and Trichoptera (Caddisflies) are species considered to be very sensitive to poor water quality conditions. High abundance of these organisms is generally an indication of good water quality conditions at a sample location. The community structure is typically dominated by species that are tolerant to poorer water quality conditions at the Rudsdale Creek sample location. As a result, the EPT indicates that the Rudsdale Creek sample location is reported to have “Poor” water quality (Figure 22) during the reporting periods.
Figure 22 EPT on Rudsdale Creek at the County Road 6 sample location
Conclusion
Overall the Rudsdale Creek sample location at County Road 6 aquatic habitat conditions from a benthic invertebrate perspective are considered “Poor” as the samples are dominated with species that are tolerant to high organic pollution levels.
3.3.2 Habitat Complexity
Habitat complexity is a measure of the overall diversity of habitat types and features within a stream. Streams with high habitat complexity support a greater variety of species niches, and therefore contribute to greater diversity. Factors such as substrate, flow conditions (pools, riffles) and cover material (vegetation, wood structure, etc.) all provide crucial habitat to aquatic life. Habitat complexity is assessed based on the presence of boulder, cobble and gravel substrates, as well as the presence of instream woody material.
Low to high habitat complexity was identified for Rudsdale Creek (Figure 23). Regions with increased habitat complexity were observed in the lower reaches of the system within the catchment.
Figure 23 Habitat complexity along Rudsdale Creek
3.3.3 Instream Substrate
Diverse substrate is important for fish and benthic invertebrate habitat because some species have specific substrate requirements and for example will only reproduce on certain types of substrate. The absence of diverse substrate types may limit the overall diversity of species within a stream. Figure 24 shows the overall presence of various substrate types observed along Rudsdale Creek. Substrate conditions were highly diverse along Rudsdale Creek with all substrate types being recorded at various locations along the creek. Figure 25 shows the dominant substrate type observed for each section surveyed along Rudsdale Creek.
Figure 24 Instream substrate along Rudsdale Creek
Figure 25 shows the dominant substrate type along Rudsdale Creek
3.3.4 Instream Morphology
Pools and riffles are important habitat features for aquatic life. Riffles are fast flowing areas characterized by agitation and overturn of the water surface. Riffles thereby play a crucial role in contributing to dissolved oxygen conditions and directly support spawning for some fish species. They are also areas that support high benthic invertebrate populations which are an important food source for many aquatic species. Pools are characterized by minimal flows, with relatively deep water and winter/summer refuge habitat for aquatic species. Runs are moderately shallow, with unagitated surfaces of water and areas where the thalweg (deepest part of the channel) is in the center of the channel. Figure 26 shows that Rudsdale Creek is highly variable; 100 percent of sections recorded runs, 58 percent pools and 21 percent riffles. Figure 27 shows where the riffle habitat areas were observed along Rudsdale Creek.
Figure 26 Instream morphology along Rudsdale Creek
Figure 27 Instream riffle habitat along Rudsdale Creek
3.3.5 Vegetation Type
Instream vegetation provides a variety of functions and is a critical component of the aquatic ecosystem. Aquatic plants promote stream health by:
Providing direct riparian/instream habitat
Stabilizing flows reducing shoreline erosion
Contributing to dissolved oxygen through photosynthesis
Maintaining temperature conditions through shading
For example emergent plants along the shoreline can provide shoreline protection from wave action and important rearing habitat for species of waterfowl. Submerged plants provide habitat for fish to find shelter from predator fish while they feed. Floating plants such as water lilies shade the water and can keep temperatures cool while reducing algae growth. Submerged and floating plants plants were present in 94 percent of the survey sections, 70 percent of sections contained algae, narrow leaved emergents were observed in 67 percent of sections, 61 percent free floating plants, 15 percent broad leaved emergents and robust emergents were observed in 12 percent of sections surveyed. Figure 28 depicts the plant community structure for Rudsdale Creek. Figure 29 shows the dominant vegetation type observed for each section surveyed along Rudsdale Creek.
Figure 28 Vegetation type along Rudsdale Creek
Figure 29 Dominant vegetation type along Rudsdale Creek
3.3.6 Instream Vegetation Abundance
Instream vegetation is an important factor for a healthy stream ecosystem. Vegetation helps to remove contaminants from the water, contributes oxygen to the stream, and provides habitat for fish and wildlife. Too much vegetation can also be detrimental. Figure 30 demonstrates that Rudsdale Creek reach had normal to common levels of vegetation recorded at 24 and 70 percent of stream surveys. Extensive levels of vegetation were observed in 82 percent of the surveyed sections and were consistent with areas dominated by the invasive aquatic plant known as European frogbit; while six percent of sections had no vegetation.
Figure 30 Instream vegetation abundance along Rudsdale Creek
3.3.7 Invasive Species
Invasive species can have major implications on streams and species diversity. Invasive species are one of the largest threats to ecosystems throughout Ontario and can out compete native species, having negative effects on local wildlife, fish and plant populations. One hundred percent of the sections surveyed along Rudsdale Creek reach had invasive species. The invasive species observed in Rudsdale Creek were European frogbit, Himalayan balsam, purple loosestrife and Manitoba maple. Invasive species abundance (i.e. the number of observed invasive species per section) was assessed to determine the potential range/vector of many of these species (Figure 31).
Figure 31 Invasive species abundance along Rudsdale Creek
A section of Rudsdale Creek with the invasive European Frogbit
3.3.8 Water Chemistry
During the stream characterization survey, a YSI probe is used to collect water chemistry information. Dissolved oxygen (DO), specific conductivity (SPC) and pH are measured at the start and end of each section.
3.3.8.1 Dissolved Oxygen
Dissolved oxygen is a measure of the amount of oxygen dissolved in water. The Canadian Environmental Quality Guidelines of the Canadian Council of Ministers of the Environment (CCME) suggest that for the protection of aquatic life the lowest acceptable dissolved oxygen concentration should be 6 mg/L for warmwater biota and 9.5 mg/L for coldwater biota (CCME, 1999). Figure 32 shows that the dissolved oxygen in Rudsdale Creek supports warmwater and in certain locations coldwater biota along the system. The average dissolved oxygen level observed within Rudsdale Creek was 4.4mg/L which is below the recommended level for warmwater biota. The upper reaches of Rudsdale Creek were within the threshold to support warmwater biota.
Figure 32 Dissolved oxygen ranges along Rudsdale Creek
3.3.8.2 Conductivity
Conductivity in streams is primarily influenced by the geology of the surrounding environment, but can vary drastically as a function of surface water runoff. Currently there are no CCME guideline standards for stream conductivity; however readings which are outside the normal range observed within the system are often an indication of unmitigated discharge and/or stormwater input. The average conductivity observed within the main stem of Rudsdale Creek was 462.3 µs/cm. Figure 33 shows the conductivity readings for Rudsdale Creek.
Figure 33 Specific conductivity ranges in Rudsdale Creek
3.3.8.3 pH
Based on the PWQO for pH, a range of 6.5 to 8.5 should be maintained for the protection of aquatic life. Average pH values along Rudsdale Creek averaged 7.37 thereby meeting the provincial standard (Figure 34).
Figure 34 pH ranges along Rudsdale Creek
3.3.8.4 Oxygen Saturation (%)
Oxygen saturation is measured as the ratio of dissolved oxygen relative to the maximum amount of oxygen that will dissolve based on the temperature and atmospheric pressure. Well oxygenated water will stabilize at or above 100% saturation, however the presence of decaying matter/pollutants can drastically reduce these levels. Oxygen input through photosynthesis has the potential to increase saturation above 100% to a maximum of 500%, depending on the productivity level of the environment. In order to represent the relationship between concentration and saturation, the measured values have been summarized into 6 classes:
Dissolved oxygen conditions on Rudsdale Creek varied along the system for both warm and coolwater species (upper reach) (Figure 35). Sections in the lower reaches fell below the guideline to support warmwater biota.
Figure 35 A bivariate assessment of dissolved oxygen concentration (mg/L) and saturation (%) in Rudsdale Creek
3.3.8.5 Specific Conductivity Assessment
Specific conductivity (SPC) is a standardized measure of electrical conductance, collected at or corrected to a water temperature of 25⁰C. SPC is directly related to the concentration of ions in water, and is commonly influenced by the presence of dissolved salts, alkalis, chlorides, sulfides and carbonate compounds. The higher the concentration of these compounds, the higher the conductivity. Common sources of elevated conductivity include storm water, agricultural inputs and commercial/industrial effluents.
In order to summarize the conditions observed, SPC levels were evaluated as either normal, moderately elevated or highly elevated. These categories correspond directly to the degree of variation (i.e. standard deviation) at each site relative to the average across the system.
Normal levels were maintained in the upper reaches of Rudsdale Creek, however there were moderately elevated areas in the middle and lower reaches (Figure 36).
Figure 36 Relative specific conductivity levels along Rudsdale Creek
3.3.9 Thermal Regime
Many factors can influence fluctuations in stream temperature, including springs, tributaries, precipitation runoff, discharge pipes and stream shading from riparian vegetation. Water temperature is used along with the maximum air temperature (using the Stoneman and Jones method) to classify a watercourse as either warm water, cool water or cold water. Figure 37 shows where the thermal sampling sites were located on Rudsdale Creek. Analysis of the data collected indicates that Rudsdale Creek is classified as a cool water system with warm water lower reaches (Figure 38).
Figure 37 Temperature logger locations along Rudsdale Creek
Figure 38 Temperature logger data for the sites on Rudsdale Creek
Each point on the graph represents a temperature that meets the following criteria:
Sampling dates between July 1st and September 7th
Sampling date is preceded by two consecutive days above 24.5 °C, with no rain
Water temperatures are collected at 4pm
Air temperature is recorded as the max temperature for that day
3.3.10 Groundwater
Groundwater discharge areas can influence stream temperature, contribute nutrients, and provide important stream habitat for fish and other biota. During stream surveys, indicators of groundwater discharge are noted when observed. Indicators include: springs/seeps, watercress, iron staining, significant temperature change and rainbow mineral film. Figure 39 shows areas where one or more of the above groundwater indicators were observed during stream surveys and headwater assessments.
Figure 39 Groundwater indicators observed in the Rudsdale Creek catchment
3.3.11 Fish Community
The Rudsdale Creek catchment is classified as a mixed community of warm and cool water recreational and baitfish fishery with 23 species observed in 2016. Figure 40 shows the historical and 2016 fish sampling locations in the catchment.
Figure 40 Fish Community sampling observations for 2016
Table 7 lists the species observed in the watershed historically and during the 2016 sampling effort.
Table 7 Fish species observed in Rudsdale Creek
Fish Species
Scientific Name
Fish code
Historical
2016
banded killifish
Fundulus diaphanus
BaKil
X
X
blackchin shiner
Notropis heterodon
BcShi
X
X
blacknose dace
Rhinichthys atratulus
BnDac
X
X
blacknose shiner
Notropis heterolepis
BnShi
X
X
bluntnose minnow
Pimephales notatus
BnMin
X
brassy minnow
Hybognathus hankinsoni
BrMin
X
X
brook stickleback
Culaea inconstans
BrSti
X
X
brown bullhead
Ameiurus nebulosus
BrBul
X
X
carps and minnows
Cyprinidae
CA_MI
X
X
central mudminnow
Umbra limi
CeMud
X
X
central stoneroller
Campostoma anomalum
CeSto
X
X
common shiner
Luxilus cornutus
CoShi
X
X
sculpin family
Cottus sp.
CotSp
X
creek chub
Semotilus atromaculatus
CrChu
X
X
etheostoma sp.
etheostoma sp.
EthSp
X
fathead minnow
Pimephales promelas
FhMin
X
X
golden shiner
Notemigonus crysoleucas
GoShi
X
X
hornyhead chub
Nocomis biguttatus
HhChu
X
X
iowa darter
Etheostoma exile
IoDar
X
longnose dace
Rhinichthys cataractae
LnDac
X
northern pearl dace
Margariscus nachtriebi
PeDac
X
northern redbelly dace
Chrosomus eos
NRDac
X
X
pumpkinseed
Lepomis gibbosus
Pumpk
X
X
rock bass
Ambloplites rupestris
RoBas
X
smallmouth bass
Micropterus dolomieu
SmBas
X
white sucker
Catostomus commersonii
WhSuc
X
X
TOTAL Species
21
23
RVCA electrosfishing site on Rudsdale Creek
Iowa darter captured during the electrofishing sampling effort
3.3.12 Migratory Obstructions
It is important to know locations of migratory obstructions because these can prevent fish from accessing important spawning and rearing habitat. Migratory obstructions can be natural or manmade, and they can be permanent or seasonal. Figure 41 shows that Rudsdale Creek had no migration barriers at the time of the survey in 2016. However, there were two perched culverts and one debris dam on headwater drainage features within the catchment.
Figure 41 Migratory obstructions in the Rudsdale Creek catchment
3.3.13 Beaver Dam Locations
Overall beaver dams create natural changes in the environment. Some of the benefits include providing habitat for wildlife, flood control, and silt retention. Additional benefits come from bacterial decomposition of woody material used in the dams which removes excess nutrient and toxins. Beaver dams can also result in flooding of agricultural lands and may be potential barriers to fish migration. Six beaver dams were identified along Rudsdale Creek in 2016 (Figure 42).
Figure 42 Beaver Dam type and locations along Rudsdale Creek
Beaver Dam on Rudsdale Creek at the time of the survey in 2016
3.4 Headwater Drainage Feature Assessment
3.4.1 Headwaters Sampling Locations
The RVCA Stream Characterization program assessed Headwater Drainage Features for the Rudsdale Creek catchment in 2017. This protocol measures zero, first and second order headwater drainage features (HDF). It is a rapid assessment method characterizing the amount of water, sediment transport, and storage capacity within headwater drainage features (HDF). RVCA is working with other Conservation Authorities and the Ministry of Natural Resources and Forestry to implement the protocol with the goal of providing standard datasets to support science development and monitoring of headwater drainage features. An HDF is a depression in the land that conveys surface flow. Additionally, this module provides a means of characterizing the connectivity, form and unique features associated with each HDF (OSAP Protocol, 2013). In 2017 the program sampled 32 sites at road crossings in the Rudsdale Creek catchment area (Figure 43).
Figure 43 Location of the headwater sampling sites in the Rudsdale Creek catchment
3.4.2 Headwater Feature Type
The headwater sampling protocol assesses the feature type in order to understand the function of each feature. The evaluation includes the following classifications: defined natural channel, channelized or constrained, multi-thread, no defined feature, tiled, wetland, swale, roadside ditch and pond outlet. By assessing the values associated with the headwater drainage features in the catchment area we can understand the ecosystem services that they provide to the watershed in the form of hydrology, sediment transport, and aquatic and terrestrial functions. The headwater drainage features in the Rudsdale Creek catchment are highly variable they include natural, wetland, channelized, road side ditches and a multi thread feature. Figure 44 shows the feature type of the primary feature at the sampling locations.
Figure 44 Headwater feature types in the Rudsdale Creek catchment
3.4.3 Headwater Feature Flow
The observed flow condition within headwater drainage features can be highly variable depending on timing relative to the spring freshet, recent rainfall, soil moisture, etc. Flow conditions are assessed in the spring and in the summer to determine if features are perennial and flow year round, if they are intermittent and dry up during the summer months or if they are ephemeral systems that do not flow regularly and generally respond to specific rainstorm events or snowmelt. Flow conditions in headwater systems can change from year to year depending on local precipitation patterns. Figure 45 shows the observed flow condition at the sampling locations in the Rudsdale Creek catchment in 2017.
Figure 45 Headwater feature flow conditions in the Rudsdale Creek catchment
A spring photo of the headwater sample site in the Rudsdale Creek catchment located on Gambles Side Road
A summer photo of the headwater sample site in the Rudsdale Creek catchment located on Gambles Side Road
3.4.4 Feature Channel Modifications
Channel modifications were assessed at each headwater drainage feature sampling location. Modifications include channelization, dredging, hardening and realignments. The Rudsdale Creek catchment area had a majority of features with no channel modifications observed, five sites as having been historically dredged/channelized and one location had mixed modifications. Figure 46 shows the channel modifications observed at the sampling locations for Rudsdale Creek.
Figure 46 Headwater feature channel modifications in the Rudsdale Creek catchment
3.4.5 Headwater Feature Vegetation
Headwater feature vegetation evaluates the type of vegetation that is found within the drainage feature. The type of vegetated within the channel influences the aquatic and terrestrial ecosystem values that the feature provides. For some types of headwater features the vegetation within the feature plays a very important role in flow and sediment movement and provides wildlife habitat. The following classifications are evaluated no vegetation, lawn, wetland, meadow, scrubland and forest. Figure 47 depicts the dominant vegetation observed at the sampled headwater sites in the Rudsdale Creek catchment.
Figure 47 Headwater feature vegetation types in the Rudsdale Creek catchment
3.4.6 Headwater Feature Riparian Vegetation
Headwater riparian vegetation evaluates the type of vegetation that is found along the adjacent lands of a headwater drainage feature. The type of vegetation within the riparian corridor influences the aquatic and terrestrial ecosystem values that the feature provides to the watershed. Figure 48 depicts the type of riparian vegetation observed at the sampled headwater sites in the Rudsdale Creek catchment.
Figure 48 Headwater feature riparian vegetation types in the Rudsdale Creek catchment
3.4.7 Headwater Feature Sediment Deposition
Assessing the amount of recent sediment deposited in a channel provides an index of the degree to which the feature could be transporting sediment to downstream reaches (OSAP, 2013). Evidence of excessive sediment deposition might indicate the requirement to follow up with more detailed targeted assessments upstream of the site location to identify potential best management practices to be implemented. Sediment deposition ranged from none to substantial for the headwater sites sampled in the Rudsdale Creek catchment area. Figure 49 depicts the degree of sediment deposition observed at the sampled headwater sites in the Rudsdale Creek catchment. Sediment deposition conditions ranged from no sediment deposition to substantial.
Figure 49 Headwater feature sediment deposition in the Rudsdale Creek catchment
3.4.8 Headwater Feature Upstream Roughness
Feature roughness will provide a measure of the amount of materials within the bankfull channel that could slow down the velocity of water flowing within the headwater feature (OSAP, 2013). Materials on the channel bottom that provide roughness include vegetation, woody Structure and boulders/cobble substrates. Roughness can provide benefits in mitigating downstream erosion on the headwater drainage feature and the receiving watercourse by reducing velocities. Roughness also provides important habitat conditions for aquatic organisms. Figure 50 shows the feature roughness conditions at the sampling locations in the Rudsdale Creek catchment were highly variable ranging from minimal to extreme.
Figure 50 Headwater feature roughness in the Rudsdale Creek catchment
Land cover and any change in coverage that has occurred over a six year period is summarized for the Rudsdale Creek catchment using spatially continuous vector data representing the catchment during the spring of 2008 and 2014. This dataset was developed by the RVCA through heads-up digitization of 20cm DRAPE ortho-imagery at a 1:4000 scale and details the surrounding landscape using 10 land cover classes.
4.1 Rudsdale Creek Catchment Land Cover/Change
As shown in Table 8 and Figure 1, the dominant land cover type in 2014 is woodland followed by crop and pastureland.
Table 8 Land cover in the Rudsdale Creek catchment (2008 vs. 2014)
Land Cover
2008
2014
Change - 2008 to 2014
Area
Area
Area
Ha
Percent
Ha
Percent
Ha
Percent
Woodland*
2918
47
2915
47
-3
Crop and Pasture
1648
26
1644
26
-4
Wetland**
994
16
996
16
2
>Unevaluated
(994)
(16)
(996)
(16)
(2)
(0)
Settlement
242
4
247
4
5
Meadow-Thicket
176
3
173
3
-3
Transportation
170
3
170
3
Water
49
1
49
1
Aggregate
6
<1
8
<1
2
* Does not include treed swamps ** Includes treed swamps
From 2008 to 2014, there was an overall change of 13 hectares (from one land cover class to another). Most of the change in the Rudsdale Creek catchment is a result of crop and pastureland reverting to woodland and the conversion of crop and pastureland to settlement along with woodland being transformed into crop and pastureland, aggregate and settlement (Figure 51).
Figure 51 Land cover change in the Rudsdale Creek catchment (2014)
Table 9 provides a detailed breakdown of all land cover change that has taken place in the Rudsdale Creek catchment between 2008 and 2014.
Table 9 Land cover change in the Rudsdale Creek catchment (2008 to 2014)
Land Cover
Change - 2008 to 2014
Area
Ha.
Percent
Crop and Pasture to Settlement
3.7
28.2
Crop and Pasture to Woodland
2.3
17.3
Woodland to Crop and Pasture
2.2
16.6
Woodland to Aggregate
1.7
12.9
Woodland to Settlement
1.5
11.2
Meadow-Thicket to Settlement
0.6
4.8
Settlement to Woodland
0.6
4.3
Crop and Pasture to Water
0.5
3.6
Settlement to Water
0.1
1.0
4.2 Woodland Cover
In the Environment Canada Guideline (Third Edition) entitled “How Much Habitat Is Enough?” (hereafter referred to as the “Guideline”) the opening narrative under the Forest Habitat Guidelines section states that prior to European settlement, forest was the predominant habitat in the Mixedwood Plains ecozone. The remnants of this once vast forest now exist in a fragmented state in many areas (including the Rideau Valley watershed) with woodland patches of various sizes distributed across the settled landscape along with higher levels of forest cover associated with features such as the Frontenac Axis (within the on-Shield areas of the Rideau Lakes and Tay River subwatersheds). The forest legacy, in terms of the many types of wildlife species found, overall species richness, ecological functions provided and ecosystem complexity is still evident in the patches and regional forest matrices (found in the Tay River subwatershed and elsewhere in the Rideau Valley watershed). These ecological features are in addition to other influences which forests have on water quality and stream hydrology including reducing soil erosion, producing oxygen, storing carbon along with many other ecological services that are essential not only for wildlife but for human well-being.
The Guideline also notes that forests provide a great many habitat niches that are in turn occupied by a great diversity of plant and animal species. They provide food, water and shelter for these species - whether they are breeding and resident locally or using forest cover to help them move across the landscape. This diversity of species includes many that are considered to be species at risk. Furthermore, from a wildlife perspective, there is increasing evidence that the total forest cover in a given area is a major predictor of the persistence and size of bird populations, and it is possible or perhaps likely that this pattern extends to other flora and fauna groups. The overall effect of a decrease in forest cover on birds in fragmented landscapes is that certain species disappear and many of the remaining ones become rare, or fail to reproduce, while species adapted to more open and successional habitats, as well as those that are more tolerant to human-induced disturbances in general, are able to persist and in some cases thrive. Species with specialized-habitat requirements are most likely to be adversely affected. The overall pattern of distribution of forest cover, the shape, area and juxtaposition of remaining forest patches and the quality of forest cover also play major roles in determining how valuable forests will be to wildlife and people alike.
The current science generally supports minimum forest habitat requirements between 30 and 50 percent, with some limited evidence that the upper limit may be even higher, depending on the organism/species phenomenon under investigation or land-use/resource management planning regime being considered/used.
As shown in Figure 52, 48 percent of the Rudsdale Creek catchment contains 2915 hectares of upland forest and 40 hectares of lowland forest (treed swamps) versus the 47 percent of woodland cover in the Tay River subwatershed. This is greater than the 30 percent of forest cover that is identified as the minimum threshold required to sustain forest birds according to the Guideline and which may only support less than one half of potential species richness and marginally healthy aquatic systems. When forest cover drops below 30 percent, forest birds tend to disappear as breeders across the landscape.
Figure 52 Woodland cover and forest interior in the Rudsdale Creek catchment (2014)
4.2.1 Woodland (Patch) Size
According to the Ministry of Natural Resources’ Natural Heritage Reference Manual (Second Edition), larger woodlands are more likely to contain a greater diversity of plant and animal species and communities than smaller woodlands and have a greater relative importance for mobile animal species such as forest birds.
Bigger forests often provide a different type of habitat. Many forest birds breed far more successfully in larger forests than they do in smaller woodlots and some rely heavily on forest interior conditions. Populations are often healthier in regions with more forest cover and where forest fragments are grouped closely together or connected by corridors of natural habitat. Small forests support small numbers of wildlife. Some species are “area-sensitive” and tend not to inhabit small woodlands, regardless of forest interior conditions. Fragmented habitat also isolates local populations, especially small mammals, amphibians and reptiles with limited mobility. This reduces the healthy mixing of genetic traits that helps populations survive over the long run (Conserving the Forest Interior. Ontario Extension Notes, 2000).
The Environment Canada Guideline also notes that for forest plants that do not disperse broadly or quickly, preservation of some relatively undisturbed large forest patches is needed to sustain them because of their restricted dispersal abilities and specialized habitat requirements and to ensure continued seed or propagation sources for restored or regenerating areas nearby.
The Natural Heritage Reference Manual continues by stating that a larger size also allows woodlands to support more resilient nutrient cycles and food webs and to be big enough to permit different and important successional stages to co-exist. Small, isolated woodlands are more susceptible to the effects of blowdown, drought, disease, insect infestations, and invasions by predators and non-indigenous plants. It is also known that the viability of woodland wildlife depends not only on the characteristics of the woodland in which they reside, but also on the characteristics of the surrounding landscape where the woodland is situated. Additionally, the percentage of forest cover in the surrounding landscape, the presence of ecological barriers such as roads, the ability of various species to cross the matrix surrounding the woodland and the proximity of adjacent habitats interact with woodland size in influencing the species assemblage within a woodland.
In the Rudsdale Creek catchment (in 2014), one hundred and fifty-five (59 percent) of the 265 woodland patches are very small, being less than one hectare in size. Another 86 (32 percent) of the woodland patches ranging from one to less than 20 hectares in size tend to be dominated by edge-tolerant bird species. The remaining 24 (nine percent of) woodland patches range between 22 and 521 hectares in size. Fourteen of these patches contain woodland between 20 and 100 hectares and may support a few area-sensitive species and some edge intolerant species, but will be dominated by edge tolerant species.
Conversely, ten (four percent) of the 265 woodland patches in the drainage area exceed the 100 plus hectare size needed to support most forest dependent, area sensitive birds and are large enough to support approximately 60 percent of edge-intolerant species. Three patches top 200 hectares, which according to the Environment Canada Guideline will support 80 percent of edge-intolerant forest bird species (including most area sensitive species) that prefer interior forest habitat conditions.
Table 10 presents a comparison of woodland patch size in 2008 and 2014 along with any changes that have occurred over that time. A decrease (of four hectares) has been observed in the overall woodland patch area between the two reporting periods.
Table 10 Woodland patches in the Rudsdale Creek catchment (2008 and 2014)
Woodland Patch Size Range (ha)
Woodland* Patches
Patch Change
2008
2014
2008 to 2014
Number
Area
Number
Area
Number
Area
Count
%
Ha
%
Count
%
Ha
%
Count
Ha
Less than 1
149
57
53
2
155
59
55
2
6
2
1 to 20
87
34
385
13
86
32
383
13
-1
-2
20 to 50
7
3
226
8
8
3
225
8
1
-1
50 to 100
6
2
395
13
6
2
394
13
-1
100 to 200
7
3
887
30
7
3
886
30
-1
Greater than 200
3
1
1012
34
3
1
1011
34
-1
Totals
259
100
2958
100
265
100
2954
100
6
-4
*Includes treed swamps
4.2.2 Woodland (Forest) Interior Habitat
The forest interior is habitat deep within woodlands. It is a sheltered, secluded environment away from the influence of forest edges and open habitats. Some people call it the “core” or the “heart” of a woodland. The presence of forest interior is a good sign of woodland health, and is directly related to the woodland’s size and shape. Large woodlands with round or square outlines have the greatest amount of forest interior. Small, narrow woodlands may have no forest interior conditions at all. Forest interior habitat is a remnant natural environment, reminiscent of the extensive, continuous forests of the past. This increasingly rare forest habitat is now a refuge for certain forest-dependent wildlife; they simply must have it to survive and thrive in a fragmented forest landscape (Conserving the Forest Interior. Ontario Extension Notes, 2000).
The Natural Heritage Reference Manual states that woodland interior habitat is usually defined as habitat more than 100 metres from the edge of the woodland and provides for relative seclusion from outside influences along with a moister, more sheltered and productive forest habitat for certain area sensitive species. Woodlands with interior habitat have centres that are more clearly buffered against the edge effects of agricultural activities or more harmful urban activities than those without.
In the Rudsdale Creek catchment (in 2014), the 265 woodland patches contain 31 forest interior patches (Figure 52) that occupy seven percent (411 ha.) of the catchment land area (which is greater than the five percent of interior forest in the Tay River subwatershed). This is below the ten percent figure referred to in the Environment Canada Guideline that is considered to be the minimum threshold for supporting edge intolerant bird species and other forest dwelling species in the landscape.
Most patches (18) have less than 10 hectares of interior forest, ten of which have small areas of interior forest habitat less than one hectare in size. The remaining 13 patches contain interior forest between 10 and 106 hectares in area. Between 2008 and 2014, the catchment has seen an overall loss of one hectare of interior forest (Table 11).
Table 11 Woodland interior in the Rudsdale Creek catchment (2008 and 2014)
Woodland Interior Habitat Size Range (ha)
Woodland Interior
Interior Change
2008
2014
2008 to 2014
Number
Area
Number
Area
Number
Area
Count
Percent
Ha
Percent
Count
Percent
Ha
Percent
Count
Ha
Less than 1
10
32
1
<1
10
32
1
<1
1 to 10
8
26
27
7
8
26
27
7
10 to 30
9
29
154
38
9
29
153
37
-1
30 to 50
2
7
63
15
2
7
63
15
50 to 100
1
3
60
14
1
3
60
15
Greater than 100
1
3
106
26
1
3
106
26
Totals
31
100
411
100
31
100
410
100
-1
4.3 Wetland Cover
Wetlands are habitats forming the interface between aquatic and terrestrial systems. They are among the most productive and biologically diverse habitats on the planet. By the 1980s, according to the Natural Heritage Reference Manual, 68 percent of the original wetlands south of the Precambrian Shield in Ontario had been lost through encroachment, land clearance, drainage and filling.
Wetlands perform a number of important ecological and hydrological functions and provide an array of social and economic benefits that society values. Maintaining wetland cover in a watershed provides many ecological, economic, hydrological and social benefits that are listed in the Reference Manual and which may include:
contributing to the stabilization of shorelines and to the reduction of erosion damage through the mitigation of water flow and soil binding by plant roots
mitigating surface water flow by storing water during periods of peak flow (such as spring snowmelt and heavy rainfall events) and releasing water during periods of low flow (this mitigation of water flow also contributes to a reduction of flood damage)
contributing to an improved water quality through the trapping of sediments, the removal and/or retention of excess nutrients, the immobilization and/or degradation of contaminants and the removal of bacteria
providing renewable harvesting of timber, fuel wood, fish, wildlife and wild rice
contributing to a stable, long-term water supply in areas of groundwater recharge and discharge
providing a high diversity of habitats that support a wide variety of plants and animals
acting as “carbon sinks” making a significant contribution to carbon storage
providing opportunities for recreation, education, research and tourism
Historically, the overall wetland coverage within the Great Lakes basin exceeded 10 percent, but there was significant variability among watersheds and jurisdictions, as stated in the Environment Canada Guideline. In the Rideau Valley Watershed, it has been estimated that pre-settlement wetland cover averaged 35 percent using information provided by Ducks Unlimited Canada (2010) versus the 21 percent of wetland cover existing in 2014 derived from DRAPE imagery analysis.
Figure 53 Wetland cover in the Rudsdale Creek catchment (Historic to 2014)
This decline in wetland cover is also evident in the Rudsdale Creek catchment (as seen in Figure 53 above and summarized in Table 12 below), where wetland was reported to cover 33 percent of the area prior to settlement, as compared to 16 percent in 2014. This represents a 51 percent loss of historic wetland cover. To maintain critical hydrological, ecological functions along with related recreational and economic benefits provided by these wetland habitats in the catchment, a “no net loss” of currently existing wetlands should be employed to ensure the continued provision of tangible benefits accruing from them to landowners and surrounding communities.
Table 12 Wetland cover in the Rudsdale Creek catchment (Historic to 2014)
Wetland Cover
Pre-settlement
2008
2014
Change - Historic to 2014
Area
Area
Area
Area
Ha
Percent
Ha
Percent
Ha
Percent
Ha
Percent
Rudsdale Creek
2042
33
994
16
996
16
-1046
-51
Tay River
n/a
n/a
15280
19
15330
19
n/a
n/a
Rideau Valley
134115
35
n/a
n/a
82076
21
-52039
-39
4.4 Shoreline Cover
The riparian or shoreline zone is that special area where the land meets the water. Well-vegetated shorelines are critically important in protecting water quality and creating healthy aquatic habitats, lakes and rivers. Natural shorelines intercept sediments and contaminants that could impact water quality conditions and harm fish habitat in streams. Well established buffers protect the banks against erosion, improve habitat for fish by shading and cooling the water and provide protection for birds and other wildlife that feed and rear young near water. A recommended target (from the Environment Canada Guideline) is to maintain a minimum 30 metre wide vegetated buffer along at least 75 percent of the length of both sides of rivers, creeks and streams.
Figure 54 shows the extent of the ‘Natural’ vegetated riparian zone (predominantly wetland/woodland features) and ‘Other’ anthropogenic cover (crop/pastureland, roads/railways, settlements) along a 30-metre-wide area of land, both sides of the shoreline of Rudsdale Creek and its tributaries in the Rudsdale Creek catchment.
Figure 54 Natural and other riparian land cover in the Rudsdale Creek catchment (2014)
This analysis shows that the riparian zone in the Rudsdale Creek catchment is composed of wetland (39 percent), woodland (37 percent), crop and pastureland (18 percent), roads (two percent), meadow-thicket (two percent) and settlement (two percent). Along the many watercourses (including headwater streams) flowing into Rudsdale Creek, the riparian buffer is composed of woodland (40 percent), wetland (35 percent), crop and pastureland (20 percent), roads (two percent), settlement areas (two percent) and meadow-thicket (one percent). Along Rudsdale Creek itself, the riparian zone is composed of wetland (59 percent), woodland (18 percent), crop and pastureland (13 percent), meadow-thicket (five percent), transportation routes (three percent) and settlement (two percent),.
Additional statistics for the Rudsdale Creek catchment are presented in Tables 13, 14 and 15 and show that there has been very little to no change in shoreline cover from 2008 to 2014.
Table 13 Riparian land cover in the Rudsdale Creek catchment (2008 vs. 2014)
Riparian Land Cover
2008
2014
Change - 2008 to 2014
Area
Area
Area
Ha.
Percent
Ha.
Percent
Ha.
Percent
Wetland
315.58
39.03
315.68
39.04
0.10
0.01
> Unevaluated
(315.58)
(39.03)
(315.68)
(39.04)
(0.10)
(0.01)
Woodland
299.97
37.10
299.89
37.09
-0.08
-0.01
Crop & Pasture
142.35
17.60
141.65
17.52
-0.70
-0.08
Transportation
18.50
2.29
18.50
2.29
0.00
0.00
Meadow-Thicket
16.31
2.02
16.31
2.02
0.00
0.00
Settlement
15.68
1.94
16.37
2.02
0.69
0.08
Aggregates
0.24
0.03
0.24
0.03
0.00
0.00
Table 14 Riparian land cover along Rudsdale Creek (2008 vs. 2014)
Riparian Land Cover
2008
2014
Change - 2008 to 2014
Area
Area
Area
Ha.
Percent
Ha.
Percent
Ha.
Percent
Wetland
113.3
59.58
113.29
59.58
0.00
0.00
> Unevaluated
113.29
59.58
113.29
59.58
0.00
0.00
Woodland
34.03
17.89
34.03
17.89
0.00
0.00
Crop & Pasture
24.9
13.1
24.9
13.1
0.00
0.00
Meadow-Thicket
9.19
4.84
9.19
4.84
0.00
0.00
Transportation
5.33
2.8
5.33
2.8
0.00
0.00
Settlement
3.41
1.79
3.41
1.79
0.00
0.00
Table 15 Riparian land cover along streams in the Rudsdale Creek catchment (2008 vs. 2014)
5.0 Rudsdale Creek Catchment: Stewardship and Water Resources Protection
The RVCA and its partners are working to protect and enhance environmental conditions in the Tay River Watershed. Figure 55 shows the location of all stewardship projects completed in the Rudsdale Creek catchment.
Figure 55 Stewardship site locations in the Rudsdale Creek catchment
5.1 Rural Clean Water
The Rural Clean Water Program provides technical and financial assistance to farmers and other rural landowners, to aid in the implementation of projects that protect water quality. Funding is granted to those projects that support best management practices for application in the protection and improvement of surface and ground water resources. The program also supports climate change adaptation and low impact development projects as well as educating rural landowners about environmental stewardship of private property. Examples of supported projects include livestock exclusion fencing, controlled tile drainage, cover crops, erosion control, well related projects, and many more. For a list of eligible projects and to apply for funding, see Rural Clean Water.
In the Rudsdale Creek catchment from 2011 to 2016, six well upgrades, two well decommissionings, two septic system repairs and one manure storage facility were completed; prior to this, two well decommissionings, one well replacement and one well upgrade had been completed. Total value of all 15 projects is $44,451 with $15,353 of that amount funded through grant dollars from the RVCA.
5.2 Private Land Forestry
Forest cover and tree planting continues to be one of the most widely supported strategies to improve our environment. The many benefits of forest cover include carbon sequestration, flood mitigation and water quality improvement as well as providing fish and wildlife habitat.
Through the RVCA's Trees for Tomorrow Program (and its predecessors), 77,300 trees were planted at three sites from 2011 to 2016; prior to this, 20,700 trees were planted at three sites. In total, 98,000 trees have been planted resulting in the reforestation of 49 hectares. Total value of all six projects in the Rudsdale Creek catchment is $267,963 with $220,278 of that amount coming from fundraising sources. For more information about the Program and landowner eligibility, please see the following: Tree Planting in the Rideau Valley Watershed and Trees for Tomorrow.
An additional 30 butternut trees were planted through the RVCA Butternut Recovery Program, as part of efforts to introduce healthy seedlings from tolerant butternuts into various locations across Eastern Ontario.
5.3 Shoreline Naturalization
Natural shoreline buffers rich in native plants are critically important to protecting the health of our lakes, rivers and streams. Shoreline vegetation protects water quality and aquatic habitat by intercepting potentially harmful contaminants such as nutrients, pollutants and sediment, regulating water temperatures, slowing runoff and providing important fish and wildlife habitat. Natural shorelines also help improve climate change resiliency by increasing flood storage and providing protection from erosion during extreme weather events.
As of the end of 2016, no shoreline projects had been carried out in the Rudsdale Creek catchment. Landowners may wish to take advantage of the RVCA's Shoreline Naturalization Program to assist them with the naturalization of their shorelines to see the benefits noted above (and more).
5.4 Valley, Stream, Wetland and Hazard Lands
The Rudsdale Creek catchment covers 62 square kilometres with none of the drainage area being within the regulation limit of Ontario Regulation 174/06 (Figure 56). Wetlands occupy 10 square kilometres (or 16 percent) of the catchment. All are unevaluated and unregulated. Similarly, all 132.7 kilometres of stream in the catchment (including Rudsdale Creek) are not subject to the regulation limit, other than the “alteration to waterways” provision of the Regulation, which affords them some protection.
Nonetheless, efforts (have been made and) continue through RVCA planning and regulations input and review to manage the impact of development (and other land management practices) in areas where “natural hazards” are associated with rivers, streams, valley lands and wetlands. This task is significantly harder, if not impossible to achieve in instances where these features have not been identified on map schedules, as is the case in the Rudsdale Creek catchment. Plotting of the regulation limit along the catchment's watercourses requires the identification of flood and erosion hazards and valley systems.
Figure 56 Regulated natural features/hazards and Intake Protection Zones in the Rudsdale Creek catchment
5.5 Vulnerable Drinking Water Areas
The Town of Perth’s municipal drinking water Intake Protection Zone (IPZ), specifically IPZ-2 with a vulnerability score of 8 is found within the Rudsdale Creek catchment (Figure 56). As per the Mississippi-Rideau Source Protection Plan, policies may affect future development within these areas. Under Section 59 of the Clean Water Act, 2006, future applications under the Building Code and the Planning Act may be screened by the Mississippi-Rideau Risk Management Office. Depending on the proposed activity, additional requirements or restrictions may apply. For more information, please contact the Mississippi-Rideau Risk Management Office at (613) 692-3571.
In addition, the Mississippi-Rideau Source Protection Plan has mapped the southern part of the Rudsdale Creek catchment as within a Significant Groundwater Recharge Area and identified all of the catchment as a Highly Vulnerable Aquifer. This means that the nature of the overburden (thin soils, fractured bedrock) does not provide a high level of protection for the underlying groundwater making the aquifer more vulnerable to contaminants released on the surface. Highly Vulnerable Aquifers characterise 89% of the Region and are considered moderate to low drinking water threats with certain policies that apply; mainly policies regarding waste disposal. All property owners are encouraged to use best management practices to protect sources of municipal drinking water. For more information on source protection best management practices, please visit Protecting Your Drinking Water.
6.0 Rudsdale Creek Catchment: Accomplishments/Activities
Achievements noted by the Friends of the Tay Watershed Association (FoTW) are indicated by an asterisk.
In-stream/Fish Habitat
3.3 kilometres of Rudsdale Creek have been surveyed and 32 headwaters sites are sampled once every six years by the RVCA using the Ontario Stream Assessment Protocol.
The lower channel of this creek near it mouth was substantially altered many years ago by the property owner digging several deep channels into the edge of this small creek, apparently for a planned residential development. Because it is a stream that is seldom travelled, the damage was not observed until years later - which was too late for proper remedial action. It is the FoTW Association's belief that this type of damage would not be missed with the present level of testing and monitoring that is now in place for such catchment areas.*
Tree Planting
98,000 trees have been planted at six sites in the Rudsdale Creek catchment by the RVCA Private Land Forestry Program, resulting in the reforestation of 49 hectares.
Water Quality
One stream monitoring site on Rudsdale Creek is sampled yearly by the RVCA for 22 parameters, six times a year, to assess surface chemistry water quality conditions.
One Ontario Benthic Biomonitoring Network site on Rudsdale Creek is sampled by the RVCA in the spring and fall of each year with three replicates, to assess instream biological water quality conditions.
Fifteen Clean Water projects were completed by the RVCA Rural Clean Water Program.
Water Taking
OMYA corporation reports annually to the public on its water-taking over the past 12 months - a condition of their Permit to Take Water (PTTW) for the withdrawal of water from the Tay River and company-owned wells. The taking of water began in accordance with the conditions outlined in the PTTW (and other permits) obtained in September 2003. At the first public meeting held to fulfil a condition of the water taking permit - to hold one public meeting in a calendar year to present a report on the company's water taking - there was great interest in the results presented by OMYA. Subsequent meetings have kept the community well-informed about its activities and adherence to the permit conditions, thus helping to alleviate public concerns about the water taking.
The Friends of the Tay Watershed Association help promote OMYA's report to the public about its water taking activities over the previous year.*
OMYA has installed a state-of-the-art digital water meter on the Tay River (one of the PTTW conditions). The data collected provides valuable information regarding Tay River water flows and facilitates future environmental and scientific study of the river.
Waterway Planning and Management
The Tay Watershed Management Plan (2002) brought together a diverse group of watershed stakeholders to exchange information and opinions on the challenges facing the watershed. This forum focused the community on the need for managing the Tay Watershed, requiring positive cooperation amongst a range of stakeholders and helped develop a foundation of data and information on the watershed and resources against which later developments and trends are being measured and decisions are being made.
The Plan also led to the formation of the Friends of the Tay Watershed Association, who have been instrumental in implementing 20 of 24 management plan recommendations. In the opinion of the Association, one of the most significant measures of success for the water protection activities carried out in the Tay watershed is that there has never been a serious environmental pollution incident that threatened the area’s drinking water or its recreational waterbodies. To this day, the Friends of the Tay Watershed remain committed to preserving and enhancing the health of the Tay River watershed through their work.*
The lower channel of Rudsdale Creek near its mouth at the Tay River was substantially altered many years ago by a landowner excavating several deep channels into the edge of this watercourse, apparently for a planned residential development. As Rudsdale Creek is seldom travelled by water, the damage done was not observed until many years later; too late for proper remedial action to be taken. The Friends of the Tay Watershed Association believes that this type of damage would not be missed now with the present level of water qualty testing and stream assessment monitoring that is now in place for Rudsdale Creek and other such catchment areas.
Headwaters/In-stream Habitat/Shorelines
Distribution of naturally vegetated shorelines is uneven across the Rudsdale Creek catchment, even though its headwater and tributary streams have more than 75 percent naturally vegetated shoreline cover (see Section 4.4 of this report).
Nine of 31 sampled headwater stream sites have been modified (four are ditched, three are channelized and two are ponded)(see Section 3.4.2 of this report).
Land Cover
Land cover has changed across the catchment (2008 to 2014) as a result of an increase in the area of settlement (5 ha.), aggregate extraction (2 ha.) and wetland (2 ha.) and loss of crop and pastureland (4 ha.), woodland (3 ha.) and meadow-thicket (3 ha.)(see Section 4.1 of this report).
Wetlands have declined by fifty-one percent since European pre-settlement and now cover 16 percent (996 ha.) of the catchment (in 2014). One hundred percent (996 ha.) of these wetlands remain unevaluated/unregulated and although they are not under imminent threat from development activity, they do remain vulnerable to drainage and land clearing activities in the absence of any regulatory and planning controls that would otherwise protect them for the many important hydrological, social, biological and ecological functions/services/values they provide to landowners and the surrounding community.
Water Quality
Surface chemistry water quality rating along Rudsdale Creek ranges from Fair to Good at the Christie Lake Road crossing. Results from this monitored site show that nutrient enrichment is a feature of Rudsdale Creek. Elevated nutrients may result in nutrient loading downstream and to the Tay River. Of the metals routinely monitored in Rudsdale Creek, iron (Fe) occasionally reported concentrations above the Provincial Water Quality Objective. In elevated concentrations, this metal can have toxic effects on sensitive aquatic species (see Section 2.1 of this report).
Instream biological water quality condition in Rudsdale Creek is Poor at the Christie Lake Road crossing. Samples are dominated with benthic invertebrate species that are tolerant to high organic pollution levels (see Section 3.3.1 of this report).
8.0 Rudsdale Creek Catchment: Actions/Opportunities
Aquatic Habitat/Fisheries
Educate waterfront property owners about fish habitat requirements, spawning timing and near-shore and in-water activities that can disturb or destroy fish habitat and spawning sites.
Work with various partners, including landowners, the Friends of the Tay Watershed Association and Tay Valley Township on fish habitat enhancement projects in the Tay River watershed, building off of new knowledge and the recommendations as described in the report "Fish Habitat of the Tay River Watershed: Existing Conditions and Opportunities for Enhancement" (2002) prepared by MNR, RVCA, Parks Canada, and DFO.
Development
Work with approval authorities (Lanark County, Leeds Grenville and Lanark District Health Unit, Mississippi Rideau Septic System Office, RVCA and Tay Valley Township) and landowners to consistently implement current land use planning and development policies for water quality and shoreline protection adjacent to Rudsdale Creek and headwater streams in the catchment (i.e., a minimum 30 metre development setback from water).
Explore ways and means to more effectively implement and enforce conditions of land-use planning and development approval to achieve net environmental gains (particularly with respect to rehabilitating or protecting naturally vegetated shorelines and water quality).
Encourage Committees of Adjustment to take advantage of technical and environmental information and recommendations forthcoming from planning and environmental professionals.
Municipalities in the Tay Watershed are encouraged to strengthen natural heritage and water resources official plan policies and zoning provisions (pertaining to water setbacks, frontage and naturalized shorelines and wetland protection) where deemed appropriate.
Work with Lanark County, Tay Valley Township and agencies to ensure that development approvals around lakes and along watercourses take into consideration the protection of fish habitat (including the near-shore nursery and spawning habitat).
Utilize RVCA subwatershed and catchment reports to help develop, revise and implement official plan policies to protect surface water resources and the natural environment (including woodlands, wetlands and shoreline cover).
Land Cover
Establish RVCA regulation limits around the 100 percent (996 ha.) of wetlands in the catchment that are unevaluated. Doing this will help protect landowners from natural hazards including mitigating surface water flow by storing water during periods of peak flow (such as spring snowmelt and heavy rainfall events) and releasing water during periods of low flow (this mitigation of water flow reduces flood damage), as well as contributing to the stabilization of shorelines and to the reduction of soil erosion damage through water flow mitigation and plant soil binding/retention.
Shorelines
Take advantage of the RVCA Shoreline Naturalization Program to re-naturalize altered creek and stream shoreline identified in this report as “Unnatural Riparian Land Cover". Target shoreline restoration at sites on Rudsdale Creek and along its tributaries, shown in orange on the Riparian Land Cover map (see Figure 54 in Section 4.4 of this report). Other stewardship opportunities in the catchment may be determined based on septic system inspections and surface water quality monitoring results.
Promote the use of bioengineering methods (using native shrub/tree planting, fascines, live stakes) as a shoreline erosion mitigation measure as well as a cost effective alternative to shoreline hardening (with rip rap, armour stone, gabion baskets, walls).
Educate landowners about the value and importance of natural shorelines and property best management practices with respect to shoreline use and development, septic system installation and maintenance and shoreline vegetation retention and enhancement (Leeds Grenville and Lanark District Health Unit, Mississippi Rideau Septic System Office, RVCA and Tay Valley Township).
Water Quality
Consider further investigation of the Fair surface chemistry water quality rating and Poorinstream biological water quality rating on Rudsdale Creek as part of a review of RVCA's Baseline and Benthic Invertebrate surface water quality monitoring.
Offer funding provided by the RVCA Rural Clean Water Program to landowners with potential projects that could improve water quality on Rudsdale Creek and its tributaries (e.g., livestock fencing, septic system repair/replacement and streambank erosion control/stabilisation).
Educate waterfront property owners about septic system care by providing information about sewage system maintenance (i.e., when to pump out septic systems and holding talks) through initiatives such as the Septic Savvy Workshop and services provided by the Mississippi Rideau Septic System Office.
Reduce pollutant loading to Rudsdale Creek through education about the application of shoreline, stormwater and agricultural best management practices; also consider using low impact development (LID) methods to improve the quality and reduce the amount of stormwater runoff directly reaching the river ecosystem. This will be particularly beneficial in areas with extensive impervious surfaces (i.e., asphalt, concrete, buildings, and severely compacted soils) or on sensitive shoreline properties (with steep slopes/banks, shallow/impermeable soils).
The RVCA produces individual reports for 14 catchments in the Tay River subwatershed. Using data collected and analyzed by the RVCA through its watershed monitoring and land cover classification programs, surface water quality and in-stream conditions are reported for the Tay River, Tay Watershed lakes and Tay tributaries along with a summary of environmental conditions for the surrounding countryside every six years, which includes analysis of data collected through the programs along with local information provided by stakeholders up to 2017.
This information is used to better understand the effects of human activity on our water resources, allows us to better track environmental change over time and helps focus watershed management actions where they are needed the most to help sustain the ecosystem services (cultural, aesthetic and recreational values; provisioning of food, fuel and clean water; regulation of erosion/natural hazard protection and water purification; supporting nutrient/water cycling and habitat provision) provided by the catchment’s lands and forests and waters (Millennium Ecosystem Assessment 2005).
The following sections of this report are a compilation of that work for the Glen Tay catchment.
55.7 square kilometres; occupies 7.0 percent of the Tay River subwatershed; 1.3% percent of the Rideau Valley watershed.
Geology/Physiography
The Glen Tay catchment resides within part of the physiographic region known as the Algonquin Highlands. In the Tay River subwatershed, this ancient and hilly geologic region is made up of such Precambrian rocks as marble, conglomerates, and dark or colour banded granite-like rocks. A large area of younger sandstone is located in the northern section of the catchment. Bedrock is overlain by large expanses of glacial till and clay. A geologic fault may run across this catchment.
Municipal Coverage
Rideau Lakes Township (4.7 km2; 9.0% of catchment)
Tay Valley Township (50.8 km2; 91.0% of catchment)
Stream Length
All watercourses (including headwater streams): 137.5 km.
1.2 Vulnerable Areas
The Mississippi-Rideau Source Water Protection program has mapped part of the northern area of the catchment as a Significant Groundwater Recharge Area and all of the catchment as a Highly Vulnerable Aquifer. There are no Well-Head Protection Areas in the catchment.
Wetland Hydrology
A watershed model developed by the RVCA in 2009 was used to study the hydrologic function of wetlands in the Rideau Valley Watershed, including those found in the Glen Tay catchment.
1.3 Conditions at a Glance
Fish Community/Thermal Regime
Warm and cool water recreational and baitfish fishery with 29 species observed in the Tay River and Scotts Snye during 2017.
Headwater Drainage Features
Classified as wetland and channelized features with historical modifications in the form of straightening.
Instream/Riparian Habitat
Tay River: Moderate to high habitat complexity was identified for the Tay River and the Scotts Snye. Regions with increased habitat complexity were observed throughout the reaches of the system within the catchment. Dissolved oxygen conditions for the Tay River and the Scotts Snye varied along the system for both warm and coolwater species.
Land Cover Change (2008 to 2014)
Catchment
Woodland
Meadow-Thicket
Transportation
Crop-Pasture
Settlement
Wetland
Hectares
-17
-1
1
+5
+5
+7
Land Cover Type (2014)
Catchment
Woodland
Crop-Pasture
Wetland
Settlement
Meadow-Thicket
Water
Transportation
Percent
45
28
15
4
3
3
2
Shoreline Cover Type (30 m. riparian area; 2014)
Catchment
Percent
Tay River
Percent
Streams*
Percent
Woodland
41
Wetland
72
Wetland
40
Wetland
37
Woodland
14
Woodland
36
Crop-Pasture
16
Crop-Pasture
6
Crop-Pasture
19
Settlement
2
Meadow-Thicket
4
Meadow-Thicket
2
Meadow-Thicket
2
Settlement
4
Transportation
2
Transportation
2
Transportation
<1
Settlement
1
*Excludes the Tay River
Significant Natural Features
Grants Creek Provincially Significant Wetland
Species at Risk (Elemental Occurrence)
Status
Species at Risk
Threatened
Bobolink
Eastern Meadowlark
---
Special Concern
Eastern Musk Turtle
Eastern Ribbonsnake
Snapping Turtle
Water Quality (Rating) for the Protection of Aquatic Life (2006 to 2017)
Tay River
@ Noonan Side Rd.
@ Glen Tay Rd.
@ Bowes Side Rd.
Surface Chemistry
Very Good
Good
---
Instream Biological
---
---
Excellent
Scott-Snye
@ Upper Scotch Line Rd.
Surface Chemistry
Good
Tay River: Benthic invertebrate samples are dominated with species that are sensitive to high organic pollution levels.
Water Wells
Approximately 330 operational private water wells in the Glen Tay catchment. Groundwater uses are mainly domestic, but also include commercial and livestock water supplies.
Wetland Cover
Wetlands are reported to have covered 30 percent of the Glen Tay catchment prior to European settlement, as compared to 15 percent (or 8.4 square kilometres) of the area in 2014. This represents a 49 percent (or 8.0 square kilometre) loss of historic wetland cover. Less than one percent of the remaining wetlands are regulated leaving over 99 percent (or 8.4 square kilometers) unregulated.
1.4 Catchment Care
Environmental Management
Development along the Tay River (Christie Lake to the Town of Perth) and in, and adjacent to, the Grants Creek Provincially Significant Wetland in the catchment is subject to Ontario Regulation 174-06 (entitled “Development, Interference with Wetlands and Alterations to Shorelines and Watercourses”) that protects landowners and their property from natural hazards (i.e., flooding, fluctuating water table, unstable soils) along with the hydrologic function of the wetland.
One Permit To Take Water (PTTW) is active in the catchment for industrial use .
Environmental Monitoring
Chemical surface (in-stream/lake) water quality collection by the RVCA since 2006 (see Section 2 of this report).
Benthic invertebrate (aquatic insect) surface (in-stream) water quality collection by the RVCA in the Tay River at the Noonan Side Road location since 2011 (see Section 3.3.1 of this report).
Fish survey and stream characterization survey by the RVCA on the Tay River in 2017 included taking measurements and recording observations on instream habitat, bank stability, other attributes and preparing a temperature profile (see Section 3 of this report).
Nineteen drainage feature assessments were conducted by the RVCA in 2017 at road crossings in the catchment. The protocol measures zero, first and second order headwater drainage features and is a rapid assessment method characterizing the amount of water, sediment transport, and storage capacity within headwater drainage features (see Section 3.4 of this report).
Classification of Glen Tay catchment land cover types derived by the RVCA from colour aerial photography that was acquired during the spring of 2008 and 2014 (see Section 4.1 of this report).
The Mississippi Rideau Septic System Office has conducted 58 voluntary septic system re-inspections on 59 properties along the Tay River from 2004 to 2017 (see Section 5.4 of this report).
Provincial groundwater level and chemistry, air pressure and precipitation data is available from a Provincial Groundwater Monitoring Network site located near Glen Tay (W083).
Stewardship
Thirty-seven stewardship projects were completed by landowners with assistance from the RVCA (see Section 5 of this report).
Surface water quality conditions in the Glen Tay catchment are monitored by the Rideau Valley Conservation Authority (RVCA) Baseline Water Quality Monitoring Program. The baseline water quality program focuses on streams; data is collected for 22 parameters including nutrients (total phosphorus and total Kjeldahl nitrogen), E. coli, metals (like aluminum and copper) and additional chemical/physical parameters (such as alkalinity, chlorides, pH and total suspended solids). Figure 2 shows the locations of monitoring sites in the catchment.
Figure 2 Water quality monitoring sites on the Tay River in the Glen Tay Catchment
2.1 Tay River: Water Quality Rating
There are three monitored water quality sites in the Glen Tay Catchment; two are on the Tay River (TAY-09 and TAY-05) and one site (SNY-03) is on a side channel of the main river known as Scotts Snye (Figure 2). The RVCA's water quality rating at the two Tay River sites was reported as "Good" and "Very Good" (Table 1), while the site on the Scotts-Snye reach was reported as "Good", as determined by the Canadian Council of Ministers of the Environment (CCME) Water Quality Index.
"Good" indicates that only a minor degree of threat or impairment is observed and conditions rarely depart from natural or desirable levels. “Very Good" indicates water quality is protected with a virtual absence of threat or impairment; conditions are very close to natural or pristine levels. Each parameter is evaluated against established guidelines to determine water quality conditions. Those parameters that frequently exceed guidelines are presented below. Data has been analyzed over the 2006-2017 period for general trends and conditions. Table 1 shows the overall rating for the monitored surface water quality sites within the catchment and Table 2 outlines the Water Quality Index (WQI) scores and their corresponding ratings.
The scores at these sites are largely influenced by few high nutrient concentrations and bacterial counts. For more information on the CCME WQI, please see the Tay River Subwatershed Report. For more information on the CCME WQI, please see the Tay River Subwatershed Report.
Table 1 Water Quality Index ratings for the Glen Tay Catchment
Site
Location
2006-2008
2009-2011
2012-2014
2015-2017
TAY-09
Tay River at Adams Pond
Good (85)
Good (94)
Very Good (97)
Very Good (100)
TAY-05
Tay River at Glen Tay
Good (85)
Good (87)
Very Good (97)
Good (91)
SNY-03
Scotts Snye Upper Scotch Line
Good (88)
Good (87)
Good (86)
Good (87)
Table 2 Water Quality Index ratings and corresponding index scores (RVCA terminology, original WQI category names in brackets)
Rating
Index Score
Very Good (Excellent)
95-100
Good
80-94
Fair
65-79
Poor (Marginal)
45-64
Very Poor (Poor)
0-44
2.1.1 Tay River Nutrients
Total phosphorus (TP) is used as a primary indicator of excessive nutrient loading and may contribute to abundant aquatic vegetation growth and depleted dissolved oxygen levels. The Provincial Water Quality Objective (PWQO) is used as the TP Guideline and states that in streams concentrations greater than 0.030 mg/l indicate an excessive amount of TP.
Total Kjeldahl nitrogen (TKN) is used as secondary indicators of nutrient loading. RVCA uses a guideline of 0.500 mg/l to assess TKN[1] .
Tables 3 and 4 summarize average nutrient concentrations at monitored sites within the Glen Tay catchment and show the proportion of results that meet the guidelines.
Table 3 Summary of total phosphorus results for the Glen Tay catchment, 2006-2017.
Total Phosphorus 2006-2017
Site
Average (mg/l)
Below Guideline
No. Samples
TAY-09
0.010
99%
72
TAY-05
0.015
97%
72
SNY-03
0.016
96%
71
Table 4 Summary of total Kjeldahl nitrogen results for the Glen Tay catchment from 2006-2017. Highlighted values indicate average concentrations exceed the guideline
Total Kjeldahl Nitrogen 2006-2017
Site
Average (mg/l)
Below Guideline
No. Samples
TAY-09
0.400
96%
72
TAY-05
0.438
81%
71
SNY-03
0.413
86%
71
Monitoring Site TAY-09
Site TAY-09 is the most upstream site on the main stem of the Tay River monitored in this catchment. Almost all (99 percent) samples at this site were below the TP guideline from 2006-2017 (Figures 3 and 4). The average TP concentration in the at this site was 0.010 mg/l (Table 3), the monthly average concentrations are fairly consistent with lower concentrations observed in the late summer and early fall (Figure 3). Overall a decrease was observed in TP concentrations over the 2006-2017 period[2] .
TKN concentrations show that the bulk of results (96 percent) were also below the guideline (Figure 6, Table 4). The average concentration over the 2006-2017 period was 0.400 mg/l (Table 4); monthly averages are comparable across the sampling season with the lowest concentrations observed in April and November (Figure 5). There was no significant trend found in TKN results at this site.
Monitoring Site TAY-05
Site TAY-05 is downstream of TAY-09 and the inflow from the Scotts-Snye side channel of the Tay River. TP results were low, the average concentrations was 0.015 and 97 percent of samples were below the guideline (Table 3, Figure 4). Monthly TP concentrations followed a similar pattern to upstream site TAY-09, though were consistently higher (Figure 3). A declining trend in TP concentrations was also observed in the data from this site.
The majority of TKN results were below the guideline (Figure 5 and 6), 81 percent of samples were below 0.500 mg/l (TKN Guideline) with an average concentration of 0.438 mg/l (Table 4). Average monthly concentrations were comparable and also followed a similar pattern to TAY-09 (Figure 5). No significant trend was observed in the 2006-2017 TKN dataset.
Monitoring Site SNY-03
Site SNY-03 is on a channel that runs adjacent to the Tay River, TP concentrations are comparable to the downstream site TAY-05. Ninety-six percent of samples at this site were below the TP guideline from 2006-2017 (Figures 3 and 4), and the average TP concentration in the at this site was 0.016 mg/l (Table 3). The monthly average concentrations were more variable then those sites (TAY-09 and TAY-05) on the main stem of the Tay River (Figure 3). A decrease was observed in TP concentrations over the 2006-2017 period.
TKN concentrations show that the bulk of results (86 percent) were also below the guideline (Figure 6, Table 4). The average concentration over the 2006-2017 period was 0.413 mg/l (Table 4). Average monthly concentrations (Figure 5) show a similar pattern to sites on the Tay River (TAY-09 and TAY-05), with generally comparable concentrations. No trend in TKN concentrations was observed at this site.
Figure 3 Average monthly total phosphorous concentrations in the Glen Tay catchment, 2006-2017
Figure 4 Distribution of total phosphorous concentrations in the Glen Tay catchment, 2006-2017
Figure 5 Average monthly total Kjeldahl nitrogen concentrations in the Glen Tay catchment , 2006-2017
Figure 6 Distribution of total Kjeldahl nitrogen concentrations in the Glen Tay catchment , 2006-2017
Summary of Tay River Nutrients
The data collected in this catchment provides evidence that nutrient enrichment is not a significant concern in this reach of the Tay River. Overall, the increase in TP and TKN concentrations from TAY-09 to TAY-05 show that some nutrient enrichment does occur downstream, however a declining trend in TP concentrations was noted at all sites. This provides support that cumulative changes throughout the catchment has reduced nutrient concentrations. This should be taken as a positive sign as high nutrient concentrations can help stimulate the growth of algae blooms and other aquatic vegetation in a waterbody and deplete oxygen levels as the vegetation dies off. It is important to continue best management practices such as minimizing storm water runoff, enhanced shoreline buffers, minimizing/discontinuing the use of fertilizers and restricting livestock access in upstream agricultural areas can help to prevent nutrient pollution and to continue to protect and enhance water quality conditions within the Tay River.
2.1.2 Tay River: E. coli
Escherichia coli (E. coli) is used as an indicator of bacterial pollution from human or animal waste; in elevated concentrations it can pose a risk to human health. The PWQO of 100 colony forming units/100 millilitres (CFU/100 ml) is used. E. coli counts greater than this guideline indicate that bacterial contamination may be a problem within a waterbody.
Table 5 summarizes the geometric mean[3] for the monitored sites within the Glen Tay catchment and shows the proportion of samples that meet the E. coli guideline of 100 CFU/100 ml. The results of the geometric mean with respect to the guideline, are shown in Figures 7 and 8 respectively.
Table 5 Summary of E. coli results for the Glen Tay catchment, 2006-2017
E. coli 2006-2017
Site
Geometric Mean (CFU/100ml)
Below Guideline
No. Samples
TAY-09
20
97%
71
TAY-05
32
83%
72
SNY-03
39
87%
71
Monitoring Site TAY-09
E. coli counts at site TAY-09 indicate little concern with regard to bacterial contamination. Ninety-seven percent of samples were below the guideline (Figures 7-8) and the count at the geometric mean was only 20 CFU/100ml (Table 5). Monthly E. coli counts showed that the geometric mean was highest during the warmer months though all results were well below the guideline; warm water temperatures are more favourable for bacterial growth. (Figure 7). No trend was noted in E. coli counts over the 2006-2017 period.
Monitoring Site TAY-05
Elevated E. coli counts at site downstream site TAY-05 were also uncommon. Eighty-three percent of samples were below the guideline (Figure 8) from 2006-2017. The count at the geometric mean was 32 CFU/100ml (Table 5) and well below the guideline, the highest counts were recorded in June (Figure 7). As with site TAY-09 there was no significant trend in E. coli data over the 2006-2017 period.
Monitoring Site SNY-03
E. coli counts at site SNY-03 were comparable to conditions within the main channel of the Tay River (TAY-09 and TAY-05). Eighty-seven percent of samples were below the guideline, with count of 39 CFU/100ml at the geometric mean (Table 5, Figure 8). Monthly E. coli counts were below the guideline with the highest counts observed during the summer months (Figure 7). As with upstream sites no trend was noted in E. coli counts over the 2006-2017 period.
Figure 7 Geometric mean of E. coli results in the Glen Tay catchment, 2006-2017
Figure 8 Distribution of E. coli counts in the Glen Tay catchment, 2006-2017.
Summary of Tay River Bacterial Contamination
Bacterial contamination does not appear to be a significant concern in this reach of the Tay River. There are very few exceedances at all three sites and counts at the geometric mean are well below the guideline of 100 CFU/100ml. Best management practices such as enhancing shoreline buffers, limiting livestock access and minimizing runoff in both agricultural and developed areas can help to protect this reach of the Tay River into the future.
1 No Ontario guideline for TKN is presently available; however, waters not influenced by excessive organic inputs typically range from 0.100 to 0.500 mg/l, Environment Canada (1979) Water Quality Sourcebook, A Guide to Water Quality Parameters, Inland Waters Directorate, Water Quality Branch, Ottawa, Canada.
2 Trends in the data were assessed using the Mann-Kendall trend test and Sens slope statistic.
3 A type of mean or average, which indicates the central tendency or typical value of a set of numbers by using the product of their values (as opposed to the arithmetic mean which uses their sum). It is often used to summarize a variable that varies over several orders of magnitude, such as E. coli counts.
The Stream Characterization Program evaluated 17.9 km of the Tay River and the Scotts Snye in 2017 in the Glen Tay catchment. A total of 135 stream surveys on the Tay River and 44 on the Scotts Snye were completed in the June and July. For the purposes of the report the results for both systems are summarized together.
In 2017 the Tay River subwatershed experienced high water levels along the Tay River and its tributaries. In addition many of the Tay watershed lakes also experienced prolonged high water levels including Christie Lake immediately upstream of this reach. After moving from two years of drought conditions in 2015 and 2016 heavy rains throughout the year made 2017 the wettest year in recorded history. The high flows out of Bobs Lake and through Christie Lake caused some out of bank flooding downstream of Althorpe Road affecting properties on Bathurst Concession 2 and Noonan Sideroad. No other flooding was recorded which would be because of the topography – relatively flat from Christie Lake through Althorpe Road to Noonan Sideroad with slower flows and low banks. Below Noonan Road, the gradient increases and the water moves more quickly downstream and does not overtop the banks as easily. Flows remained above average through the year with the frequent rain events.
The Tay River at Bowes Side Road during the spring of 2017 (looking downstream)
The Tay River at Bowes Side Road during the spring of 2017 (looking upstream)
3.1 Glen Tay - Tay River Overbank Zone
3.1.1 Riparian Land Cover Evaluation
The quality of the riparian area increases with the width, complexity and linear extent of its vegetation along a stream or creek. A complex riparian community consists of diverse plant species native to the site, with multiple age-classes providing vertical structural diversity along a watercourse.
Here is a list of watershed benefits from a healthy riparian buffer zone:
Reduces the amount of pollutants that reach the stream from surface runoff
Helps reduce and mitigates erosion
Provides a microclimate that is cooler during the summer months providing cooler water for aquatic organisms
Provides large wood structure from fallen trees and limbs that form instream cover, create pools, stabilize the streambed, and provide habitat for aquatic organisms
Provides organic material for stream biota that, among other functions, is the base of the food chain in lower order streams
Provides habitat for terrestrial insects that drop in the stream and become food for fish and travel corridors for other terrestrial animals
Dissipates energy during flood events
Often provides the only refuge areas for fish during out-of-bank flows (behind trees, stumps, and logs)
Figure 9 demonstrates the buffer conditions of the left and right banks separately. The Tay River and the Scotts Snye had a buffer of greater than 30 meters along 90 percent of the left bank and 88 percent of the right bank.
Figure 9 Riparian Buffer Evaluation along the Tay River and the Scotts Snye in the Glen Tay catchment
3.1.2 Riparian Buffer Alterations
Alterations within the riparian buffer were assessed within three distinct shoreline zones (0-5m, 5-15m, 15-30m), and evaluated based on the dominant vegetative community and/or land cover type (Figure 10). The riparian buffer zone along the Tay River and the Scotts Snye was found to be dominated by forest, scrubland, wetlands and meadow conditions. There were minimal areas with altered riparian zone conditions along the majority of the system.
Figure 10 Riparian buffer alterations along Tay River and the Scotts Snye
3.1.3 Adjacent Land Use
The RVCA’s Stream Characterization Program identifies eleven different land uses along the Tay River and the Scotts Snye (Figure 11). Surrounding land use is considered from the beginning to end of the survey section (100m) and up to 100m on each side of the river. Land use outside of this area is not considered for the surveys but is nonetheless part of the subwatershed and will influence the creek. Forest habitat was dominant at 93 percent; scrubland was found along 70 percent of the surveyed sections, wetland habitat was observed along 45 percent of the system and 15 percent meadow habitat was present along the Tay River and Scotts Snye. The remaining land use consisted of residential, pasture, active/abandoned agriculture, recreational and infrastructure in the form of road crossings.
Figure 11 Land Use along the Tay River and the Scotts Snye in the Glen Tay catchment
3.2 Glen Tay - Tay River Shoreline Zone
3.2.1 Instream Erosion
Stream erosion is the process by which water erodes and transports sediments, resulting in dynamic flows and diverse habitat conditions. Excessive erosion can result in drastic environmental changes, as habitat conditions, water quality and aquatic life are all negatively affected. Bank stability was assessed as the overall extent of each section with “unstable” shoreline conditions. These conditions are defined by the presence of significant exposed soils/roots, minimal bank vegetation, severe undercutting, slumping or scour and potential failed erosion measures. The majority of the Tay River and the Scotts Snye had no erosion observed along the majority of surveyed sections with a few small sections having low levels of erosion (Figure 12).
Figure 12 Erosion levels along the Tay River and the Scotts Snye in the Glen Tay catchment
3.2.2 Undercut Stream Banks
Stream bank undercuts can provide excellent cover habitat for aquatic life, however excessive levels can be an indication of unstable shoreline conditions. Bank undercut was assessed as the overall extent of each surveyed section with overhanging bank cover present. Figure 13 shows that the Tay River and the Scotts Snye had no observed undercut banks along the majority of the system, however there were several short sections with low to moderate levels of undercut banks.
Figure 13 Undercut stream banks along the Tay River and the Scotts Snye in the Glen Tay catchment
3.2.3 Stream Shading
Grasses, shrubs and trees all contribute towards shading a stream. Shade is important in moderating stream temperature, contributing to food supply and helping with nutrient reduction within a stream. Stream cover is assessed as the total coverage area in each section that is shaded by overhanging trees/grasses and tree canopy, at greater than 1m above the water surface. Figure 14 shows low levels of stream shading along the Tay River and the Scotts Snye. Stream shading conditions were highly variable along the Tay River and the Scotts Snye ranging from no overhead canopy cover to high levels.
Figure 14 Stream shading along the Tay River and the Scotts Snye in the Glen Tay catchment
3.2.4 Instream Wood Structure
Forested shorelines provide essential complex habitat through the perpetual process of shoreline trees falling into the water. This continuous recruitment of trees creates a wood-based physical structure in the littoral zone that is common on natural systems. Insects, fish, amphibians, birds, and other animals have also evolved with this abundance of near shore wood and it is essential to their life cycles. With increased development along many waterways and forested lakeshores having been altered as a result wood-based physical structure in many waterbodies has been reduced. It is important to restore this essential habitat to aquatic ecosystems.
Shoreline Protection
Protects shorelines by providing a barrier from wind and wave erosion
Reduces sedimentation of the water caused by shoreline slumping due to bank erosion
Allows detritus to collect and settle on the lake or creek bed providing the substrate structure required for native aquatic vegetation to establish and outcompete invasive species
Food Source
Wood complexes are an important food source for invertebrates
Small fish feed on the abundance of invertebrates that are found around these structures
Larger fish, waterfowl and shorebirds all benefit from the abundance of invertebrates and small fish feeding around woody structures in the littoral zone
Cover
Cover from predators is essential for many fish and animals to successfully complete their life cycle
The nooks and crannies of wood complexes offer critters safety from predators while at the same time concentrating prey to make predators more efficient
Wood provides the structure on which many species must lay or attach their eggs, therefore these complexes provide quality spawning and nesting habitat
Diversity
Wood complexes in the littoral zone provide unique edge habitat along the shoreline
Edge habitats contain more species diversity and higher concentrations of species than the adjoining habitats themselves will have
Figure 15 shows that the majority of the Tay River and the Scotts Snye had low levels of instream wood structure along the system. There were several stream survey sections in the middle reach which were characterized as having moderate to high levels of instream wood structure in the form of branches and trees along the system.
Figure 15 Instream wood structure along the Tay River and the Scotts Snye in the Glen Tay catchment
3.2.5 Overhanging Wood Structure
Trees and branches that are less than one meter from the surface of the water are defined as overhanging. Overhanging branches and trees provide a food source, nutrients and shade which helps to moderate instream water temperatures. Figure 16 shows the system is variable with no overhanging branches and trees to areas that have high levels of overhanging wood structure along the Tay River and the Scotts Snye.
Figure 16 Overhanging wood structure along the Tay River and the Scotts Snye in the Glen Tay catchment
Overhanging and instream wood structure along the Scotts Snye in the Glen Tay catchment
3.2.6 Anthropogenic Alterations
Stream alterations are classified based on specific functional criteria associated with the flow conditions, the riparian buffer and potential human influences. Figure 17 shows sixty six percent of the Tay River and the Scotts Snye remains “unaltered” with no anthropogenic alterations. Thirty one percent of the Tay River and the Scotts Snye was classified as natural with minor anthropogenic changes. Three percent of survey sections were classified as being altered they consisted of sections with road crossings and areas with shoreline modifications.
Figure 17 Anthropogenic alterations along the Tay River and the Scotts Snye in the Glen Tay catchment
3.3 Glen Tay - Tay River Instream Aquatic Habitat
3.3.1 Benthic Invertebrates
Freshwater benthic invertebrates are animals without backbones that live on the stream bottom and include crustaceans such as crayfish, molluscs and immature forms of aquatic insects. Benthos represent an extremely diverse group of aquatic animals and exhibit wide ranges of responses to stressors such as organic pollutants, sediments and toxicants, which allows scientists to use them as bioindicators. As part of the Ontario Benthic Biomonitoring Network (OBBN), the RVCA has been collecting benthic invertebrates at the Bowes Side Road site since 2011. The site was added to the monitoring network as a result of an identified gap in the program during the first reporting cycle. Monitoring data is analyzed for each sample site and the results are presented using the Family Biotic Index, Family Richness and percent Ephemeroptera, Plecoptera and Trichoptera.
Benthic invertebrate sampling location at Bowes side Road
Hilsenhoff Family Biotic Index
The Hilsenhoff Family Biotic Index (FBI) is an indicator of organic and nutrient pollution and provides an estimate of water quality conditions for each site using established pollution tolerance values for benthic invertebrates. FBI results for the Glen Tay - Tay River catchment at the Bowes Side Road sample location is summarized by year. “Good” to “Excellent” water quality conditions were observed at the Tay River sample location (Figure 18) using a grading scheme developed by Conservation Authorities in Ontario for benthic invertebrates.
Figure 18 Hilsenhoff Family Biotic Index at the Bowes Side Road sample location
Family Richness
Family Richness measures the health of the community through its diversity and increases with increasing habitat diversity suitability and healthy water quality conditions. Family Richness is equivalent to the total number of benthic invertebrate families found within a sample. The Tay River sample location is reported to have “Good” family richness (Figure 19).
Figure 19 Family Richness at the Bowes Side Road sample location
EPT
Ephemeroptera (Mayflies), Plecoptera (Stoneflies), and Trichoptera (Caddisflies) are species considered to be very sensitive to poor water quality conditions. High abundance of these organisms is generally an indication of good water quality conditions at a sample location. The community structure is typically dominated by species that are sensitive to poor water quality conditions. As a result, the EPT indicates that Tay River sample location is reported to have “Good” water quality (Figure 20) during the reporting periods.
Figure 20 EPT on the Bowes Side Road sample location
Conclusion
Overall the Tay River sample location in the Glen Tay catchment from a benthic invertebrate perspective is considered “Excellent” as the samples are dominated with species that are sensitive to high organic pollution levels.
3.3.2 Habitat Complexity
Habitat complexity is a measure of the overall diversity of habitat types and features within a stream. Streams with high habitat complexity support a greater variety of species niches, and therefore contribute to greater diversity. Factors such as substrate, flow conditions (pools, riffles) and cover material (vegetation, wood structure, etc.) all provide crucial habitat to aquatic life. Habitat complexity is assessed based on the presence of boulder, cobble and gravel substrates, as well as the presence of instream wood structure.
Moderate to high habitat complexity was identified for the Tay River and the Scotts Snye (Figure 21). Regions with increased habitat complexity were observed throughout the reaches of the system within the catchment.
Figure 21 Habitat complexity along the Tay River and the Scotts Snye in the Glen Tay catchment
3.3.3 Instream Substrate
Diverse substrate is important for fish and benthic invertebrate habitat because some species have specific substrate requirements and for example will only reproduce on certain types of substrate. The absence of diverse substrate types may limit the overall diversity of species within a stream. Figure 22 shows the overall presence of various substrate types observed along Grants Creek. Substrate conditions were highly diverse along the Tay River and the Scotts Snye with all substrate types being recorded at various locations along the system. Figure 23 shows the dominant substrate type observed for each section surveyed along the Tay River and the Scotts Snye.
Figure 22 Instream substrate along the Tay River and the Scotts Snye in the Glen Tay catchment
Figure 23 shows the dominant substrate type along the Tay River and the Scotts Snye in the Glen Tay catchment
3.3.4 Instream Morphology
Pools and riffles are important habitat features for aquatic life. Riffles are fast flowing areas characterized by agitation and overturn of the water surface. Riffles thereby play a crucial role in contributing to dissolved oxygen conditions and directly support spawning for some fish species. They are also areas that support high benthic invertebrate populations which are an important food source for many aquatic species. Pools are characterized by minimal flows, with relatively deep water and winter/summer refuge habitat for aquatic species. Runs are moderately shallow, with unagitated surfaces of water and areas where the thalweg (deepest part of the channel) is in the center of the channel. Figure 24 shows that the Tay River and the Scotts Snye are highly variable; 92 percent of sections recorded runs, 62 percent pools and 48 percent riffles. Figure 25 shows where the riffle habitat areas were observed along the Tay River and the Scotts Snye.
Figure 24 Instream morphology along the Tay River and the Scotts Snye in the Glen Tay catchment
Figure 25 Instream riffle habitat along the Tay River and the Scotts Snye in the Glen Tay catchment
3.3.5 Vegetation Type
Instream vegetation provides a variety of functions and is a critical component of the aquatic ecosystem. Aquatic plants promote stream health by:
Providing direct riparian/instream habitat
Stabilizing flows reducing shoreline erosion
Contributing to dissolved oxygen through photosynthesis
Maintaining temperature conditions through shading
For example emergent plants along the shoreline can provide shoreline protection from wave action and important rearing habitat for species of waterfowl. Submerged plants provide habitat for fish to find shelter from predator fish while they feed. Floating plants such as water lilies shade the water and can keep temperatures cool while reducing algae growth. Narrow leaved emergents were observed in 86 percent of sections, submerged plants at 87 percent, 78 percent broad leaved emergents, 65 percent of sections contained algae, 64 percent floating plants, while robust emergents were present in 39 percent of the survey sections. Figure 26 depicts the plant community structure for the Tay River and the Scotts Snye. Figure 27 shows the dominant vegetation type observed for each section surveyed along the Tay River and the Scotts Snye in the Glen Tay catchment.
Figure 26 Vegetation type along the Tay River and the Scotts Snye in the Glen Tay catchment
Figure 27 Dominant vegetation type along the Tay River and the Scotts Snye in the Glen Tay catchment
3.3.6 Instream Vegetation Abundance
Instream vegetation is an important factor for a healthy stream ecosystem. Vegetation helps to remove contaminants from the water, contributes oxygen to the stream, and provides habitat for fish and wildlife. Too much vegetation can also be detrimental. Figure 28 demonstrates that the Tay River and the Scotts Snye had normal to common levels of vegetation recorded at 49 and 46 percent of stream surveys. Extensive levels of vegetation were observed in 28 percent of the surveyed sections, while 45 percent of sections had no vegetation in areas that were dominated by bedrock substrate conditions.
Figure 28 Instream vegetation abundance along the Tay River and the Scotts Snye in the Glen Tay catchment
3.3.7 Invasive Species
Invasive species can have major implications on streams and species diversity. Invasive species are one of the largest threats to ecosystems throughout Ontario and can out compete native species, having negative effects on local wildlife, fish and plant populations. Ninety five percent of the sections surveyed along the Tay River and the Scotts Snye in the Glen Tay catchment had invasive species. The invasive species observed were European frogbit, banded mystery snail, Chinese mystery snail, curly leafed pondweed, dog strangling vine, Eurasian milfoil, European/Black alder, flowering rush, honey suckle, Manitoba maple, zebra mussel, yellow iris, poison/wild parsnip, purple loosestrife, bull thistle and common/glossy buckthorn. Invasive species abundance (i.e. the number of observed invasive species per section) was assessed to determine the potential range/vector of many of these species (Figure 29).
Figure 29 Invasive species abundance along the Tay River and the Scotts Snye in the Glen Tay catchment
3.3.8 Water Chemistry
During the stream characterization survey, a YSI probe is used to collect water chemistry information. Dissolved oxygen (DO), specific conductivity (SPC) and pH are measured at the start and end of each section.
RVCA staff measuring water chemistry on the Scotts Snye in 2017 using a YSI water quality meter
3.3.8.1 Dissolved Oxygen
Dissolved oxygen is a measure of the amount of oxygen dissolved in water. The Canadian Environmental Quality Guidelines of the Canadian Council of Ministers of the Environment (CCME) suggest that for the protection of aquatic life the lowest acceptable dissolved oxygen concentration should be 6 mg/L for warmwater biota and 9.5 mg/L for coldwater biota (CCME, 1999). Figure 30 shows that the dissolved oxygen in Tay River and the Scotts Snye supports warmwater and in certain locations coldwater biota along the system. The average dissolved oxygen level observed within the Glen Tay - Tay River catchment was 8.2mg/L which meets the recommended level for warm and cool water biota.
Figure 30 Dissolved oxygen ranges along the Tay River and the Scotts Snye in the Glen Tay catchment
3.3.8.2 Conductivity
Conductivity in streams is primarily influenced by the geology of the surrounding environment, but can vary drastically as a function of surface water runoff. Currently there are no CCME guideline standards for stream conductivity; however readings which are outside the normal range observed within the system are often an indication of unmitigated discharge and/or stormwater input. The average conductivity observed within the Tay River and the Scotts Snye was 145.8 µs/cm. Figure 31 shows the conductivity readings for the Tay River and the Scotts Snye in the Glen Tay catchment.
Figure 31 Specific conductivity ranges in the Tay River and the Scotts Snye in the Glen Tay catchment
3.3.8.3 pH
Based on the PWQO for pH, a range of 6.5 to 8.5 should be maintained for the protection of aquatic life. Average pH values along the Tay River and the Scotts Snye were 7.83 thereby meeting the provincial standard (Figure 32).
Figure 32 pH ranges along the Tay River and the Scotts Snye in the Glen Tay catchment
3.3.8.4 Oxygen Saturation (%)
Oxygen saturation is measured as the ratio of dissolved oxygen relative to the maximum amount of oxygen that will dissolve based on the temperature and atmospheric pressure. Well oxygenated water will stabilize at or above 100% saturation, however the presence of decaying matter/pollutants can drastically reduce these levels. Oxygen input through photosynthesis has the potential to increase saturation above 100% to a maximum of 500%, depending on the productivity level of the environment. In order to represent the relationship between concentration and saturation, the measured values have been summarized into 6 classes.
Dissolved oxygen conditions for the Tay River and the Scotts Snye varied along the system for both warm and coolwater species (Figure 33).
Figure 33 A bivariate assessment of dissolved oxygen concentration (mg/L) and saturation (%) in the Tay River and the Scotts Snye in the Glen Tay catchment
3.3.8.5 Specific Conductivity Assessment
Specific conductivity (SPC) is a standardized measure of electrical conductance, collected at or corrected to a water temperature of 25⁰C. SPC is directly related to the concentration of ions in water, and is commonly influenced by the presence of dissolved salts, alkalis, chlorides, sulfides and carbonate compounds. The higher the concentration of these compounds, the higher the conductivity. Common sources of elevated conductivity include storm water, agricultural inputs and commercial/industrial effluents.
In order to summarize the conditions observed, SPC levels were evaluated as either normal, moderately elevated or highly elevated. These categories correspond directly to the degree of variation (i.e. standard deviation) at each site relative to the average across the system.
Normal levels were maintained in the middle reaches of the Tay River and the Scotts Snye, however there were moderately elevated areas in the middle and lower reaches (Figure 34). Two sections had high conductivity levels observed in the lower reach.
Figure 34 Relative specific conductivity levels along the Tay River and the Scotts Snye in the Glen Tay catchment
3.3.9 Thermal Regime
Many factors can influence fluctuations in stream temperature, including springs, tributaries, precipitation runoff, discharge pipes and stream shading from riparian vegetation. Water temperature is used along with the maximum air temperature (using the Stoneman and Jones method) to classify a watercourse as either warm water, cool water or cold water. Figure 35 shows where the thermal sampling sites were located on the Tay River and the Scotts Snye in the Glen Tay catchment. Analysis of the data collected indicates that the Tay River and the Scotts Snye are classified as warm water systems (Figure 36).
Figure 35 Temperature logger locations along the Tay River and the Scotts Snye in the Glen Tay catchment
Figure 36 Temperature logger data for the sites along the Tay River and the Scotts Snye in the Glen Tay catchment
Each point on the graph represents a temperature that meets the following criteria:
Sampling dates between July 1st and September 7th
Sampling date is preceded by two consecutive days above 24.5 °C, with no rain
Water temperatures are collected at 4pm
Air temperature is recorded as the max temperature for that day
3.3.10 Groundwater
Groundwater discharge areas can influence stream temperature, contribute nutrients, and provide important stream habitat for fish and other biota. During stream surveys, indicators of groundwater discharge are noted when observed. Indicators include: springs/seeps, watercress, iron staining, significant temperature change and rainbow mineral film. Figure 37 shows areas where one or more of the above groundwater indicators were observed during stream surveys and headwater assessments.
Figure 37 Groundwater indicators observed in the Glen Tay - Tay River and the Scotts Snye catchment
3.3.11 Fish Community
The Tay River and the Scotts Snye Glen Tay catchment is classified as a mixed community of warm and cool water recreational and baitfish fishery with 29 species observed (Figure 38). Table 6 displays a list of species observed in the watershed in 2017 and historically.
Figure 38 Fish community sampling observations for 2017
Table 6 Fish species observed in the Glen Tay catchment
Fish Species
Scientific Name
Fish code
Historical
2017
banded killifish
Fundulus diaphanus
BaKil
X
X
blackchin shiner
Notropis heterodon
BcShi
X
blacknose dace
Rhinichthys atratulus
BnDac
X
blacknose shiner
Notropis heterolepis
BnShi
X
bluntnose minnow
Pimephales notatus
BnMin
X
X
brook stickleback
Culaea inconstans
BrSti
X
brown bullhead
Ameiurus nebulosus
BrBul
X
X
carps and minnows
Cyprinidae
CA_MI
X
central mudminnow
Umbra limi
CeMud
X
central stoneroller
Campostoma anomalum
CeSto
X
common shiner
Luxilus cornutus
CoShi
X
X
creek chub
Semotilus atromaculatus
CrChu
X
emerald shiner
Notropis atherinoides
EmShi
X
etheostoma sp.
etheostoma sp.
EthSp
X
fallfish
Semotilus corporalis
Fallf
X
fathead minnow
Pimephales promelas
FhMin
X
hornyhead chub
Nocomis biguttatus
HhChu
X
X
iowa darter
Etheostoma exile
IoDar
johnny darter
Etheostoma nigrum
JoDar
X
largemouth bass
Micropterus salmoides
LmBas
X
logperch
Percina caprodes
Logpe
X
X
longnose dace
Rhinichthys cataractae
LnDac
X
northern pearl dace
Margariscus nachtriebi
PeDac
X
northern pike
Esox lucius
NoPik
X
X
northern redbelly dace
Chrosomus eos
NRDac
X
pumpkinseed
Lepomis gibbosus
Pumpk
X
X
rock bass
Ambloplites rupestris
RoBas
X
X
smallmouth bass
Micropterus dolomieu
SmBas
X
X
spottail shiner
Notropis hudsonius
StShi
X
walleye
Sander vitreus
Walle
X
white sucker
Catostomus commersonii
WhSuc
X
yellow bullhead
Ameiurus natalis
YeBul
X
yellow perch
Perca flavescens
YePer
X
TOTAL Species
29
13
RVCA fyke net site along the Tay River in the Glen Tay - Tay River catchment.
3.3.12 Migratory Obstructions
It is important to know locations of migratory obstructions because these can prevent fish from accessing important spawning and rearing habitat. Migratory obstructions can be natural or manmade, and they can be permanent or seasonal. Figure 39 shows that Glen Tay catchment had one perched culvert on a headwater drainage feature and one natural grade barrier on the Tay River.
Figure 39 Migratory obstructions in the Glen Tay catchment
3.3.13 Beaver Dams
Overall beaver dams create natural changes in the environment. Some of the benefits include providing habitat for wildlife, flood control, and silt retention. Additional benefits come from bacterial decomposition of woody material used in the dams which removes excess nutrient and toxins. Beaver dams can also result in flooding of agricultural lands and may be potential barriers to fish migration. Several beaver dams were identified along the Scotts Snye at the time of the survey (Figure 40).
Figure 40 Beaver Dam type and locations in the Glen Tay catchment
Beaver dam located on the Scotts Snye in the summer of 2017
3.3.14 Riparian Restoration
Figure 41 depicts the locations of riparian restoration opportunities as a result of observations made during the stream survey. Two riparian planting opportunities were identified on headwater drainage features in the Glen Tay catchment.
Figure 41 Riparian restoration opportunities in the Glen Tay catchment
3.4 Headwater Drainage Feature Assessment
3.4.1 Headwaters Sampling Locations
The RVCA Stream Characterization program assessed Headwater Drainage Features for the Glen Tay - Tay River catchment in 2017. This protocol measures zero, first and second order headwater drainage features (HDF). It is a rapid assessment method characterizing the amount of water, sediment transport, and storage capacity within headwater drainage features (HDF). RVCA is working with other Conservation Authorities and the Ministry of Natural Resources and Forestry to implement the protocol with the goal of providing standard datasets to support science development and monitoring of headwater drainage features. An HDF is a depression in the land that conveys surface flow. Additionally, this module provides a means of characterizing the connectivity, form and unique features associated with each HDF (OSAP Protocol, 2013). In 2017 the program sampled 19 sites at road crossings in the Glen Tay catchment area (Figure 42).
Figure 42 Location of the headwater sampling sites in the Glen Tay catchment
3.4.2 Headwater Feature Type
The headwater sampling protocol assesses the feature type in order to understand the function of each feature. The evaluation includes the following classifications: defined natural channel, channelized or constrained, multi-thread, no defined feature, tiled, wetland, swale, roadside ditch and pond outlet. By assessing the values associated with the headwater drainage features in the catchment area we can understand the ecosystem services that they provide to the watershed in the form of hydrology, sediment transport, and aquatic and terrestrial functions. The headwater drainage features in the Glen Tay catchment are highly variable. Figure 43 shows the feature type of the primary feature at the sampling locations.
Figure 43 Headwater feature types in the Glen Tay catchment
3.4.3 Headwater Feature Flow
The observed flow condition within headwater drainage features can be highly variable depending on timing relative to the spring freshet, recent rainfall, soil moisture, etc. Flow conditions are assessed in the spring and in the summer to determine if features are perennial and flow year round, if they are intermittent and dry up during the summer months or if they are ephemeral systems that do not flow regularly and generally respond to specific rainstorm events or snowmelt. Flow conditions in headwater systems can change from year to year depending on local precipitation patterns. Figure 44 shows the observed flow condition at the sampling locations in the Glen Tay catchment.
Figure 44 Headwater feature flow conditions in the Glen Tay catchment
A spring photo of the headwater sample site in the Glen Tay catchment located on Christie Lake Road
A summer photo of the headwater sample site in the Glen Tay catchment located on Christie Lake Road
3.4.4 Feature Channel Modifications
Channel modifications were assessed at each headwater drainage feature sampling location. Modifications include channelization, dredging, hardening and realignments. The Glen Tay catchment area had a majority of features with no channel modifications observed, five sites as having been historically dredged/channelized and two locations had mixed modifications. Figure 45 shows the channel modifications observed at the sampling locations for the Glen Tay catchment.
Figure 45 Headwater feature channel modifications in the Glen Tay catchment
3.4.5 Headwater Feature Vegetation
Headwater feature vegetation evaluates the type of vegetation that is found within the drainage feature. The type of vegetated within the channel influences the aquatic and terrestrial ecosystem values that the feature provides. For some types of headwater features the vegetation within the feature plays a very important role in flow and sediment movement and provides wildlife habitat. The following classifications are evaluated no vegetation, lawn, wetland, meadow, scrubland and forest. Figure 46 depicts the dominant vegetation observed at the sampled headwater sites in the Glen Tay catchment.
Figure 46 Headwater feature vegetation types in the Glen Tay catchment
3.4.6 Headwater Feature Riparian Vegetation
Headwater riparian vegetation evaluates the type of vegetation that is found along the adjacent lands of a headwater drainage feature. The type of vegetation within the riparian corridor influences the aquatic and terrestrial ecosystem values that the feature provides to the watershed. Figure 47 depicts the type of riparian vegetation observed at the sampled headwater sites in the Glen Tay catchment.
Figure 47 Headwater feature riparian vegetation types in the Glen Tay catchment
3.4.7 Headwater Feature Sediment Deposition
Assessing the amount of recent sediment deposited in a channel provides an index of the degree to which the feature could be transporting sediment to downstream reaches (OSAP, 2013). Evidence of excessive sediment deposition might indicate the requirement to follow up with more detailed targeted assessments upstream of the site location to identify potential best management practices to be implemented. Sediment deposition ranged from none to substantial for the headwater sites sampled in the Glen Tay catchment area. Figure 48 depicts the degree of sediment deposition observed at the sampled headwater sites in the Glen Tay catchment.
Figure 48 Headwater feature sediment deposition in the Glen Tay catchment
3.4.8 Headwater Feature Upstream Roughness
Feature roughness will provide a measure of the amount of materials within the bankfull channel that could slow down the velocity of water flowing within the headwater feature (OSAP, 2013). Materials on the channel bottom that provide roughness include vegetation, woody Structure and boulders/cobble substrates. Roughness can provide benefits in mitigating downstream erosion on the headwater drainage feature and the receiving watercourse by reducing velocities. Roughness also provides important habitat conditions for aquatic organisms. Figure 49 shows the feature roughness conditions at the sampling locations in the Glen Tay catchment were highly variable ranging from minimal to extreme.
Figure 49 Headwater feature roughness in the Glen Tay catchment
Land cover and any change in coverage that has occurred over a six year period is summarized for the Glen Tay catchment using spatially continuous vector data representing the catchment during the spring of 2008 and 2014. This dataset was developed by the RVCA through heads-up digitization of 20cm DRAPE ortho-imagery at a 1:4000 scale and details the surrounding landscape using 10 land cover classes.
4.1 Glen Tay Catchment Land Cover/Change
As shown in Table 7 and Figure 1, the dominant land cover type in 2014 is woodland.
Table 7 Land cover in the Glen Tay catchment (2008 vs. 2014)
Land Cover
2008
2014
Change - 2008 to 2014
Area
Area
Area
Ha
Percent
Ha
Percent
Ha
Percent
Woodland*
2541
46
2524
45
-17
-1
Crop and Pasture
1531
27
1536
28
5
1
Wetland**
837
15
844
15
7
>Evaluated
(4)
(<1)
(4)
(<1)
(0)
(0)
>Unevaluated
(833)
(15)
(840)
(15)
(7)
(0)
Settlement
224
4
229
4
5
Meadow-Thicket
170
3
169
3
-1
Water
150
3
150
3
Transportation
117
2
118
2
1
* Does not include treed swamps ** Includes treed swamps
From 2008 to 2014, there was an overall change of 26 hectares (from one land cover class to another). Most of the change in the Glen Tay catchment is a result of the conversion of woodland to crop and pastureland along with crop and pastureland being transformed into settlement and reverting to woodland (Figure 50).
Figure 50 Land cover change in the Glen Tay catchment (2014)
Table 8 provides a detailed breakdown of all land cover change that has taken place in the Glen Tay catchment between 2008 and 2014.
Table 8 Land cover change in the Glen Tay catchment (2008 to 2014)
Land Cover
Change - 2008 to 2014
Area
Ha.
Percent
Woodland to Crop and Pasture
13
49.6
Crop and Pasture to Settlement
4.1
15.6
Crop and Pasture to Woodland
3.2
12.3
Woodland to Unevaluated Wetland
3.1
11.9
Woodland to Settlement
1
3.8
Crop and Pasture to Transportation
0.6
2.5
Meadow-Thicket to Unevaluated Wetland
0.5
2
Woodland to Transportation
0.5
1.9
Meadow-Thicket to Settlement
0.3
<0.1
4.2 Woodland Cover
In the Environment Canada Guideline (Third Edition) entitled “How Much Habitat Is Enough?” (hereafter referred to as the “Guideline”) the opening narrative under the Forest Habitat Guidelines section states that prior to European settlement, forest was the predominant habitat in the Mixedwood Plains ecozone. The remnants of this once vast forest now exist in a fragmented state in many areas (including the Rideau Valley watershed) with woodland patches of various sizes distributed across the settled landscape along with higher levels of forest cover associated with features such as the Frontenac Axis (within the on-Shield areas of the Rideau Lakes and Tay River subwatersheds). The forest legacy, in terms of the many types of wildlife species found, overall species richness, ecological functions provided and ecosystem complexity is still evident in the patches and regional forest matrices (found in the Tay River subwatershed and elsewhere in the Rideau Valley watershed). These ecological features are in addition to other influences which forests have on water quality and stream hydrology including reducing soil erosion, producing oxygen, storing carbon along with many other ecological services that are essential not only for wildlife but for human well-being.
The Guideline also notes that forests provide a great many habitat niches that are in turn occupied by a great diversity of plant and animal species. They provide food, water and shelter for these species - whether they are breeding and resident locally or using forest cover to help them move across the landscape. This diversity of species includes many that are considered to be species at risk. Furthermore, from a wildlife perspective, there is increasing evidence that the total forest cover in a given area is a major predictor of the persistence and size of bird populations, and it is possible or perhaps likely that this pattern extends to other flora and fauna groups. The overall effect of a decrease in forest cover on birds in fragmented landscapes is that certain species disappear and many of the remaining ones become rare, or fail to reproduce, while species adapted to more open and successional habitats, as well as those that are more tolerant to human-induced disturbances in general, are able to persist and in some cases thrive. Species with specialized-habitat requirements are most likely to be adversely affected. The overall pattern of distribution of forest cover, the shape, area and juxtaposition of remaining forest patches and the quality of forest cover also play major roles in determining how valuable forests will be to wildlife and people alike.
The current science generally supports minimum forest habitat requirements between 30 and 50 percent, with some limited evidence that the upper limit may be even higher, depending on the organism/species phenomenon under investigation or land-use/resource management planning regime being considered/used.
As shown in Figure 51, 46 percent of the Glen Tay catchment contains 2524 hectares of upland forest and 43 hectares of lowland forest (treed swamps) versus the 47 percent of woodland cover in the Tay River subwatershed. This is greater than the 30 percent of forest cover that is identified as the minimum threshold required to sustain forest birds according to the Guideline and which may only support less than one half of potential species richness and marginally healthy aquatic systems. When forest cover drops below 30 percent, forest birds tend to disappear as breeders across the landscape.
Figure 51 Woodland cover and forest interior in the Glen Tay catchment (2014)
4.2.1 Woodland (Patch) Size
According to the Ministry of Natural Resources’ Natural Heritage Reference Manual (Second Edition), larger woodlands are more likely to contain a greater diversity of plant and animal species and communities than smaller woodlands and have a greater relative importance for mobile animal species such as forest birds.
Bigger forests often provide a different type of habitat. Many forest birds breed far more successfully in larger forests than they do in smaller woodlots and some rely heavily on forest interior conditions. Populations are often healthier in regions with more forest cover and where forest fragments are grouped closely together or connected by corridors of natural habitat. Small forests support small numbers of wildlife. Some species are “area-sensitive” and tend not to inhabit small woodlands, regardless of forest interior conditions. Fragmented habitat also isolates local populations, especially small mammals, amphibians and reptiles with limited mobility. This reduces the healthy mixing of genetic traits that helps populations survive over the long run (Conserving the Forest Interior. Ontario Extension Notes, 2000).
The Environment Canada Guideline also notes that for forest plants that do not disperse broadly or quickly, preservation of some relatively undisturbed large forest patches is needed to sustain them because of their restricted dispersal abilities and specialized habitat requirements and to ensure continued seed or propagation sources for restored or regenerating areas nearby.
The Natural Heritage Reference Manual continues by stating that a larger size also allows woodlands to support more resilient nutrient cycles and food webs and to be big enough to permit different and important successional stages to co-exist. Small, isolated woodlands are more susceptible to the effects of blowdown, drought, disease, insect infestations, and invasions by predators and non-indigenous plants. It is also known that the viability of woodland wildlife depends not only on the characteristics of the woodland in which they reside, but also on the characteristics of the surrounding landscape where the woodland is situated. Additionally, the percentage of forest cover in the surrounding landscape, the presence of ecological barriers such as roads, the ability of various species to cross the matrix surrounding the woodland and the proximity of adjacent habitats interact with woodland size in influencing the species assemblage within a woodland.
In the Glen Tay catchment (in 2014), one hundred and fifty-one (57 percent) of the 265 woodland patches are very small, being less than one hectare in size. Another 94 (35 percent) of the woodland patches ranging from one to less than 20 hectares in size tend to be dominated by edge-tolerant bird species. The remaining 20 (eight percent of) woodland patches range between 21 and 1083 hectares in size. Seventeen of these patches contain woodland between 20 and 100 hectares and may support a few area-sensitive species and some edge intolerant species, but will be dominated by edge tolerant species.
Conversely, three (one percent) of the 265 woodland patches in the drainage area exceed the 100 plus hectare size needed to support most forest dependent, area sensitive birds and are large enough to support approximately 60 percent of edge-intolerant species. One patch top 200 hectares, which according to the Environment Canada Guideline will support 80 percent of edge-intolerant forest bird species (including most area sensitive species) that prefer interior forest habitat conditions.
Table 9 presents a comparison of woodland patch size in 2008 and 2014 along with any changes that have occurred over that time. A decrease (of 14 hectares) has been observed in the overall woodland patch area between the two reporting periods with most change occurring in the 50 to 100 woodland patch size class range. This loss of forest cover has increased the number of woodland patches in the catchment and led to further fragmentation of the forest over the six year period.
Table 9 Woodland patches in the Glen Tay catchment (2008 and 2014)
Woodland Patch Size Range (ha)
Woodland* Patches
Patch Change
2008
2014
2008 to 2014
Number
Area
Number
Area
Number
Area
Count
%
Ha
%
Count
%
Ha
%
Count
Ha
Less than 1
144
56
56
2
151
57
58
2
7
2
1 to 20
93
36
381
15
94
35
397
16
1
16
20 to 50
10
4
281
11
10
4
283
11
2
50 to 100
7
3
468
18
7
3
438
17
-30
100 to 200
2
1
313
12
2
1
309
12
-4
Greater than 200
1
<1
1083
42
1
<1
1083
42
Totals
257
100
2582
100
265
100
2568
100
8
-14
*Includes treed swamps
4.2.2 Woodland (Forest) Interior Habitat
The forest interior is habitat deep within woodlands. It is a sheltered, secluded environment away from the influence of forest edges and open habitats. Some people call it the “core” or the “heart” of a woodland. The presence of forest interior is a good sign of woodland health, and is directly related to the woodland’s size and shape. Large woodlands with round or square outlines have the greatest amount of forest interior. Small, narrow woodlands may have no forest interior conditions at all. Forest interior habitat is a remnant natural environment, reminiscent of the extensive, continuous forests of the past. This increasingly rare forest habitat is now a refuge for certain forest-dependent wildlife; they simply must have it to survive and thrive in a fragmented forest landscape (Conserving the Forest Interior. Ontario Extension Notes, 2000).
The Natural Heritage Reference Manual states that woodland interior habitat is usually defined as habitat more than 100 metres from the edge of the woodland and provides for relative seclusion from outside influences along with a moister, more sheltered and productive forest habitat for certain area sensitive species. Woodlands with interior habitat have centres that are more clearly buffered against the edge effects of agricultural activities or more harmful urban activities than those without.
In the Glen Tay catchment (in 2014), the 265 woodland patches contain 24 forest interior patches (Figure 51) that occupy four percent (239 ha.) of the catchment land area (which is less than the five percent of interior forest in the Tay River subwatershed). This is below the ten percent figure referred to in the Environment Canada Guideline that is considered to be the minimum threshold for supporting edge intolerant bird species and other forest dwelling species in the landscape.
Most patches (19) have less than 10 hectares of interior forest, five of which have small areas of interior forest habitat less than one hectare in size. The remaining five patches contain interior forest between 14 and 95 hectares in area. Between 2008 and 2014, the area of interior forest habitat in the catchment has decreased by nine hectares (Table 10).
Table 10 Woodland interior in the Glen Tay catchment (2008 and 2014)
Woodland Interior Habitat Size Range (ha)
Woodland Interior
Interior Change
2008
2014
2008 to 2014
Number
Area
Number
Area
Number
Area
Count
Percent
Ha
Percent
Count
Percent
Ha
Percent
Count
Ha
Less than 1
4
18
1
<1
5
21
1
1
1
1 to 10
13
56
42
17
14
58
48
20
1
6
10 to 30
4
18
74
30
3
13
59
24
-1
-15
30 to 50
1
4
36
15
1
4
36
15
50 to 100
1
4
95
38
1
4
95
40
Totals
23
100
248
100
24
100
239
100
1
-9
4.3 Wetland Cover
Wetlands are habitats forming the interface between aquatic and terrestrial systems. They are among the most productive and biologically diverse habitats on the planet. By the 1980s, according to the Natural Heritage Reference Manual, 68 percent of the original wetlands south of the Precambrian Shield in Ontario had been lost through encroachment, land clearance, drainage and filling.
Wetlands perform a number of important ecological and hydrological functions and provide an array of social and economic benefits that society values. Maintaining wetland cover in a watershed provides many ecological, economic, hydrological and social benefits that are listed in the Reference Manual and which may include:
contributing to the stabilization of shorelines and to the reduction of erosion damage through the mitigation of water flow and soil binding by plant roots
mitigating surface water flow by storing water during periods of peak flow (such as spring snowmelt and heavy rainfall events) and releasing water during periods of low flow (this mitigation of water flow also contributes to a reduction of flood damage)
contributing to an improved water quality through the trapping of sediments, the removal and/or retention of excess nutrients, the immobilization and/or degradation of contaminants and the removal of bacteria
providing renewable harvesting of timber, fuel wood, fish, wildlife and wild rice
contributing to a stable, long-term water supply in areas of groundwater recharge and discharge
providing a high diversity of habitats that support a wide variety of plants and animals
acting as “carbon sinks” making a significant contribution to carbon storage
providing opportunities for recreation, education, research and tourism
Historically, the overall wetland coverage within the Great Lakes basin exceeded 10 percent, but there was significant variability among watersheds and jurisdictions, as stated in the Environment Canada Guideline. In the Rideau Valley Watershed, it has been estimated that pre-settlement wetland cover averaged 35 percent using information provided by Ducks Unlimited Canada (2010) versus the 21 percent of wetland cover existing in 2014 derived from DRAPE imagery analysis.
Figure 52 Wetland cover in the Glen Tay catchment (2014)
This decline in wetland cover is also evident in the Glen Tay catchment (as seen in Figure 52 and summarized in Table 11), where wetland was reported to cover 30 percent of the area prior to settlement, as compared to 15 percent in 2014. This represents a 49 percent loss of historic wetland cover. To maintain critical hydrological, ecological functions along with related recreational and economic benefits provided by these wetland habitats in the catchment, a “no net loss” of currently existing wetlands should be employed to ensure the continued provision of tangible benefits accruing from them to landowners and surrounding communities.
Table 11 Wetland cover in the Glen Tay catchment (Historic to 2014)
Wetland Cover
Pre-settlement
2008
2014
Change - Historic to 2014
Area
Area
Area
Area
Ha
Percent
Ha
Percent
Ha
Percent
Ha
Percent
Glen Tay
1646
30
838
15
844
15
-802
-49
Tay River
n/a
n/a
15280
19
15330
19
n/a
n/a
Rideau Valley
134115
35
n/a
n/a
82076
21
-52039
-39
4.4 Shoreline Cover
The riparian or shoreline zone is that special area where the land meets the water. Well-vegetated shorelines are critically important in protecting water quality and creating healthy aquatic habitats, lakes and rivers. Natural shorelines intercept sediments and contaminants that could impact water quality conditions and harm fish habitat in streams. Well established buffers protect the banks against erosion, improve habitat for fish by shading and cooling the water and provide protection for birds and other wildlife that feed and rear young near water. A recommended target (from the Environment Canada Guideline) is to maintain a minimum 30 metre wide vegetated buffer along at least 75 percent of the length of both sides of rivers, creeks and streams.
Figure 53 shows the extent of the ‘Natural’ vegetated riparian zone (predominantly wetland/woodland features) and ‘Other’ anthropogenic cover (crop/pastureland, roads/railways, settlements) along a 30-metre-wide area of land, both sides of the shoreline of the Tay River and its tributaries in the Glen Tay catchment.
Figure 53 Natural and other riparian land cover in the Glen Tay catchment (2014)
This analysis shows that the riparian zone in the Glen Tay catchment is composed of woodland (41 percent), wetland (37 percent), crop and pastureland (16 percent), settlement (two percent), meadow-thicket (two percent) and transportation routes (two percent). Along the many watercourses (including headwater streams) flowing into the Tay River, the riparian buffer is composed of wetland (40 percent), woodland (36 percent), crop and pastureland (19 percent), meadow-thicket (two percent), transportation routes (two percent) and settlement areas (one percent). Along the Tay River itself, the riparian zone is composed of woodland (49 percent), wetland (34 percent), settlement (nine percent), crop and pastureland (four percent), transportation routes (three percent) and meadow-thicket (one percent).
Additional statistics for the Glen Tay catchment are presented in Tables 12, 13 and 14 and show that there has been very little change in shoreline cover from 2008 to 2014.
Table 12 Riparian land cover in the Glen Tay catchment (2008 vs. 2014)
Riparian Land Cover
2008
2014
Change - 2008 to 2014
Area
Area
Area
Ha.
Percent
Ha.
Percent
Ha.
Percent
Woodland
342.97
40.69
341.81
40.55
-1.16
-0.14
Wetland
312.68
37.09
313.17
37.15
0.49
0.06
> Unevaluated
(310.62)
(36.85)
(311.11)
(36.91)
(0.49)
(0.06)
> Evaluated
(2.06)
(0.24)
(2.06)
(0.24)
(0.00)
(0.00)
Crop & Pasture
133.45
15.83
134.12
15.91
0.67
0.08
Settlement
21.32
2.53
21.32
2.53
0.00
0.00
Meadow-Thicket
17.35
2.06
17.35
2.06
0.00
0.00
Transportation
15.15
1.80
15.15
1.80
0.00
0.00
Table 13 Riparian land cover along the Tay River in the Glen Tay catchment (2008 vs. 2014)
Riparian Land Cover
2008.00
2014.00
Change - 2008 to 2014
Area
Area
Area
Ha.
Percent
Ha.
Percent
Ha.
Percent
Woodland
60.61
49.60
60.34
49.39
0.00
0.00
Wetland
41.71
34.15
42.00
34.00
0.00
0.00
> Unevaluated
(40.09)
(32.82)
(40.34)
(33.02)
(0.00)
(0.00)
> Evaluated
(1.62)
(1.33)
(1.62)
(1.33)
(0.00)
(0.00)
Settlement
11.01
9.01
11.01
9.01
0.00
0.00
Crop & Pasture
5.04
4.13
5.06
4.14
0.00
0.00
Transportation
3.03
2.48
3.03
2.48
0.00
0.00
Meadow-Thicket
0.76
0.63
0.76
0.63
0.00
0.00
Table 14 Riparian land cover along streams in the Glen Tay catchment (2008 vs. 2014)
5.0 Glen Tay Catchment: Stewardship and Water Resources Protection
The RVCA and its partners are working to protect and enhance environmental conditions in the Tay River Watershed. Figure 54 shows the location of all stewardship projects completed in the Glen Tay catchment.
Figure 54 Stewardship site locations in the Glen Tay catchment
5.1 Rural Clean Water
The Rural Clean Water Program provides technical and financial assistance to farmers and other rural landowners, to aid in the implementation of projects that protect water quality. Funding is granted to those projects that support best management practices for application in the protection and improvement of surface and ground water resources. The program also supports climate change adaptation and low impact development projects as well as educating rural landowners about environmental stewardship of private property. Examples of supported projects include livestock exclusion fencing, controlled tile drainage, cover crops, erosion control, well related projects, and many more. For a list of eligible projects and to apply for funding, see Rural Clean Water.
In the Glen Tay catchment from 2011 to 2016, two septic system repairs, one well decommissioning, one well upgrade, one well replacement and one leachate seepage control were completed; prior to this, nine septic system repairs, six well upgrades, four livestock fencing projects and two education initiatives had been completed. When combined, these projects are keeping 46.65 kilograms of Phosphorus out of our lakes, rivers and streams every year. Total value of all 27 projects is $137,761 with $44,442 of that amount funded through grant dollars from the RVCA.
5.2 Private Land Forestry
Forest cover and tree planting continues to be one of the most widely supported strategies to improve our environment. The many benefits of forest cover include carbon sequestration, flood mitigation and water quality improvement as well as providing wildlife habitat.
Through the RVCA's Trees for Tomorrow Program (and its predecessors), 5,800 trees were planted at one site from 2011 to 2016; prior to this, 33,850 trees were planted at six sites. In total, 39,650 trees have been planted resulting in the reforestation of 21 hectares. Total value of all seven projects in the Glen Tay catchment is $79,190 with $56,847 of that amount coming from fundraising sources. For more information about the Program and landowner eligibility, please see the following: Tree Planting in the Rideau Valley Watershed and Trees for Tomorrow.
An additional 65 butternut trees were planted through the RVCA Butternut Recovery Program as part of efforts to introduce healthy seedlings from tolerant butternuts into various locations across Eastern Ontario.
5.3 Shoreline Naturalization
Natural shoreline buffers rich in native plants are critically important to protecting the health of our lakes, rivers and streams. Shoreline vegetation protects water quality and aquatic habitat by intercepting potentially harmful contaminants such as nutrients, pollutants and sediment, regulating water temperatures, slowing runoff and providing important fish and wildlife habitat. Natural shorelines also help improve climate change resiliency by increasing flood storage and providing protection from erosion during extreme weather events.
As of the end of 2016, no shoreline projects had been carried out in the Glen Tay catchment. Landowners may wish to take advantage of the RVCA's Shoreline Naturalization Program to assist them with the naturalization of their shorelines to see the benefits noted above (and more).
5.4 Septic System Re-inspection
Septic system re-inspection is provided by the RVCA through the Mississippi Rideau Septic System Office at the request of Tay Valley Township. From 2004 to 2017, the service has performed 58 voluntary septic system re-inspections on 59 properties along the Tay River in the Glen Tay catchment .
Remedial/maintenance work (i.e. pump outs and baffle replacements that generally do not require a permit) was advocated for five of the septic systems inspected along with one septic system replacement. More information was requested by another landowner about ways to maintain and improve the operation of their septic system.
5.5 Ontario Drinking Water Stewardship Projects
Figure 54 shows the location of the Ontario Drinking Water Stewardship Program projects in the Glen Tay catchment. This Ministry of the Environment funded program has supported three projects between 2011 and 2016. Total project value is $70,751 with landowners receiving $35,362 in funding for three livestock fencing projects.
5.6 Valley, Stream, Wetland and Hazard Lands
The Glen Tay catchment covers 55.7 square kilometres with 5.4 square kilometres (or 9.7 percent) of the drainage area being within the regulation limit of Ontario Regulation 174/06 (Figure 55), giving protection to wetland areas and river or stream valleys that are affected by flooding and erosion hazards.
Wetlands occupy 8.4 square kilometres (or 15 percent) of the catchment. All are unevaluated/unregulated and not included within the RVCA regulation limit, except for a small 4 hectare area of the Grants Creek Provincially Significant Wetland.
Of the 137.5 kilometres of stream in the catchment, regulation limit mapping has been plotted along 34.5 kilometers of streams (representing 25 percent of all streams in the catchment). Plotting of the regulation limit on the remaining 103 kilometres (or 75 percent) of streams requires identification of flood and erosion hazards and valley systems.
Within those areas of the Glen Tay catchment subject to the regulation (limit), efforts (have been made and) continue through RVCA planning and regulations input and review to manage the impact of development (and other land management practices) in areas where “natural hazards” are associated with rivers, streams, valley lands and wetlands. For areas beyond the regulation limit, protection of the catchment’s watercourses is only provided through the “alteration to waterways” provision of the regulation.
Figure 55 Regulated natural features/hazards and Intake Protection Zones in the Glen Tay catchment
5.7 Vulnerable Drinking Water Areas
The Town of Perth’s municipal drinking water Intake Protection Zone (IPZ), specifically IPZ-2 with a vulnerability score of 8 and 9 is found within the Glen Tay catchment (Figure 55). As per the Mississippi-Rideau Source Protection Plan, policies may affect future development within these areas. Under Section 59 of the Clean Water Act, 2006, future applications under the Building Code and the Planning Act may be screened by the Mississippi-Rideau Risk Management Office. Depending on the proposed activity, additional requirements or restrictions may apply. For more information, please contact the Mississippi-Rideau Risk Management Office at (613) 692-3571.
In addition, the Mississippi-Rideau Source Protection Plan has mapped the northern part of the Glen Tay catchment as within a Significant Groundwater Recharge Area and identified all of the catchment as a Highly Vulnerable Aquifer. This means that the nature of the overburden (thin soils, fractured bedrock) does not provide a high level of protection for the underlying groundwater making the aquifer more vulnerable to contaminants released on the surface. Highly Vulnerable Aquifers characterise 89% of the Region and are considered moderate to low drinking water threats with certain policies that apply; mainly policies regarding waste disposal. All property owners are encouraged to use best management practices to protect sources of municipal drinking water. For more information on source protection best management practices, please visit Protecting Your Drinking Water.
Achievements noted by the Friends of the Tay Watershed Association (FoTW) are indicated by an asterisk.
In-stream/Fish Habitat
17.9 kilometres of the Tay River in the catchment have been surveyed and 19 headwaters sites are sampled once every six years by the RVCA using the Ontario Stream Assessment Protocol.
The report "Fish Habitat of the Tay River Watershed: Existing Conditions and Opportunities for Enhancement" was prepared in 2002 by MNR, RVCA, Parks Canada and DFO. A number of specific fish habitat enhancement projects are identified in the report to improve the fishery along the Tay River (see pp. 79-92).
Septic Inspections
58 voluntary septic system re-inspections have been conducted by the Mississippi Rideau Septic System Office on 59 properties in the Glen Tay catchment, as a service provided to Tay Valley Township since 2004.
Tree Planting
39,650 trees have been planted at seven sites in the Glen Tay catchment by the RVCA Private Land Forestry Program, resulting in the reforestation of 21 hectares.
Water Quality
Three stream monitoring sites in the Glen Tay catchment - two on the Tay River; one on the Scotts Snye - are sampled yearly by the RVCA for 22 parameters at each location, six times a year, to assess surface chemistry water quality conditions.
One Ontario Benthic Biomonitoring Network site on the Tay River in the Glen Tay catchment is sampled by the RVCA in the spring and fall of each year with three replicates, to assess instream biological water quality conditions.
Twenty-seven Clean Water projects were completed by the RVCA Rural Clean Water Program.
Water Taking
OMYA corporation reports annually to the public on its water-taking over the past 12 months - a condition of their Permit to Take Water (PTTW) for the withdrawal of water from the Tay River and company-owned wells. The taking of water began in accordance with the conditions outlined in the PTTW (and other permits) obtained in September 2003. At the first public meeting held to fulfil a condition of the water taking permit - to hold one public meeting in a calendar year to present a report on the company's water taking - there was great interest in the results presented by OMYA. Subsequent meetings have kept the community well-informed about its activities and adherence to the permit conditions, thus helping to alleviate public concerns about the water taking.
The Friends of the Tay Watershed Association help promote OMYA's report to the public about its water taking activities over the previous year.*
OMYA has installed a state-of-the-art digital water meter on the Tay River (one of the PTTW conditions). The data collected provides valuable information regarding Tay River water flows and facilitates future environmental and scientific study of the river.
Waterway Planning and Management
The Tay Watershed Management Plan (2002) brought together a diverse group of watershed stakeholders to exchange information and opinions on the challenges facing the watershed. This forum focused the community on the need for managing the Tay Watershed, requiring positive cooperation amongst a range of stakeholders and helped develop a foundation of data and information on the watershed and resources against which later developments and trends are being measured and decisions are being made.
The Plan also led to the formation of the Friends of the Tay Watershed Association, who have been instrumental in implementing 20 of 24 management plan recommendations. In the opinion of the Association, one of the most significant measures of success for the water protection activities carried out in the Tay watershed is that there has never been a serious environmental pollution incident that threatened the area’s drinking water or its recreational waterbodies. To this day, the Friends of the Tay Watershed remain committed to preserving and enhancing the health of the Tay River watershed through their work.*
More pressure for rural estate lot subdivision development in the catchment is likely due to the proximity of the catchment to the Town of Perth.
Headwaters/In-stream Habitat/Shorelines
Although headwater and tributary streams in the catchment have more than 75 percent naturally vegetated shoreline cover, the distribution of naturally vegetated shorelines is uneven (see Section 4.4 of this report).
Eleven of 19 sampled headwater stream sites have been modified (seven are channelized; four are ditched; see Section 3.4.2 of this report).
Land Cover
Land cover has changed across the catchment (2008 to 2014) largely as a result of an increase in the area of wetland (7 ha.), settlement (5 ha.) and crop and pastureland (5 ha.) and loss of woodland (17 ha.)(see Section 4.1 of this report).
Wetlands have declined by forty-nine percent since European pre-settlement and now cover 15 percent (844 ha.) of the catchment (in 2014). Ninety-nine percent (840 ha.) of these wetlands remain unevaluated/unregulated and are vulnerable to drainage and land clearing activities in the absence of any regulatory and planning controls that would otherwise protect them for the many important hydrological, social, biological and ecological functions/services/values they provide to landowners and the surrounding community (see Section 4.3 of this report).
Water Quality
Surface chemistry water quality rating along the Tay River in the Glen Tay catchment is Good at the Glen Tay Road, Very Good at the Noonan Side Road and Good at the Upper Scotch Line Road along the Scotts Snye, a tributary of the Tay River. No apparent water quality concerns are reported for this reach of the Tay River (see Section 2.1 of this report).
Instream biological water quality condition in the Tay River is Excellent at the Bowes Side Road. Samples are dominated with benthic invertebrate species that are sensitive to high organic pollution levels, indicating that the water is unimpaired (see Section 3.3.1 of this report).
Five (of 58) Tay Valley Township voluntary septic system re-inspections conducted from 2004 to 2017 in the Glen Tay catchment revealed the need for additional maintenance/remedial work to be performed. Another inspection identified the need to replace the existing septic system. More information was supplied to one other landowner with septic system issues. Those properties with concerns are identified in the yearly report submitted by the Mississippi Rideau Septic System Office to the Township.
Educate waterfront property owners about fish habitat requirements, spawning timing and near-shore and in-water activities that can disturb or destroy fish habitat and spawning sites.
Work with various partners, including landowners, Friends of the Tay Watershed Association and Rideau Lakes and Tay Valley Townships on fish habitat enhancement projects in the Tay River watershed, building off of new knowledge and the recommendations as described in the report "Fish Habitat of the Tay River Watershed: Existing Conditions and Opportunities for Enhancement" (2002) prepared by MNR, RVCA, Parks Canada, and DFO.
Remove equipment, garbage and debris from past milling operations that remain along the shoreline and on the bed of the Tay River at the site of the old Bowes Mill dam.
Development
Work with approval authorities (Lanark County, Leeds Grenville and Lanark District Health Unit, Mississippi Rideau Septic System Office, Rideau Lakes Township, RVCA and Tay Valley Townships) and landowners to consistently implement current land use planning and development policies for water quality and shoreline protection adjacent to the Tay River and headwater streams in the catchment (i.e., a minimum 30 metre development setback from water).
Explore ways and means to more effectively implement and enforce conditions of land-use planning and development approval to achieve net environmental gains (particularly with respect to rehabilitating or protecting naturally vegetated shorelines and water quality).
Encourage Committees of Adjustment to take advantage of technical and environmental information and recommendations forthcoming from planning and environmental professionals.
Ongoing education and dialogue regarding the regulatory floodplain, its implementation and the effect it has on development continues to represent an opportunity to assist the public in understanding the importance of planning, which respects this natural hazard.
Municipalities in the Tay Watershed are encouraged to strengthen natural heritage and water resources official plan policies and zoning provisions (pertaining to water setbacks, frontage and naturalized shorelines and wetland protection) where deemed appropriate.
Work with Rideau Lakes and Tay Valley Townships and agencies to ensure that development approvals along watercourses take into consideration the protection of fish habitat (including the near-shore nursery and spawning habitat).
Utilise RVCA subwatershed and catchment reports to help develop, revise and implement official plan policies to protect surface water resources and the natural environment (including woodlands, wetlands and shoreline cover).
Land Cover
Establish RVCA regulation limits around the 100 percent (840 ha.) of wetlands in the catchment that are unevaluated. Doing this will help protect landowners from natural hazards including mitigating surface water flow by storing water during periods of peak flow (such as spring snowmelt and heavy rainfall events) and releasing water during periods of low flow (this mitigation of water flow reduces flood damage), as well as contributing to the stabilization of shorelines and to the reduction of soil erosion damage through water flow mitigation and plant soil binding/retention.
Shorelines
Take advantage of the RVCA Shoreline Naturalization Program to re-naturalize altered creek and stream shoreline identified in this report as “Unnatural Riparian Land Cover". Target shoreline restoration at sites on the Tay River and along its tributaries, shown in orange on the Riparian Land Cover map (see Figure 53 in Section 4.4 of this report). Other stewardship opportunities in the catchment may be determined based on septic system inspections and surface water quality monitoring results.
Promote the use of bioengineering methods (using native shrub/tree planting, fascines, live stakes) as a shoreline erosion mitigation measure as well as a cost effective alternative to shoreline hardening (with rip rap, armour stone, gabion baskets, walls).
Educate landowners about the value and importance of natural shorelines and property best management practices with respect to shoreline use and development, septic system installation and maintenance and shoreline vegetation retention and enhancement (Lanark County, Leeds Grenville and Lanark District Health Unit, Mississippi Rideau Septic System Office, Rideau Lakes Township, RVCA and Tay Valley Township).
Water Quality
Consider further investigation of the Fairinstream biological water quality rating on the Tay River in the catchment as part of a review of RVCA's Baseline and Benthic Invertebrate surface water quality monitoring.
Offer funding provided by the RVCA Rural Clean Water Program to landowners with potential projects that could improve water quality on the Tay River and its tributaries (e.g., livestock fencing, septic system repair/replacement and streambank erosion control/stabilisation). Concentrate efforts at septic systems requiring remedial work or replacement, including the six identified as needing additional maintenance/remedial/replacement work since 2004.
Educate waterfront property owners about septic system care by providing information about sewage system maintenance (i.e., when to pump out septic systems and holding talks) through initiatives such as the Septic Savvy Workshop and services provided by the Mississippi Rideau Septic System Office.
Reduce pollutant loading to the Tay River in the catchment through education about the application of shoreline, stormwater and agricultural best management practices; also consider using low impact development (LID) methods to improve the quality and reduce the amount of stormwater runoff directly reaching the river ecosystem. This will be particularly beneficial in areas with extensive impervious surfaces (i.e., asphalt, concrete, buildings, and severely compacted soils) or on sensitive shoreline properties (with steep slopes/banks, shallow/impermeable soils).
Water Levels
The Friends of the Tay Watershed Association has developed the Tay Net (Tay Waterway Communication Network) over the past two years to provide early notice of significant changes in water level along the Tay River. Tay Net is now developing it into a ‘Riverwatch’ program for the waterway.
The RVCA produces individual reports for 14 catchments in the Tay River subwatershed. Using data collected and analyzed by the RVCA through its watershed monitoring and land cover classification programs, surface water quality and in-stream conditions are reported for the Tay River, Tay Watershed lakes and Tay tributaries along with a summary of environmental conditions for the surrounding countryside every six years, which includes analysis of data collected through the programs along with local information provided by stakeholders up to 2017.
This information is used to better understand the effects of human activity on our water resources, allows us to better track environmental change over time and helps focus watershed management actions where they are needed the most to help sustain the ecosystem services (cultural, aesthetic and recreational values; provisioning of food, fuel and clean water; regulation of erosion/natural hazard protection and water purification; supporting nutrient/water cycling and habitat provision) provided by the catchment’s lands and forests and waters (Millennium Ecosystem Assessment 2005).
The following sections of this report are a compilation of that work for the Port Elmsley catchment.
50.9 square kilometres; occupies 6.4 percent of the Tay River subwatershed; 1.2 percent of the Rideau Valley watershed.
Geology/Physiography
The Port Elmsley catchment resides predominantly within part of the physiographic region known as the Smith Falls Limestone Plain, which is a broad flat poorly drained region underlain by thin soils, dolostone and sandstone. A veneer of glacial drift (glacial till, sand etc.) overlies the bedrock. A geologic fault may run across this catchment.
Municipal Coverage
Drummond/North Elmsley Township (50.3 km2; 99.0% of catchment)
Town of Perth (0.5 km2; 1% of catchment)
Stream Length
All watercourses (including headwater streams): 66.6 km.
1.2 Vulnerable Areas
The Mississippi-Rideau Source Water Protection program has mapped the southwestern boundary of the catchment as a Significant Groundwater Recharge Area and all of the catchment as a Highly Vulnerable Aquifer. There are no Well-Head Protection Areas in the catchment.
Wetland Hydrology
A watershed model developed by the RVCA in 2009 was used to study the hydrologic function of wetlands in the Rideau Valley Watershed, including those found in the Port Elmsley catchment.
1.3 Conditions at a Glance
Fish Community/Thermal Regime
Warm and cool water recreational and baitfish fishery with 19 species observed in the Tay River during 2017.
Headwater Drainage Features
Classified as wetland and channelized features with historical modifications in the form of straightening.
Instream/Riparian Habitat
Tay River: Low to high habitat complexity was identified for the Tay River in the catchment. Regions with increased habitat complexity were observed throughout most of the reaches of the system. The Tay River has a healthy diversity of plant types and levels throughout most of the surveyed sections. Dissolved oxygen conditions for the Tay River varied along the system for both warm and coolwater species.
Tay River: B enthic invertebrate samples shift in community composition from species that are sensitive to high organic pollution levels in the fall to more tolerant species in the spring.
Water Wells
Over 300 operational private water wells in the Port Elmsley catchment. Groundwater uses are mainly domestic, but also include many monitoring wells and some commercial, livestock and other water supplies .
Wetland Cover
Wetlands are reported to have covered 45 percent of the Port Elmsley catchment prior to European settlement, as compared to 20 percent (or 10.3 square kilometres) of the area in 2014. This represents a 55 percent (or 12.8 square kilometre) loss of historic wetland cover. Fifty-two percent of the remaining wetlands are regulated leaving 48 percent (or 4.8 square kilometers) unregulated.
1.4 Catchment Care
Environmental Management
Development along the Tay River (Town of Perth eastern boundary to Port Elmsley) and in, and adjacent to, the Tay Marsh Provincially Significant Wetland and the Westport-Nelson Provincially Significant Wetland Complex in the catchment is subject to Ontario Regulation 174-06 (entitled “Development, Interference with Wetlands and Alterations to Shorelines and Watercourses”) that protects landowners and their property from natural hazards (i.e., flooding, fluctuating water table, unstable soils) along with the hydrologic function of the wetland.
One Environmental Compliance Approval was sought for a municipal waste management site in the catchment.
No Permits To Take Water (PTTW) are active in the catchment .
Environmental Monitoring
Chemical surface (in-stream/lake) water quality collection by the RVCA since 2006 (see Section 2 of this report).
Benthic invertebrate (aquatic insect) surface (in-stream) water quality collection in the Tay River by the RVCA since 2003 (see Section 3.3.1 of this report).
Fish survey and stream characterization survey by the RVCA on the Tay River in 2017 included taking measurements and recording observations on instream habitat, bank stability, other attributes and preparing a temperature profile (see Section 3 of this report).
Nineteen drainage feature assessments were conducted by the RVCA in 2017 at road crossings in the catchment. The protocol measures zero, first and second order headwater drainage features and is a rapid assessment method characterizing the amount of water, sediment transport, and storage capacity within headwater drainage features (see Section 3.4 of this report).
Classification of Port Elmsley catchment land cover types derived by the RVCA from colour aerial photography that was acquired during the spring of 2008 and 2014 (see Section 4.1 of this report).
Stewardship
Twenty-nine stewardship projects were completed by landowners with assistance from the RVCA (see Section 5 of this report).
2.0 Port Elmsley Catchment: Water Quality Conditions
Surface water quality conditions in the Port Elmsley catchment are monitored by the Rideau Valley Conservation Authority (RVCA) Baseline Water Quality Monitoring Program. The baseline water quality program focuses on streams; data is collected for 22 parameters including nutrients (total phosphorus and total Kjeldahl nitrogen), E. coli, metals (like aluminum and copper) and additional chemical/physical parameters (such as alkalinity, chlorides, pH and total suspended solids). Figure 2 shows the locations of monitoring sites in the catchment.
Figure 2 Water quality monitoring sites on the Tay River in the Port Elmsley Catchment
2.1 Tay River: Water Quality Rating
There are two monitored water quality sites in Port Elmsely Catchment, both of which are on the main channel of the Tay River. The RVCA's water quality rating at both sites (TAY-11 and TAY-01) was reported as "Good" (Table 1) as determined by the Canadian Council of Ministers of the Environment (CCME) Water Quality Index. "Good" indicates that only a minor degree of threat or impairment is observed and conditions rarely depart from natural or desirable levels. Each parameter is evaluated against established guidelines to determine water quality conditions. Those parameters that frequently exceed guidelines are presented below. Data has been analyzed over the 2006-2017 period for general trends and conditions. Table 1 shows the overall rating for the monitored surface water quality sites within the catchment and Table 2 outlines the Water Quality Index (WQI) scores and their corresponding ratings.
The scores at these sites are largely influenced by few high nutrient concentrations and bacterial counts. For more information on the CCME WQI, please see the Tay River Subwatershed Report.
Table 1 Water Quality Index ratings for the Tay River-Port Elmsley Catchment
Site
Location
2006-2008
2009-2011
2012-2014
2015-2017
TAY-11
Tay River upstream of Tay Marsh
Fair (79)
Good (89)
Good (89)
Good (90)
TAY-01
Tay River at Port Elmsley
Good (81)
Good (83)
Good (86)
Good (80)
Table 2 Water Quality Index ratings and corresponding index scores (RVCA terminology, original WQI category names in brackets)
Rating
Index Score
Very Good (Excellent)
95-100
Good
80-94
Fair
65-79
Poor (Marginal)
45-64
Very Poor (Poor)
0-44
2.1.1 Tay River: Nutrients
Total phosphorus (TP) is used as a primary indicator of excessive nutrient loading and may contribute to abundant aquatic vegetation growth and depleted dissolved oxygen levels. The Provincial Water Quality Objective (PWQO) is used as the TP Guideline and states that in streams concentrations greater than 0.030 mg/l indicate an excessive amount of TP.
Total Kjeldahl nitrogen (TKN) is used as secondary indicators of nutrient loading. RVCA uses a guideline of 0.500 mg/l to assess TKN[1] .
Tables 3 and 4 summarize average nutrient concentrations at monitored sites within the Port Elmsley catchment and show the proportion of results that meet the guidelines.
Table 3 Summary of total phosphorus results for the Tay River-Port Elmsley catchment, 2006-2017.
Total Phosphorus 2006-2017
Site
Average (mg/l)
Below Guideline
No. Samples
TAY-11
0.023
90%
59
TAY-01
0.021
92%
72
Table 4 Summary of total Kjeldahl nitrogen results for the Tay River-Port Elmsley catchment, 2006-2017 (Highlighted values indicate average concentrations exceed the guideline)
Total Kjeldahl Nitrogen 2006-2017
Site
Average (mg/l)
Below Guideline
No. Samples
TAY-11
0.590
36%
59
TAY-01
0.534
40%
71
Monitoring Site TAY-11
Site TAY-11 is the most upstream site on the Tay River monitored in this catchment. It is in the Perth Wildlife Reserve downstream of the Tay Lagoons and upstream of the Tay Marsh. The majority of samples (90 percent) at this site from 2006-2017 were below the TP guideline (Figures 3 and 4). The average TP concentration at this site was 0.023 mg/l (Table 3). Figure 3 shows that monthly average concentrations are highest from April to July, with a general reduction in concentrations from August to November. The average concentrations exceeded the guideline in October, due to a single elevated sample in October 2007 (Figure 4). Overall a decrease was observed in TP concentrations through the 2006-2017 period2.
TKN concentrations show that the bulk of results were elevated; only 36 percent of samples were below the guideline (Figure 6, Table 4). The average concentration over the 2006-2017 period was 0.590 mg/l (Table 4); monthly averages are comparable across the sampling seasons with the lowest concentrations observed in August and September (Figure 5). As with the TP data, average TKN concentrations are very high in October (Figure 5) due to the influence of an elevated sample in October 2007 (Figure 6). There was no significant trend found in TKN results at this site.
Monitoring Site TAY-01
Site TAY-01 is downstream of TAY-11 and is the last monitored site before the Tay River flows into Lower Rideau Lake. TP results were fairly low, the average concentrations was 0.021 and 92 percent of samples were below the guideline (Table 3, Figure 4). Monthly TP concentrations followed a similar pattern to upstream site TAY-11, and were consistently below the guideline (Figure 3). A declining trend in TP concentrations was also observed in the data from this site.
The majority of TKN results exceeded the guideline (Figure 5 and 6), 40 percent of samples were below 0.500 mg/l (TKN Guideline) with an average concentration of 0.534 mg/l (Table 4). Average monthly concentrations were comparable and also followed a similar pattern to TAY-11 (Figure 5), August and September were the only months that had average concentrations below the guideline. No significant trend was observed in the 2006-2017 TKN dataset.
Figure 3 Average monthly total phosphorous concentrations in the Port Elmsly catchment, 2006-2017
Figure 4 Distribution of total phosphorous concentrations in the Port Elmsley catchment, 2006-201
Figure 5 Average monthly total Kjeldahl nitrogen concentrations in the Port Elmsley catchment, 2006-2017
Figure 6 Distribution of total Kjeldahl nitrogen concentrations in the Port Elmsley catchment, 2006-2017
Summary of Tay River Nutrients
The data collected in this catchment provides evidence that nutrient enrichment is not a significant concern in this reach of the Tay River. TP and TKN concentrations are comparable between the two sites. The majority of TP samples are below guidelines and declining trend in TP concentrations was noted at both sites. Average TKN concentrations were just above the guideline and the majority of samples did exceed 0.500 mg/l. The elevated TKN can likely be attributed to the significant wetland area in this catchment. Wetlands hold a lot of nitrogen in their soils and can strongly influence the concentrations to overlying waters. The reduction in TP concentrations should be taken as a positive sign that cumulative changes on the landscape have benefited water quality conditions. High nutrient concentrations can help stimulate the growth of algae blooms and other aquatic vegetation in a waterbody and deplete oxygen levels as the vegetation dies off. It is important to continue best management practices such as minimizing storm water runoff, enhanced shoreline buffers, minimizing/discontinuing the use of fertilizers and restricting livestock access in upstream agricultural areas. These practices can help to prevent nutrient pollution; protecting and enhancing water quality conditions within the Tay River and Lower Rideau Lake.
2.1.2 Tay River: E. coli
Escherichia coli (E. coli) is used as an indicator of bacterial pollution from human or animal waste; in elevated concentrations it can pose a risk to human health. The PWQO of 100 colony forming units/100 millilitres (CFU/100 ml) is used. E. coli counts greater than this guideline indicate that bacterial contamination may be a problem within a waterbody.
Table 5 summarizes the geometric mean[3] for the monitored sites within the Port Elmsley catchment and shows the proportion of samples that meet the E. coli guideline of 100 CFU/100 ml. The results of the geometric mean with respect to the guideline are shown in Figures 7 and 8 respectively.
Table 5 Summary of E. coli results for the Port Elmsley catchment, 2006-2017
E. coli 2006-2017
Site
Geometric Mean (CFU/100ml)
Below Guideline
No. Samples
TAY-11
53
69%
59
TAY-01
53
68%
72
Monitoring Site TAY-11
E. coli counts at site TAY-11 indicate little concern with regard to bacterial contamination. Sixty-nine percent of samples were below the guideline (Figures 7-8) and the count at the geometric mean was 53 CFU/100ml (Table 5). Monthly E. coli counts showed that the geometric mean was highest during the warmer months though all results were below the guideline; warm water temperature and low flow conditions are more favourable for bacterial growth. (Figure 7). No trend was noted in E. coli counts over the 2006-2017 period.
Monitoring Site TAY-01
Elevated E. coli counts at site downstream site TAY-01 were also minimal. Sixty-eight percent of samples were below the guideline (Figure 8) from 2006-2017. The count at the geometric mean was 53 CFU/100ml (Table 5) and well below the guideline. As with site TAY-11, counts were highest during the summer months. The count at the geometric mean exceeded the guideline in July (Figure 7), this was strongly influenced by a single elevated sample in July 2017 (Figure 8). There was no significant trend in E. coli data over the 2006-2017 period.
Figure 7 Geometric mean of E. coli results in the Port Elmsley catchment, 2006-2017
Figure 8 Distribution of E. coli counts in the Port Elmsley catchment, 2006-2017.
Summary of Tay River Bacterial Contamination
Bacterial contamination does not appear to be a significant concern in this reach of the Tay River. The majority of samples do not exceed the guideline and counts at the geometric mean are well below the guideline of 100 CFU/100ml. Best management practices such as enhancing shoreline buffers, limiting livestock access and minimizing runoff in both agricultural and developed areas can help to protect this reach of the Tay River into the future.
1 No Ontario guideline for TKN is presently available; however, waters not influenced by excessive organic inputs typically range from 0.100 to 0.500 mg/l, Environment Canada (1979) Water Quality Sourcebook, A Guide to Water Quality Parameters, Inland Waters Directorate, Water Quality Branch, Ottawa, Canada.
2 Trends in the data were assessed using the Mann-Kendall trend test and Sens slope statistic.
3 A type of mean or average, which indicates the central tendency or typical value of a set of numbers by using the product of their values (as opposed to the arithmetic mean which uses their sum). It is often used to summarize a variable that varies over several orders of magnitude, such as E. coli counts.
The Stream Characterization Program evaluated 6.0 km of the Tay River in 2017 in the Port Elmsley catchment. A total of 60 stream survey assessments were completed in July. The Tay River watershed experienced high water levels along the Tay River and its tributaries in 2017. After moving from two years of drought conditions in 2015 and 2016 heavy rains throughout the year made 2017 the wettest year in recorded history. Flows out of Perth and downstream to Lower Rideau Lake, as with the rest of the Tay River watershed remained relatively high through 2017 in reaction to the wet weather. Some property flooding occurred between Beveridges Dam and Port Elsmley with the highest flows in May. No residential flooding was reported but shoreline erosion was an issue.
High flows along the Tay River at the Port Elmsley Road in the spring of 2017
3.1 Tay River Overbank Zone
3.1.1 Riparian Buffer Evaluation
The quality of the riparian area increases with the width, complexity and linear extent of its vegetation along a stream or creek. A complex riparian community consists of diverse plant species native to the site, with multiple age-classes providing vertical structural diversity along a watercourse.
Here is a list of watershed benefits from a healthy riparian buffer zone:
Reduces the amount of pollutants that reach the stream from surface runoff
Helps reduce and mitigates erosion
Provides a microclimate that is cooler during the summer months providing cooler water for aquatic organisms
Provides large wood structure from fallen trees and limbs that form instream cover, create pools, stabilize the streambed, and provide habitat for aquatic organisms
Provides organic material for stream biota that, among other functions, is the base of the food chain in lower order streams
Provides habitat for terrestrial insects that drop in the stream and become food for fish and travel corridors for other terrestrial animals
Dissipates energy during flood events
Often provides the only refuge areas for fish during out-of-bank flows (behind trees, stumps, and logs)
Figure 9 demonstrates the buffer conditions of the left and right banks separately. The Tay River had a buffer of greater than 30 meters along 88 percent of the left bank and 66 percent of the right bank.
Figure 9 Riparian Buffer Evaluation along the Tay River in the Port Elmsley catchment
3.1.2 Riparian Buffer Alterations
Alterations within the riparian buffer were assessed within three distinct shoreline zones (0-5m, 5-15m, 15-30m), and evaluated based on the dominant vegetative community and/or land cover type (Figure 10). The riparian buffer zone along the Tay River was found to be dominated by forest, scrubland, wetland and meadow conditions.
Figure 10 Riparian buffer alterations along the Tay River in the Port Elmsley catchment
3.1.3 Adjacent Land Use
The RVCA’s Stream Characterization Program identifies eight different land uses along the Tay River (Figure 11). Surrounding land use is considered from the beginning to end of the survey section (100m) and up to 100m on each side of the river. Land use outside of this area is not considered for the surveys but is nonetheless part of the subwatershed and will influence the creek. Forest habitat was dominant at 98 percent; scrubland was found along 75 percent of the surveyed sections, wetland habitat was observed along 62 percent of the system and 23 percent meadow habitat was present along the Tay River. The remaining land use consisted of residential, pasture, recreational and infrastructure in the form of road crossings.
Figure 11 Land Use along the Tay River in the Port Elmsley catchment
3.2 Tay River Shoreline Zone
3.2.1 Instream Erosion
Stream erosion is the process by which water erodes and transports sediments, resulting in dynamic flows and diverse habitat conditions. Excessive erosion can result in drastic environmental changes, as habitat conditions, water quality and aquatic life are all negatively affected. Bank stability was assessed as the overall extent of each section with “unstable” shoreline conditions. These conditions are defined by the presence of significant exposed soils/roots, minimal bank vegetation, severe undercutting, slumping or scour and potential failed erosion measures. The Tay River had no erosion observed along the majority of surveyed sections with a few sections having low to moderate levels of erosion (Figure 12).
Figure 12 Erosion levels along the Tay River in the Port Elmsley catchment
3.2.2 Undercut Stream Banks
Stream bank undercuts can provide excellent cover habitat for aquatic life, however excessive levels can be an indication of unstable shoreline conditions. Bank undercut was assessed as the overall extent of each surveyed section with overhanging bank cover present. Figure 13 shows that the Tay River had no observed undercut banks along the majority of the system, however there were several sections in the upper reaches with high to moderate levels of undercut banks.
Figure 13 Undercut stream banks along the Tay River in the Port Elmsley catchment
3.2.3 Stream Shading
Grasses, shrubs and trees all contribute towards shading a stream. Shade is important in moderating stream temperature, contributing to food supply and helping with nutrient reduction within a stream. Stream cover is assessed as the total coverage area in each section that is shaded by overhanging trees/grasses and tree canopy, at greater than 1m above the water surface. Figure 14 shows low levels of stream shading along the majority of the Tay River.
Figure 14 Stream shading along the Tay River in the Port Elmsley catchment
3.2.4 Instream Wood Structure
Forested shorelines provide essential complex habitat through the perpetual process of shoreline trees falling into the water. This continuous recruitment of trees creates a wood-based physical structure in the littoral zone that is common on natural systems. Insects, fish, amphibians, birds, and other animals have also evolved with this abundance of near shore wood and it is essential to their life cycles. With increased development along many waterways, forested lakeshores have been altered and wood-based physical structure in many waterways has been reduced. It is important to restore this essential habitat to aquatic ecosystems.
Shoreline Protection
Protects shorelines by providing a barrier from wind and wave erosion
Reduces sedimentation of the water caused by shoreline slumping due to bank erosion
Allows detritus to collect and settle on the lake or creek bed providing the substrate structure required for native aquatic vegetation to establish and outcompete invasive species
Food Source
Wood complexes are an important food source for invertebrates
Small fish feed on the abundance of invertebrates that are found around these structures
Larger fish, waterfowl and shorebirds all benefit from the abundance of invertebrates and small fish feeding around woody structures in the littoral zone
Cover
Cover from predators is essential for many fish and animals to successfully complete their life cycle
The nooks and crannies of wood complexes offer critters safety from predators while at the same time concentrating prey to make predators more efficient
Wood provides the structure on which many species must lay or attach their eggs, therefore these complexes provide quality spawning and nesting habitat
Diversity
Wood complexes in the littoral zone provide unique edge habitat along the shoreline
Edge habitats contain more species diversity and higher concentrations of species than the adjoining habitats themselves will have
Figure 15 shows that the majority of the Tay River had low levels of instream wood structure along the system. There were several stream survey sections which were characterized as having moderate levels of instream wood structure in the form of branches and trees.
Figure 15 Instream wood structure along the Tay River in the Port Elmsley catchment
3.2.5 Overhanging Wood Structure
Trees and branches that are less than one meter from the surface of the water are defined as overhanging. Overhanging branches and trees provide a food source, nutrients and shade which helps to moderate instream water temperatures. Figure 16 shows the system is somewhat variable with no overhanging branches and trees where the river is wide and is dominated by wetland habitat to areas that have moderate levels of overhanging wood structure along the Tay River.
Figure 16 Overhanging wood structure along the Tay River in the Port Elmsley catchment
3.2.6 Anthropogenic Alterations
Stream alterations are classified based on specific functional criteria associated with the flow conditions, the riparian buffer and potential human influences. Figure 17 shows twenty seven percent of the Tay River remains “unaltered” with no anthropogenic alterations. Sixty eight percent of the Tay River was classified as natural with minor anthropogenic changes. Five percent of sections were considered altered; while no sections were classified as highly altered. The alterations along the Tay River were in the form of shoreline modifications and road crossings.
Figure 17 Anthropogenic alterations along the Tay River in the Port Elmsley catchment
3.3 Tay River Instream Aquatic Habitat
3.3.1 Benthic Invertebrates
Freshwater benthic invertebrates are animals without backbones that live on the stream bottom and include crustaceans such as crayfish, molluscs and immature forms of aquatic insects. Benthos represent an extremely diverse group of aquatic animals and exhibit wide ranges of responses to stressors such as organic pollutants, sediments and toxicants, which allows scientists to use them as bioindicators. As part of the Ontario Benthic Biomonitoring Network (OBBN), the RVCA has been collecting benthic invertebrates at the Port Elmsley Road site since 2003. Monitoring data is analyzed for each sample site and the results are presented using the Family Biotic Index, Family Richness and percent Ephemeroptera, Plecoptera and Trichoptera.
OBBN sample location at the Port Elmsley Road
Hilsenhoff Family Biotic Index
The Hilsenhoff Family Biotic Index (FBI) is an indicator of organic and nutrient pollution and provides an estimate of water quality conditions for each site using established pollution tolerance values for benthic invertebrates. FBI results for the Port Elmsley - Tay River catchment at the Port Elmsley Road sample location is summarized by year. “Good” to “Poor” water quality conditions were observed at the Tay River sample location (Figure 18) using a grading scheme developed by Conservation Authorities in Ontario for benthic invertebrates.
Figure 18 Hilsenhoff Family Biotic Index at the Port Elmsley Road sample location
Family Richness
Family Richness measures the health of the community through its diversity and increases with increasing habitat diversity suitability and healthy water quality conditions. Family Richness is equivalent to the total number of benthic invertebrate families found within a sample. The Port Elmsley Road location is reported to have “Good” family richness (Figure 19).
Figure 19 Family Richness at the Port Elmsley Road sample location
EPT
Ephemeroptera (Mayflies), Plecoptera (Stoneflies), and Trichoptera (Caddisflies) are species considered to be very sensitive to poor water quality conditions. High abundance of these organisms is generally an indication of good water quality conditions at a sample location. There appears to be a difference in community composition between the spring and fall results for the Port Elmsley Road site. The community structure is typically dominated by species that are sensitive to poor water quality conditions in the fall, while the spring results have more of a mixed community of species that are more tolerant to poorer water quality conditions. As a result, the EPT indicates that the Port Elmsley Road sample location is reported to have “Good” to “Fair” water quality (Figure 20) during the reporting periods.
Figure 20 EPT on the Tay River at the Port Elmsley Road sample location
Conclusion
Overall the Tay River site in the Port Elmsley catchment from a benthic invertebrate perspective is considered “Fair” as the samples shift in community composition from species that are sensitive to high organic pollution levels in the fall to more tolerant species in the spring.
3.3.2 Habitat Complexity
Habitat complexity is a measure of the overall diversity of habitat types and features within a stream. Streams with high habitat complexity support a greater variety of species niches, and therefore contribute to greater diversity. Factors such as substrate, flow conditions (pools, riffles) and cover material (vegetation, wood structure, etc.) all provide crucial habitat to aquatic life. Habitat complexity is assessed based on the presence of boulder, cobble and gravel substrates, as well as the presence of instream wood structure.
No to high habitat complexity was identified for the Tay River in the Port Elmsley catchment (Figure 21). Regions with increased habitat complexity were observed throughout most of the reaches of the Tay River within the catchment.
Figure 21 Habitat complexity along the Tay River in the Port Elmsley catchment
3.3.3 Instream Substrate
Diverse substrate is important for fish and benthic invertebrate habitat because some species have specific substrate requirements and for example will only reproduce on certain types of substrate. The absence of diverse substrate types may limit the overall diversity of species within a stream. Substrate conditions were highly diverse along the Tay River (Figure 22) with all substrate types being recorded at various locations along the system. Figure 23 shows the dominant substrate type observed for each section surveyed along the Tay River.
Figure 22 Instream substrate along the Tay River in the Port Elmsley catchment
Figure 23 shows the dominant substrate type along the Tay River in the Port Elmsley catchment
3.3.4 Instream Morphology
Pools and riffles are important habitat features for aquatic life. Riffles are fast flowing areas characterized by agitation and overturn of the water surface. Riffles thereby play a crucial role in contributing to dissolved oxygen conditions and directly support spawning for some fish species. They are also areas that support high benthic invertebrate populations which are an important food source for many aquatic species. Pools are characterized by minimal flows, with relatively deep water and winter/summer refuge habitat for aquatic species. Runs are moderately shallow, with unagitated surfaces of water and areas where the thalweg (deepest part of the channel) is in the center of the channel. Figure 24 shows that the Tay River is highly variable; 98 percent of sections recorded runs, 72 percent pools and 28 percent riffles. Figure 25 shows the riffle habitat areas were observed primarily in the lower reach of the Tay River.
Figure 24 Instream morphology along the Tay River in the Port Elmsley catchment
Figure 25 Instream riffle habitat along the Tay River in the Port Elmsley catchment
3.3.5 Vegetation Type
Instream vegetation provides a variety of functions and is a critical component of the aquatic ecosystem. Aquatic plants promote stream health by:
Providing direct riparian/instream habitat
Stabilizing flows reducing shoreline erosion
Contributing to dissolved oxygen through photosynthesis
Maintaining temperature conditions through shading
For example emergent plants along the shoreline can provide shoreline protection from wave action and important rearing habitat for species of waterfowl. Submerged plants provide habitat for fish to find shelter from predator fish while they feed. Floating plants such as water lilies shade the water and can keep temperatures cool while reducing algae growth. Submerged plants were observed in 90 percent of sections, narrow leaved emergents in 87 percent of sections, robust emergents present in 62 percent of the survey sections, 77 percent of sections contained algae, 50 percent floating plants, 20 percent free floating, 60 percent broad leaved emergents and 77 percent of sections had areas with no instream vegetation and were primarily located in areas with bedrock substrate. Figure 26 depicts the plant community structure for the Tay River. Figure 27 shows the dominant vegetation type observed for each section surveyed along the Tay River in the Port Elmsley catchment.
Figure 26 Vegetation type along the Tay River in the Port Elmsley catchment
Figure 27 Dominant vegetation type along the Tay River in the Port Elmsley catchment
3.3.6 Instream Vegetation Abundance
Instream vegetation is an important factor for a healthy stream ecosystem. Vegetation helps to remove contaminants from the water, contributes oxygen to the stream, and provides habitat for fish and wildlife. Too much vegetation can also be detrimental. Figure 28 demonstrates that the Tay River had normal to common levels of vegetation recorded at 67 and 63 percent of stream surveys. Extensive levels of vegetation were observed in 17 percent of the surveyed sections and were consistent with areas dominated by the invasive aquatic plant known as European frogbit; while eighteen percent of sections had no vegetation in areas.
Figure 28 Instream vegetation abundance along the Tay River in the Port Elmsley catchment
3.3.7 Invasive Species
Invasive species can have major implications on streams and species diversity. Invasive species are one of the largest threats to ecosystems throughout Ontario and can out compete native species, having negative effects on local wildlife, fish and plant populations. Seventy five percent of the sections surveyed along the Tay River in the Port Elmsley catchment had invasive species. The invasive species observed were European frogbit, Eurasian milfoil, banded mystery snail, purple loosestrife, honeysuckle, wild parsnip, Manitoba maple, curly leafed pondweed and common/glossy buckthorn. Invasive species abundance (i.e. the number of observed invasive species per section) was assessed to determine the potential range/vector of many of these species (Figure 29).
Figure 29 Invasive species abundance along the Tay River in the Port Elmsley catchment
3.3.8 Water Chemistry
During the stream characterization survey, a YSI probe is used to collect water chemistry information. Dissolved oxygen (DO), specific conductivity (SPC) and pH are measured at the start and end of each section.
3.3.8.1 Dissolved Oxygen
Dissolved oxygen is a measure of the amount of oxygen dissolved in water. The Canadian Environmental Quality Guidelines of the Canadian Council of Ministers of the Environment (CCME) suggest that for the protection of aquatic life the lowest acceptable dissolved oxygen concentration should be 6 mg/L for warmwater biota and 9.5 mg/L for coldwater biota (CCME, 1999). Figure 30 shows that the dissolved oxygen in Tay River supports warmwater and coolwater biota along the system. The average dissolved oxygen level observed within Port Elmsley catchment was 7.7mg/L which meets the recommended level for warm and cool water biota.
Figure 30 Dissolved oxygen ranges along the Tay River in the Port Elmsley catchment
3.3.8.2 Conductivity
Conductivity in streams is primarily influenced by the geology of the surrounding environment, but can vary drastically as a function of surface water runoff. Currently there are no CCME guideline standards for stream conductivity; however readings which are outside the normal range observed within the system are often an indication of unmitigated discharge and/or stormwater input. The average conductivity observed within the Tay River was 202.5 µs/cm. Figure 31 shows the conductivity readings for the Tay River in the Port Elmsley catchment.
Figure 31 Specific conductivity ranges in the Tay River in the Port Elmsley catchment
3.3.8.3 pH
Based on the PWQO for pH, a range of 6.5 to 8.5 should be maintained for the protection of aquatic life. Average pH values along the Tay River were 7.64 thereby meeting the provincial standard (Figure 32).
Figure 32 pH ranges along the Tay River in the Port Elmsley catchment
3.3.8.4 Oxygen Saturation (%)
Oxygen saturation is measured as the ratio of dissolved oxygen relative to the maximum amount of oxygen that will dissolve based on the temperature and atmospheric pressure. Well oxygenated water will stabilize at or above 100% saturation, however the presence of decaying matter/pollutants can drastically reduce these levels. Oxygen input through photosynthesis has the potential to increase saturation above 100% to a maximum of 500%, depending on the productivity level of the environment. In order to represent the relationship between concentration and saturation, the measured values have been summarized into 6 classes:
Dissolved oxygen conditions for the Tay River varied along the system for both warm and coolwater species (Figure 33). Certain sections in the lower reach were above the guideline to support coldwater biota.
Figure 33 A bivariate assessment of dissolved oxygen concentration (mg/L) and saturation (%) along the Tay River in the Port Elmsley catchment
3.3.8.5 Specific Conductivity Assessment
Specific conductivity (SPC) is a standardized measure of electrical conductance, collected at or corrected to a water temperature of 25⁰C. SPC is directly related to the concentration of ions in water, and is commonly influenced by the presence of dissolved salts, alkalis, chlorides, sulfides and carbonate compounds. The higher the concentration of these compounds, the higher the conductivity. Common sources of elevated conductivity include storm water, agricultural inputs and commercial/industrial effluents.
In order to summarize the conditions observed, SPC levels were evaluated as either normal, moderately elevated or highly elevated. These categories correspond directly to the degree of variation (i.e. standard deviation) at each site relative to the average across the system.
Normal levels were maintained in the middle reaches of the Tay River, however there were moderately elevated areas in the upper and lower reaches (Figure 34).
Figure 34 Relative specific conductivity levels along the Tay River in the Port Elmsley catchment
3.3.9 Thermal Regime
Many factors can influence fluctuations in stream temperature, including springs, tributaries, precipitation runoff, discharge pipes and stream shading from riparian vegetation. Water temperature is used along with the maximum air temperature (using the Stoneman and Jones method) to classify a watercourse as either warm water, cool water or cold water. Figure 35 shows where the thermal sampling sites were located on the Tay River in the Port Elmsley catchment. Analysis of the data collected indicates that the Tay River is classified as a warm water system (Figure 36).
Figure 35 Temperature logger locations along the Tay River in the Port Elmsley catchment
Figure 36 Temperature logger data for the sites along the Tay River in the Port Elmsley catchment
Each point on the graph represents a temperature that meets the following criteria:
Sampling dates between July 1st and September 7th
Sampling date is preceded by two consecutive days above 24.5 °C, with no rain
Water temperatures are collected at 4pm
Air temperature is recorded as the max temperature for that day
3.3.10 Groundwater
Groundwater discharge areas can influence stream temperature, contribute nutrients, and provide important stream habitat for fish and other biota. During stream surveys, indicators of groundwater discharge are noted when observed. Indicators include: springs/seeps, watercress, iron staining, significant temperature change and rainbow mineral film. Figure 37 shows areas where one or more of the above groundwater indicators were observed during stream surveys and headwater assessments.
Figure 37 Groundwater indicators observed in the Port Elmsley catchment
3.3.11 Fish Community
The Port Elmsley catchment is classified as a mixed community of warm and cool water recreational and baitfish fishery with 19 species observed. Figure 38 shows the historical and 2017 fish sampling locations in the catchment.
Figure 38 Tay River Port Elmsley catchment fish community
Table 6 lists the species observed in the watershed historically and during the 2017 sampling effort.
Table 6 Fish species observed in the Port Elmsley catchment
Fish Species
Scientific Name
Fish code
Historical
2017
banded killifish
Fundulus diaphanus
BaKil
X
bluegill
Lepomis macrochirus
Blueg
X
bluntnose minnow
Pimephales notatus
BnMin
X
burbot
Lota lota
Burbo
X
central mudminnow
Umbra limi
CeMud
X
common shiner
Luxilus cornutus
CoShi
X
X
etheostoma sp.
etheostoma sp.
EthSp
X
fallfish
Semotilus corporalis
Fallf
X
golden shiner
Notemigonus crysoleucas
GoShi
X
largemouth bass
Micropterus salmoides
LmBas
X
logperch
Percina caprodes
Logpe
X
longnose dace
Rhinichthys cataractae
LnDac
X
northern pike
Esox lucius
NoPik
X
X
pumpkinseed
Lepomis gibbosus
Pumpk
X
X
rock bass
Ambloplites rupestris
RoBas
X
X
shorthead redhorse
Moxostoma macrolepidotum
ShRed
X
smallmouth bass
Micropterus dolomieu
SmBas
X
walleye
Sander vitreus
Walle
X
yellow bullhead
Ameiurus natalis
YeBul
X
yellow perch
Perca flavescens
YePer
X
TOTAL Species
19
5
Fish being identified, weighed and measured while sampling in the Port Elmsley catchment
3.3.12 Migratory Obstructions
It is important to know locations of migratory obstructions because these can prevent fish from accessing important spawning and rearing habitat. Migratory obstructions can be natural or manmade, and they can be permanent or seasonal. Figure 39 shows that Port Elmsley catchment had one dam on the Tay River.
Figure 39 Migratory obstructions in the Port Elmsley catchment
The Beveridges Dam as seen by an RVCA field crew while conducting the 2017 stream survey of the Tay River
3.4 Headwater Drainage Feature Assessment
3.4.1 Headwaters Sampling Locations
The RVCA Stream Characterization program assessed Headwater Drainage Features for the Port Elmsley catchment in 2016. This protocol measures zero, first and second order headwater drainage features (HDF). It is a rapid assessment method characterizing the amount of water, sediment transport, and storage capacity within headwater drainage features (HDF). RVCA is working with other Conservation Authorities and the Ministry of Natural Resources and Forestry to implement the protocol with the goal of providing standard datasets to support science development and monitoring of headwater drainage features. An HDF is a depression in the land that conveys surface flow. Additionally, this module provides a means of characterizing the connectivity, form and unique features associated with each HDF (OSAP Protocol, 2013). In 2017 the program sampled 19 sites at road crossings in the Port Elmsley catchment area (Figure 40).
Figure 40 Location of the headwater sampling sites in the Port Elmsley catchment
3.4.2 Headwater Feature Type
The headwater sampling protocol assesses the feature type in order to understand the function of each feature. The evaluation includes the following classifications: defined natural channel, channelized or constrained, multi-thread, no defined feature, tiled, wetland, swale, roadside ditch and pond outlet. By assessing the values associated with the headwater drainage features in the catchment area we can understand the ecosystem services that they provide to the watershed in the form of hydrology, sediment transport, and aquatic and terrestrial functions. The headwater drainage features in the Port Elmsley catchment are highly variable features. Figure 41 shows the feature type of the primary feature at the sampling locations.
Figure 41 Headwater feature types in the Port Elmsley catchment
3.4.3 Headwater Feature Flow
The observed flow condition within headwater drainage features can be highly variable depending on timing relative to the spring freshet, recent rainfall, soil moisture, etc. Flow conditions are assessed in the spring and in the summer to determine if features are perennial and flow year round, if they are intermittent and dry up during the summer months or if they are ephemeral systems that do not flow regularly and generally respond to specific rainstorm events or snowmelt. Flow conditions in headwater systems can change from year to year depending on local precipitation patterns. Figure 42 shows the observed flow condition at the sampling locations in the Port Elmsley catchment.
Figure 42 Headwater feature flow conditions in the Port Elmsley catchment
A spring photo of the headwater sample site in the Port Elmsley catchment located on Drummond Concession 2
A summer photo of the headwater sample site in the Port Elmsley catchment located on Drummond Concession 2
3.4.4 Feature Channel Modifications
Channel modifications were assessed at each headwater drainage feature sampling location. Modifications include channelization, dredging, hardening and realignments. The Port Elmsley catchment area had a majority of features with no channel modifications observed, six sites as having been historically dredged/channelized and one location had mixed modifications. Figure 43 shows the channel modifications observed at the sampling locations for Port Elmsley catchment.
Figure 43 Headwater feature channel modifications in the Port Elmsley catchment
3.4.5 Headwater Feature Vegetation
Headwater feature vegetation evaluates the type of vegetation that is found within the drainage feature. The type of vegetated within the channel influences the aquatic and terrestrial ecosystem values that the feature provides. For some types of headwater features the vegetation within the feature plays a very important role in flow and sediment movement and provides wildlife habitat. The following classifications are evaluated no vegetation, lawn, wetland, meadow, scrubland and forest. Figure 44 depicts the dominant vegetation observed at the sampled headwater sites in the Port Elmsley catchment.
Figure 44 Headwater feature vegetation types in the Port Elmsley catchment
3.4.6 Headwater Feature Riparian Vegetation
Headwater riparian vegetation evaluates the type of vegetation that is found along the adjacent lands of a headwater drainage feature. The type of vegetation within the riparian corridor influences the aquatic and terrestrial ecosystem values that the feature provides to the watershed. Figure 45 depicts the type of riparian vegetation observed at the sampled headwater sites in the Port Elmsley catchment.
Figure 45 Headwater feature riparian vegetation types in the Port Elmsley catchment
3.4.7 Headwater Feature Sediment Deposition
Assessing the amount of recent sediment deposited in a channel provides an index of the degree to which the feature could be transporting sediment to downstream reaches (OSAP, 2013). Evidence of excessive sediment deposition might indicate the requirement to follow up with more detailed targeted assessments upstream of the site location to identify potential best management practices to be implemented. Sediment deposition ranged from none to substantial for the headwater sites sampled in the Port Elmsley catchment area. Figure 46 depicts the degree of sediment deposition observed at the sampled headwater sites in the Port Elmsley catchment. Sediment deposition conditions ranged from no sediment deposition to substantial.
Figure 46 Headwater feature sediment deposition in the Port Elmsley catchment
3.4.8 Headwater Feature Upstream Roughness
Feature roughness will provide a measure of the amount of materials within the bankfull channel that could slow down the velocity of water flowing within the headwater feature (OSAP, 2013). Materials on the channel bottom that provide roughness include vegetation, woody Structure and boulders/cobble substrates. Roughness can provide benefits in mitigating downstream erosion on the headwater drainage feature and the receiving watercourse by reducing velocities. Roughness also provides important habitat conditions for aquatic organisms. Figure 47 shows the feature roughness conditions at the sampling locations in the Port Elmsley catchment were highly variable ranging from minimal to extreme.
Figure 47 Headwater feature roughness in the Port Elmsley catchment
Land cover and any change in coverage that has occurred over a six year period is summarized for the Port Elmsley catchment using spatially continuous vector data representing the catchment during the spring of 2008 and 2014. This dataset was developed by the RVCA through heads-up digitization of 20cm DRAPE ortho-imagery at a 1:4000 scale and details the surrounding landscape using 10 land cover classes.
4.1 Port Elmsley Catchment Land Cover/Change
As shown in Table 7 and Figure 1, the dominant land cover type in 2014 is crop and pastureland.
Table 7 Land cover in the Port Elmsley catchment (2008 vs. 2014)
Land Cover
2008
2014
Change - 2008 to 2014
Area
Area
Area
Ha
Percent
Ha
Percent
Ha
Percent
Crop and Pasture
2410
47
2390
47
-20
Wetland
1021
20
1033
21
12
1
>Evaluated
(551)
(11)
(551)
(11)
(0)
(0)
>Unevaluated
(470)
(9)
(482)
(10)
(12)
(1)
Woodland
949
19
937
18
-12
-1
Settlement
294
6
317
6
23
Meadow-Thicket
220
4
217
4
-3
Transportation
123
2
123
2
Water
78
2
78
2
* Does not include treed swamps ** Includes treed swamps
From 2008 to 2014, there was an overall change of 30 hectares (from one land cover class to another). Most of the change in the Port Elmsley catchment is a result of crop and pastureland being converted to settlement and reverting to woodland (Figure 48).
Figure 48 Land cover change in the Port Elmsley catchment (2014)
Table 8 provides a detailed breakdown of all land cover change that has taken place in the Port Elmsley catchment between 2008 and 2014.
Table 8 Land cover change in the Port Elmsley catchment (2008 to 2014)
Land Cover
Change - 2008 to 2014
Area
Ha.
Percent
Crop and Pasture to Settlement
17
55.6
Crop and Pasture to Woodland
5
16.4
Woodland to Settlement
3.4
11.3
Meadow-Thicket to Settlement
3.2
10.3
Woodland to Crop and Pasture
2
6.4
4.2 Woodland Cover
In the Environment Canada Guideline (Third Edition) entitled “How Much Habitat Is Enough?” (hereafter referred to as the “Guideline”) the opening narrative under the Forest Habitat Guidelines section states that prior to European settlement, forest was the predominant habitat in the Mixedwood Plains ecozone. The remnants of this once vast forest now exist in a fragmented state in many areas (including the Rideau Valley watershed) with woodland patches of various sizes distributed across the settled landscape along with higher levels of forest cover associated with features such as the Frontenac Axis (within the on-Shield areas of the Rideau Lakes and Tay River subwatersheds). The forest legacy, in terms of the many types of wildlife species found, overall species richness, ecological functions provided and ecosystem complexity is still evident in the patches and regional forest matrices (found in the Tay River subwatershed and elsewhere in the Rideau Valley watershed). These ecological features are in addition to other influences which forests have on water quality and stream hydrology including reducing soil erosion, producing oxygen, storing carbon along with many other ecological services that are essential not only for wildlife but for human well-being.
The Guideline also notes that forests provide a great many habitat niches that are in turn occupied by a great diversity of plant and animal species. They provide food, water and shelter for these species - whether they are breeding and resident locally or using forest cover to help them move across the landscape. This diversity of species includes many that are considered to be species at risk. Furthermore, from a wildlife perspective, there is increasing evidence that the total forest cover in a given area is a major predictor of the persistence and size of bird populations, and it is possible or perhaps likely that this pattern extends to other flora and fauna groups. The overall effect of a decrease in forest cover on birds in fragmented landscapes is that certain species disappear and many of the remaining ones become rare, or fail to reproduce, while species adapted to more open and successional habitats, as well as those that are more tolerant to human-induced disturbances in general, are able to persist and in some cases thrive. Species with specialized-habitat requirements are most likely to be adversely affected. The overall pattern of distribution of forest cover, the shape, area and juxtaposition of remaining forest patches and the quality of forest cover also play major roles in determining how valuable forests will be to wildlife and people alike.
The current science generally supports minimum forest habitat requirements between 30 and 50 percent, with some limited evidence that the upper limit may be even higher, depending on the organism/species phenomenon under investigation or land-use/resource management planning regime being considered/used.
As shown in Figure 49, 20 percent of the Port Elmsley catchment contains 937 hectares of upland forest and 81 hectares of lowland forest (treed swamps) versus the 47 percent of woodland cover in the Tay River subwatershed. This is greater than the 30 percent of forest cover that is identified as the minimum threshold required to sustain forest birds according to the Guideline and which may only support less than one half of potential species richness and marginally healthy aquatic systems. When forest cover drops below 30 percent, forest birds tend to disappear as breeders across the landscape.
Figure 49 Woodland cover and forest interior in the Port Elmsley catchment (2014)
4.2.1 Woodland (Patch) Size
According to the Ministry of Natural Resources’ Natural Heritage Reference Manual (Second Edition), larger woodlands are more likely to contain a greater diversity of plant and animal species and communities than smaller woodlands and have a greater relative importance for mobile animal species such as forest birds.
Bigger forests often provide a different type of habitat. Many forest birds breed far more successfully in larger forests than they do in smaller woodlots and some rely heavily on forest interior conditions. Populations are often healthier in regions with more forest cover and where forest fragments are grouped closely together or connected by corridors of natural habitat. Small forests support small numbers of wildlife. Some species are “area-sensitive” and tend not to inhabit small woodlands, regardless of forest interior conditions. Fragmented habitat also isolates local populations, especially small mammals, amphibians and reptiles with limited mobility. This reduces the healthy mixing of genetic traits that helps populations survive over the long run (Conserving the Forest Interior. Ontario Extension Notes, 2000).
The Environment Canada Guideline also notes that for forest plants that do not disperse broadly or quickly, preservation of some relatively undisturbed large forest patches is needed to sustain them because of their restricted dispersal abilities and specialized habitat requirements and to ensure continued seed or propagation sources for restored or regenerating areas nearby.
The Natural Heritage Reference Manual continues by stating that a larger size also allows woodlands to support more resilient nutrient cycles and food webs and to be big enough to permit different and important successional stages to co-exist. Small, isolated woodlands are more susceptible to the effects of blowdown, drought, disease, insect infestations, and invasions by predators and non-indigenous plants. It is also known that the viability of woodland wildlife depends not only on the characteristics of the woodland in which they reside, but also on the characteristics of the surrounding landscape where the woodland is situated. Additionally, the percentage of forest cover in the surrounding landscape, the presence of ecological barriers such as roads, the ability of various species to cross the matrix surrounding the woodland and the proximity of adjacent habitats interact with woodland size in influencing the species assemblage within a woodland.
In the Port Elmsley catchment (in 2014), one hundred and one (48 percent) of the 209 woodland patches are very small, being less than one hectare in size. Another 94 (45 percent) of the woodland patches ranging from one to less than 20 hectares in size tend to be dominated by edge-tolerant bird species. The remaining 14 (seven percent of) woodland patches range between 22 and 129 hectares in size. Thirteen of these patches contain woodland between 20 and 100 hectares and may support a few area-sensitive species and some edge intolerant species, but will be dominated by edge tolerant species.
Conversely, one (less than one percent) of the 209 woodland patches in the drainage area exceed the 100 plus hectare size needed to support most forest dependent, area sensitive birds and are large enough to support approximately 60 percent of edge-intolerant species. No patch tops 200 hectares, which according to the Environment Canada Guideline will support 80 percent of edge-intolerant forest bird species (including most area sensitive species) that prefer interior forest habitat conditions.
Table 9 presents a comparison of woodland patch size in 2008 and 2014 along with any changes that have occurred over that time. A decrease (of one hectare) has been observed in the overall woodland patch area between the two reporting periods with most change occurring in the 20 to 50 woodland patch size class range. Seven new woodland patches have been created as a result of the forest loss/gain portrayed in Figure 49, some of which has resulted in an increase in forest fragmentation across the catchment.
Table 9 Woodland patches in the Port Elmsley catchment (2008 and 2014)
Woodland Patch Size Range (ha)
Woodland* Patches
Patch Change
2008
2014
2008 to 2014
Number
Area
Number
Area
Number
Area
Count
%
Ha
%
Count
%
Ha
%
Count
Ha
Less than 1
96
48
44
4
101
48
45
4
5
1
1 to 20
92
45
439
43
94
45
440
43
2
1
20 to 50
12
6
355
35
12
6
352
35
-3
50 to 100
1
<1
50
5
1
<1
50
5
100 to 200
1
<1
130
13
1
<1
130
13
Totals
202
100
1018
100
209
100
1017
100
7
-1
*Includes treed swamps
4.2.2 Woodland (Forest) Interior Habitat
The forest interior is habitat deep within woodlands. It is a sheltered, secluded environment away from the influence of forest edges and open habitats. Some people call it the “core” or the “heart” of a woodland. The presence of forest interior is a good sign of woodland health, and is directly related to the woodland’s size and shape. Large woodlands with round or square outlines have the greatest amount of forest interior. Small, narrow woodlands may have no forest interior conditions at all. Forest interior habitat is a remnant natural environment, reminiscent of the extensive, continuous forests of the past. This increasingly rare forest habitat is now a refuge for certain forest-dependent wildlife; they simply must have it to survive and thrive in a fragmented forest landscape (Conserving the Forest Interior. Ontario Extension Notes, 2000).
The Natural Heritage Reference Manual states that woodland interior habitat is usually defined as habitat more than 100 metres from the edge of the woodland and provides for relative seclusion from outside influences along with a moister, more sheltered and productive forest habitat for certain area sensitive species. Woodlands with interior habitat have centres that are more clearly buffered against the edge effects of agricultural activities or more harmful urban activities than those without.
In the Port Elmsley catchment (in 2014), the 209 woodland patches contain 20 forest interior patches (Figure 49) that occupy seven percent (656 ha.) of the catchment land area (which is greater than the five percent of interior forest in the Tay River Subwatershed). This is below the ten percent figure referred to in the Environment Canada Guideline that is considered to be the minimum threshold for supporting edge intolerant bird species and other forest dwelling species in the landscape.
Most patches (19) have less than 10 hectares of interior forest, 11 of which have small areas of interior forest habitat less than one hectare in size. The remaining patch contains 127 hectares of interior forest. Between 2008 and 2014, there has been no change in the number and area of woodland patches containing interior habitat (Table 10).
Table 10 Woodland interior in the Port Elmsley catchment (2008 and 2014)
Woodland Interior Habitat Size Range (ha)
Woodland Interior
Interior Change
2008
2014
2008 to 2014
Number
Area
Number
Area
Number
Area
Count
Percent
Ha
Percent
Count
Percent
Ha
Percent
Count
Ha
Less than 1
12
60
3
6
11
55
3
4
-1
1 to 10
7
35
27
48
8
40
27
49
1
10 to 30
1
5
26
46
1
5
26
47
Totals
20
100
56
100
20
100
56
100
4.3 Wetland Cover
Wetlands are habitats forming the interface between aquatic and terrestrial systems. They are among the most productive and biologically diverse habitats on the planet. By the 1980s, according to the Natural Heritage Reference Manual, 68 percent of the original wetlands south of the Precambrian Shield in Ontario had been lost through encroachment, land clearance, drainage and filling.
Wetlands perform a number of important ecological and hydrological functions and provide an array of social and economic benefits that society values. Maintaining wetland cover in a watershed provides many ecological, economic, hydrological and social benefits that are listed in the Reference Manual and which may include:
contributing to the stabilization of shorelines and to the reduction of erosion damage through the mitigation of water flow and soil binding by plant roots
mitigating surface water flow by storing water during periods of peak flow (such as spring snowmelt and heavy rainfall events) and releasing water during periods of low flow (this mitigation of water flow also contributes to a reduction of flood damage)
contributing to an improved water quality through the trapping of sediments, the removal and/or retention of excess nutrients, the immobilization and/or degradation of contaminants and the removal of bacteria
providing renewable harvesting of timber, fuel wood, fish, wildlife and wild rice
contributing to a stable, long-term water supply in areas of groundwater recharge and discharge
providing a high diversity of habitats that support a wide variety of plants and animals
acting as “carbon sinks” making a significant contribution to carbon storage
providing opportunities for recreation, education, research and tourism
Historically, the overall wetland coverage within the Great Lakes basin exceeded 10 percent, but there was significant variability among watersheds and jurisdictions, as stated in the Environment Canada Guideline. In the Rideau Valley Watershed, it has been estimated that pre-settlement wetland cover averaged 35 percent using information provided by Ducks Unlimited Canada (2010) versus the 21 percent of wetland cover existing in 2014 derived from DRAPE imagery analysis.
Figure 50 Wetland cover in the Port Elmsley catchment (Historic to 2014)
This decline in wetland cover is also evident in the Port Elmsley catchment (as seen in Figure 50 and summarized in Table 11), where wetland was reported to cover 45 percent of the area prior to settlement, as compared to 20 percent in 2014. This represents a 55 percent loss of historic wetland cover. To maintain critical hydrological, ecological functions along with related recreational and economic benefits provided by these wetland habitats in the catchment, a “no net loss” of currently existing wetlands should be employed to ensure the continued provision of tangible benefits accruing from them to landowners and surrounding communities.
Table 11 Wetland cover in the Port Elmsley catchment (Historic to 2014)
Wetland Cover
Pre-settlement
2008
2014
Change - Historic to 2014
Area
Area
Area
Area
Ha
Percent
Ha
Percent
Ha
Percent
Ha
Percent
Port Elmsley
2306
45
1021
20
1033
20
-1285
-55
Tay River
n/a
n/a
15280
19
15330
19
n/a
n/a
Rideau Valley
134115
35
n/a
n/a
82076
21
-52039
-39
4.4 Shoreline Cover
The riparian or shoreline zone is that special area where the land meets the water. Well-vegetated shorelines are critically important in protecting water quality and creating healthy aquatic habitats, lakes and rivers. Natural shorelines intercept sediments and contaminants that could impact water quality conditions and harm fish habitat in streams. Well established buffers protect the banks against erosion, improve habitat for fish by shading and cooling the water and provide protection for birds and other wildlife that feed and rear young near water. A recommended target (from the Environment Canada Guideline) is to maintain a minimum 30 metre wide vegetated buffer along at least 75 percent of the length of both sides of rivers, creeks and streams.
Figure 51 shows the extent of the ‘Natural’ vegetated riparian zone (predominantly wetland/woodland features) and ‘Other’ anthropogenic cover (crop/pastureland, roads/railways, settlements) along a 30-metre-wide area of land, both sides of the shoreline of the Tay River and its tributaries in the Port Elmsley catchment.
Figure 51 Natural and other riparian land cover in the Port Elmsley catchment (2014)
This analysis shows that the riparian zone in the Port Elmsley catchment is composed of crop and pastureland (42 percent), wetland (34 percent), woodland (14 percent), settlement (four percent), meadow-thicket (four percent) and transportation routes (two percent). Along the many watercourses (including headwater streams) flowing into the Tay River in the catchment, the riparian buffer is composed of crop and pastureland (55 percent), wetland (22 percent), woodland (14 percent), meadow-thicket (four percent), settlement areas (three percent) and transportation routes (two percent). Along the Tay River itself, the riparian zone is composed of wetland (72 percent), woodland (14 percent), crop and pastureland (six percent), meadow-thicket (four percent) and settlement (four percent).
Additional statistics for the Port Elmsley catchment are presented in Tables 12, 13 and 14 and show that there has been very little change in shoreline cover from 2008 to 2014.
Table 12 Riparian land cover in the Port Elmsley catchment (2008 vs. 2014)
Riparian Land Cover
2008
2014
Change - 2008 to 2014
Area
Area
Area
Ha.
Percent
Ha.
Percent
Ha.
Percent
Crop and Pasture
178.52
41.82
177.89
41.67
-0.63
-0.15
Wetland
146.86
34.41
147.50
34.55
0.64
0.14
> Unevaluated
(86.50)
(20.27)
(87.14)
(20.41)
(0.64)
(0.14)
> Evaluated
(60.36)
(14.14)
(60.36)
(14.14)
(0.00)
(0.00)
Woodland
59.52
13.94
58.63
13.73
-0.89
-0.21
Settlement
17.59
4.12
18.60
4.36
1.01
0.24
Meadow-Thicket
15.87
3.72
15.75
3.69
-0.12
-0.03
Transportation
8.49
1.99
8.49
1.99
0.00
0.00
Table 13 Riparian land cover along the Tay River in the Port Elmsley catchment (2008 vs. 2014)
Riparian Land Cover
2008.00
2014.00
Change - 2008 to 2014
Area
Area
Area
Ha.
Percent
Ha.
Percent
Ha.
Percent
Wetland
73.66
71.85
73.84
72.03
0.18
0.18
> Unevaluated
(25.81)
(25.18)
(25.99)
(25.36)
(0.18)
(0.18)
> Evaluated
(47.85)
(46.67)
(47.85)
(46.67)
(0.00)
(0.00)
Woodland
14.57
14.21
14.38
14.03
-0.19
-0.18
Crop and Pasture
6.18
6.04
6.18
6.04
0.00
0.00
Meadow-Thicket
3.98
3.89
3.98
3.89
0.00
0.00
Settlement
3.78
3.69
3.78
3.69
0.00
0.00
Transportation
0.31
0.31
0.31
0.31
0.00
0.00
Table 14 Riparian land cover along streams in the Port Elmsley catchment (2008 vs. 2014)
5.0 Port Elmsley Catchment: Stewardship and Water Resources Protection
The RVCA and its partners are working to protect and enhance environmental conditions in the Tay River Watershed. Figure 52 shows the location of all stewardship projects completed in the Port Elmsley catchment.
Figure 52 Stewardship site locations in the Port Elmsley catchment
5.1 Rural Clean Water
The Rural Clean Water Program provides technical and financial assistance to farmers and other rural landowners, to aid in the implementation of projects that protect water quality. Funding is granted to those projects that support best management practices for application in the protection and improvement of surface and ground water resources. The program also supports climate change adaptation and low impact development projects as well as educating rural landowners about environmental stewardship of private property. Examples of supported projects include livestock exclusion fencing, controlled tile drainage, cover crops, erosion control, well related projects, and many more. For a list of eligible projects and to apply for funding, see Rural Clean Water.
In the Port Elmsley catchment from 2011 to 2016, two well decommissionings, one septic system repair, one well upgrade, one education initiative and one livestock fencing project were completed; prior to this, four livestock fencing projects, three septic system repairs, three well upgrades, two well decommissionings and one well replacement had been completed.
When combined, these projects are keeping 60.49 kilograms of Phosphorus out of our lakes, rivers and streams every year. Total value of all 19 projects is $94,803 with $39,177 of that amount funded through grant dollars from the RVCA.
5.2 Private Land Forestry
Forest cover and tree planting continues to be one of the most widely supported strategies to improve our environment. The many benefits of forest cover include carbon sequestration, flood mitigation and water quality improvement as well as providing wildlife habitat.
Through the RVCA's Trees for Tomorrow Program (and its predecessors), 18,700 trees were planted at five sites from 2011 to 2016; prior to this, 25,830 trees were planted at five sites. In total, 44,530 trees have been planted resulting in the reforestation of 24 hectares. Total project value of all ten projects in the Port Elmsley catchment is $72,353 with $50,588 of that amount coming from fundraising sources. For more information about the Program and landowner eligibility, please see the following: Tree Planting in the Rideau Valley Watershed and Trees for Tomorrow.
An additional 152 butternut trees were planted through the RVCA Butternut Recovery Program in the Port Elmsley catchment, as part of efforts to introduce healthy seedlings from tolerant butternuts into various locations across Eastern Ontario.
5.3 Shoreline Naturalization
Natural shoreline buffers rich in native plants are critically important to protecting the health of our lakes, rivers and streams. Shoreline vegetation protects water quality and aquatic habitat by intercepting potentially harmful contaminants such as nutrients, pollutants and sediment, regulating water temperatures, slowing runoff and providing important fish and wildlife habitat. Natural shorelines also help improve climate change resiliency by increasing flood storage and providing protection from erosion during extreme weather events.
As of the end of 2016, no shoreline projects had been carried out in the Port Elmsley catchment. Landowners may wish to take advantage of the RVCA's Shoreline Naturalization Program to assist them with the naturalization of their shorelines to see the benefits noted above (and more).
5.4 Valley, Stream, Wetland and Hazard Lands
The Port Elmsley catchment covers 50.9 square kilometres with 12.8 square kilometres (or 25.1 percent) of the drainage area being within the regulation limit of Ontario Regulation 174/06 (Figure 53), giving protection to wetland areas and river or stream valleys that are affected by flooding and erosion hazards.
Wetlands occupy 10 square kilometres (or 19.6 percent) of the catchment. Of these wetlands, six square kilometres (or 60 percent) are designated as provincially significant and included within the RVCA regulation limit. This leaves the remaining four square kilometres (or 40 percent) of wetlands in the catchment outside the regulated area limit.
Of the 66.6 kilometres of stream in the catchment, regulation limit mapping has been plotted along 26 kilometers of streams (representing 39 percent of all streams in the catchment). Some of these regulated streams (7.8 km) flow through regulated wetlands; the remaining 18.2 kilometres of regulated streams are located outside of those wetlands. Plotting of the regulation limit on the remaining 40.6 kilometres (or 61 percent) of streams requires identification of flood and erosion hazards and valley systems.
Within those areas of the Port Elmsley catchment subject to the regulation (limit), efforts (have been made and) continue through RVCA planning and regulations input and review to manage the impact of development (and other land management practices) in areas where “natural hazards” are associated with rivers, streams, valley lands and wetlands. For areas beyond the regulation limit, protection of the catchment’s watercourses is provided through the “alteration to waterways” provision of the regulation.
Figure 53 Regulated natural features and hazards in the Port Elmsley catchment
5.5 Vulnerable Drinking Water Areas
The Mississippi-Rideau Source Water Protection Program has mapped the southwestern boundary of the Port Elmsley catchment as a Significant Groundwater Recharge Areas and all of the catchment as a Highly Vulnerable Aquifer. This means that the nature of the overburden (thin soils, fractured bedrock) does not provide a high level of protection for the underlying groundwater making the aquifer more vulnerable to contaminants released on the surface. There are no Well-Head Protection Areas in the catchment.
The Mississippi-Rideau Source Protection Plan includes policies that focus on the protection of groundwater region-wide due to the fact that most of the region, which encompasses the Mississippi and Rideau watersheds, is considered Highly Vulnerable Aquifer. For detailed maps and policies that have been developed to protect drinking water sources, visit the Mississippi-Rideau Source Protection Region website.
6.0 Port Elmsley Catchment: Accomplishments/Activities
In-stream/Fish Habitat
Six kilometres of the Tay River in the catchment have been surveyed and 19 headwaters sites are sampled once every six years by the RVCA using the Ontario Stream Assessment Protocol.
The report "Fish Habitat of the Tay River Watershed: Existing Conditions and Opportunities for Enhancement" was prepared in 2002 by MNR, RVCA, Parks Canada and DFO. A number of specific fish habitat enhancement projects are identified in it to improve the fishery along the Tay River (see pp.93-100).
Tree Planting
44,530 trees have been planted at ten sites in the Port Elmsley catchment by the RVCA Private Land Forestry Program, resulting in the reforestation of 24 hectares.
Water Quality
The Town of Perth wastewater treatment facility is located on the south side of the Tay River, adjacent to the Tay Marsh. The outflow from the Perth sewage lagoons has impacted water downstream for decades. Outflow quality has, on the average, been within provincial limits, but inevitably has had an impact on the Tay Marsh and is one of (many) sources encouraging excessive vegetation growth in the wetland, which damages its fish and wildlife habitat. In response to concerns raised about the impact of the Town of Perth wastewater treatment facility on the Tay River and Tay Marsh, the Town has taken action over the years to reduce its effect on surface water quality in the system, which, from cursory observation has been beneficial, and more recently enhanced with an innovative phosphorus reduction system (per.comm.FoTW).
Two stream monitoring sites on the Tay River in the catchment are sampled yearly by the RVCA for 22 parameters at each location, six times a year, to assess surface chemistry water quality conditions. A decline in total phosphorus concentrations has been observed at both of these sites over the 2006-2017 period, which should be taken as a positive sign that cumulative changes on the landscape have benefited water quality conditions (including improvements made to the treatment of the Town of Perth's wastewater).
One Ontario Benthic Biomonitoring Network site on the Tay River in the catchment is sampled by the RVCA in the spring and fall of each year with three replicates, to assess instream biological water quality conditions.
Nineteen Clean Water projects were completed by the RVCA Rural Clean Water Program.
Waterway Planning and Management
The Tay Watershed Management Plan (2002) brought together a diverse group of watershed stakeholders to exchange information and opinions on the challenges facing the watershed. This forum focused the community on the need for managing the Tay Watershed, requiring positive cooperation amongst a range of stakeholders and helped develop a foundation of data and information on the watershed and resources against which later developments and trends are being measured and decisions are being made.
The Plan also led to the formation of the Friends of the Tay Watershed Association, who have been instrumental in implementing 20 of 24 management plan recommendations. In the opinion of the Association, one of the most significant measures of success for the water protection activities carried out in the Tay watershed is that there has never been a serious environmental pollution incident that threatened the area’s drinking water or its recreational waterbodies. To this day, the Friends of the Tay Watershed remain committed to preserving and enhancing the health of the Tay River watershed through their work.
Headwater and tributary streams in the Port Elmsley catchment have 40 percent of the total length of their shoreline composed of natural vegetation. This is below the 75 percent target that is recommended by experts for the catchment’s watercourses, 30 metres back from both sides of a stream, river or lake (see Section 4.4 of this report).
Thirteen of 19 sampled headwater stream sites have been modified (10 are channelized, 3 are ditched; see Section 3.4.2 of this report).
Land Cover
Land cover has changed across the catchment (2008 to 2014) largely as a result of an increase in the area of settlement (23 ha.) and wetland (12 ha.) and loss of crop and pastureland (20 ha.) and woodland (12 ha.)(see Section 4.1 of this report).
Wetlands have declined by fifty-five percent since European pre-settlement and now cover 20 percent (1033 ha.) of the catchment (in 2014). Forty-seven percent (482 ha.) of these wetlands remain unevaluated/unregulated and although they are not under imminent threat from development activity, they do remain vulnerable to drainage and land clearing activities in the absence of any regulatory and planning controls that would otherwise protect them for the many important hydrological, social, biological and ecological functions/services/values they provide to landowners and the surrounding community (see Section 4.3 of this report).
Woodlands cover 20 percent of the catchment. This is below the 30 percent of forest cover that is identified as the minimum threshold for sustaining forest birds and other woodland dependent species ( see Section 4.2 of this report) .
Water Levels
The Tay River through the Village of Port Elmsley has a history of ice damming that has resulted in overland flow through the Pointview subdivision, between the Tay River and Lower Rideau Lake.
Stream flow (high, low and base) is unrecorded and water level is measured with a manual staff gauge at the Beveridges Dam along this reach of the Tay River in the Port Elmsley catchment. .
Water Quality
Surface chemistry water quality rating along the Tay River in the Port Elmsley catchment is Good at the Tay Marsh and Village of Port Elmsley monitoring sites . No apparent water quality concerns are reported for this reach of the Tay River ( see Section 2.1 of this report).
Instream biological water quality condition in the Tay River is Fair at the Port Elmsley Road crossing . S amples shift from benthic invertebrate species that are sensitive to high organic pollution levels in the fall to species that are more tolerant of those high levels in the spring (see Section 3.3.1 of this report).
The Town of Perth wastewater treatment facility is located on the south side of the Tay River, adjacent to the Tay Marsh. The outflow from the Perth sewage lagoons has impacted water downstream for decades. Outflow quality has, on the average, been within provincial limits, but inevitably has had an impact on the Tay Marsh and is one of (many) sources encouraging excessive vegetation growth in the wetland, which damages its fish and wildlife habitat (per.comm.FoTW).
Educate waterfront property owners about fish habitat requirements, spawning timing and near-shore and in-water activities that can disturb or destroy fish habitat and spawning sites.
Work with various partners, including Drummond/North Elmsley Township, landowners and the Friends of the Tay Watershed Association on fish habitat enhancement projects in the Tay River watershed, building off of new knowledge and the recommendations as described in the report "Fish Habitat of the Tay River Watershed: Existing Conditions and Opportunities for Enhancement" (2002) prepared by MNR, RVCA, Parks Canada, and DFO.
Development
Work with approval authorities (Drummond/North Elmsley Township, Lanark County, Leeds Grenville and Lanark District Health Unit, Mississippi Rideau Septic System Office and RVCA) and landowners to consistently implement current land use planning and development policies for water quality and shoreline protection adjacent to the Tay River and headwater streams in the catchment (i.e., a minimum 30 metre development setback from water).
Explore ways and means to more effectively implement and enforce conditions of land-use planning and development approval to achieve net environmental gains (particularly with respect to rehabilitating or protecting naturally vegetated shorelines and water quality).
Encourage Committees of Adjustment to take advantage of technical and environmental information and recommendations forthcoming from planning and environmental professionals.
Ongoing education and dialogue regarding the regulatory floodplain, its implementation and the effect it has on development continues to represent an opportunity to assist the public in understanding the importance of planning, which respects this natural hazard.
Municipalities in the Tay Watershed are encouraged to strengthen natural heritage and water resources official plan policies and zoning provisions (pertaining to water setbacks, frontage and naturalized shorelines and wetland protection) where deemed appropriate.
Work with Drummond/North Elmsley Township, Lanark County and agencies to ensure that development approvals along watercourses take into consideration the protection of fish habitat (including the near-shore nursery and spawning habitat).
Utilise RVCA subwatershed and catchment reports to help develop, revise and implement official plan policies to protect surface water resources and the natural environment (including woodlands, wetlands and shoreline cover).
Land Cover
Consider reforestation of the Port Elmsley catchment to raise the current level of forest cover (at 20 percent) above the recommended 30 percent minimum threshold that is needed to sustain woodland dependent species and woodland biodiversity on the landscape. Reaching this target will also help to improve the capacity of the forests in the catchment to reduce flooding and water-borne soil erosion, store more carbon and dampen the effects of the changing climate. Take advantage of the RVCA Trees for Tomorrow Program to achieve this on idle and/or marginal land.
Establish RVCA regulation limits around the 48 percent (482 ha.) of wetlands in the catchment that are unevaluated. Doing this will help protect landowners from natural hazards including mitigating surface water flow by storing water during periods of peak flow (such as spring snowmelt and heavy rainfall events) and releasing water during periods of low flow (this mitigation of water flow reduces flood damage), as well as contributing to the stabilization of shorelines and to the reduction of soil erosion damage through water flow mitigation and plant soil binding/retention.
Shorelines
Take advantage of the RVCA Shoreline Naturalization Program to re-naturalize altered creek and stream shoreline identified in this report as “Unnatural Riparian Land Cover". Target shoreline restoration at sites shown in orange on the Riparian Land Cover map (see Figure 51 in Section 4.4 of this report). Concentrate stewardship efforts along the tributaries of the Tay River in the catchment, which have 40 percent of the total length of their shoreline composed of natural vegetation (this is below the recommended 30 metre wide, naturally vegetated shoreline buffer target to be aimed for along 75 percent of the length of the catchment’s watercourses). Other stewardship opportunities in the catchment may be determined based on septic system inspections and surface water quality monitoring results.
Promote the use of bioengineering methods (using native shrub/tree planting, fascines, live stakes) as a shoreline erosion mitigation measure as well as a cost effective alternative to shoreline hardening (with rip rap, armour stone, gabion baskets, walls).
Educate landowners about the value and importance of natural shorelines and property best management practices with respect to shoreline use and development, septic system installation and maintenance and shoreline vegetation retention and enhancement (Drummond/North Elmsley Township, Leeds Grenville and Lanark District Health Unit, Mississippi Rideau Septic System Office and RVCA).
Water Quality
Consider further investigation of the Fairinstream biological water quality rating on the Tay River in the catchment as part of a review of RVCA's Baseline and Benthic Invertebrate surface water quality monitoring.
Offer funding provided by the RVCA Rural Clean Water Program to landowners with potential projects that could improve water quality (e.g., livestock fencing, septic system repair/ replacement and streambank erosion control/stabilisation).
Educate waterfront property owners about septic system care by providing information about sewage system maintenance (i.e., when to pump out septic systems and holding talks) through initiatives such as the Septic Savvy Workshop and services provided by the Mississippi Rideau Septic System Office.
Reduce pollutant loading to the Tay River in the catchment through education about the application of shoreline, stormwater and agricultural best management practices; also consider using low impact development (LID) methods to improve the quality and reduce the amount of stormwater runoff directly reaching the river ecosystem. This will be particularly beneficial in areas with extensive impervious surfaces (i.e., asphalt, concrete, buildings, and severely compacted soils) or on sensitive shoreline properties (with steep slopes/banks, shallow/impermeable soils).
In response to concerns raised about the impact of the Town of Perth wastewater treatment facility on the Tay River and Tay Marsh, the Town has taken action over the years to reduce its effect on surface water quality in the system, which, from cursory observation has been beneficial, and more recently enhanced with an innovative phosphorus reduction system (per.comm.FoTW).
Water Levels
Install stream flow and water level instrumentation along this reach of the Tay River in the Port Elmsley catchment.
The Friends of the Tay Watershed Association has developed the Tay Net (Tay Waterway Communication Network) over the past two years to provide early notice of significant changes in water level along the Tay River. Tay Net is now developing it into a ‘Riverwatch’ program for the waterway.*
The RVCA produces individual reports for 14 catchments in the Tay River subwatershed. Using data collected and analyzed by the RVCA through its watershed monitoring and land cover classification programs, surface water quality and in-stream conditions are reported for the Tay River, Tay Watershed lakes and Tay tributaries along with a summary of environmental conditions for the surrounding countryside every six years, which includes analysis of data collected through the programs along with local information provided by stakeholders up to 2017.
This information is used to better understand the effects of human activity on our water resources, allows us to better track environmental change over time and helps focus watershed management actions where they are needed the most to help sustain the ecosystem services (cultural, aesthetic and recreational values; provisioning of food, fuel and clean water; regulation of erosion/natural hazard protection and water purification; supporting nutrient/water cycling and habitat provision) provided by the catchment’s lands and forests and waters (Millennium Ecosystem Assessment 2005).
The following sections of this report are a compilation of that work for the Perth catchment.
21.4 square kilometres; occupies 2.7 percent of the Tay River subwatershed; 0.5 percent of the Rideau Valley watershed.
Geology/Physiography
The Perth catchment resides predominantly within the physiographic region known as the Smith Falls Limestone Plain, which is a broad flat poorly drained region underlain by thin soils, dolostone and sandstone. A veneer of glacial drift (glacial till, sand etc.) overlies the bedrock and a number of geologic faults may run through this catchment.
Municipal Coverage
Drummond/North Elmsley Township: (13.2 km2; 62% of catchment)
Town of Perth (7.9 km2; 37% of catchment)
Tay Valley Township (0.2 km2; 1% of catchment)
Stream Length
All watercourses (including headwater streams): 35.1 km
1.2 Vulnerable Areas
Aquifer Vulnerability
Mississippi-Rideau Source Water Protection program has mapped only one very small part of this catchment as a Significant Groundwater Recharge Areas and all of the catchment as a Highly Vulnerable Aquifer (HVA). There are no Well-Head Protection Areas in the catchment.
Wetland Hydrology
A watershed model developed by the RVCA in 2009 was used to study the hydrologic function of wetlands in the Rideau Valley Watershed, including those found in the Perth catchment.
1.3 Conditions at a Glance
Aggregates
One aggregate license in the Perth catchment.
Fish Community/Thermal Regime
Warm and cool water recreational and baitfish fishery with 27 species observed in the Tay River during 2017.
Headwater Drainage Features
Multiple classifications of headwaters containing wetland, natural and undefined features along with historical modifications in the form of straightening (i.e., channelization).
Instream/Riparian Habitat
Tay River: Low to high habitat complexity was identified along the Tay River in the catchment. Regions with increased habitat complexity were observed in the upper and middle reaches of the system. Dissolved oxygen conditions along the system are fairly uniform for both warm and coolwater fish species.
Land Cover Change (2008 to 2014)
Catchment
Woodland
Crop-Pasture
Settlement
Aggregate
Hectares
-7
-4
+10
+1
Land Cover Change - Town of Perth (2008 to 2014)
Town
Crop-Pasture
Woodland
Meadow-Thicket
Settlement
Hectares
-6
-2
-1
+9
Land Cover Type - Perth Catchment (2014)
Catchment
Wetland
Settlement
Crop-Pasture
Woodland
Transportation
Meadow-Thicket
Water
Aggregate
Percent
32
22
22
12
7
2
1
1
Land Cover Type - Town of Perth (2014)
Town
Settlement
Wetland
Woodland
Transportation
Crop-Pasture
Meadow-Thicket
Water
Percent
37
27
12
9
9
4
2
Shoreline Cover Type (30 m. riparian area; 2014)
Catchment-Wide
Percent
Tay River - Town
Percent
Streams*
Percent
Woodland
50
Settlement
36
Wetland
62
Wetland
39
Woodland
23
Crop-Pasture
16
Settlement
4
Wetland
19
Woodland
8
Crop-Pasture
3
Transportation
13
Settlement
6
MeadowThicket
3
Meadow-Thicket
7
Transportation
5
Transportation
1
Crop-Pasture
1
Meadow-Thicket
2
---
---
---
---
Aggregate
1
*Excludes the Tay River
Significant Natural Features
Grants Creek Provincially Significant Wetland
Perth Long Swamp Provincially Significant Wetland
Species at Risk (Elemental Occurrence)
Status
Species at Risk
Threatened
Bobolink
Eastern Meadowlark
Water Quality (WQ) for the Protection of Aquatic Life (2006 to 2017)
Tay River
@ Rogers Rd.
@ Gore St.
@ Craig St.
WQ Rating
Fair to Good
Good
Fair to Good
Water Wells
Approximately 350 operational, private water wells are to be found in the Perth catchment. Groundwater uses are mainly domestic but also include irrigation, industrial, livestock and commercial water supplies and monitoring wells.
Wetland Cover
Perth Catchment: Wetlands are reported to have covered 57 percent of the Perth catchment prior to European settlement, as compared to 32 percent (or 6.8 square kilometres) of the area in 2014. This represents a 44 percent (or 5.4 square kilometre) loss of historic wetland cover. Sixty-three percent of the remaining wetlands are regulated leaving 37 percent (or 2.5 square kilometers) unregulated.
Town of Perth: Wetlands are reported to have covered 61 percent of the Town of Perth prior to European settlement, as compared to 26 percent (or 3.2 square kilometres) of the area in 2014. This represents a 57 percent (or 4.2 square kilometre) loss of historic wetland cover. Eighty-six percent of the remaining wetlands are regulated leaving 14 percent (or 46 ha.) unregulated.
1.4 Catchment Care
Environmental Management
The Town of Perth has an established interest and commitment to environmental stewardship (including the application of innovative, water resources best management practices) as articulated in its Official Plan (2016 Consolidation) and Strategic Plan (2015). The basic premise for community sustainability is that environmental health is critical to human beings and to the wide diversity of plant and animal species with which we co-exist. The quality of our communities and standard of living depends on the air we breathe and the water that we drink, as well as the quality of the soil in the backyards where we play and in the fields and gardens from which our food is produced. In the coming years, human prosperity will depend on the health of the natural environment and the quality of human managed spaces.
The Town of Perth's vision for development embraces the concept of sustainable development through land use and infrastructure development decisions and operational practices that integrate human needs with the natural and built environment. Land use approvals and infrastructure redevelopment decisions will include sustainable design measures for transportation, infrastructure, waste management, energy systems and will strive for the efficient use of natural resources and preservation of historic, cultural and natural heritage features. The vision intends to be adaptive to innovative design and human activities that support sustainability.
The Town of Perth has completed a number of significant water resources projects to protect the surface water quality of the Tay River, in keeping with its vision for sustainable development and commitment to environmental stewardship, including:
enhanced removal of total suspended solids during the treatment of drinking water at the Town's water treatment facility, which meets the provincial standard for water discharged to the Tay River (see Section 6.0 of this report)
an intensive wet weather flow reduction program (e.g., sewer repairs/sealing; combined sewer elimination), which has reduced average inflows to the Town's wastewater lagoon system
enhanced polishing of sewage waste from the Town's existing wastewater lagoon system using the SAGR system (see Section 6.0 of this report)
Development in, and adjacent to, the Perth Long Swamp and Grants Creek Provincially Significant Wetlands in the catchment are subject to Ontario Regulation 174-06 (entitled “Development, Interference with Wetlands and Alterations to Shorelines and Watercourses”) that protects the hydrologic function of the wetland and also protects landowners and their property from natural hazards (flooding, fluctuating water table, unstable soils) associated with them.
Ten active Permits To Take Water (PTTW) are located in the southwestern part of this catchment along with one other active PTTW in its northern part, all for municipal water supply, golf course irrigation, condo heat pumps, groundwater remediation, industrial use and aggregate operations.
Several Environmental Compliance Approvals and Environmental Activity and Sector Registries were sought in this catchment for municipal drinking water systems and sewage works along with construction dewatering.
Environmental Monitoring
Town of Perth actively monitors surface water released to the Tay River as part of the Town's commitment to applying best environmental management practices through the treatment of its drinking water and sanitary/storm sewer discharge.
Chemical surface (in-stream) water quality collection by the RVCA since 2003 (see Section 2.1 of this report).
Fish survey and stream characterization survey by the RVCA on the Tay River in 2017 included taking measurements and recording observations on instream habitat, bank stability, other attributes and preparing a temperature profile (see Section 3 of this report).
Seven drainage feature assessments were conducted by the RVCA in 2017 at road crossings in the catchment. The protocol measures zero, first and second order headwater drainage features and is a rapid assessment method characterizing the amount of water, sediment transport, and storage capacity within headwater drainage features (see Section 3.4 of this report).
Classification of Perth catchment land cover types derived by the RVCA from colour aerial photography that was acquired during the spring of 2008 and 2014 (see Section 4.1 of this report).
Stewardship
Twenty-seven stewardship projects were completed by landowners with assistance from the RVCA (see Section 5 of this report).
Surface water quality conditions in the Perth catchment are monitored by the Rideau Valley Conservation Authority (RVCA) Baseline Water Quality Monitoring Program. The baseline water quality program focuses on streams; data is collected for 22 parameters including nutrients (total phosphorus and total Kjeldahl nitrogen), E. coli, metals (like aluminum and copper) and additional chemical/physical parameters (such as alkalinity, chlorides, pH and total suspended solids). Figure 2 shows the locations of monitoring sites in the catchment.
Figure 2 Water quality monitoring sites on the Tay River in the Perth catchment
2.1 Tay River: Water Quality Rating
Three locations are monitored for water quality within the urban portion of the Town of Perth (Figure 2). The RVCA's water quality rating ranges from "Fair" to "Good" (Table 1) along the Tay River in the catchment, as determined by the Canadian Council of Ministers of the Environment (CCME) Water Quality Index.
A "Fair" rating indicates that water quality is usually protected but is occasionally threatened or impaired; conditions sometimes depart from natural or desirable levels. "Good" indicates that only a minor degree of threat or impairment is observed and conditions rarely depart from natural or desirable levels. Each parameter is evaluated against established guidelines to determine water quality conditions. Those parameters that frequently exceed guidelines are presented below.
Data has been analyzed over the 2006-2017 period for general trends and conditions. Table 1 shows the overall rating for the monitored surface water quality sites within the catchment and Table 2 outlines the Water Quality Index (WQI) scores and their corresponding ratings. The scores at these sites are largely influenced by few high nutrient concentrations and bacterial counts. For more information on the CCME WQI, please see the Tay River Subwatershed Report.
Table 1 Water Quality Index ratings for the Tay River in the Town of Perth
Site
Location
2006-2008
2009-2011
2012-2014
2015-2017
TAY-04
Tay River at Rogers Rd.
Good (84)
Fair (69)
Good (84)
Good (90)
TAY-08
Tay River at Gore St.
Good (91)
Good (80)
Good (84)
Good (90)
TAY-19
Tay River at Craig St.
Good (81)
Fair (77)
Good (87)
Good (87)
Table 2 Water Quality Index ratings and corresponding index scores (RVCA terminology, original WQI category names in brackets)
Rating
Index Score
Very Good (Excellent)
95-100
Good
80-94
Fair
65-79
Poor (Marginal)
45-64
Very Poor (Poor)
0-44
2.1.1 Tay River: Nutrients
Total phosphorus (TP) is used as a primary indicator of excessive nutrient loading and may contribute to abundant aquatic vegetation growth and depleted dissolved oxygen levels. The Provincial Water Quality Objective (PWQO) is used as the TP Guideline and states that in streams concentrations greater than 0.030 mg/l indicate an excessive amount of TP.
Total Kjeldahl nitrogen (TKN) is used as secondary indicators of nutrient loading. RVCA uses a guideline of 0.500 mg/l to assess TKN[1] .
Tables 3 and 4 summarize average nutrient concentrations at monitored sites within the Perth catchment and show the proportion of results that meet the guidelines.
Table 3 Summary of total phosphorus results for the Perth Catchment (2006-2017).
Total Phosphorus 2006-2017
Site
Average (mg/l)
Below Guideline
No. Samples
TAY-04
0.021
88%
72
TAY-08
0.018
97%
71
TAY-19
0.020
92%
72
Table 4 Summary of total Kjeldahl nitrogen results for the Perth Catchment catchment (2006-2017).
Total Kjeldahl Nitrogen 2006-2017
Site
Average (mg/l)
Below Guideline
No. Samples
TAY-04
0.499
65%
72
TAY-08
0.462
69%
71
TAY-19
0.476
65%
72
Monitoring Site TAY-04
Site TAY-04 is the most upstream site within the Town of Perth. The majority (88 percent) of samples at this site were below the TP guideline from 2006-2017 (Figures 3 and 4). The average TP concentration in the at this site was 0.021 mg/l (Table 3), the monthly average concentrations appear higher in the spring and early summer and decline into the fall (Figure 3). In August the average concentrations exceeded the guideline (Figure 3), however this seems to be due to the influence of a single elevated sample in August 2011 (Figure 4) and does not reflect typical concentrations. Overall a decrease was observed in TP concentrations over the 2006-2017 period2.
TKN concentrations show that the bulk of results (65 percent) were also below the guideline (Figure 6, Table 4). The average concentration over the 2006-2017 period was 0.499 mg/l (Table 4); monthly averages increased from April to August, with lower concentrations observed in the fall months (Figure 5). There was no significant trend found in TKN results at this site.
Monitoring Site TAY-08
Site TAY-08 is downstream of TAY-04 and within the urban portion of Perth. TP results were low, the average concentrations was 0.018 and 97 percent of samples were below the guideline (Table 3, Figure 4). Monthly TP concentrations followed a similar pattern to upstream site TAY-04, with the highest concentrations observed from May-July, average TP concentrations did not exceed the guideline in any of the monitored months (Figure 3). A declining trend in TP concentrations was also observed in the data from this site.
The majority of TKN results were below the guideline (Figure 5 and 6), 69 percent of samples were below 0.500 mg/l (TKN Guideline) with an average concentration of 0.462 mg/l (Table 4). Average monthly concentrations were comparable and also followed a similar pattern to TAY-04 (Figure 5). No significant trend was observed in the 2006-2017 TKN dataset.
Monitoring Site TAY-19
Site TAY-19 is the most downstream site within the Town of Perth, TP concentrations are comparable to both upstream sites (TAY-04 and TAY-08) previously discussed (Figure 3). Ninety-two percent of samples at this site were below the TP guideline from 2006-2017 (Figures 3 and 4), and the average TP concentration in the at this site was 0.020 mg/l (Table 3). The monthly average concentrations were also the highest from May to July and no average monthly concentration exceeded the guideline (Figure 3). A decrease was observed in TP concentrations over the 2006-2017 period.
TKN concentrations show that the bulk of results (65 percent) were also below the guideline (Figure 6, Table 4). The average concentration over the 2006-2017 period was 0.476 mg/l (Table 4). Average monthly concentrations (Figure 5) show a similar pattern to upstream sites (TAY-04 and TAY-08) with generally comparable concentrations. No trend in TKN concentrations was observed at this site.
Figure 3 Average monthly total phosphorous concentrations in the Town of Perth catchment, 2006-2017
Figure 4 Distribution of total phosphorous concentrations in the Town of Perth catchment, 2006-2017
Figure 5 Average monthly total Kjeldahl nitrogen concentrations in the Town of Perth catchment, 2006-2017
Figure 6 Distribution of total Kjeldahl nitrogen concentrations in the Town of Perth catchment, 2006-2017
Summary of Tay River Nutrients
The data collected in this catchment provides evidence that nutrient enrichment is not a significant concern in this reach of the Tay River. Overall, the consistency in TP and TKN concentrations from TAY-04 to TAY-19 support that there is little nutrient enrichment as the Tay River flows through the Town of Perth. A declining trend in TP concentrations was also noted at all sites. This provides support that cumulative changes throughout the catchment has reduced nutrient concentrations. This should be taken as a positive sign as high nutrient concentrations can help stimulate the growth of algae blooms and other aquatic vegetation in a waterbody and deplete oxygen levels as the vegetation dies off. It is important to continue using best management practices that help prevent nutrient pollution in the Tay River; measures such as maintaining/upgrading municipal infrastructure (sanitary/stormwater sewers and water works), enhancing shoreline buffers, minimizing/discontinuing the use of fertilizers and restricting livestock access in upstream agricultural areas of the catchment.
2.1.2 Tay River E. coli
Escherichia coli (E. coli) is used as an indicator of bacterial pollution from human or animal waste; in elevated concentrations it can pose a risk to human health. The PWQO of 100 colony forming units/100 milliliters (CFU/100 ml) is used. E. coli counts greater than this guideline indicate that bacterial contamination may be a problem within a waterbody.
Table 5 summarizes the geometric mean[3] for the monitored sites within the Town of Perth catchment and shows the proportion of samples that meet the E. coli guideline of 100 CFU/100 ml. The results of the geometric mean with respect to the guideline, are shown in Figures 7 and 8 respectively.
Table 5 Summary of E. coli results for the Tay River-Town of Perth Catchment, 2006-2017.
E. coli 2006-2017
Site
Geometric Mean (CFU/100ml)
Below Guideline
No. Samples
TAY-04
80
50%
71
TAY-08
72
51%
72
TAY-11
86
46%
71
Monitoring Site TAY-04
E. coli counts at site TAY-04 indicate that counts regularly exceed the guideline of 100 CFU/100ml. Fifty percent of samples were below the guideline (Figures 7-8) and the count at the geometric mean was only 80 CFU/100ml (Table 5). Monthly E. coli counts showed that the geometric mean was highest during the warmer months and counts exceeded the guideline in June, August and September. Warm water temperatures are more favourable for bacterial growth. (Figure 7). No trend was noted in E. coli counts over the 2006-2017 period.
Monitoring Site TAY-08
Elevated E. coli counts at site downstream site TAY-08 were also common. Fifty-one percent of samples were below the guideline (Figure 8) from 2006-2017 and the count at the geometric mean was 72 CFU/100ml (Table 5). The highest counts were recorded in June and August (Figure 7). As with site TAY-09 there was no significant trend in E. coli data over the 2006-2017 period.
Monitoring Site TAY-19
E. coli counts at site TAY-19 was comparable to those upstream (TAY-04 and TAY-08). Forty-six percent of samples were below the guideline, with count of 86 CFU/100ml at the geometric mean (Table 5, Figure 8). Monthly E. coli counts were above the guideline from June-September (Figure 7). As with upstream sites, no trend was noted in E. coli counts over the 2006-2017 period.
Figure 7 Geometric mean of E. coli results in the Town of Perth catchment, 2006-2017
Figure 8 Distribution of E. coli counts in the Town of Perth catchment, 2006-2017.
Summary of Tay River Bacterial Contamination
Given the frequency of samples that exceed the guidelines and counts approaching the guideline at all three sites, there is evidence that at times bacterial pollution is a concern within this reach of the Tay River. The data is comparable between all three sites thus does not provide sufficient information to; pinpoint possible sources of pollution; Minimizing runoff from infrastructure and roadways should be a priority in this catchment, such as ongoing efforts to improve storm water management within developed areas. Best management practices such as maintaining/enhancing municipal infrastructure, enhancing shoreline buffers, limiting livestock access and minimizing runoff in both agricultural and developed areas can help to protect this reach of the Tay River into the future.
1 No Ontario guideline for TKN is presently available; however, waters not influenced by excessive organic inputs typically range from 0.100 to 0.500 mg/l, Environment Canada (1979) Water Quality Sourcebook, A Guide to Water Quality Parameters, Inland Waters Directorate, Water Quality Branch, Ottawa, Canada.
2 Trends in the data were assessed using the Mann-Kendall trend test and Sens slope statistic.
3 Type of mean or average, which indicates the central tendency or typical value of a set of numbers by using the product of their values (as opposed to the arithmetic mean which uses their sum). It is often used to summarize a variable that varies over several orders of magnitude, such as E. coli counts.
The RVCA Stream Characterization Program surveyed 4.6 kilometres (46 sections) of the Tay River in July 2017 within the Perth catchment.
In 2017 the Tay River subwatershed experienced high water levels along the Tay River and its tributaries. After moving from two years of drought conditions in 2015 and 2016 heavy rains throughout the year made 2017 the wettest year in recorded history. Precipitation was close to normal in the Tay River watershed in January, 2017. Most of the rest of the year, however, the area got much more than normal. For the year the total precipitation was over 130% of normal. The spring snowmelt peak flow was an above average 57 cubic metres per second (cms) in Perth on April 6. Flows receded there until more than 100 mm of rain fell over the first week of May causing a peak flow on May 7 of 71 cms, a flow not previously reached in the 24 years of records. Flows increased once again at the end of October as a result of another heavy rainfall totaling 124 mm over nine days that caused a considerable delay in construction of the rocky ramp replacement for the Haggart Island Dam.
Flooding along the Tay River in Stewart Park during the spring of 2017
3.1 Perth Catchment Overbank Zone
3.1.1 Riparian Land Cover Buffer Evaluation
The quality of the riparian area increases with the width, complexity and linear extent of its vegetation along a stream or creek. A complex riparian community consists of diverse plant species native to the site, with multiple age-classes providing vertical structural diversity along a watercourse.
Here is a list of watershed benefits from a healthy riparian buffer zone:
Reduces the amount of pollutants that reach the stream from surface runoff
Helps reduce and mitigates erosion
Provides a microclimate that is cooler during the summer months providing cooler water for aquatic organisms
Provides large wood structure from fallen trees and limbs that form instream cover, create pools, stabilize the streambed, and provide habitat for aquatic organisms in lower order streams
Provides habitat for terrestrial insects that drop in the stream and become food for fish and travel corridors for other terrestrial animals
Dissipates energy during flood events
Often provides the only refuge areas for fish during out-of-bank flows (behind trees, stumps, and logs)
Figure 9 demonstrates the buffer conditions of the left and right banks separately. The Tay River had a buffer of greater than 30 meters along 65 percent of the left bank and 46 percent of the right bank.
Figure 9 Riparian Buffer Evaluation along the Tay River in the Perth catchment
3.1.2 Riparian Buffer Alterations
Alterations within the riparian buffer were assessed within three distinct shoreline zones (0-5m, 5-15m, 15-30m), and evaluated based on the dominant vegetative community and/or land cover type (Figure 10). The riparian buffer zone along the Tay River was found to be dominated by forest, scrubland, wetlands and meadow conditions. There were several areas that had altered riparian zone conditions along the Tay River. These areas included shoreline modifications in the form of armour stone, wooden retaining walls, gabion baskets, concrete and rip rap. Modifications also included a number of road crossings and areas with reduced natural vegetated buffer conditions. Opportunities for shoreline buffer enhancements along the Tay River in the Town of Perth catchment should be explored and implemented where possible.
Figure 10 Riparian buffer alterations along Tay River in the Perth catchment
3.1.3 Adjacent Land Use
The RVCA’s Stream Characterization Program identifies nine different land uses along the Tay River in the Town of Perth (Figure 11). Surrounding land use is considered from the beginning to end of the survey section (100m) and up to 100m on each side of the river. Land use outside of this area is not considered for the surveys but is nonetheless part of the subwatershed and will influence the creek. Scrubland habitat was dominant at 91 percent; forest and wetlands were found along 61 percent of the surveyed sections and 11 percent meadow habitat was present along the Tay River. The remaining land use consisted of residential, recreational, industrial/commercial and infrastructure in the form of road crossings.
Figure 11 Land Use along the Tay River in the Perth catchment
3.2 Perth Catchment Shoreline Zone
3.2.1 Instream Erosion
Stream erosion is the process by which water erodes and transports sediments, resulting in dynamic flows and diverse habitat conditions. Excessive erosion can result in drastic environmental changes, as habitat conditions, water quality and aquatic life are all negatively affected. Bank stability was assessed as the overall extent of each section with “unstable” shoreline conditions. These conditions are defined by the presence of significant exposed soils/roots, minimal bank vegetation, severe undercutting, slumping or scour and potential failed erosion measures. The majority of the Tay River had no erosion observed along the majority of surveyed sections with a few small sections having low levels of erosion (Figure 12).
Figure 12 Erosion levels along the Tay River in the Perth catchment
3.2.2 Undercut Stream Banks
Stream bank undercuts can provide excellent cover habitat for aquatic life, however excessive levels can be an indication of unstable shoreline conditions. Bank undercut was assessed as the overall extent of each surveyed section with overhanging bank cover present. Figure 13 shows that the Tay River had no observed undercut banks along the majority of the system, however there were several sections in the lower reach with low levels of undercut banks.
Figure 13 Undercut stream banks along the Tay River in the Perth catchment
3.2.3 Stream Shading
Grasses, shrubs and trees all contribute towards shading a stream. Shade is important in moderating stream temperature, contributing to food supply and helping with nutrient reduction within a stream. Stream cover is assessed as the total coverage area in each section that is shaded by overhanging trees/grasses and tree canopy, at greater than 1m above the water surface. Figure 14 shows low levels of stream shading along the Tay River. Stream shading conditions were fairly uniform along the Tay River ranging from no overhead canopy cover to low levels. There were two areas along the Tay River that reached moderate levels of stream shading.
Figure 14 Stream shading along the Tay River in the Perth catchment
3.2.4 Instream Wood Structure
Forested shorelines provide essential complex habitat through the perpetual process of shoreline trees falling into the water. This continuous recruitment of trees creates a wood-based physical structure in the littoral zone that is common on natural systems. Insects, fish, amphibians, birds, and other animals have also evolved with this abundance of near shore wood and it is essential to their life cycles. With increased development along many waterways and forested lakeshores having been altered as a result wood-based physical structure in many waterbodies has been reduced. It is important to restore this essential habitat to aquatic ecosystems.
Shoreline Protection
Protects shorelines by providing a barrier from wind and wave erosion
Reduces sedimentation of the water caused by shoreline slumping due to bank erosion
Allows detritus to collect and settle on the lake or creek bed providing the substrate structure required for native aquatic vegetation to establish and outcompete invasive species
Food Source
Wood complexes are an important food source for invertebrates
Small fish feed on the abundance of invertebrates that are found around these structures
Larger fish, waterfowl and shorebirds all benefit from the abundance of invertebrates and small fish feeding around woody structures in the littoral zone
Cover
Cover from predators is essential for many fish and animals to successfully complete their life cycle
The nooks and crannies of wood complexes offer critters safety from predators while at the same time concentrating prey to make predators more efficient
Wood provides the structure on which many species must lay or attach their eggs, therefore these complexes provide quality spawning and nesting habitat
Diversity
Wood complexes in the littoral zone provide unique edge habitat along the shoreline
Edge habitats contain more species diversity and higher concentrations of species than the adjoining habitats themselves will have
Figure 15 shows that the majority of the Tay River had low levels of instream wood structure along the system. There were several stream survey sections in the upper reach which were characterized as having moderate levels of instream wood structure in the form of branches and trees along the system.
Figure 15 Instream wood structure along the Tay River in the Perth catchment
3.2.5 Overhanging Wood Structure
Trees and branches that are less than one meter from the surface of the water are defined as overhanging. Overhanging wood structure provides a food source, nutrients and shade which helps to moderate instream water temperatures. Figure 16 shows the system is variable with no overhanging branches and trees to areas that have high levels of overhanging wood structure along the Tay River.
Figure 16 Overhanging wood structure along the Tay River in the Perth catchment
3.2.6 Anthropogenic Alterations
Stream alterations are classified based on specific functional criteria associated with the flow conditions, the riparian buffer and potential human influences. Figure 17 shows fifteen percent of the Tay River remains “unaltered” with no anthropogenic alterations. Forty six percent of the Tay River was classified as natural with minor anthropogenic changes. Thirty five percent of survey sections were classified as being altered and four percent was classified as highly altered. These areas consisted of sections with shoreline modifications and road crossings.
Figure 17 Anthropogenic alterations along the Tay River in the Perth catchment
3.3 Perth Catchment Instream Aquatic Habitat
3.3.1 Habitat Complexity
Habitat complexity is a measure of the overall diversity of habitat types and features within a stream. Streams with high habitat complexity support a greater variety of species niches, and therefore contribute to greater diversity. Factors such as substrate, flow conditions (pools, riffles) and cover material (vegetation, wood structure, etc.) all provide crucial habitat to aquatic life. Habitat complexity is assessed based on the presence of boulder, cobble and gravel substrates, as well as the presence of instream wood structure.
Low to high habitat complexity was identified for the Tay River in the Town of Perth catchment (Figure 18). Regions with increased habitat complexity were observed in the upper and middle reaches of the system within the catchment.
Figure 18 Habitat complexity along the Tay River in the Perth catchment
3.3.3 Instream Substrate
Diverse substrate is important for fish and benthic invertebrate habitat because some species have specific substrate requirements and for example will only reproduce on certain types of substrate. The absence of diverse substrate types may limit the overall diversity of species within a stream. Substrate conditions were highly diverse along the Tay River with all substrate types being recorded at various locations along the system (Figure 19). Figure 20 shows the dominant substrate type observed for each section surveyed along the Tay River.
Figure 19 Instream substrate along the Tay River in the Perth catchment
Figure 20 shows the dominant substrate type along the Tay River in the Perth catchment
3.3.4 Instream Morphology
Pools and riffles are important habitat features for aquatic life. Riffles are fast flowing areas characterized by agitation and overturn of the water surface. Riffles thereby play a crucial role in contributing to dissolved oxygen conditions and directly support spawning for some fish species. They are also areas that support high benthic invertebrate populations which are an important food source for many aquatic species. Pools are characterized by minimal flows, with relatively deep water and winter/summer refuge habitat for aquatic species. Runs are moderately shallow, with unagitated surfaces of water and areas where the thalweg (deepest part of the channel) is in the center of the channel. Figure 21 shows that the Tay River is somewhat uniform; 100 percent of sections recorded runs, 57 percent pools and 7 percent riffles. Figure 22 shows where the limited riffle habitat areas were observed along the Tay River.
Figure 21 Instream morphology along the Tay River in the Perth catchment
Figure 22 Instream riffle habitat along the Tay River in the Perth catchment
3.3.5 Vegetation Type
Instream vegetation provides a variety of functions and is a critical component of the aquatic ecosystem. Aquatic plants promote stream health by:
Providing direct riparian/instream habitat
Stabilizing flows reducing shoreline erosion
Contributing to dissolved oxygen through photosynthesis
Maintaining temperature conditions through shading
For example emergent plants along the shoreline can provide shoreline protection from wave action and important rearing habitat for species of waterfowl. Submerged plants provide habitat for fish to find shelter from predator fish while they feed. Floating plants such as water lilies shade the water and can keep temperatures cool while reducing algae growth. Submerged plants were dominant in this reach of the Tay River and were observed at 100 percent of surveyed sections. Broad leaved emergents were observed in 85 percent of sections, 78 percent floating plants, 76 percent narrow leaved emergents, 72 percent of sections contained algae, 63 percent free floating, while robust emergents were present in 54 percent of the survey sections. Figure 23 depicts the plant community structure for the Tay River. Figure 24 shows the dominant vegetation type observed for each section surveyed along the Tay River in the Perth catchment.
Figure 23 Vegetation type along the Tay River in the Perth catchment
Figure 24 Dominant vegetation type along the Tay River in the Perth catchment
3.3.6 Instream Vegetation Abundance
Instream vegetation is an important factor for a healthy stream ecosystem. Vegetation helps to remove contaminants from the water, contributes oxygen to the stream, and provides habitat for fish and wildlife. Too much vegetation can also be detrimental. Figure 25 demonstrates that the Tay River had normal to common levels of vegetation recorded at 89 and 57 percent of stream surveys. Extensive levels of vegetation were observed in 59 percent of the surveyed sections, while twenty eight percent of sections had no vegetation in areas that were dominated by bedrock substrate conditions.
Figure 25 Instream vegetation abundance along the Tay River in the Perth catchment
3.3.7 Invasive Species
Invasive species can have major implications on streams and species diversity. Invasive species are one of the largest threats to ecosystems throughout Ontario and can out compete native species, having negative effects on local wildlife, fish and plant populations. Eighty nine percent of the sections surveyed along the Tay River in the Perth catchment had invasive species. The invasive species observed were common/glossy buckthorn, banded mystery snail, bull thistle, curly leafed pondweed, dog strangling vine, Eurasian milfoil, European frogbit, Himalayan balsam, honey suckle, Manitoba maple, wild parsnip and purple loosestrife. Invasive species abundance (i.e. the number of observed invasive species per section) was assessed to determine the potential range/vector of many of these species (Figure 26).
\
Figure 26 Invasive species abundance along the Tay River in the Perth catchment
3.3.8 Water Chemistry
During the stream characterization survey, a YSI probe is used to collect water chemistry information. Dissolved oxygen (DO), specific conductivity (SPC) and pH are measured at the start and end of each section.
3.3.8.1 Dissolved Oxygen
Dissolved oxygen is a measure of the amount of oxygen dissolved in water. The Canadian Environmental Quality Guidelines of the Canadian Council of Ministers of the Environment (CCME) suggest that for the protection of aquatic life the lowest acceptable dissolved oxygen concentration should be 6 mg/L for warmwater biota and 9.5 mg/L for coldwater biota (CCME, 1999). Figure 27 shows that the dissolved oxygen in Tay River supports warmwater and coolwater biota along the system. The average dissolved oxygen level observed within the Perth catchment was 7.0mg/L which meets the recommended level for warm and cool water biota.
Figure 27 Dissolved oxygen ranges along the Tay River in the Perth catchment
3.3.8.2 Conductivity
Conductivity in streams is primarily influenced by the geology of the surrounding environment, but can vary drastically as a function of surface water runoff. Currently there are no CCME guideline standards for stream conductivity; however readings which are outside the normal range observed within the system are often an indication of unmitigated discharge and/or stormwater input. The average conductivity observed within the Tay River was 198.3 µs/cm. Figure 28 shows the conductivity readings for the Tay River in the Perth catchment.
Figure 28 Specific conductivity ranges along the Tay River in the Perth catchment
3.3.8.3 pH
Based on the PWQO for pH, a range of 6.5 to 8.5 should be maintained for the protection of aquatic life. Average pH values along the Tay River were 7.4 thereby meeting the provincial standard (Figure 29).
Figure 29 pH ranges along the Tay River in the Perth catchment
3.3.8.4 Oxygen Saturation (%)
Oxygen saturation is measured as the ratio of dissolved oxygen relative to the maximum amount of oxygen that will dissolve based on the temperature and atmospheric pressure. Well oxygenated water will stabilize at or above 100% saturation, however the presence of decaying matter/pollutants can drastically reduce these levels. Oxygen input through photosynthesis has the potential to increase saturation above 100% to a maximum of 500%, depending on the productivity level of the environment. In order to represent the relationship between concentration and saturation, the measured values have been summarized into 6 classes:
Dissolved oxygen conditions for the Tay River were fairly uniform along the system for both warm and coolwater species (Figure 30).
Figure 30 A bivariate assessment of dissolved oxygen concentration (mg/L) and saturation (%) along the Tay River in the Perth catchment
3.3.8.5 Specific Conductivity Assessment
Specific conductivity (SPC) is a standardized measure of electrical conductance, collected at or corrected to a water temperature of 25⁰C. SPC is directly related to the concentration of ions in water, and is commonly influenced by the presence of dissolved salts, alkalis, chlorides, sulfides and carbonate compounds. The higher the concentration of these compounds, the higher the conductivity. Common sources of elevated conductivity include storm water, agricultural inputs and commercial/industrial effluents.
In order to summarize the conditions observed, SPC levels were evaluated as either normal, moderately elevated or highly elevated. These categories correspond directly to the degree of variation (i.e. standard deviation) at each site relative to the average across the system.
Normal levels were maintained in the middle reaches of the Tay River, however there were elevated areas in the upper and lower reaches (Figure 31). Two sections had high conductivity levels observed in the lower reach and several sections had moderate levels observed also in the lower reach.
Figure 31 Relative specific conductivity levels along the Tay River in the Perth catchment
3.3.9 Thermal Regime
Many factors can influence fluctuations in stream temperature, including springs, tributaries, precipitation runoff, discharge pipes and stream shading from riparian vegetation. Water temperature is used along with the maximum air temperature (using the Stoneman and Jones method) to classify a watercourse as either warm water, cool water or cold water. Figure 32 shows where the thermal sampling sites were located on the Tay River in the Perth catchment. Analysis of the data collected indicates that the Tay River is classified as a warm water system (Figure 33).
Figure 32 Temperature logger locations along the Tay River in the Perth catchment
Figure 33 Temperature logger data for the sites along the Tay River in the Perth catchment
Each point on the graph represents a temperature that meets the following criteria:
Sampling dates between July 1st and September 7th
Sampling date is preceded by two consecutive days above 24.5 °C, with no rain
Water temperatures are collected at 4pm
Air temperature is recorded as the max temperature for that day
3.3.10 Groundwater
Groundwater discharge areas can influence stream temperature, contribute nutrients, and provide important stream habitat for fish and other biota. During stream surveys, indicators of groundwater discharge are noted when observed. Indicators include: springs/seeps, watercress, iron staining, significant temperature change and rainbow mineral film. Figure 34 shows areas where one or more of the above groundwater indicators were observed during stream surveys and headwater assessments.
Figure 34 Groundwater indicators observed in the Perth catchment
3.3.11 Fish Community
The Perth catchment is classified as a mixed community of warm and cool water recreational and baitfish fishery with 27 species observed (Figure 35).
Figure 35 Fish community sampling observations in the Perth catchment
Table 6 contains a list of fish species observed in the Perth catcmment.
Table 6 Fish species observed in the Perth catchment
Fish Species
Scientific Name
Fish code
Historical
2015
2016
2017
banded killifish
Fundulus diaphanus
BaKil
X
X
X
black crappie
Pomoxis nigromaculatus
BlCra
X
blackchin shiner
Notropis heterodon
BcShi
X
X
blacknose dace
Rhinichthys atratulus
BnDac
X
blacknose shiner
Notropis heterolepis
BnShi
X
bluegill
Lepomis macrochirus
Blueg
X
bluntnose minnow
Pimephales notatus
BnMin
X
X
X
X
brassy minnow
Hybognathus hankinsoni
BrMin
X
brook stickleback
Culaea inconstans
BrSti
X
X
brown bullhead
Ameiurus nebulosus
BrBul
X
X
X
X
bullhead catfish hybrids
Ictaluridae family
Hy650
X
burbot
Lota lota
Burbo
X
X
carps and minnows
Cyprinidae
CA_MI
X
X
central mudminnow
Umbra limi
CeMud
X
X
X
X
common carp
Cyprinus carpio
CoCar
X
common shiner
Luxilus cornutus
CoShi
X
X
X
X
creek chub
Semotilus atromaculatus
CrChu
X
X
X
etheostoma sp.
etheostoma sp.
EthSp
X
X
X
X
fallfish
Semotilus corporalis
Fallf
X
X
X
fathead minnow
Pimephales promelas
FhMin
X
golden shiner
Notemigonus crysoleucas
GoShi
X
greater redhorse
Moxostoma valenciennesi
GrRed
X
hornyhead chub
Nocomis biguttatus
HhChu
X
X
X
largemouth bass
Micropterus salmoides
LmBas
X
X
logperch
Percina caprodes
Logpe
X
X
X
longnose dace
Rhinichthys cataractae
LnDac
X
northern pike
Esox lucius
NoPik
X
X
X
northern redbelly dace
Chrosomus eos
NRDac
X
pumpkinseed
Lepomis gibbosus
Pumpk
X
X
X
X
rock bass
Ambloplites rupestris
RoBas
X
X
X
X
shorthead redhorse
Moxostoma macrolepidotum
ShRed
X
smallmouth bass
Micropterus dolomieu
SmBas
X
X
X
sunfish family
Lepomis sp.
LepSp
X
stonecat
Noturus flavus
Stone
X
tadpole madtom
Noturus gyrinus
TaMad
X
walleye
Sander vitreus
Walle
X
white sucker
Catostomus commersonii
WhSuc
X
X
X
yellow bullhead
Ameiurus natalis
YeBul
X
X
X
X
yellow perch
Perca flavescens
YePer
X
X
TOTAL Species
21
24
13
27
RVCA staff measuring and weighing fish while sampling on the Tay River in the Perth catchment
A fyke net set along the Tay River in the Perth catchment in July of 2017
3.3.12 Migratory Obstructions
It is important to know locations of migratory obstructions because these can prevent fish from accessing important spawning and rearing habitat. Migratory obstructions can be natural or manmade, and they can be permanent or seasonal. Figure 36 shows that the Perth catchment had one weir and one man made dam on the Tay River at the time of the survey in 2017.
Figure 36 Migratory obstructions in the Perth catchment
A weir located on the Tay River in the Perth catchment
3.4 Headwater Drainage Feature Assessment
3.4.1 Headwaters Sampling Locations
The RVCA Stream Characterization program assessed Headwater Drainage Features for the Tay River catchment in 2017. This protocol measures zero, first and second order headwater drainage features (HDF). It is a rapid assessment method characterizing the amount of water, sediment transport, and storage capacity within headwater drainage features (HDF). RVCA is working with other Conservation Authorities and the Ministry of Natural Resources and Forestry to implement the protocol with the goal of providing standard datasets to support science development and monitoring of headwater drainage features. An HDF is a depression in the land that conveys surface flow. Additionally, this module provides a means of characterizing the connectivity, form and unique features associated with each HDF (OSAP Protocol, 2013). In 2017 the program sampled 7 sites at road crossings in the Perth catchment area (Figure 37).
Figure 37 Locations of the headwater sampling sites in the Perth catchment
3.4.2 Headwater Feature Type
The headwater sampling protocol assesses the feature type in order to understand the function of each feature. The evaluation includes the following classifications: defined natural channel, channelized or constrained, multi-thread, no defined feature, tiled, wetland, swale, roadside ditch and pond outlet. By assessing the values associated with the headwater drainage features in the catchment area we can understand the ecosystem services that they provide to the watershed in the form of hydrology, sediment transport, and aquatic and terrestrial functions. The headwater drainage features in the Perth catchment are highly variable. Figure 38 shows the feature type of the primary feature at the sampling locations.
Figure 38 Headwater feature types in the Perth catchment
3.4.3 Headwater Feature Flow
The observed flow condition within headwater drainage features can be highly variable depending on timing relative to the spring freshet, recent rainfall, soil moisture, etc. Flow conditions are assessed in the spring and in the summer to determine if features are perennial and flow year round, if they are intermittent and dry up during the summer months or if they are ephemeral systems that do not flow regularly and generally respond to specific rainstorm events or snowmelt. Flow conditions in headwater systems can change from year to year depending on local precipitation patterns. Figure 39 shows the observed flow condition at the sampling locations in the Perth catchment.
Figure 39 Headwater feature flow conditions in the Perth catchment
A spring photo of the headwater sample site in the Perth catchment located on Hands Road
A summer photo of the headwater sample site in the Perth catchment located on Hands Road
3.4.4 Feature Channel Modifications
Channel modifications were assessed at each headwater drainage feature sampling location. Modifications include channelization, dredging, hardening and realignments. The Perth catchment area had four features with no channel modifications observed and three features as having been historically dredged or channelized. Figure 40 shows the channel modifications observed at the sampling locations for the Perth catchment.
Figure 40 Headwater feature channel modifications in the Perth catchment
3.4.5 Headwater Feature Vegetation
Headwater feature vegetation evaluates the type of vegetation that is found within the drainage feature. The type of vegetated within the channel influences the aquatic and terrestrial ecosystem values that the feature provides. For some types of headwater features the vegetation within the feature plays a very important role in flow and sediment movement and provides wildlife habitat. The following classifications are evaluated no vegetation, lawn, wetland, meadow, scrubland and forest. Figure 41 depicts the dominant vegetation observed at the sampled headwater sites in the Perth catchment.
Figure 41 Headwater feature vegetation types in the Perth catchment
3.4.6 Headwater Feature Riparian Vegetation
Headwater riparian vegetation evaluates the type of vegetation that is found along the adjacent lands of a headwater drainage feature. The type of vegetation within the riparian corridor influences the aquatic and terrestrial ecosystem values that the feature provides to the watershed. Figure 42 depicts the type of riparian vegetation observed at the sampled headwater sites in the Perth catchment.
Figure 42 Headwater feature riparian vegetation types in the Perth catchment
3.4.7 Headwater Feature Sediment Deposition
Assessing the amount of recent sediment deposited in a channel provides an index of the degree to which the feature could be transporting sediment to downstream reaches (OSAP, 2013). Evidence of excessive sediment deposition might indicate the requirement to follow up with more detailed targeted assessments upstream of the site location to identify potential best management practices to be implemented. Sediment deposition ranged from none to substantial for the headwater sites sampled in the Perth catchment area. Figure 43 depicts the degree of sediment deposition observed at the sampled headwater sites in the Perth catchment. Sediment deposition conditions ranged from no sediment deposition to substantial.
Figure 43 Headwater feature sediment deposition in the Perth catchment
3.4.8 Headwater Feature Upstream Roughness
Feature roughness will provide a measure of the amount of materials within the bankfull channel that could slow down the velocity of water flowing within the headwater feature (OSAP, 2013). Materials on the channel bottom that provide roughness include vegetation, woody Structure and boulders/cobble substrates. Roughness can provide benefits in mitigating downstream erosion on the headwater drainage feature and the receiving watercourse by reducing velocities. Roughness also provides important habitat conditions for aquatic organisms. Figure 44 shows the feature roughness conditions at the sampling locations in the Perth catchment were highly variable ranging from minimal to extreme.
Figure 44 Headwater feature roughness in the Perth catchment
Land cover and any change in coverage that has occurred over a six-year period is summarised for the Perth catchment using spatially continuous vector data representing the catchment during the spring of 2008 and 2014. This dataset was developed by the RVCA through heads-up digitization of 20 cm DRAPE ortho-imagery at a 1:4000 scale and details the surrounding landscape using 10 land cover classes.
4.1 Perth Catchment Land Cover/Change
As shown in Table 7 and in Figure 1 (found in the Introduction section of this report), the dominant land cover type across the Perth catchment in 2014 is wetland followed by crop and pastureland and settlement.
Table 7 Land cover in the Perth catchment (2008 vs. 2014)
Land Cover
2008
2014
Change - 2008 to 2014
Area
Area
Area
Ha
Percent
Ha
Percent
Ha
Percent
Wetland **
682
32
682
32
>Evaluated
(429)
(20)
(429)
(20)
(0)
(0)
>Unevaluated
(253)
(12)
(253)
(12)
(0)
(0)
Crop and Pasture
475
22
471
22
-4
Settlement
457
21
467
22
10
1
Woodland*
275
13
268
12
-7
-1
Transportation
154
7
154
7
Meadow-Thicket
49
2
49
2
Water
27
1
27
1
Aggregate
20
1
21
1
1
* Does not include treed swamps ** Includes treed swamps
From 2008 to 2014, there was an overall change of 16 hectares (from one land cover class to another). Most of the change in the Perth catchment is a result of the conversion of crop and pastureland to settlement and woodland to crop and pastureland (Figure 45).
Figure 45 Land cover change in the Perth catchment (2014)
Table 8 provides a detailed breakdown of all land cover change that has taken place in the Perth catchment between 2008 and 2014.
Table 8 Land cover change in the Perth catchment (2008 to 2014)
Land Cover
Change - 2008 to 2014
Area
Ha.
Percent
Crop and Pasture to Settlement
8.6
53.2
Woodland to Crop and Pasture
5.2
32
Woodland to Settlement
1.5
9.6
Crop and Pasture to Aggreagte
0.6
3.9
Woodland to Aggregate
0.2
1.3
4.1.1 Town of Perth Land Cover/Change
As shown in Figure 46 and in Table 9, the dominant land cover type of all lands within the municipal boundary of the Town of Perth in 2014 is settlement followed by wetland (Grants Creek/Perth Long Swamp PSW's).
Figure 46 Land cover in the Town of Perth (2014)
Table 9 Land cover in the Town of Perth (2008 vs. 2014)
Land Cover
2008
2014
Change - 2008 to 2014
Area
Area
Area
Ha
Percent
Ha
Percent
Ha
Percent
Settlement
443
36
452
37
9
1
Wetland **
323
27
323
27
>Evaluated
(276)
(23)
(276)
(23)
(0)
(0)
>Unevaluated
(46)
(4)
(46)
(4)
(0)
(0)
Woodland*
149
12
147
12
-2
Transportation
113
9
113
9
Crop and Pasture
114
10
108
9
-6
-1
Meadow-Thicket
53
4
52
4
-1
Water
25
2
25
2
* *Does not include treed swamps ** Includes treed swamps
From 2008 to 2014, there was an overall change of nine hectares from one land cover class to another, which can be attributed to the conversion of crop and pasture, woodland and meadow-thicket to new development (e.g., commercial and residential). Figure 47 shows the areas within the Town of Perth where land cover has changed over the six years.
Figure 47 Land cover change in the Town of Perth (2008 vs. 2014)
Table 10 provides a detailed breakdown of land cover change that has occurred in the Town of Perth between 2008 and 2014.
Table 10 Land cover change in the Town of Perth (2008 vs. 2014)
Land Cover
Change - 2008 to 2014
Area
Ha.
Percent
Crop and Pasture to Settlement
6.3
66.1
Woodland to Settlement
2.3
24.0
Meadow-Thicket to Settlement
0.9
9.2
Woodland to Crop and Pasture
<0.1
0.7
4.2 Woodland Cover
In the Environment Canada Guideline (Third Edition) entitled “How Much Habitat Is Enough?” the opening narrative under the Forest Habitat Guidelines section states that prior to European settlement, forest was the predominant habitat in the Mixedwood Plains ecozone. The remnants of this once vast forest now exist in a fragmented state in many areas (including the Rideau Valley watershed) with woodland patches of various sizes distributed across the settled landscape along with higher levels of forest cover associated with features such as the Frontenac Axis (within the on-Shield areas of the Rideau Lakes and Tay River subwatersheds). The forest legacy, in terms of the many types of wildlife species found, overall species richness, ecological functions provided and ecosystem complexity is still evident in the patches and regional forest matrices (found in the Tay Rideau subwatershed and elsewhere in the Rideau Valley watershed). These ecological features are in addition to other influences which forests have on water quality and stream hydrology including reducing soil erosion, producing oxygen, storing carbon along with many other ecological services that are essential not only for wildlife but for human well-being.
The Guideline also notes that forests provide a great many habitat niches that are in turn occupied by a great diversity of plant and animal species. They provide food, water and shelter for these species - whether they are breeding and resident locally or using forest cover to help them move across the landscape. This diversity of species includes many that are considered to be species at risk. Furthermore, from a wildlife perspective, there is increasing evidence that the total forest cover in a given area is a major predictor of the persistence and size of bird populations, and it is possible or perhaps likely that this pattern extends to other flora and fauna groups. The overall effect of a decrease in forest cover on birds in fragmented landscapes is that certain species disappear and many of the remaining ones become rare, or fail to reproduce, while species adapted to more open and successional habitats, as well as those that are more tolerant to human-induced disturbances in general, are able to persist and in some cases thrive. Species with specialised-habitat requirements are most likely to be adversely affected. The overall pattern of distribution of forest cover, the shape, area and juxtaposition of remaining forest patches and the quality of forest cover also play major roles in determining how valuable forests will be to wildlife and people alike.
The current science generally supports minimum forest habitat requirements between 30 and 50 percent, with some limited evidence that the upper limit may be even higher, depending on the organism/species phenomenon under investigation or land-use/resource management planning regime being considered/used.
Perth Catchment Woodland Cover
As shown in Figure 48, 14 percent of the Perth catchment contains 268 hectares of upland forest and 43 hectares of lowland forest (treed swamps) versus the 47 percent of woodland cover in the Tay River subwatershed. This is less than the 30 percent of forest cover that is identified as the minimum threshold required to sustain forest birds according to the Guideline and which may only support less than one half of potential species richness and marginally healthy aquatic systems. When forest cover drops below 30 percent, forest birds tend to disappear as breeders across the landscape.
Figure 48 Woodland cover and interior forest in the Perth catchment (2014)
Town of Perth Woodland Cover
As shown in Figure 49, 13 percent of the Town of Perth contains 147 hectares of upland forest and 9 hectares of lowland forest (treed swamps) versus the 47 percent of woodland cover in the Tay River subwatershed. This is less than the 30 percent of forest cover that is identified as the minimum threshold required to sustain forest birds according to the Guideline and which may only support less than one half of potential species richness and marginally healthy aquatic systems. When forest cover drops below 30 percent, forest birds tend to disappear as breeders across the landscape.
Figure 49 Woodland cover and interior forest in the Town of Perth (2014)
4.2.1 Woodland (Patch) Size
According to the Ministry of Natural Resources’ Natural Heritage Reference Manual (Second Edition), larger woodlands are more likely to contain a greater diversity of plant and animal species and communities than smaller woodlands and have a greater relative importance for mobile animal species such as forest birds.
Bigger forests often provide a different type of habitat. Many forest birds breed far more successfully in larger forests than they do in smaller woodlots and some rely heavily on forest interior conditions. Populations are often healthier in regions with more forest cover and where forest fragments are grouped closely together or connected by corridors of natural habitat. Small forests support small numbers of wildlife. Some species are “area-sensitive” and tend not to inhabit small woodlands, regardless of forest interior conditions. Fragmented habitat also isolates local populations, especially small mammals, amphibians and reptiles with limited mobility. This reduces the healthy mixing of genetic traits that helps populations survive over the long run (Conserving the Forest Interior. Ontario Extension Notes, 2000).
The Environment Canada Guideline also notes that for forest plants that do not disperse broadly or quickly, preservation of some relatively undisturbed large forest patches is needed to sustain them because of their restricted dispersal abilities and specialised habitat requirements and to ensure continued seed or propagation sources for restored or regenerating areas nearby.
The Natural Heritage Reference Manual continues by stating that a larger size also allows woodlands to support more resilient nutrient cycles and food webs and to be big enough to permit different and important successional stages to co-exist. Small, isolated woodlands are more susceptible to the effects of blowdown, drought, disease, insect infestations, and invasions by predators and non-indigenous plants. It is also known that the viability of woodland wildlife depends not only on the characteristics of the woodland in which they reside, but also on the characteristics of the surrounding landscape where the woodland is situated. Additionally, the percentage of forest cover in the surrounding landscape, the presence of ecological barriers such as roads, the ability of various species to cross the matrix surrounding the woodland and the proximity of adjacent habitats interact with woodland size in influencing the species assemblage within a woodland.
Perth Catchment Woodland (Patch) Size
In the Perth catchment (in 2014), sixty-three (62 percent) of the 102 woodland patches are very small, being less than one hectare in size. Another 35 (34 percent) of the woodland patches ranging from one to less than 20 hectares in size tend to be dominated by edge-tolerant bird species. The remaining four (four percent of) woodland patches range between 22 and 56 hectares in size and may support a few area-sensitive species along with some edge intolerant species, but will be dominated by edge tolerant species.
No patch exceeds the 100 plus hectare size needed to support most forest dependent, area sensitive birds and which are large enough to support approximately 60 percent of edge-intolerant species. No patch tops 200 hectares, which according to the Environment Canada Guideline will support 80 percent of edge-intolerant forest bird species (including most area sensitive species) that prefer interior forest habitat conditions.
Table 11 presents a comparison of woodland patch size in 2008 and 2014 along with any changes that have occurred over that time in the Perth catchment. A decrease (of six hectares) has been observed in the overall woodland patch area between the two reporting periods with most change occurring in the 1 to 20 hectare woodland patch size class range.
Table 11 Woodland patches in the Perth catchment (2008 and 2014)
Woodland Patch Size Range (ha)
Woodland* Patches
Patch Change
2008
2014
2008 to 2014
Number
Area
Number
Area
Number
Area
Count
Percent
Ha
Percent
Count
Percent
Ha
Percent
Count
Ha
Less than 1
64
61
25
8
63
62
25
8
-1
1 to 20
37
35
142
44
35
34
137
44
-2
-5
20 to 50
3
3
94
30
3
3
93
30
-1
50 to 100
1
1
56
18
1
1
56
18
Totals
105
100
317
100
102
100
311
100
-3
-6
*Includes treed swamps
Town of Perth Woodland (Patch) Size
In the Town of Perth (in 2014), thirty-eight (57 percent) of the 100 woodland patches are very small, being less than one hectare in size. Another 27 (40 percent) of the woodland patches ranging from one to less than 20 hectares in size tend to be dominated by edge-tolerant bird species. The remaining two (three percent of) woodland patches are 24 and 25 hectares in size and may support a few area-sensitive species along with some edge intolerant species, but will be dominated by edge tolerant species.
No patch exceeds the 100 plus hectare size needed to support most forest dependent, area sensitive birds and which are large enough to support approximately 60 percent of edge-intolerant species. No patch tops 200 hectares, which according to the Environment Canada Guideline will support 80 percent of edge-intolerant forest bird species (including most area sensitive species) that prefer interior forest habitat conditions.
Table 12 presents a comparison of woodland patch size in 2008 and 2014 along with any changes that have occurred over that time in the Town of Perth. A decrease (of two hectares) has been observed in the overall woodland patch area between the two reporting periods, with all change occurring in the 1 to 20 hectare woodland patch size class range.
Table 12 Woodland patches in the Town of Perth (2008 and 2014)
Woodland Patch Size Range (ha)
Woodland* Patches
Patch Change
2008
2014
2008 to 2014
Number
Area
Number
Area
Number
Area
Count
Percent
Ha
Percent
Count
Percent
Ha
Percent
Count
Ha
Less than 1
38
57
15
9
38
57
15
10
1 to 20
27
40
93
59
27
40
91
58
-2
20 to 50
2
3
50
32
2
3
50
32
Totals
67
100
158
100
67
100
156
100
-2
*Includes treed swamps
4.2.2 Woodland (Forest) Interior Habitat
The forest interior is habitat deep within woodlands. It is a sheltered, secluded environment away from the influence of forest edges and open habitats. Some people call it the “core” or the “heart” of a woodland. The presence of forest interior is a good sign of woodland health, and is directly related to the woodland’s size and shape. Large woodlands with round or square outlines have the greatest amount of forest interior. Small, narrow woodlands may have no forest interior conditions at all. Forest interior habitat is a remnant natural environment, reminiscent of the extensive, continuous forests of the past. This increasingly rare forest habitat is now a refuge for certain forest-dependent wildlife; they simply must have it to survive and thrive in a fragmented forest landscape (Conserving the Forest Interior. Ontario Extension Notes, 2000).
The Natural Heritage Reference Manual states that woodland interior habitat is usually defined as habitat more than 100 metres from the edge of the woodland and provides for relative seclusion from outside influences along with a moister, more sheltered and productive forest habitat for certain area sensitive species. Woodlands with interior habitat have centres that are more clearly buffered against the edge effects of agricultural activities or more harmful urban activities than those without.
In the Perth catchment (in 2014), the 102 woodland patches contain four forest interior patches (Figure 49) that occupy less than one percent (14 hectares) of the catchment land area (which is less than the five percent of interior forest in the Tay River subwatershed).This is below the ten percent figure referred to in the Environment Canada Guideline that is considered to be the minimum threshold for supporting edge intolerant bird species and other forest dwelling species in the landscape.
All four patches have less than 10 hectares of interior forest, one of which has a small area of interior forest habitat less than one hectare in size. Between 2008 and 2014, there was no change in the area of interior forest habitat in the Perth catchment (Table 13).
Table 13 Woodland interior in the Perth catchment (2008 and 2014)
Woodland Interior Habitat Size Range (ha)
Woodland Interior
Interior Change
2008
2014
2008 to 2014
Number
Area
Number
Area
Number
Area
Count
Percent
Ha
Percent
Count
Percent
Ha
Percent
Count
Ha
Less than 1
1
25
<1
<1
1
25
<1
<1
1 to 10
3
75
14
100
3
75
14
100
Totals
4
100
14
100
4
100
14
100
Town of Perth Woodland (Forest) Interior Habitat
In the Town of Perth catchment (in 2014), the 100 woodland patches contain five forest interior patches (Figure 49) that occupy less than one percent (three hectares) of the catchment land area (which is less than the five percent of interior forest in the Tay River subwatershed).This is below the ten percent figure referred to in the Environment Canada Guideline that is considered to be the minimum threshold for supporting edge intolerant bird species and other forest dwelling species in the landscape.
Between 2008 and 2014, there was no change in the area of interior forest habitat in the catchment (Table 14).
Table 14 Woodland interior in the Town of Perth (2008 and 2014)
Woodland Interior Habitat Size Range (ha)
Woodland Interior
Interior Change
2008
2014
2008 to 2014
Number
Area
Number
Area
Number
Area
Count
Percent
Ha
Percent
Count
Percent
Ha
Percent
Count
Ha
Less than 1
4
80
<1
<1
4
80
<1
<1
1 to 10
1
20
3
100
1
20
3
100
Totals
5
100
3
100
5
100
3
100
4.3 Wetland Cover
Wetlands are habitats forming the interface between aquatic and terrestrial systems. They are among the most productive and biologically diverse habitats on the planet. By the 1980s, according to the Natural Heritage Reference Manual, 68 percent of the original wetlands south of the Precambrian Shield in Ontario had been lost through encroachment, land clearance, drainage and filling.
Wetlands perform a number of important ecological and hydrological functions and provide an array of social and economic benefits that society values. Maintaining wetland cover in a watershed provides many ecological, economic, hydrological and social benefits that are listed in the Reference Manual and which may include:
contributing to the stabilisation of shorelines and to the reduction of erosion damage through the mitigation of water flow and soil binding by plant roots
mitigating surface water flow by storing water during periods of peak flow (such as spring snowmelt and heavy rainfall events) and releasing water during periods of low flow (this mitigation of water flow also contributes to a reduction of flood damage)
contributing to an improved water quality through the trapping of sediments, the removal and/or retention of excess nutrients, the immobilization and/or degradation of contaminants and the removal of bacteria
providing renewable harvesting of timber, fuel wood, fish, wildlife and wild rice
contributing to a stable, long-term water supply in areas of groundwater recharge and discharge
providing a high diversity of habitats that support a wide variety of plants and animals
acting as “carbon sinks” making a significant contribution to carbon storage
providing opportunities for recreation, education, research and tourism
Historically, the overall wetland coverage within the Great Lakes basin exceeded 10 percent, but there was significant variability among watersheds and jurisdictions, as stated in the Environment Canada Guideline. In the Rideau Valley Watershed, it has been estimated that pre-settlement wetland cover averaged 35 percent using information provided by Ducks Unlimited Canada (2010) versus the 21 percent of wetland cover existing in 2014 derived from DRAPE imagery analysis.
Perth Catchment Wetland Cover
This decline in wetland cover is also evident in the Perth catchment (as seen in Figure 50 and summarised in Table 15), where wetland was reported to cover 57 percent of the area prior to settlement, as compared to 32 percent in 2014. This represents a 44 percent loss of historic wetland cover. To maintain critical hydrological, ecological functions along with related recreational and economic benefits provided by these wetland habitats in the catchment, a “no net loss” of currently existing wetlands should be employed to ensure the continued provision of tangible benefits accruing from them to landowners and surrounding communities.
Figure 50 Wetland cover in the Perth catchment (Historic to 2014)
Table 15 Wetland cover in the Perth catchment (Historic to 2014)
Wetland Cover
Pre-settlement
2008
2014
Change - Historic to 2014
Area
Area
Area
Area
Ha
Percent
Ha
Percent
Ha
Percent
Ha
Percent
Perth
1228
57
682
32
682
32
-546
-44
Tay River
n/a
n/a
15280
19
15330
19
n/a
n/a
Rideau Valley
134115
35
n/a
n/a
82076
21
-52039
-39
Town of Perth Wetland Cover
The decline in wetland cover, which has occurred both in the Perth catchment and in the larger Rideau Valley Watershed, is also evident in the Town of Perth (as seen in Figure 51 and summarised in Table 16), where wetland was reported to cover 61 percent of the area prior to settlement, as compared to 26 percent in 2014. This represents a 57 percent loss of historic wetland cover. To maintain critical hydrological, ecological functions along with related recreational and economic benefits provided by these wetland habitats in the catchment, a “no net loss” of currently existing wetlands should be employed to ensure the continued provision of tangible benefits accruing from them for residents of the Town of Perth and surrounding communities.
Figure 51 Wetland cover in the Town of Perth (Historic to 2014)
Table 16 Wetland cover in the Town of Perth (Historic to 2014)
Wetland Cover
Pre-settlement
2008
2014
Change - Historic to 2014
Area
Area
Area
Area
Ha
Percent
Ha
Percent
Ha
Percent
Ha
Percent
Perth
748
61
322
26
322
26
-426
-57
Tay River
n/a
n/a
15280
19
15330
19
n/a
n/a
Rideau Valley
134115
35
n/a
n/a
82076
21
-52039
-39
4.4 Shoreline Cover
The riparian or shoreline zone is that special area where the land meets the water. Well-vegetated shorelines are critically important in protecting water quality and creating healthy aquatic habitats, lakes and rivers. Natural shorelines intercept sediments and contaminants that could impact water quality conditions and harm fish habitat in streams. Well established buffers protect the banks against erosion, improve habitat for fish by shading and cooling the water and provide protection for birds and other wildlife that feed and rear young near water. A recommended target (from the Environment Canada Guideline) is to maintain a minimum 30 metre wide vegetated buffer along at least 75 percent of the length of both sides of rivers, creeks and streams.
Perth Catchment Shoreline Cover
Figure 52 shows the extent of the ‘Natural’ vegetated riparian zone (predominantly wetland/woodland features) and ‘Other’ anthropogenic cover (crop/pastureland, roads/railways, settlements) along a 30-metre-wide area of land, both sides of the shoreline of the Tay River and its tributaries in the Perth catchment.
Figure 52 Natural and other riparian land cover in the Perth catchment (2014)
This analysis shows that the riparian zone in the Perth catchment is composed of wetland (53 percent), crop and pastureland (13 percent), settlement (12 percent), woodland (11 percent), transportation routes (six percent), meadow-thicket (four percent) and aggregate extraction (one percent). Along the many watercourses (including headwater streams) flowing into the Tay River, the riparian buffer is composed of wetland (62 percent), crop and pastureland (16 percent), woodland (eight percent), settlement areas (six percent), transportation routes (five percent), meadow-thicket (two percent) and aggregate extraction (one percent). Along the Tay River within the Perth catchment, the riparian zone is composed of settlement areas (36 percent), woodland (24 percent), wetland (21 percent), transportation routes (13 percent), meadow-thicket (six percent) and crop and pastureland (less than one percent).
Riparian cover statistics for the Perth catchment are presented in Tables 17, 18, and 19 and show that there has been very little to no change in shoreline cover from 2008 to 2014.
Table 17 Riparian land cover in the Perth catchment (2008 vs. 2014)
Riparian Land Cover
2008
2014
Change - 2008 to 2014
Area
Area
Area
Ha.
Percent
Ha.
Percent
Ha.
Percent
Wetland
111.97
53.45
111.97
53.45
0.00
0.00
> Unevaluated
(53.27)
(25.43)
(53.27)
(25.43)
(0.00)
(0.00)
> Evaluated
(58.70)
(28.02)
(58.70)
(28.02)
(0.00)
(0.00)
Crop & Pasture
25.43
12.14
26.24
12.53
0.81
0.39
Settlement
24.22
11.56
24.63
11.76
0.41
0.20
Woodland
24.84
11.86
23.59
11.26
-1.25
-0.60
Transportation
12.90
6.16
12.90
6.16
0.00
0.00
Meadow-Thicket
8.43
4.03
8.43
4.03
0.00
0.00
Aggregate
1.66
0.79
1.71
0.82
0.05
0.03
Table 18 Riparian land cover along the Tay River in the Perth catchment (2008 vs. 2014)
Riparian Land Cover
2008
2014
Change - 2008 to 2014
Area
Area
Area
Ha.
Percent
Ha.
Percent
Ha.
Percent
Settlement
14.24
35.61
14.24
35.61
0.00
0.00
Woodland
9.56
23.92
9.56
23.92
0.00
0.00
Wetland
8.23
20.61
8.23
20.61
0.00
0.00
> Unevaluated
(7.45)
(18.64)
(7.45)
(18.64)
(0.00)
(0.00)
> Evaluated
(0.78)
(1.97)
(0.78)
(1.97)
(0.00)
(0.00)
Transportation
5.19
12.99
5.19
12.99
0.00
0.00
Meadow-Thicket
2.52
6.30
2.52
6.30
0.00
0.00
Crop and Pasture
0.22
0.57
0.22
0.57
0.00
0.00
Table 19 Riparian land cover along streams in the Perth catchment (2008 vs. 2014)
Riparian Land Cover
2008
2014
Change - 2008 to 2014
Area
Area
Area
Ha.
Percent
Ha.
Percent
Ha.
Percent
Wetland
101.08
61.83
101.08
61.83
0.00
0.00
> Unevaluated
(45.38)
(27.76)
(45.38)
(27.76)
(0.00)
(0.00)
>Evaluated
(55.7)
(34.07)
(55.7)
(34.07)
(0.00)
(0.00)
Crop & Pasture
24.92
15.25
25.73
15.74
0.81
0.49
Woodland
14.68
8.98
13.42
8.21
-1.26
-0.77
Settlement
9.14
5.59
9.55
5.84
0.41
0.25
Transportation
7.66
4.68
7.66
4.68
0.00
0.00
Meadow-Thicket
4.33
2.65
4.33
2.65
0.00
0.00
Aggregate
1.66
1.02
1.71
1.04
0.05
0.02
Town of Perth Shoreline Cover
Figure 53 shows the extent of the ‘Natural’ vegetated riparian zone (predominantly wetland/woodland features) and ‘Other’ anthropogenic cover (crop/pastureland, roads/railways, settlements) along a 30-metre-wide area of land, both sides of the shoreline of the Tay River and its tributaries in the Town of Perth.
Figure 53 Natural and other riparian land cover in the Town of Perth (2014)
Along the Tay Riverand Canal within the municipal limits of the Town of Perth, the riparian zone is composed of settlement areas (36 percent), woodland (23 percent), wetland (19 percent), transportation routes (13 percent), meadow-thicket (seven percent) and crop and pastureland (one percent).
Additional statistics for the Tay River and Canal in the Town of Perth are presented in Table 20 and show that there has been very little change in shoreline cover from 2008 to 2014.
Table 20 Riparian land cover along the Tay River and Canal in the Town of Perth (2008 vs. 2014)
5.0 Perth Catchment: Stewardship and Water Resources Protection
The RVCA and its partners are working to protect and enhance environmental conditions in the Tay River Watershed. Figure 54 shows the location of all stewardship projects completed in the Perth catchment.
Figure 54 Stewardship site locations in the Perth catchment
5.1 Rural Clean Water
The Rural Clean Water Program provides technical and financial assistance to farmers and other rural landowners, to aid in the implementation of projects that protect water quality. Funding is granted to those projects that support best management practices for application in the protection and improvement of surface and ground water resources. The program also supports climate change adaptation and low impact development projects as well as educating rural landowners about environmental stewardship of private property. Examples of supported projects include livestock exclusion fencing, controlled tile drainage, cover crops, erosion control, well related projects, and many more. For a list of eligible projects and to apply for funding, see Rural Clean Water.
In the Perth catchment from 2011 to 2016, three education initiatives, two well decommissionings, two well upgrades, one septic system repair, one well replacement and one windbreak/buffer were completed; prior to this, four well upgrades, one fuel handling/storage facility, one well replacement, one septic system repair and one livestock fencing project had been completed. When combined, these projects are keeping 1.21 kilograms of Phosphorus out of our rivers and streams each year. Total value of all 18 projects is $58,596 with $13,206 of that amount funded through grant dollars from the RVCA.
5.2 Private Land Forestry
Forest cover and tree planting continues to be one of the most widely supported strategies to improve our environment. The many benefits of forest cover include carbon sequestration, flood mitigation and water quality improvement as well as providing wildlife habitat. For more information about the Program and landowner eligibility, please see the following: Tree Planting in the Rideau Valley Watershed and Trees for Tomorrow.
Thirty butternut trees were planted through the RVCA Butternut Recovery Program in the catchment as part of efforts to introduce healthy seedlings from tolerant butternuts into various locations across Eastern Ontario.
5.3 Shoreline Naturalization
Natural shoreline buffers rich in native plants are critically important to protecting the health of our lakes, rivers and streams. Shoreline vegetation protects water quality and aquatic habitat by intercepting potentially harmful contaminants such as nutrients, pollutants and sediment, regulating water temperatures, slowing runoff and providing important fish and wildlife habitat. Natural shorelines also help improve climate change resiliency by increasing flood storage and providing protection from erosion during extreme weather events.
Through the RVCA’s Shoreline Naturalization Program, landowners (private and public property owners) have naturalized more than 2.3 km of shoreline in the Tay Watershed by planting over 10,563 native trees and shrubs at 96 sites since 2008.The total value of these projects is $126,000.
In the Perth catchment up till 2016, a total of 3,405 native trees and shrubs have been planted along 564 metres of shoreline at an average buffer width of eight metres for a total project value of $35,994. Since then, an additional 1,149 trees and shrubs have been planted along 200 metres of shoreline in the Perth catchment at a total value of $12,987.
A number of these projects have been undertaken in partnership with community groups (see photos below). In 2009, a naturalized shoreline demonstration site was created along the Tay River within The Town of Perth's Last Duel Park and Campground. In 2013, 45 volunteers assisted with the planting of 1,000 trees and shrubs along the shoreline at the Perth Water Treatment Plant on Sunset Blvd. In 2015, a Toronto Dominion Tree Day volunteer event was also hosted at this property with another 300 trees being planted with help from 20 plus volunteers. In 2017, RVCA partnered with Lanark County and the Lanark Municipal Trail Corporation to naturalize 12,000 square metres of idle land along the new Tay River Trail Pathway extension behind the Lanark Lodge and the Perth Community Care Centre on Christie Lake Road. Again, more than 20 community members volunteered their time to help plant over 1100 native trees and shrubs.
Shoreline naturalization demonstration along the Tay River in Last Duel Park being planted with trees in 2009
Shoreline naturalization demonstration along the Tay River in Last Duel Park after tree planting in 2009
Naturalization site at the Town of Perth Water Treatment Plant in 2013 before tree planting
Naturalization site at the Town of Perth Water Treatment Planting in 2013 after tree planting
Volunteers planting trees at the Town of Perth Water Treatment Plant on TD Tree Day in 2015
Volunteers planting trees at the Town of Perth Water Treatment Plant on TD Tree Day in 2015
Tay River Trail Pathway extension site (behind the Lanark Lodge) being planted with trees in 2017
Tay River Trail Pathway extension site (behind the Lanark Lodge) after tree planting in 2017
5.4 Fish Habitat Improvement
Tay and Little Tay River Rocky Ramps
Two rocky ramps were constructed on the Tay river (Stewart Park side channel in 2015; main stem in 2017) to replace existing structures that were in operational disrepair and causing a number of problems for residents of the Town of Perth, including flooding of Stewart Park throughout the year, erosion of the Tay River banks, degradation of gabion baskets and damage to the flow structure in Stewart Park.
The main goal of the works was to restore the 80/20 flow patterns (split) in the volume of water conveyed along the main stem of the Tay River versus that moving through the Little Tay River in Stewart Park during summer conditions. Specific design elements/enhancements built into the two new structures that were not present in the former structures include:
A fishway including step-pool sequencing
Walleye spawning material veneer in pools
Improved flow connectivity around an existing bend in the Tay River
Embedded large stones to mitigate ice flows into Stewart Park
Grading/fill to improve connectivity and remove organic laden dead zone
Low flow notch located to increase water velocities and encourage nutrient transport downstream
Naturalisation of the area to remove the hard structure of the former dam
Construction of the rocky ramps represents a significant cost saving to taxpayers estimated to be around $735,500 ($1.6 million for 2 concrete dams vs. $300,000 for 2 rocky ramps).
Tay River (main stem) Haggart Island dam in the Town of Perth (2007)
Tay River (main stem) rocky ramp installation in the Town of Perth (2017)
Tay River (Stewart Park side channel) Haggart Island dam in the Town of Perth (2007)
Tay River (Stewart Park side channel) rocky ramp installation in the Town of Perth (2015)
Funding for the two restoration projects was supplemented through a multi-party partnership between the Friends of the Tay Watershed Association, the RVCA and the Town of Perth. Friends of the Tay applied to the DFO Canada Recreational Fisheries Conservation Partnership Program and was the recipient of $90,000 in funding to assist with the installation of the Tay River rocky ramp structure.
5.5 Water Treatment
Drinking Water in the Town of Perth
The Town of Perth addressed the treatment of Process Water (organic and inorganic material returned to the Tay River) with the implementation of geotube bags. Process water is water that is laden with leaves, silt, clays, and other materials that are suspended in solution from the flocculation and filtering processes used in preparing drinking water. This material was traditionally returned to the Tay River downstream of the Water Treatment Plant intake.
Following a successful field trial and Environmental Assessment, the municipality advanced the implementation of the geotube back technology (Bishop Water Technologies- Eganville, ON) to remove solids from the discharged water. The processes involved the re-routing of process water into large porous geotextile bags that allow water to weep through the surface of the bag while retaining the solids inside the vessel. The three (3) large geotube bags are alternated daily to allow the solids enough time to dewater and consolidate throughout the seasons. One (1) of the bags is placed in a large greenhouse to allow filtering process to continue during freezing temperatures.
The municipality meets the guidelines of 15mg/l of Total Suspended Solids in the discharged water that returns to the Tay river. Since 2015 approximately 550 tonnes of solids are captured annually within the geotube system. This material is harvested from each of the geotube bags and transported to the Perth Landfill Site and used for daily cover of waste.
Sanitary in the Town of Perth
The Town of Perth completed the installation of the SAGR system (Submerged Attached Growth Reactor) at the Perth Wastewater Treatment Facility to address treatment capacity for the municipality. The SAGR (Nexom- Winnipeg, MB) is a biological process that involves aerated submerged beds that promote biological action that reduces E-coli, ammonia, and suspended solids from the wastewater discharged from the former lagoon system. Following a successful field trial in partnership with the Federation of Canadian Municipalities, the municipality constructed four (4) SAGR beds to increase treatment levels and develop capacity in Perth.
The SAGR system uses naturally-occurring biological processes that thrive in contained rock beds that are fed by air blowers to promote the breakdown of contaminates in sewage waste. The beds are fed liquid waste from the three (3) cell lagoon system and act to polish the waste before it is deposited into the Tay River. The system is designed to treat the wastewater generated from the equivalent population of 8200 people. As the population increases, the municipality can add one (1) further SAGR bed to a population of 10,500 people.
The SAGR has shown great successes with dramatic reductions of E-coli, ammonia, and suspended solids during operations in 2018 and 2019. The reductions in the system is equivalent or better than fully mechanized facilities without the use of chemicals, high energy costs, or mechanical systems.
Stormwater in the Town of Perth
The Town of Perth has been successful at securing a Small Communities Fund grant for the treatment of stormwater and the segregation of clean (rainwater, sump pump, and cooling water) from the sanitary sewer systems that have traditionally been routed into the sanitary sewer system. Though these water sources are being treated, the seasonal impacts on the sanitary sewer system has negatively impacted development capacity for Perth.
Perth has procured a Canadian product known as a CB Shield that inserts into catchbasins to reduce the velocity of stormwater and allow solids to be captured more effectively within the structure. Traditional large stormwater treatment systems require large acreage, designs, and approvals and the CB Shield is a drop-in unit that has the equivalent treatment capacity without the limitations of traditional treatment alternatives.
Perth will be installing approximately 120 treatment units at four (4) sub-watersheds directly depositing rainwater into the Tay River. The installation of these units will be installed in October/November prior to the frost/snow season to allow the treatment of stormwater early in 2020.
The additional challenge with Perth’s storm sewer system is the deposition of “clean” water from homes and businesses that direct sump pump water, roof drains, and cooling water into the sanitary sewer system. The placement of this type of water negatively affects the development capacity of Perth by increasing the annual volume of wastewater being treated at the Perth Wastewater Treatment facility. Perth was successful at implementing a new Sewer Use By-law and Sump Pump Disconnect program in 2019 to facilitate the reduction of water being placed in the sanitary sewer network. This program will financially assist homeowners by redirecting plumbing systems to the storm sewer, lawns, rain barrels, or infiltration beds to better address this volume of water in two (2) designated subdivisions in Perth.
5.5 Valley, Stream, Wetland and Hazard Lands
Perth Catchment Natural Hazards
The Perth catchment covers 21.4 square kilometres with 7.6 square kilometres (or 35.6 percent) of the drainage area being within the regulation limit of Ontario Regulation 174/06 (Figure 55), giving protection to wetland areas and river or stream valleys that are affected by flooding and erosion hazards.
Wetlands occupy seven square kilometres (or 32 percent) of the Perth catchment. Of these wetlands, four square kilometres (or 57 percent) are designated as provincially significant and included within the RVCA regulation limit. This leaves the remaining three square kilometres (or 47 percent) of wetlands in the catchment outside the regulated area limit.
Of the 35.1 kilometres of stream in the Perth catchment, regulation limit mapping has been plotted along 21.1 kilometers of streams (representing 60 percent of all streams in the catchment). Some of these regulated streams (10.2 km) flow through regulated wetlands; the remaining 10.9 kilometres of regulated streams are located outside of those wetlands. Plotting of the regulation limit on the remaining 14 kilometres (or 40 percent) of streams requires identification of flood and erosion hazards and valley systems.
Figure 55 Regulated natural features/hazards and Intake Protection Zones in the Perth catchment
Town of Perth Natural Hazards
The Town of Perth catchment covers 12.2 square kilometres with 5.4 square kilometres (or 44.3 percent) of the municipality being within the regulation limit of Ontario Regulation 174/06 (Figure 56), giving protection to wetland areas and river or stream valleys that are affected by flooding and erosion hazards.
Wetlands occupy 3.2 square kilometres (or 26 percent) of the Town of Perth. Of these wetlands, 2.8 square kilometres (or 86 percent) are designated as provincially significant and included within the RVCA regulation limit. This leaves the remaining 0.4 square kilometres (or 14 percent) of wetlands in the catchment outside the regulated area limit.
Of the 19.9 kilometres of stream (including the Tay River) in the Town of Perth, regulation limit mapping has been plotted along 18.1 kilometers of streams (representing 91 percent of all streams in the municipality). Some of these regulated streams (9.1 km) flow through regulated wetlands; the remaining 9.0 kilometres of regulated streams are located outside of those wetlands. Plotting of the regulation limit on the remaining 1.8 kilometres (or 9 percent) of streams requires identification of flood and erosion hazards and valley systems.
Figure 56 Regulated natural features/hazards and Intake Protection Zones in the Town of Perth
Within those areas of the Perth catchment (Figure 55) and the Town of Perth (Figure 56) subject to the regulation (limit), efforts (have been made and) continue through RVCA planning and regulations input and review to manage the impact of development (and other land management practices) in areas where “natural hazards” are associated with rivers, streams, valley lands and wetlands. Additionally, in areas of the Town of Perth where new development is planned (for the former golf course lands and annexed lands north of Dufferin St.), significant effort is made through land use planning and development control processes and carefully planned stormwater management systems, initially guided by master drainage planning and integrated subwatershed planning, to address the natural heritage, natural hazards and source/water quality policies presented in the Town of Perth Official Plan. Also, within areas beyond the regulation limit, protection of the catchment’s watercourses is provided through the “alteration to waterways” provision of the RVCA regulation.
5.6 Vulnerable Drinking Water Areas
The Town of Perth’s municipal drinking water Intake Protection Zone (IPZ), specifically IPZ-1 and 2 with vulnerability scores of 8, 9 and 10 are found within the Perth catchment (Figures 55, 56). As per the Mississippi-Rideau Source Protection Plan, policies may affect future development within these areas. Under Section 59 of the Clean Water Act, 2006, future applications under the Building Code and the Planning Act may be screened by the Mississippi-Rideau Risk Management Office. Depending on the proposed activity, additional requirements or restrictions may apply. For more information, please contact the Mississippi-Rideau Risk Management Office at (613) 692-3571.
In addition, the Mississippi-Rideau Source Protection Plan has mapped a small area of the Perth catchment as within a Significant Groundwater Recharge Area and identified all of the catchment as a Highly Vulnerable Aquifer. This means that the nature of the overburden (thin soils, fractured bedrock) does not provide a high level of protection for the underlying groundwater making the aquifer more vulnerable to contaminants released on the surface. Highly Vulnerable Aquifers characterise 89% of the Region and are considered moderate to low drinking water threats with certain policies that apply; mainly policies regarding waste disposal. All property owners are encouraged to use best management practices to protect sources of municipal drinking water. For more information on source protection best management practices, please visit Protecting Your Drinking Water.
Achievements and activities noted by the Friends of the Tay Watershed Association (FoTW) are indicated by an asterisk.*
In-stream/Fish Habitat
4.6 kilometres of the Tay River in the catchment have been surveyed and seven headwaters sites are sampled once every six years by the RVCA using the Ontario Stream Assessment Protocol.
The report "Fish Habitat of the Tay River Watershed: Existing Conditions and Opportunities for Enhancement" was prepared in 2002 by MNR, RVCA, Parks Canada and DFO. A number of specific fish habitat enhancement projects are identified in the report to improve the fishery along the Tay River (see pp. 86-92). One such project identified along the reach of the Tay River in the Town of Perth includes the refurbishment of the two Haggart Island dams. Both of these structures have now been replaced with a rocky ramp on the Little Tay River (in 2015) and another one on the Tay River (in 2017)(see section 5.4 of this report).
Shoreline Planting
The Friends of the Tay Watershed and RVCA developed the Wendy Laut Ribbon of Life demonstration area in Last Duel Park alongside the Tay River. Recently, the Perth Horticultural Society has updated the area.*
4554 native trees and shrubs have been planted along 764 metres of shoreline at various locations along the Tay River in the Town of Perth with services provided by the RVCA Shoreline Naturalization Program.
Water Quality
Drinking Water
Following a successful field trial and Environmental Assessment, the Town of Perth advanced the implementation of the geotube back technology (Bishop Water Technologies-Eganville, ON) to remove solids from the discharged water. The processes involved the re-routing of process water into large porous geotextile bags that allow water to weep through the surface of the bag while retaining the solids inside the vessel. The three (3) large geotube bags are alternated daily to allow the solids enough time to dewater and consolidate throughout the seasons. One (1) of the bags is placed in a large greenhouse to allow filtering process to continue during freezing temperatures.
The Town of Perth meets the guidelines of 15mg/l of Total Suspended Solids in the discharged water that returns to the Tay River. Since 2015 approximately 550 tonnes of solids are captured annually within the geotube system. This material is harvested from each of the geotube bags and transported to the Perth Landfill Site and used for daily cover of waste. This process also prevented process water from being conveyed and treated at the Perth Wastewater Facility, which would inherently require capital costs in piping and pump stations as well as negatively affecting development capacity for the municipality.
Sanitary
The Town of Perth wastewater treatment facility is located on the south side of the Tay River, adjacent to the Tay Marsh. The outflow from the Perth sewage lagoons has impacted water downstream for decades. Outflow quality has, on the average, been within provincial limits, but inevitably has had an impact on the Tay Marsh and is one of (many) sources encouraging excessive vegetation growth in the wetland, which damages its fish and wildlife habitat. In response to concerns raised about the impact of the Town of Perth sewage lagoons on the Tay River and Tay Marsh, the Town has taken action over the years to reduce its effect on surface water quality in the system, which, from cursory observation has been beneficial, and more recently enhanced with an innovative phosphorus reduction system.*
Further to this observation, it is stated in the Infrastructure Master Plan for the Western Annex in the Town of Perth (Jp2g Consultants, Jan.2019) that, since 2007, the Town has undergone an intensive wet weather flow reduction program, including sealing and repair work of sewers, elimination of combined sewers and sealing and elevating manholes. These efforts have successfully reduced average inflows to the lagoon and the wet weather program is continuing with further improvements expected.
Perth completed the installation of the SAGR (Submerged Attached Growth Reactor) system in the fall of 2018. This $11 million project focused on providing tertiary treatment to the Town's existing wastewater lagoon system and has also increased the development capacity of the municipality to an equivalent of 8200 residents. Results throughout 2019 have shown dramatic decreases in E-coli, ammonia, total suspended solids, and ammonia levels using the new treatment system. The SAGR uses aeration and naturally-occurring biological processes to breakdown and polish sewage waste without chemicals or the need for mechanical processes.
Stormwater
In collaboration with the Town of Perth, the Friends of the Tay Watershed sampled stormwater during the first flush of a rain event on 29 September 2015. Thirty samples were taken during this single event from six access points along the lower five blocks of the Town of Perth’s Wilson Street Stormwater Drain, from Leslie Street to Herriott Street, adjacent to the outfall into the Little Tay River. Samples were analysed for E coli, Fecal Strep, Total Suspended Solids, Phosphates, Total Kjeldahl Nitrogen, and Sodium. Additionally, temperature at capture, pH, Colour, Alkalinity and Turbidity were measured and recorded by Town of Perth Water Treatment Plant staff. Further information has been gathered about the extent of contaminant levels in local storm water in the Wilson Street Stormwater Drain. The sources of contamination appear to be from the washing of large, more heavily trafficked paved surfaces, such as parking lots and major roads. No particular trends were displayed along the length of the Drain studied. Besides indicating the sources and extent of E. coli content in the system, this assessment raises additional concerns needing further study, including the consequences of river contamination by the nutrients and suspended solids discharged with urban storm water.*
Swimming
The Friends of the Tay Watershed sampled three sites along the Tay River in 2013, all popular swimming spots in Perth. All showed high levels of E. coli after rain but not before; likely due to untreated stormwater being channelled quickly into the Tay River. Before rain event E. coli levels were higher even though temperatures were a little lower, possibly due to more and heavier rains resulting in near-flooding conditions along the Tay River and strong water currents. In mid-September 2014, three more sites were sampled by FoTW along the Tay River in Perth. Ten samples were taken in close proximity to two storm sewer outflows. Five more samples were taken farther downstream in Perth, but not near any stormwater outflows. All were taken within an hour of the start of light rain and the arithmetically averaged geometric mean from the test samples was 993 units of E. coli per 100 ml of water. All of the previously elevated E. coli counts had returned to “normal” levels close to or within the safe-to-swim limit of 100 units of E. coli per 100 ml. of water, 24 hours after the rain had stopped, with an average geometric mean of 83 E. coli per 100 ml. of water. All samples taken near the outflows were much higher than those taken some distance from any outflow. These findings complete the FoTW testing picture that shows consistently low and swimmable levels of E. coli before rain events and also within 24 hours of a rain event, but that levels of E. coli are, however, consistently higher even after a light rain and dangerously high near storm sewer outflows.*
The 2011 Perth Catchment Report and water testing records for the Town of Perth have been a major help in monitoring and determining activity in this sector. As in any urban area, Perth has an impact on the water quality in its Tay River. The Town has generally taken this seriously and attempted to mitigate it, with innovative and environmentally sensitive approaches. Both RVCA and the Friends of the Tay Watershed Association have presumably been instrumental in pointing out need and have cooperated with the Town of Perth in determining and following up actions.*
Three stream monitoring sites on the Tay River in the Town of Perth are sampled yearly by the RVCA for 22 parameters at each location, six times a year, to assess surface chemistry water quality conditions.
Eighteen Rural Clean Water Program projects were completed by the RVCA Rural Clean Water Program.
Watershed Planning and Management
The Tay Watershed Management Plan (2002) brought together a diverse group of watershed stakeholders to exchange information and opinions on the challenges facing the watershed. This forum focused the community on the need for managing the Tay Watershed, requiring positive cooperation amongst a range of stakeholders and helped develop a foundation of data and information on the watershed and resources against which later developments and trends are being measured and decisions are being made.
The Plan also led to the formation of the Friends of the Tay Watershed Association, who have been instrumental in implementing 20 of 24 management plan recommendations. In the opinion of the Association, one of the most significant measures of success for the water protection activities carried out in the Tay watershed is that there has never been a serious environmental pollution incident that threatened the area’s drinking water or its recreational waterbodies. To this day, the Friends of the Tay Watershed remain committed to preserving and enhancing the health of the Tay River watershed through their work, including:
Building an understanding of the Tay River and promoting the Tay Canal and need for its care. RVCA catchment reports have played a major role in this by documenting it and its needs.
Increasing awareness of the Tay Wildlife Reserve, helping promote the Butterfly Garden at the Reserve (in the 2009 Anniversary celebration), researching the Canal’s history and documenting it in an interpretive panel at the Reserve, and working with RVCA in placing a canoe/boat dock at the Reserve. The launch of the Tay Canal tour boat, by private individuals, was done to provide a means of bringing residents to the Tay River and Canal, and educating them about it.
Bursaries to high school students proceeding to an environment degree as well as continuing post-secondary students.
Development of interpretive panels for Source Water Protection (eg. Glen Tay catchment area) and the Tay River viewpoint (along the Tay Trail).
Environmental Awards.
Outreach to children and schools as well as the public through initiatives such as the Perth Maple Fest, the Stewart Park Festival and the Association's annual Tay Watershed Discovery Day that increases awareness of the importance of the Tay River and area lakes to the health of the Tay Watershed.
Submissions to government on regulatory reviews (eg. Climate change action; Conservation Authority Act) and the Rideau Canal Management Plan.
Support to other environmental, watershed organisations (e.g., Lake Links, Lake Networking Group).
Annexed lands to the west (a.k.a Perth golf course and TayView properties) and north (a.k.a. Blueberry Creek lands) are being prepared for future development. These areas are substantial and will pose a significant challenge to the Town of Perth and landowners proposing to develop those lands in a manner that is consistent with the Official and Strategic Plans for the Town of Perth.
Many existing waterfront properties contain existing non-conforming dwellings with respect to minimum water frontage and lot area and are often located within 30 metres of the water that require minor variances for expansion and/or reconstruction of dwellings where standard development setbacks from water are difficult to achieve. In these cases, staff at Drummond/North Elmsley Township, the Town of Perth and the Conservation Authority often meet with resistance and push back when attempts are made to implement standards for development setbacks, vegetated shorelines and septic systems.
Monitoring implementation of conditions of planning and regulatory approvals is challenging due to a lack of resources.
Headwaters/In-stream Habitat/Shorelines
Watercourses (Tay River, headwater and tributary streams) in the Perth catchment have 68 percent of the total length of their shoreline composed of natural vegetation (see Section 4.4 of this report). This is below the 75 percent target that is recommended by experts for the catchment’s watercourses, 30 metres back from both sides of a stream, river or lake.
Headwater and tributary streams (excluding the Tay River) in the Perth catchment have 72 percent of the total length of their shoreline composed of natural vegetation (see Section 4.4 of this report). This is below the 75 percent target that is recommended by experts for the catchment’s watercourses, 30 metres back from both sides of a stream, river or lake.
The Tay River flowing through the Perth catchment has 51 percent of the total length of its shoreline composed of natural vegetation (see Section 4.4 of this report). This is below the 75 percent target that is recommended by experts for the catchment’s watercourses, 30 metres back from both sides of a stream, river or lake.
The Tay River flowing through the Town of Perth (within the municipal boundary) has 49 percent of the total length of their shoreline composed of natural vegetation (see Section 4.4 of this report). This is below the 75 percent target that is recommended by experts for the catchment’s watercourses, 30 metres back from both sides of a stream, river or lake. This condition is recognized by the Friends of the Tay Watershed who note that riparian naturalisation is inadequate in some areas of the Town, including residential areas on the right bank of the Tay River and municipal owned property along its left bank in Code and Stewart Parks.
An increase in the area of settlement (0.41 ha.) and crop and pastureland (0.81 ha.) along headwater and tributary streams of the Tay River has been observed between 2008 and 2014, due to a loss of woodland.
Three of seven sampled headwater sites have been modified (two are channelized, one is a roadside ditch; see Section 3.4.2 of this report).
Land Cover
Woodlands cover 14 percent of the Perth catchment and 13 percent of the Town of Perth. This is below the 30 percent of forest cover that is identified as the minimum threshold for sustaining forest birds and other woodland dependent species (see Section 4.2 of this report).
Land cover has changed across the Perth catchment (2008 to 2014) largely as a result of an increase in the area of settlement (nine ha.) and loss of crop and pastureland (6 ha.), woodland (2 ha.) and crop and pasture (1 ha.)(see Section 4.1 of this report).
Wetlands in the Perth catchment have declined by forty-four percent since European pre-settlement and now cover 32 percent (682 ha.) of the area (Figure 50). Thirty-seven percent (253 ha.) of these wetlands remain unevaluated/unregulated and are subject to the threat from development activity, drainage and land clearing activities in the absence of any regulatory and planning controls that would otherwise protect them for the many important hydrological, social, biological and ecological functions/services/values they provide to landowners and the surrounding community (see Section 4.3 of this report).
Wetlands in the Town of Perth have declined by fifty-seven percent since European pre-settlement and now cover 26 percent (322 ha.) of the area (Figure 51). Fourteen percent (46 ha.) of these wetlands remain unevaluated/unregulated and are subject to the threat from development activity, drainage and land clearing activities in the absence of any regulatory and planning controls that would otherwise protect them for the many important hydrological, social, biological and ecological functions/services/values they provide to landowners and the surrounding community (see Section 4.3 of this report).
Water Quality
Working with staff from the Town of Perth, members of the Friends of the Tay Watershed Association sampled stormwater from the rain event on 29 September 2015 from a number of locations along the Wilson Street Stormwater Drain. Additional information was gathered about the extent of contaminant levels in the Drain's stormwater. The sources of contamination appear to be from the washing of large, more heavily trafficked paved surfaces, such as parking lots and major roads. No particular trends were displayed along the length of the Drain studied. Besides indicating the sources and extent of E. coli content in the system, this assessment raises additional concerns needing further study, including the consequences of river contamination by the nutrients and suspended solids discharged with urban storm water.
Surface chemistry water quality rating along the Tay River through the Town of Perth ranges from Fair to Good at the Rogers Road, Gore Street East and Craig Street crossings.
Instream biological water quality conditions along the Tay River through the Town of Perth are unknown because no suitable benthic invertebrate locations exist to survey in the catchment.
The Town of Perth is the focal point of the Perth catchment drainage area. It is a local and regional centre that offers employment and many important services to residents of the Town and the Tay Watershed. In the past, the Town relied heavily on its land and water resources to provide a living for town folk. This reliance continues today, albeit in a similar but somewhat different form. Furthermore, it is recognised that these land and water resources contribute to the Town's identity as a multi-faceted community with a small town atmosphere, where people like it for its size, friendliness, quietness, safety, beauty and proximity to nature. All of these factors make it a much desired place to live, work and play.
Perth has an established interest and commitment to environmental stewardship. The basic premise for community sustainability is that environmental health is critical to human beings and to the wide diversity of plant and animal species with which we co-exist. The quality of its communities and standard of living depends on the air we breathe and the water that we drink, as well as the quality of the soil in the backyards where we play and in the fields and gardens from which our food is produced. In the coming years, human prosperity will depend on the health of the natural environment and the quality of human managed spaces.
The Official Plan of the Town of Perth contains many policies to address this vision and the aspirations of Council and the citizens of the Town of Perth, who recognise that protecting and nurturing a healthy environment through environmental stewardship is a community imperative for the benefit of current citizens and as a legacy to future generations. Accordingly, land use decisions (and subsequent land management practices) should strive to find ways and means to improve or enhance the quality and vitality of both the human dominated and natural environment and should not simply maintain the status quo. The Town of Perth Strategic Plan also contains a number of strategic initiatives to support this vision.
Many of these policies are aligned with RVCA's strategic interests (as described in its 2020 Strategic Plan) and complement its watershed resources management efforts across the Rideau Valley Watershed, including those described in the Tay River Subwatershed Report (2017) and Perth Catchment Report (2017).
The introduction to this section of the report along with the following list of actions/opportunities includes a number of passages/provisions taken from the Town's Official and Strategic Plans, which are presented as actions to help Perth achieve its vision for the long-term, sustainable environmental stewardship of its land and water resources.
8.1 Development
8.1.1 Town of Perth
Perth's vision for development embraces the concept of sustainable community development through land use and infrastructure development decisions and operational practices that integrate human needs with the natural and built environment. Land use approvals and infrastructure redevelopment decisions will include sustainable design measures for transportation, infrastructure, waste management, energy systems and will strive for the efficient use of natural resources and preservation of historic, cultural and natural heritage features. The vision intends to be adaptive to innovative design and human activities that support sustainability (O.P. 1.2.17).
Perth's comprehensive and sustainable approach to development requires that new Greenfield areas and larger development sites (including the new neighbourhoods planned for the Western Annexed Lands and north of Dufferin Street) are planned in an integrated and holistic manner, which recognises and accounts for natural hazards and natural heritage systems. This includes:
8.1.1.1 Council's consideration of development in the new residential areas planned for the Town, prior to the development of existing residential areas, when the proponent submits a comprehensive plan and supporting studies that address a number of land use matters, including the following provisions addressing the Town's vision for environmental stewardship (O.P. 5.2.F):
integration of storm-water management facilities and drainage and grade controls;
conservation of natural heritage features and areas and/or measures to mitigate the impact of development on these features;
compliance with applicable Conservation Authority regulations and provincial requirements with respect to avoidance of flooding hazards; and avoidance of other natural hazards consistent with the Provincial Policy Statement.
8.1.1.2 Council's consideration of large scale development or the initial phase of development on lands with potential for additional development, whereby such applications shall submit a sustainable design report that demonstrates (O.P. 5.9.3.6.):
how a proposed development will sustain sensitive natural heritage features or retain character defining natural features of a site such has hedgerows or stands of healthy, mature, indigenous trees;
a sustainable building or project design that addresses or creates interconnectedness between natural features, the site topography, the surrounding landscape and the intended built form;
a cohesive and sequential relationship of the development project to existing or planned development on adjacent properties, including the integration of infrastructure and utilities and will include energy conservation features.
8.1.1.3 Council's use of Low Impact Development (LID) measures, including (O.P. 5.9.3.5.):
minimising excavation, compaction and grade/slope alterations;
reducing hard surfaces and increasing porous surfaces;
maximising site biomass through generous landscaping and/or retention/restoration of vegetation cover;
using runoff water on site to reduce demand for outdoor watering or to reintroduce/support naturalized habitats;
designing building envelopes to optimise the retention of natural features, retain soil and vegetation cover, reduce or minimise hard surfaces or replace with porous surfaces, retain and recycle storm-water;
reducing the consumption of water resources through low-use water fixtures, reuse of grey water/wastewater, harvesting and recycling rainwater, use of swales, using low water demand and drought resistant plants for landscaping, etc.
8.1.2 Perth Catchment
Work with approval authorities (Town of Perth, Township of Drummond/North Elmsley, Lanark County, Leeds Grenville and Lanark District Health Unit and the Mississippi Rideau Septic System Office) and waterfront property owners to consistently implement current land use planning and development policies for in-stream aquatic habitat, shoreline protection and surface water quality adjacent to, and in the Tay River and its tributaries (i.e, a minimum 30 metre development setback from water).
Explore ways and means to more effectively enforce and implement conditions of land-use planning and development approval to achieve net environmental gains (particularly with respect to rehabilitating or protecting naturally vegetated shorelines and water quality).
Encourage the Committee of Adjustment/Land Division Committee to take advantage of technical and environmental information and recommendations forthcoming from planning and environmental professionals.
Use the Tay River Subwatershed Report 2017 and this Perth Catchment Report 2017 to help develop/revise official plan policies to protect surface water resources and the natural environment (including shorelines, wetlands, woodlands and in-stream habitat).
8.2 Shorelines
8.2.1 Town of Perth
The Tay River and its tributaries, the Blue Berry Creek and Grant’s Creek, are natural heritage resources that serve an important ecological function within the watershed as well as an aesthetic enhancement to residents and visitors to the Town of Perth. Urban land uses and urban activities have compromised the ecological function of the riparian zone of the Tay and to a lesser extent its tributaries. The Official Plan provides for the restoration and rehabilitation of the shoreline of the Tay River and protection of shoreline areas through an integrated management approach. Council intends to achieve this through the application of the following Shoreline Management measures (O.P. 8.6.4.g.):
Along the shoreline of the Tay River/Canal natural vegetation will be maintained, enhanced or improved. Where alterations are proposed in shoreline areas they shall be carried out with professional advice and shall meet the requirements of the Conservation Authority and the Ministry of Natural Resources and Forestry;
Support the recovery and restoration of the ecological function of the riparian zone of all shoreline areas in the Town through public education, cooperation with programs of the Rideau Valley Conservation Authority and through site plan approvals that support the reinstatement of aquatic and wildlife habitat and linkages;
Shoreline areas in Stewart Park and the Last Duel Park should be naturalized to the greatest extent that is practical while retaining accessibility for the current level of passive and active recreational use and upholding the valued aesthetic appeal of Stewart Park. This will be achieved through a phased program of replanting using native riparian plant species; particularly when projects for restoring or rehabilitating eroded and degraded shoreline areas provide opportunity to replace artificial shoreline stabilisation measures with lower maintenance, self perpetuating, vegetation based solutions;
Reduce or replace hard surfaces adjacent to the shoreline (in instances) which lead to uncontrolled runoff into the Tay River/Canal;
Require increased setbacks from the shoreline for new buildings;
Require proponents of construction projects to prepare, implement and monitor erosion and sediment control plans as a condition of development approval;
Apply best storm-water management practices and require compliance with the storm-water management policies of this Plan;
Work with neighbouring municipalities, stewardship organisations and the public to raise public awareness of the value of shoreline management, and to implement the recommendations of the Tay River Watershed Management Plan and subsequent and related documents (Fish Habitat of the Tay River Watershed: Existing Conditions and Opportunities for Enhancement 2002; Perth Catchment Report 2017; Tay River Subwatershed Report 2017).
Council's specific requirement is that development adjacent to a water-body will (O.P. 7.7.2-3.):
Only be considered for new lots where the building and development site will be setback a minimum of 30 metres from the Shoreline Standard Elevation. Within the 30 metre setback, measures will be taken to ensure no disturbance of native soils or grades and to ensure removal of shoreline vegetation will be kept to a minimum;
Comply with zoning requirements on existing lots of record to ensure a minimum 30 metre setback from the Standard Shoreline Elevation. Where the depth of an existing lot is such that this setback cannot be applied, development similar to or smaller than the scale of existing development on adjacent lots may be considered, but shall be placed as far from the water as possible. Reconstruction should be no closer to the shoreline and no more extensive than the existing building. Enlargement of the existing building foot print should be at the minimum 30 metre setback. A lesser setback may only be considered where the vegetated portion of the lot will exceed 35 percent, and most of the shoreline setback is either covered by existing native vegetation or will be covered by ensuring restoration of native vegetation.
Consider a partnership between the Town of Perth, Perth Horticultural Society, Friends of the Tay Watershed (FoTW) Association and RVCA to publicise and promote the shoreline naturalization methods used in the Wendy Laut Ribbon of Life demonstration area in Last Duel Park to address the degraded shoreline of the Tay River in Code and Stewart Parks and privately owned lands along the right bank of the Tay River (including dissemination of information about the value of natural shorelines and riparian program assistance)(FoTW per.comm.).
8.2.2 Perth Catchment
Take advantage of the RVCA Shoreline Naturalization Program to re-naturalize altered shoreline along the Tay River and its tributary streams identified in this report as “Unnatural Riparian Land Cover". Concentrate stewardship efforts along Tay River waterfront properties shown in orange on the Riparian Land Cover map (see Figures 52-53 in Section 4.4 of this report).
Promote the use of bioengineering methods (using native shrub/tree planting, fascines, live stakes) as a shoreline erosion mitigation measure as well as a cost effective alternative to shoreline hardening (with rip rap, armour stone, gabion baskets, walls).
8.3 Water Quality and Quantity
8.3.1 Town of Perth
Council's intent is that community sustainability in the Town of Perth is to be guided by the principle of conserving and, wherever feasible, enhancing and improving the quality of surface and groundwater sources and municipal drinking water supplies (O.P. 5.9.3.1.). Specific policies to address this provision include:
8.3.1.1 Council's intent to participate in the development of a watershed management plan (Tay River Watershed Study or other such works such as the Tay River Subwatershed Report (2017) and Perth Catchment Report (2017) as a means to identify the characteristics of water resources and to develop water quality goals and targets as the basis for the long term comprehensive management of these resources. It is recognised that this will impact on current storm water management practices in the Town and may lead to development controls or restrictions designed to maintain or improve water quality (e.g. detention ponds, pre and post flow controls, vegetation standards, infiltration techniques, treatment etc.). This may also lead to the development of a master drainage plan and a series of best management practices (O.P. 5.3.B.).
8.3.1.2 Council’s policy that stormwater management shall be required for all urban development as a preventative approach (rather than relying solely on end-of-pipe quality control) to protect surface water resources. Council's specific intent regarding this matter is to utilise the following principles in its approach to stormwater management (O.P. 5.3.C.). The RVCA strongly advocates for pre-consultation during the stormwater planning and design process:
That natural hydrological characteristics are maintained, and where possible, enhanced as the means to protecting the base flow of watercourses;
That the natural infiltration of water on lands which are developed is maximised;
That proposed development will not result in increased downstream flooding or erosion or cause adverse effects on receiving waters by appropriate management of storm-water volumes and contaminant loading;
That alterations to natural drainage systems are prohibited or at least minimised by maximising the retention of natural vegetation and by leaving stream channels in their natural form;
That sanitary and storm water sewers are separated;
That fish and wildlife habitat is protected, enhanced or restored including habitat linkages where affected by the discharge or outlet of drainage facilities;
That a sustainable environmental approach is utilised in protecting water resources;
That water quality will be monitored on an ongoing basis as the means to evaluating the effectiveness of storm water management practices;
That the implications of new drainage and stormwater systems on Source Water Protection will be investigated, particularly with respect to discharges to Blueberry Creek and the Tay River along with any protection plans studies, policies or regulations established by the Province, the Town of Perth or other authorities.
8.3.1.3 Council's intent to incorporate stormwater management controls into the development review and approval process. Proponents of development will be required to plan for and undertake storm water management which complies with the above principles as well as any master drainage plan. This may require a subwatershed management plan for large tracts of land or a storm water site management plan. Proponents may utilise best management practices where they are consistent with and will achieve the Town's water quality and quantity targets (O.P. 5.3.D.).
8.3.1.4 In the interim (prior to the development of a master drainage plan), Council will expect proponents to assess the impact of the development on the receiving stream and to utilise a mix of site level, conveyance and end-of-pipe best management practices for the development (O.P. 5.3.E.).
8.3.1.5 Improvements to storm sewer mains (e.g. replacement or extensions) are anticipated as part of the regular program of maintenance by the Town and are deemed to comply with the Official Plan (O.P. 5.3.F.).
8.3.1.6 Council's cooperation with other levels of government and the private sector to upgrade drainage and storm water management systems to reduce contaminant and other discharges into the Tay River and its tributaries with priority given to discharge locations where water quality impacts are identified or the best water quality improvement outcomes can be achieved (O.P. 8.6.4.g.).
8.3.2 Perth Catchment
Consider further investigation of the Fair to Good surface chemistry water quality ratings on the Tay River at the Craig Street and Rogers Road monitoring sites, as part of a review of RVCA's Watershed Watch, Baseline and Benthic Invertebrate surface water quality monitoring.
Educate waterfront property owners living along the Tay River and its tributaries in the Perth catchment about septic system care by providing information about sewage system maintenance (i.e., when to pump out septic systems and holding talks) through initiatives such as the Septic Savvy Workshop.
Protect the water resources of the Tay River and Canal through implementation of the Town of Perth's, Township of Drummond/North Elmsley's and agency (Lanark County, Leeds Grenville and Lanark District Health Unit, Mississippi Rideau Septic System Office, MOE, MNR, RVCA) land use planning and development policies, practices and standards.
Promote efforts to reduce pollutant loadings to the Tay River and Canal through application of agricultural, shoreline, stormwater and wastewater best management practices; also consider using low impact development (LID) methods to improve the quality and reduce the amount of stormwater runoff reaching the Tay River ecosystem. This will be particularly beneficial in areas with extensive impervious surfaces (i.e., asphalt, concrete, buildings, and severely compacted soils) or on sensitive waterfront properties (with steep slopes/banks and/or shallow, impermeable soils).
Offer septic system project funding provided by the Rideau Valley Rural Clean Water Program to landowners in the Perth catchment with septic systems needing maintenance/remedial work or replacement.
8.4 Aquatic Habitat/Fisheries/Land Cover/Natural Heritage System
8.4.1 Town of Perth
The application of the Official Plan policies for natural heritage are designed to conserve the ecological values of existing significant natural heritage features and to enhance the biodiversity and integrity of natural heritage attributes such as wildlife corridors and connectivity through land use planning decisions. The intent of these policies is to strengthen the natural heritage system as an integral component of the Town’s land use pattern (O.P.8.6.1), while pursuing a program that integrates the principles of community sustainability with community development and redevelopment.The program will be guided by the following select set of initiatives and policies that the RVCA supports:
Maintaining the integrity of existing ecosystems through the conservation and improvement of habitat for flora and fauna and wildlife linkages and corridors. Existing sensitive ecosystems and wildlife corridors will be respected and to the greatest extent feasible, the intent will be to improve the biodiversity (species composition and abundance) of plant and animal species in protected areas through conservation and compensation measures implemented or assured through planning and development approvals (O.P. 5.9.3.1.ii.);
Reducing the municipality’s carbon footprint by programs to improve the health and the extent of urban forest; maximising the retention of vegetation cover, particularly tree cover and hedge rows in land and infrastructure development; also through improvements to river corridors, road allowances and parkland in the Town (O.P. 5.9.3.1.iv);
Creating/practising a Tree Planting Program for all suitable municipal properties that complement the natural environment. Consider native trees, enabling the restoration of our natural biodiversity (Perth Strategic Plan 2.6.A);
Emphasising designs that restore impaired habitats, rehabilitate brownfield sites, and conserve the continuity of existing ecosystems (O.P. 5.9.3.4.vii.);
Designing to respect or allow natural movement corridors to permit movement or migration of animals, plants and natural processes such as seasonal fauna movements or preserving water channels under built features (O.P. 5.9.3.5.vii.);
Maximising site biomass through generous landscaping and/or retention/restoration of vegetation cover (O.P. 5.9.3.5.ix.);
Avoiding or minimising adverse effects on natural heritage features from development on adjacent lands (O.P. 8.6.3.a.);
Identifying and protecting lands encompassing natural heritage features through the appropriate classification of such features and appropriate setbacks for development (O.P. 8.6.3.b.);
Ensuring appropriate impact assessment is undertaken and mitigating measures are implemented (O.P. 8.6.3.c.);
Encouraging restoration of previously disturbed lands and the establishment of adequate buffering of sensitive natural heritage features (O.P. 8.6.3.d.);
Recognising and respecting Provincially Significant Wetlands as ecosystems which are important as habitat for a variety of plant and animal species, for water quality, flood control and water storage and recharge areas and for their passive recreational value. Development and site alteration shall not be permitted in the Perth Long Swamp, the Blueberry Creek Wetland, and the Grant’s Creek Wetland. Development and site alteration shall not be permitted on adjacent lands to these significant wetlands unless it has been demonstrated through the preparation of an Environmental Impact Study (EIS) that there will be no negative impacts on the natural features or on the ecological functions for which a specific wetland area is identified (O.P. 8.6.4 b.1-2.);
Recognising that the main channel and tributaries of the Tay River/Canal, Grants Creek and Blueberry Creek watersheds within the Town contain fish habitat and shall be protected to retain their fish habitat values. Development and site alteration shall not be permitted in fish habitat except in accordance with provincial and federal requirements. Development and site alteration shall not be permitted on adjacent lands to fish habitat unless it has been demonstrated through the preparation of an Impact Assessment (EIS) that there will be no negative impacts on the natural features or on their ecological functions. In undertaking and approving development the Town will provide for a net gain of productive capacity wherever possible. More specifically, development and site alteration in and adjacent to fish habitat shall not result in: a) a net loss of fish habitat; b) the harmful alteration, disruption, degradation or destruction of fish habitat, and c) restriction of fish passage (O.P. 8.6.4 c.1-2.).
8.4.2 Perth Catchment
Educate waterfront property owners about fish habitat requirements, spawning timing and near-shore and in-water activities that can disturb or destroy fish habitat and spawning sites.
Work with various partners, including the Town of Perth, Drummond/North Elmsley Township, landowners and the Friends of the Tay Watershed Association on fish habitat enhancement projects in the Tay River watershed, building off of new knowledge and the recommendations as described in the report "Fish Habitat of the Tay River Watershed: Existing Conditions and Opportunities for Enhancement" (2002) prepared by MNR, RVCA, Parks Canada, and DFO.
Municipalities in the Perth catchment along with provincial agencies are encouraged to strengthen natural heritage and water resources official plan policies and zoning provisions (water setbacks, frontage and naturalized shorelines and wetland protection) where deemed appropriate.
8.5 Natural Hazards
8.5.1 Town of Perth
Natural and human-made hazards are conditions which may affect public health and safety. In the Town of Perth Planning Area, these include flood prone lands, areas susceptible to erosion, contaminated sites and noise and vibration. Some of these conditions exist in the natural environment, while others are human-made. The intent of the Plan is to ensure that where development occurs, it does not become a threat to public health and safety (O.P. 7.1).
Council's goal for natural and human-made hazards is to ensure that all development has a high regard for public health and safety through mitigating adverse effects (as defined in O.P. Section 10.2) or by prohibiting development in unsafe places (O.P. 7.2).
Council’s specific intent regarding flood plains is to protect the safety of residents and avoid undue damage of land through policies to control development in the flood plain, as follows (O.P. 7.3.2):
The flood plain in Perth is recognised as representing the 1:100 regulatory flood level (One Zone Concept);
Lands at or below the regulatory flood level are considered to be in the flood plain and are subject to flooding;
No new buildings are permitted to be constructed within the flood plain except flood control structures, or low impact buildings or structures such as a gazebo, dock, garden or small storage shed or utility structures, if permitted by the applicable flood plain regulation. Other public and private activities including the construction of roads, or new structures necessary for conservation, public recreation (recreational trails, tow path), water supply, waste water management, will be permitted in the flood plain subject to the approval of Council, the Conservation Authority and where deemed necessary, shall meet a flood proofing and access standard.
In areas (i.e. within the prescribed fill and construction lines shown on Schedule ‘A’, Land Use Plan) where ‘Fill, Construction and Alteration to Waterways’ regulations have been established under the Conservation Authorities Act, a permit shall be required for:
the construction, reconstruction, erection or placing of a building or structure of any kind;
any change of use to a building or structure that would have the effect of altering the use or potential use of the building or structure, increasing the size of the building or structure or increasing the number of dwelling units in the building or structure;
site grading, or
the temporary or permanent placing, dumping, or removal of any material, originating on the site elsewhere.
A permit shall also be required for changing the channel of any water body or diverting a water course.The permit shall be obtained from and to the satisfaction of the Rideau Valley Conservation Authority in addition to any permits which may be required from the Town of Perth. In general, development of any kind which limits the flood capacity or the flood way, or obstructs the flood way within any prescribed fill and construction lines shall be discouraged or prohibited.
RVCA will continue to assist and support the Town of Perth with efforts to incorporate flood-risk safety considerations into the Town’s planning and decision making processes (as per the above O.P. policies) to reduce the exposure of existing and new development to flood hazard risks associated with development in and adjacent to natural hazard areas along the Tay River and elsewhere in the catchment. To be effective, this approach will require an update to the Town of Perth Comprehensive Zoning By-Law (Oct. 2000) to clearly show the floodplain constraint on the Zoning Map or Schedule A of the ZBL along with ongoing education regarding the regulatory floodplain and dialogue about its effect on development related activity.
8.5.2 Perth Catchment
Establish RVCA regulations limits around the 38 percent (253 ha.) of wetlands in the catchment that are unevaluated. Doing this will help protect landowners from natural hazards including mitigating surface water flow by storing water during periods of peak flow (such as spring snowmelt and heavy rainfall events) and releasing water during periods of low flow (this mitigation of water flow reduces flood damage), as well as contributing to the stabilisation of shorelines and to the reduction of soil erosion damage through water flow mitigation and plant soil binding/retention.
The Friends of the Tay Watershed Association has developed the Tay Net (Tay Waterway Communication Network) over the past two years to provide early notice of significant changes in water level along the Tay River. Tay Net is now developing it into a ‘Riverwatch’ program for the waterway.
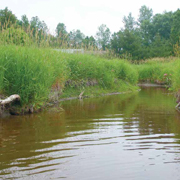


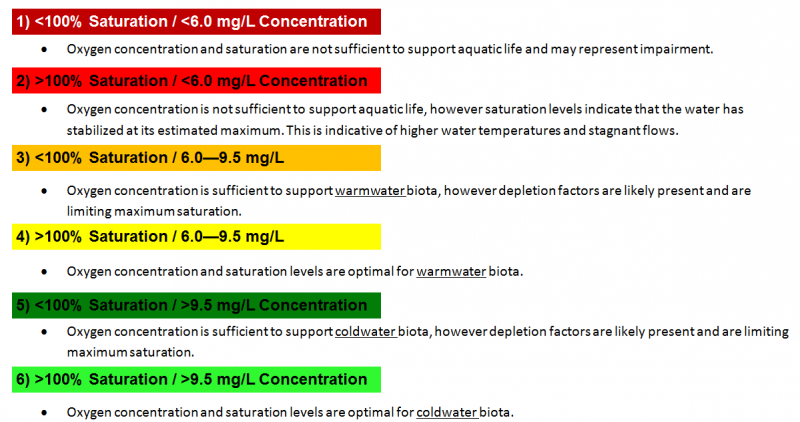
 and saturation (%) in Blueberry Creek")


")

")


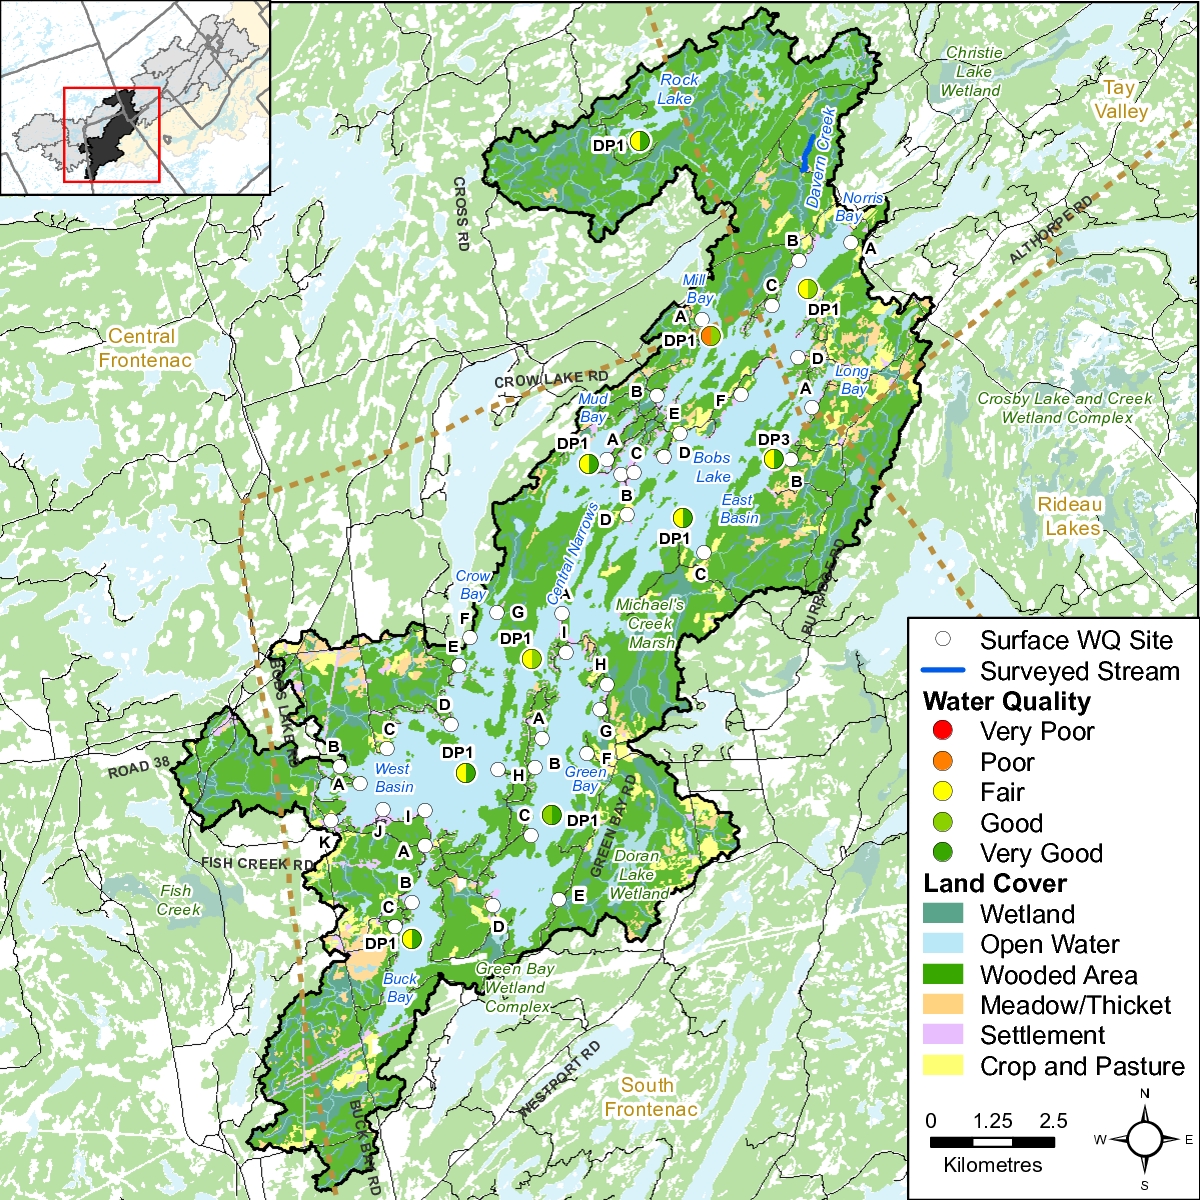


 on Buck Bay, 2006-2017.")
 on Buck Bay, 2006-2017")
 on Buck Bay, 2006-2017.")


 on Buck Bay, 2006-2017")
 on Buck Bay, 2006-2017.")
 on Buck Bay, 2006-2017.")

 on Green Bay, 2006-2017")
 on Green Bay, 2006-2017.")
 on Green Bay, 2006-2017")
 on Green Bay, 2006-2017 Figure 16 Average total phosphorus results at the deep point site (DP1) on Green Bay, 2006-2017.")


 on Green Bay, 2006-2017.")
 on Green Bay, 2006-2017.")
 on Green Bay, 2006-2017.")

 in the West Basin, 2006-2017")
 on Green Bay, 2006-2017.")
 on West Basin, 2006-2017")
 on West Basin, 2006-2017 Figure 26 Average total phosphorus results at the deep point site (DP1) on Green Bay, 2006-2017.")


 on West Basin, 2006-2017.")
 on West Basin, 2006-2017.")
 on West Basin, 2006-2017.")

 in the Norris Bay, 2006-2017")
 on Norris Bay, 2006-2017.")
 on Norris Bay, 2006-2017")
 on Norris Bay, 2006-2017.")


 on Norris Bay, 2006-2017.")
 on Norris Bay, 2006-2017.")
 on Norris Bay, 2006-2017.")

 in East Basin and Long Bay, 2006-2017")
 on East Basin and Long Bay, 2006-2017.")
 in East Bain and Long Bay, 2006-2017.")
 on East Basin and Long Bay, 2006-2017.")


 on East Basin/Long Bay, 2006-2017.")
 on East Bain/Long Bay, 2006-2017.")
 on East Basin/Long Bay, 2006-2017.")

 in Central Narrows, 2006-2017")
 in Central Narrows")
 in Central Narrows, 2006-2017.")
 on Central Narrows, 2006-2017.")


 on Central Narrows, 2006-2017.")
 on Central Narrows, 2006-2017.")
 on Central Narrows, 2006-2017.")
 on Central Narrows, 2006-2017.")
 in Mill Bay, 2006-2017.")
 in Mill Bay, 2006-2017. Figure 64 Average total phosphorus results at the deep point site (DP1) in Mill Bay, 2006-2017.")
 in Mill Bay, 2006-2017.")
 in Mill Bay, 2006-2017.")


 on Mill Bay, 2006-2017.")
 on Mill Bay, 2006-2017.")
 in Mill Bay, 2006-2017.")

 in Mud Bay, 2006-2017.")
 in Mud Bay,")
 in Mud Bay, 2006-2017.")
 in Mud Bay, 2006-2017.")


 on Mud Bay, 2006-2017.")
 on Mud Bay, 2006-2017.")
 in Mud Bay, 2006-2017.")

 in Rock Lake, 2006-2017.")
 in Rock Lake 2006-2017.")
 in Rock Lake, 2006-2017.")
 in Rock Lake, 2006-2017. Figure 86 Average total Kjeldahl nitrogen results at the deep point site (DP1) in Rock Lake 2006-2017.")
 on Rock Lake, 2006-2017.")
 on Rock Lake, 2006-2017.")
 in Rock Lake, 2006-2017.")


")
")
")


")
")
")


")


 on Little Silver Lake, 2006-2017")
 on Little Silver Lake, 2006-2017")
 on Little Silver Lake, 2006-2017")
 on Little Silver Lake, 2006-2017")


 readings have exceeded the minimum PWQO of 2 m indicating that algae in the water column is not at excessive levels (good water clarity). Less than 2 m will indicate overproduction in a lake or significant inputs to the water column that are limiting light availability. Figure 9 shows that no individual reading has been below the guideline and measured depths range from 2.0 m to 8.0 m. A decreasing trend was observed within the 2006-2017 data set, indicating that Secchi depths have been reduced over this period.")
 on Little Silver Lake, 2006-2017.")
 on Little Silver Lake, 2006-2017")

 on Rainbow Lake, 2006-2017")
 on Rainbow Lake, 2006-2017")
 on Rainbow Lake, 2006-2017")
 on Rainbow Lake, 2006-2017")


 on Rainbow Lake, 2006-2017")
 on Rainbow Lake, 2006-2017.")
 on Rainbow Lake, 2006-2017")

 on Farren Lake, 2006-2017")
 on Farren Lake, 2006-2017")
 on Farren Lake, 2006-2017")
 on Farren Lake, 2006-2017")


 on Farren Lake, 2006-2017")
 on Farren Lake, 2006-2017")
 on Farren Lake, 2006-2017")

 on O'Brien Lake, 2006-2017")
 on O'Brien Lake, 2006-2017")
 on O'Brien Lake, 2006-2017")
 on O'Brien Lake, 2006-2017")


 on O'Brien Lake, 2006-2017")
 on O'Brien Lake, 2006-2017.")
 on O'Brien Lake, 2006-2017")

 on Christie Lake, 2006-2017")
 on Christie Lake, 2006-2017")
 on Christie Lake, 2006-2017")
 on Christie Lake, 2006-2017.")


 on Christie Lake, 2006-2017")
 on Christie Lake, 2006-2017.")
 on Christie Lake, 2006-2017")

 in Davern Lake, 2006-2017")
 in Davern Lake, 2006-2017.")
 in Davern Lake, 2006-2017")
 in Davern Lake, 2006-2017")


 on Davern Lake, 2006-2017")
 on Davern Lake, 2006-2017.")
 on Davern Lake, 2006-2017")


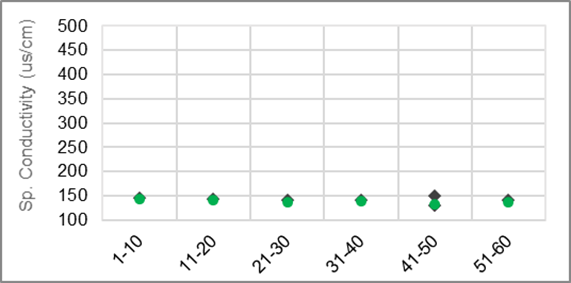


 and saturation (%) in the Tay River in the Christie Lake catchment")


")
")
")
")

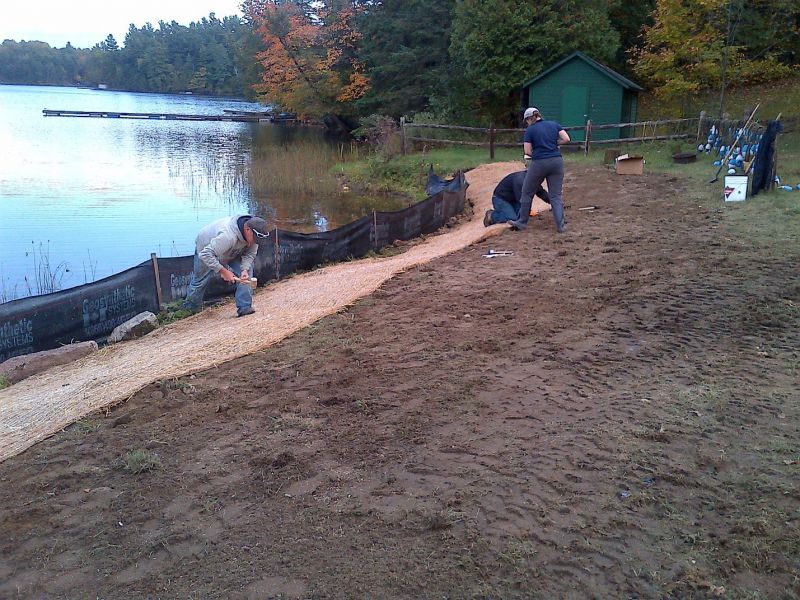
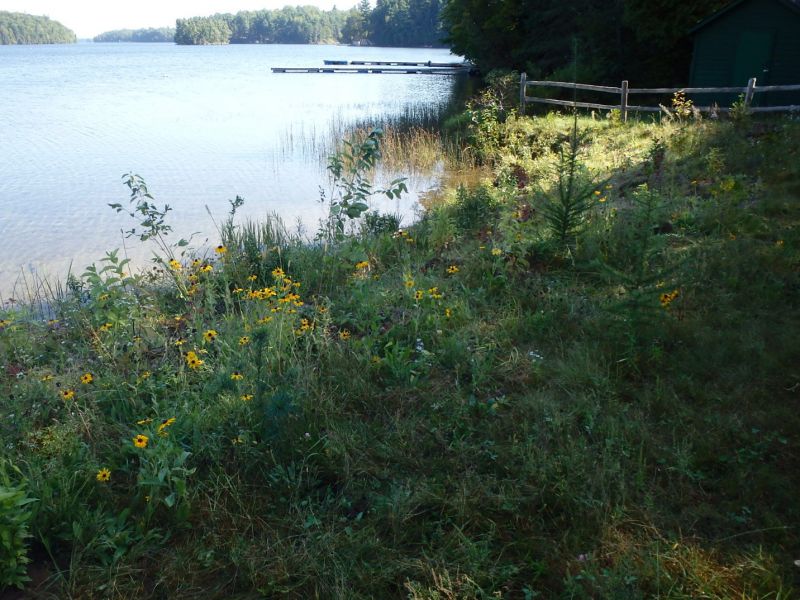


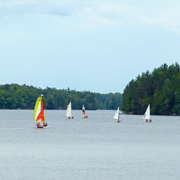


 on Leggat Lake, 2006-2017")
 on Leggat Lake, 2006-2017")
 on Leggat Lake, 2006-2017")
 on Leggat Lake, 2006-2017")


 on Leggat Lake, 2006-2017.")
 on Leggat Lake, 2006-2017")

 on Eagle Lake, 2006-2017")
 on Eagle Lake, 2006-2017")
 on Eagle Lake, 2006-2017")
 on Eagle Lake, 2006-2017")


 on Eagle Lake, 2006-2017")
 on Eagle Lake, 2006-2017.")

 on Eagle Lake, 2006-2017")


 and saturation (%) in Eagle Creek")


")

")
")


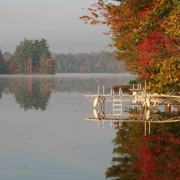


 on Elbow Lake, 2006-2017")
 on Elbow Lake, 2006-2017")
 on Elbow Lake, 2006-2017")
 on Elbow Lake, 2006-2017 Figure 6 Total Kjeldahl nitrogen sampling results at deep point site (DP1) on Elbow Lake, 2006-2017")


 on Elbow Lake, 2006-2017")
 on Elbow Lake, 2006-2017")
 on Elbow Lake, 2006-2017")


 and saturation (%) in Fish Creek")


")
")
")
")


 and saturation (%) in Grants Creek")


")
")
")
")


 on Carnahan Lake, 2006-2017.")
 on Carnahan Lake, 2006-2017. Figure 4 Distribution of total phosphorus concentrations at the deep point site (DP1) on Carnahan Lake, 2006-2017.")
 on Carnahan Lake, 2006-2017.")
 on Carnahan Lake, 2006-2017.")


 on Carnahan Lake, 2006-2017.")
 on Carnahan Lake, 2006-2017")
 on Long Lake, 2006-2017. Figure 14 Distribution of total phosphorus concentrations at the deep point site (DP1) on Long Lake, 2006-2017.")
 on Long Lake, 2006-2017.")
 on Long Lake, 2006-2017.")
 on Long Lake, 2006-2017.")


 on Long Lake, 2006-2017")
 on Long Lake, 2006-2017.")
 on Long Lake, 2006-2017")


 and saturation (%) in Uens and Stub Creek")


")
")
")
")


")


 site on Otty Lake, 2006-2017")
 site on Otty Lake, 2006-2017")
 site on Otty Lake, 2006-2017")


 sites on Otty Lake, 2006-2017")
 site")
 site on Otty Lake, 2006-2017")

 site on McLaren Lake, 2006-2017")
 site on McLaren Lake, 2006-2017")
 site on McLaren Lake, 2006-2017")
 site on McLaren Lake, 2006-2017")
 sites on McLaren Lake, 2006-2017")
 site on McLaren Lake, 2006-2017")
 site on McLaren Lake, 2006-2017")


 and saturation (%) in Jebbs Creek")


 captured and released while fyke netting adjacent to the Perth Wildlife Reserve on Jebbs Creek")


")
")
")
")


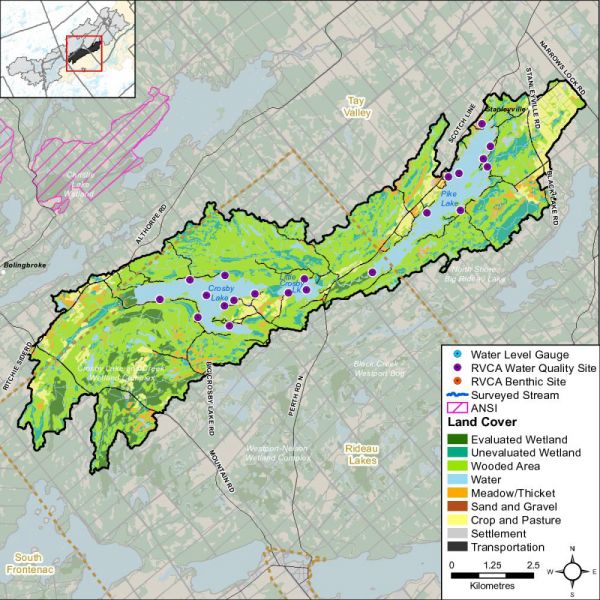
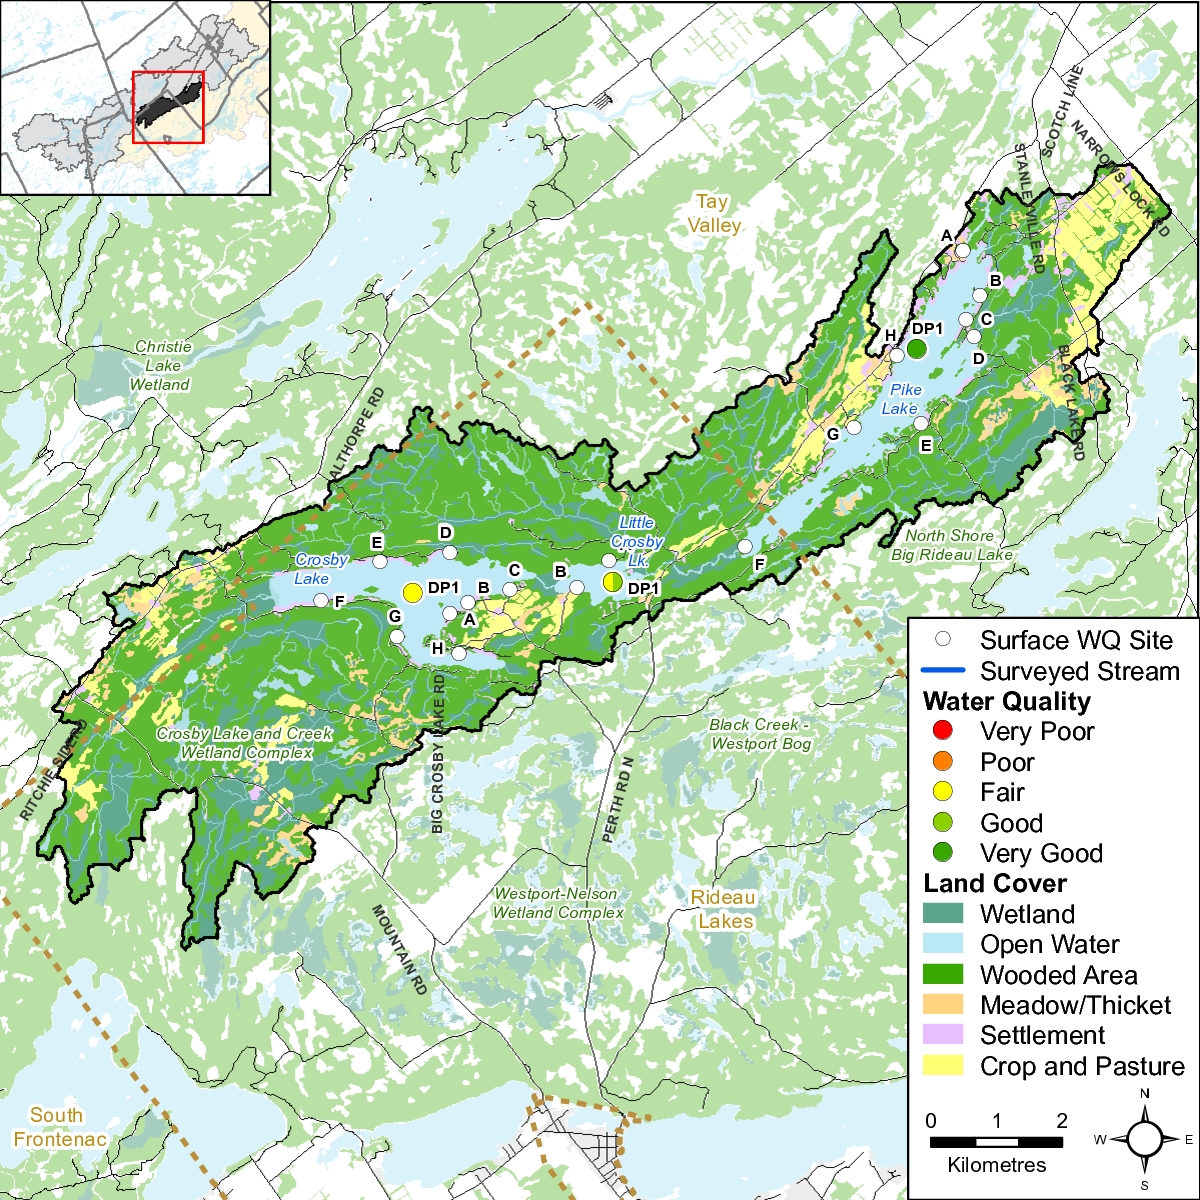
 on Crosby Lake, 2006-2017.")
 on Crosby Lake, 2006-2017")
 on Crosby Lake, 2006-2017.")
 on Crosby Lake, 2006-2017.")


 on Crosby Lake, 2006-2017")
 on Crosby Lake, 2006-2017")
 on Crosby Lake, 2006-2017")

 on Little Crosby Lake, 2006-2017")
 on Little Crosby Lake, 2006-2017")
 on Little Crosby Lake, 2006-2017.")
 on Little Crosby Lake, 2006-2017.")


 on Little Crosby Lake, 2006-2017.")
 on Little Crosby Lake, 2006-2017.")
 on Little Crosby Lake, 2006-2017.")

 on Pike Lake, 2006-2017")
 on Pike Lake, 2006-2017")
 on Pike Lake, 2006-2017.")
 on Pike Lake, 2006-2017.] Figure 25 Total Kjeldahl nitrogen sampling results at the deep point site (DP1) on Pike Lake, 2006-2017. Figure 26 Average total Kjeldahl nitrogen sampling results at the deep point site (DP1) on Pike Lake, 2006-2017.")


 on Pike Lake, 2006-2017.")
 on Pike Lake, 2006-2017.")


")
")


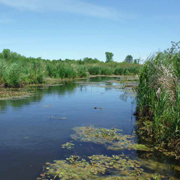


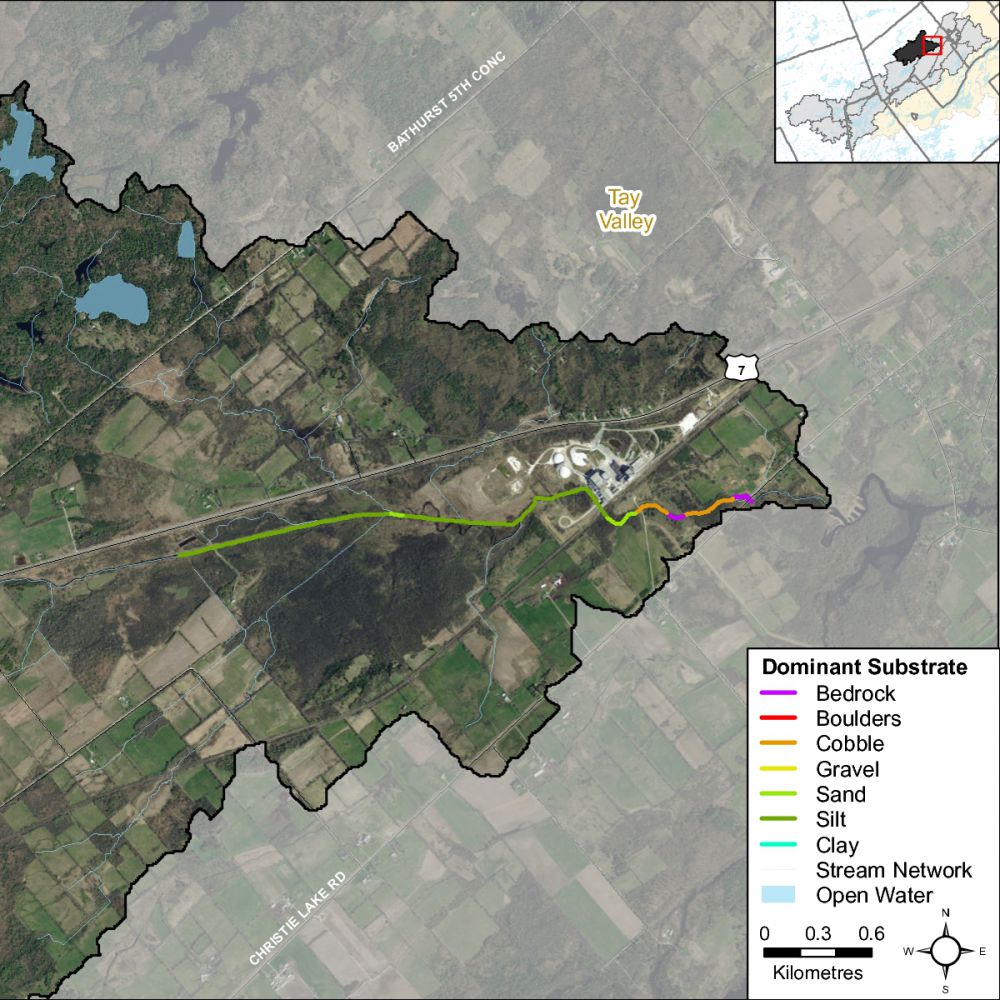


 and saturation (%) in Rudsdale Creek")


")
")
")
")


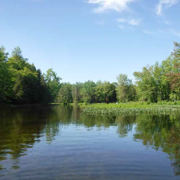


 Figure 15 Instream wood structure along the Tay River and the Scotts Snye in the Glen Tay catchment


 and saturation (%) in the Tay River and the Scotts Snye in the Glen Tay catchment")


")
")
")
")


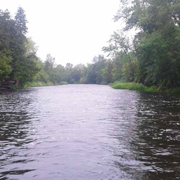


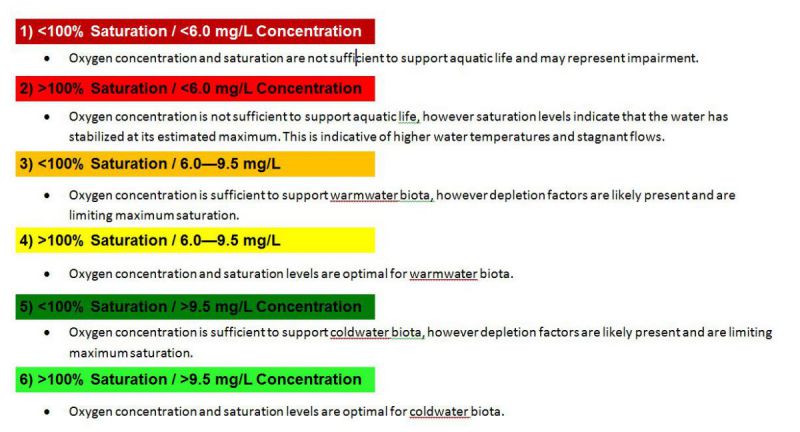
 and saturation (%) in the Tay River in the Port Elmsley catchment")


")
")
")
")


 and saturation (%) in the Tay River in the Perth catchment")


")


")
")
")
")
")
")


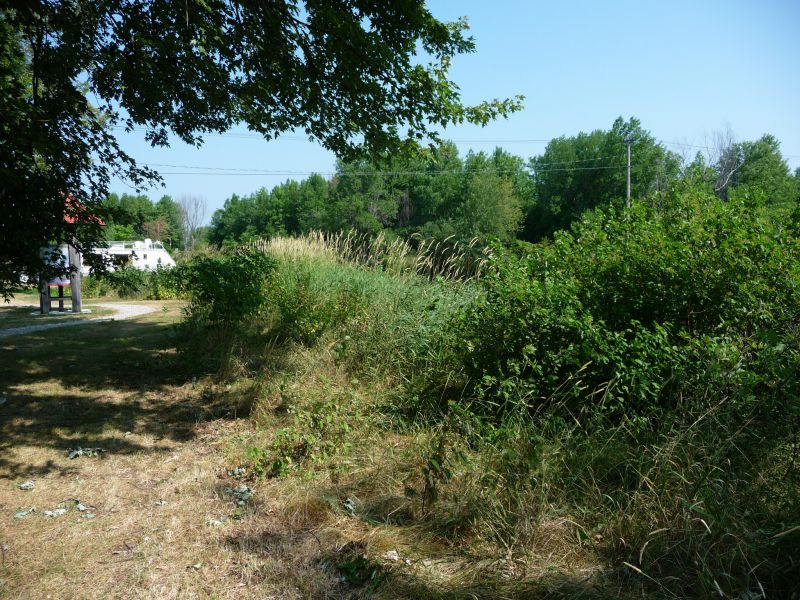
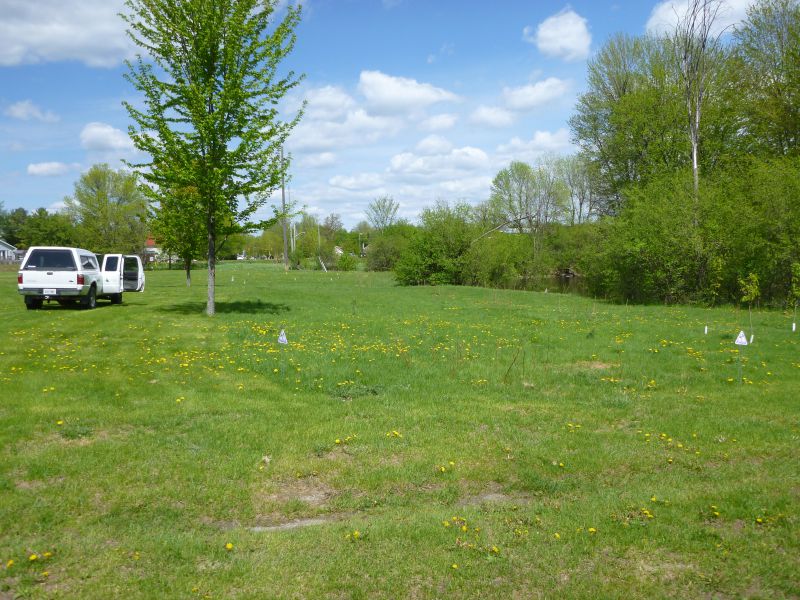
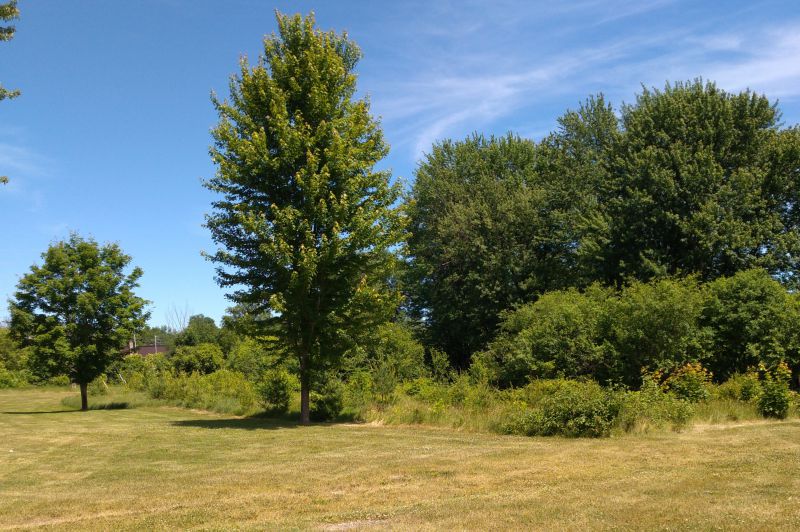
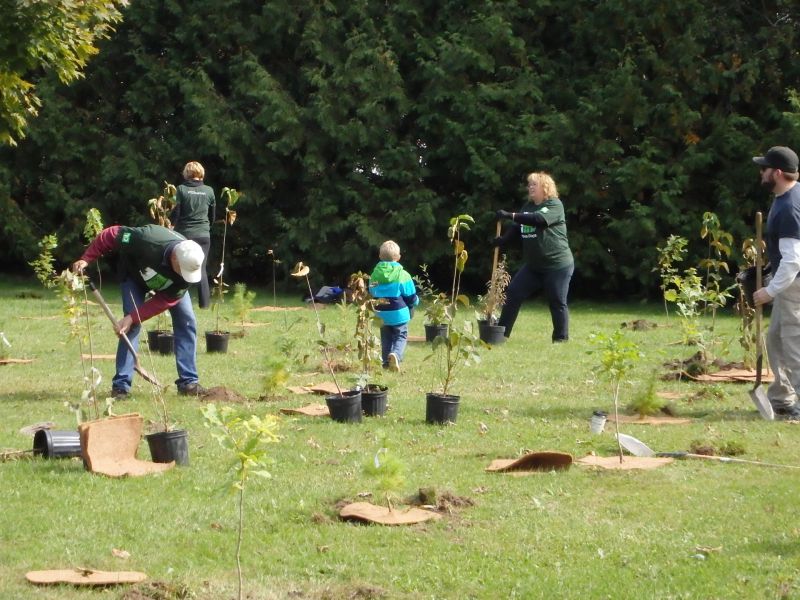
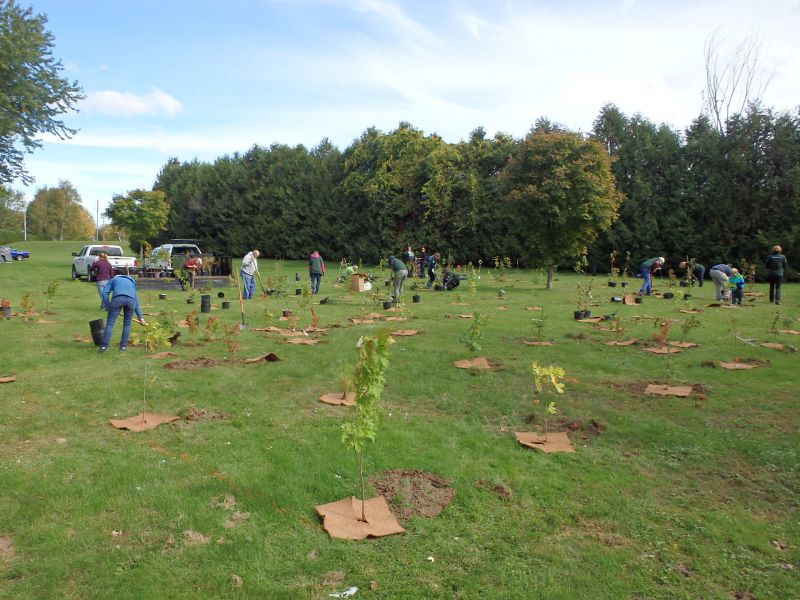
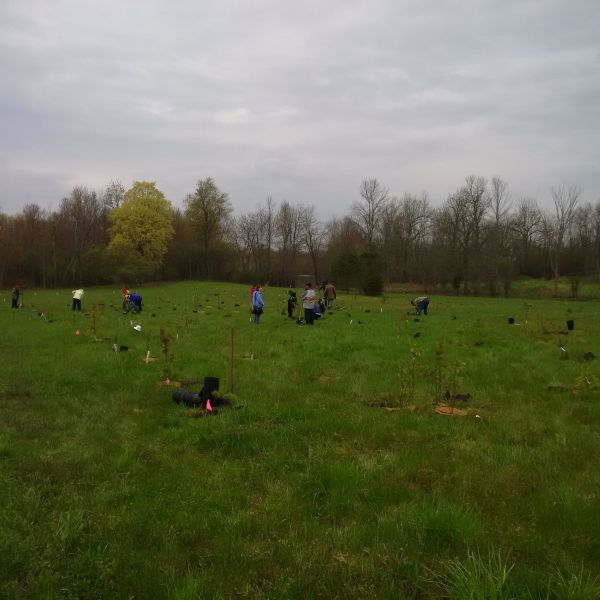
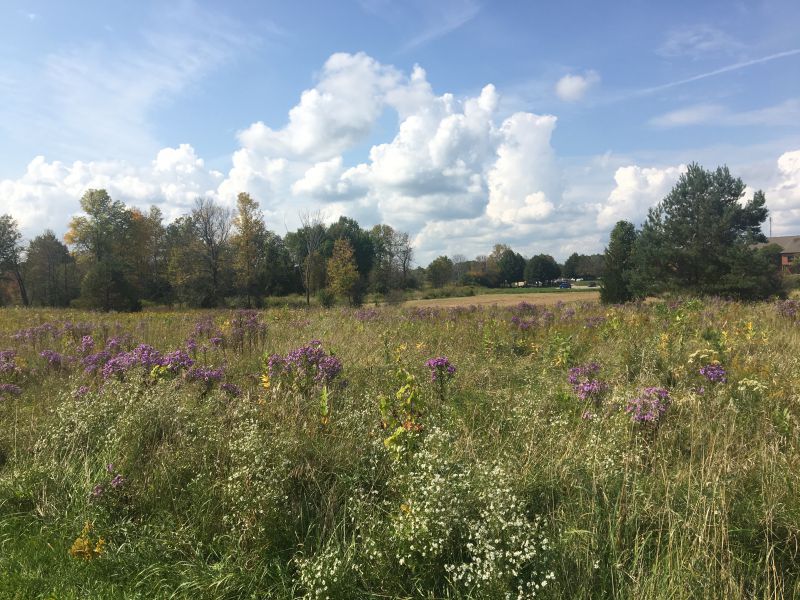
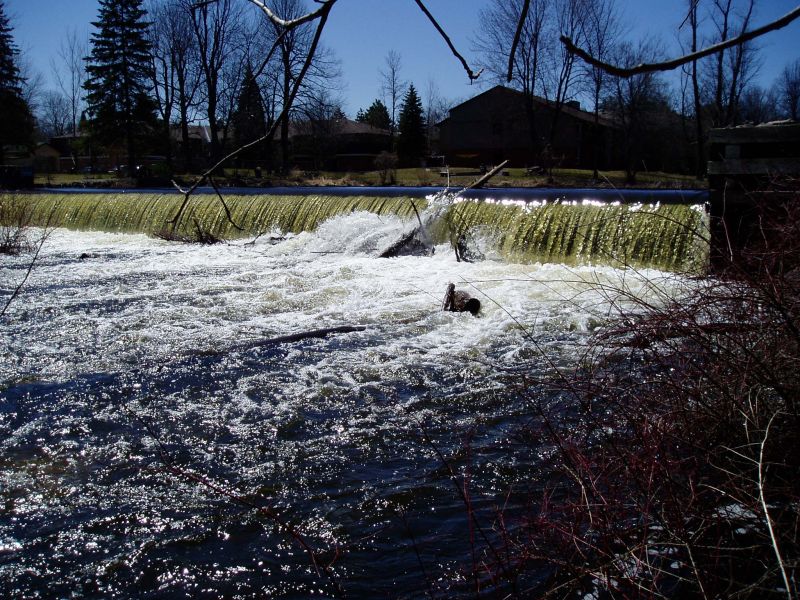
of Perth r")