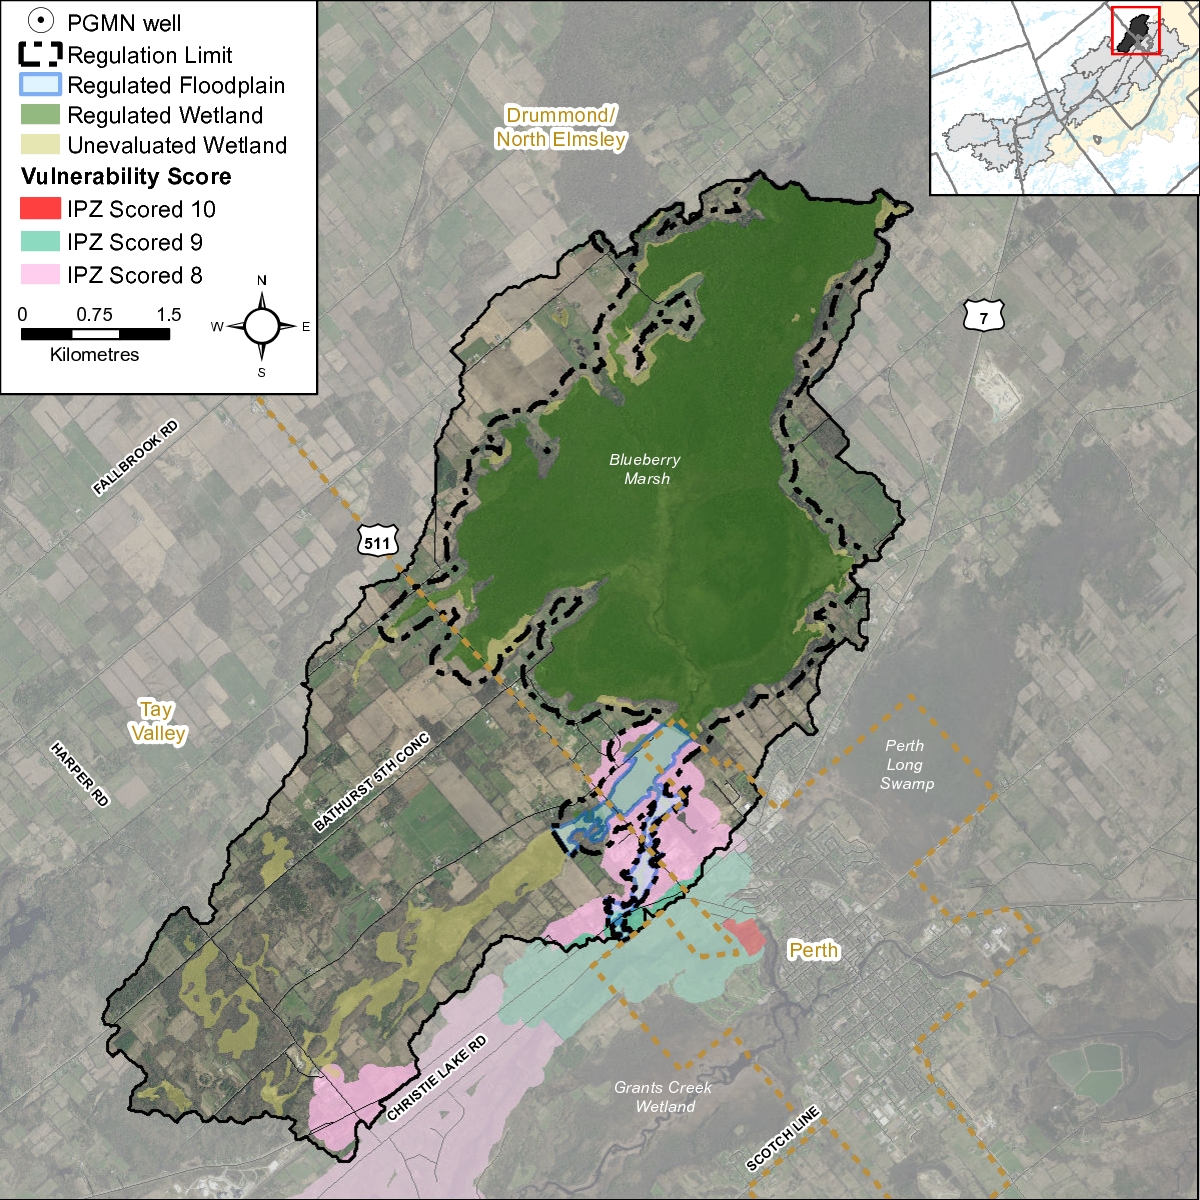
3.0 Blueberry Creek Catchment: Riparian Conditions
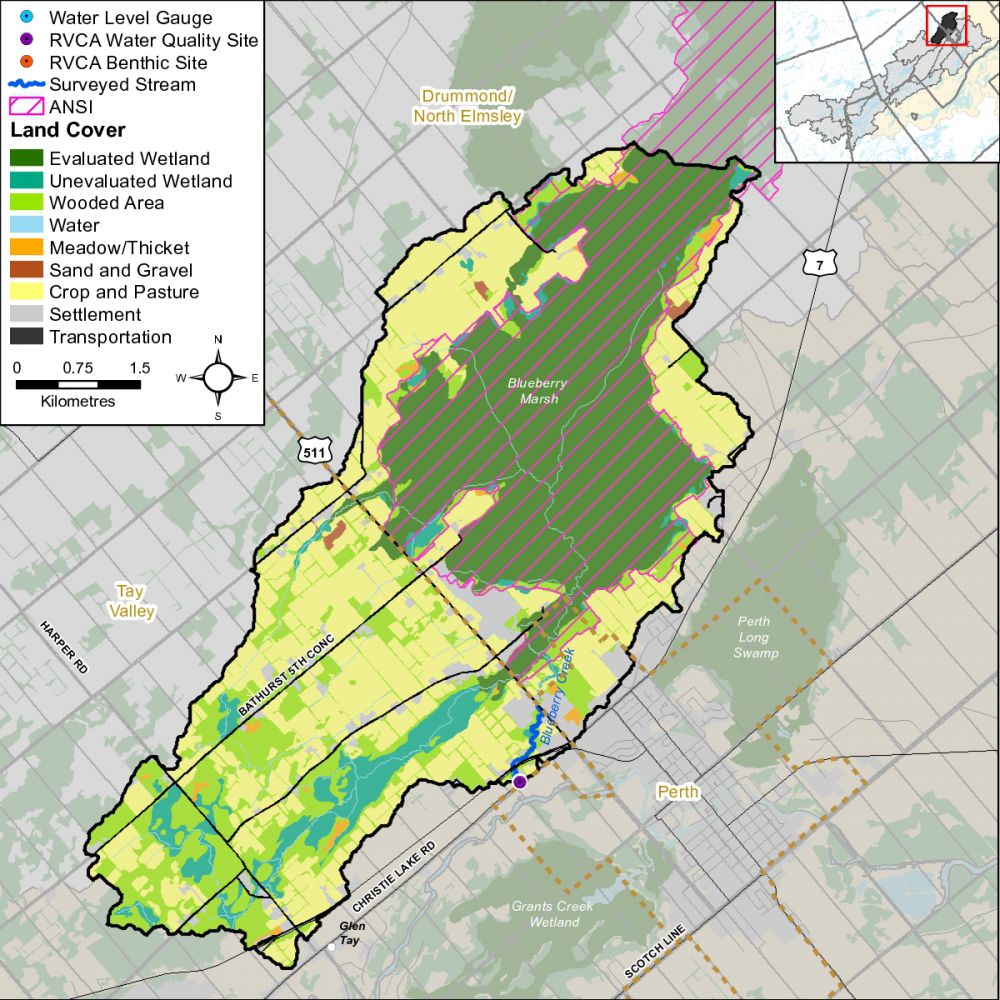
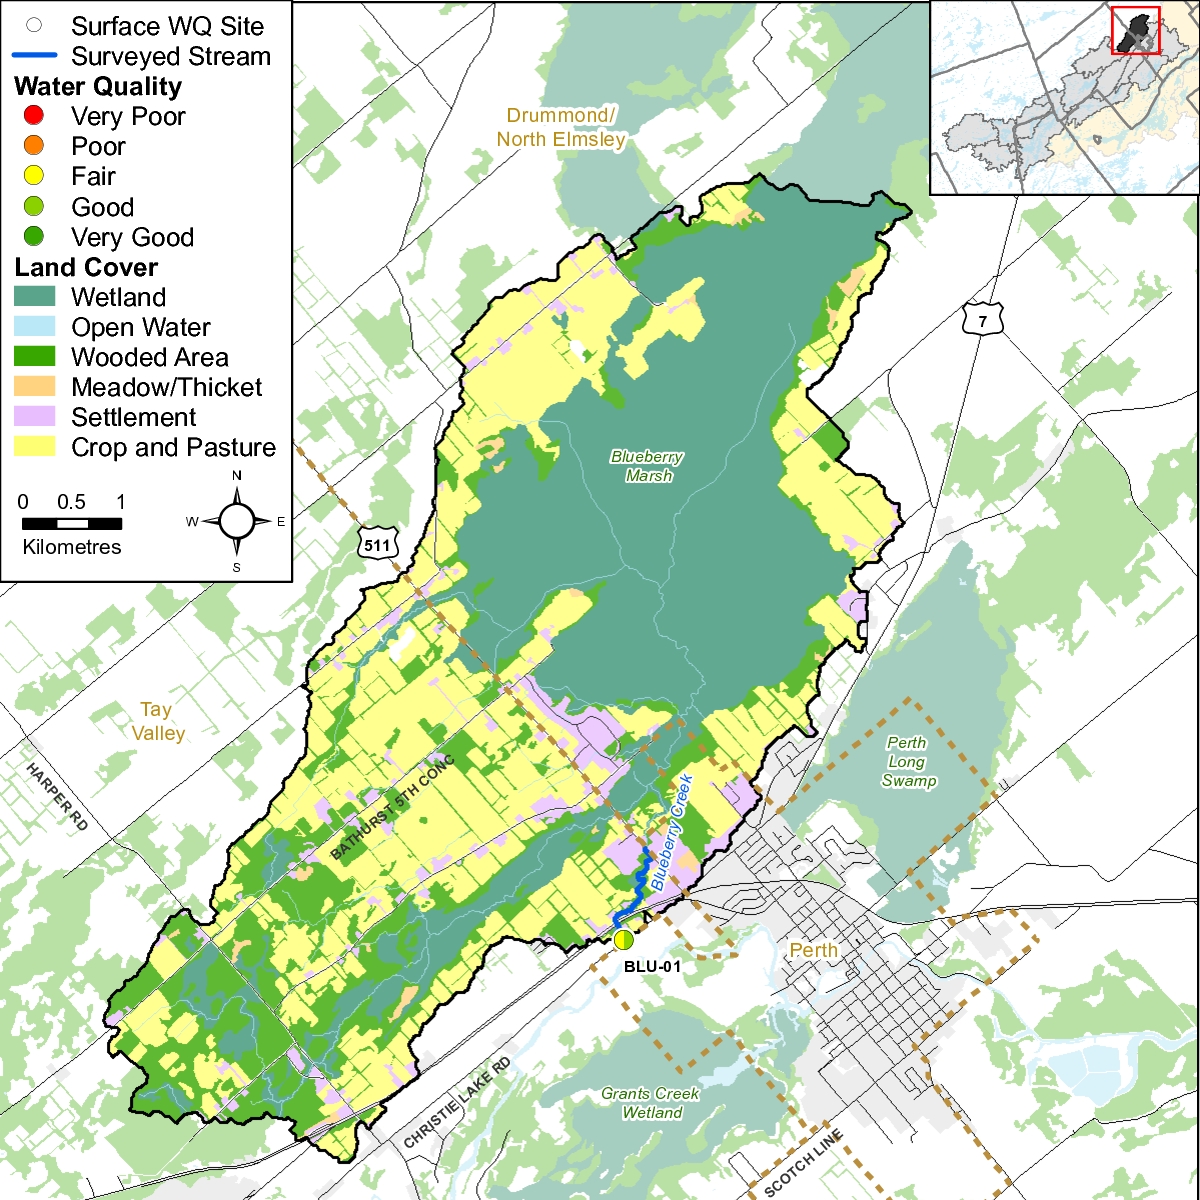
The Stream Characterization Program evaluated 1.5 km of Blueberry Creek in 2016. A total of 15 stream survey assessments were completed in the second week of July.
During the summer and fall of 2016, the Rideau Valley watershed experienced periods of severe drought. Precipitation levels were measured at less than 40% of the long-term average, as the water supply was unable to meet local demand. The lack of rainfall affected the success and function of farm crops, municipal and private wells, lawns and gardens, navigation and ultimately the health of our lakes, rivers and streams.
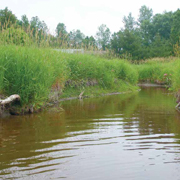
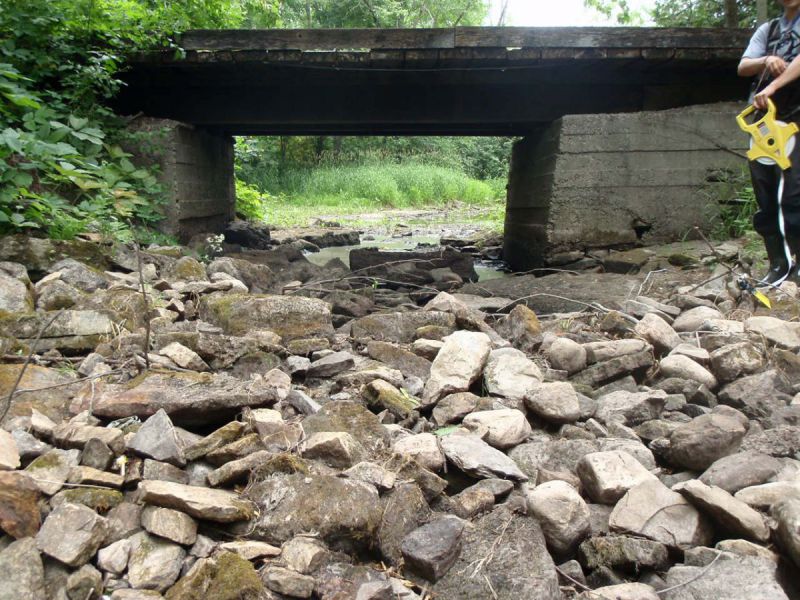
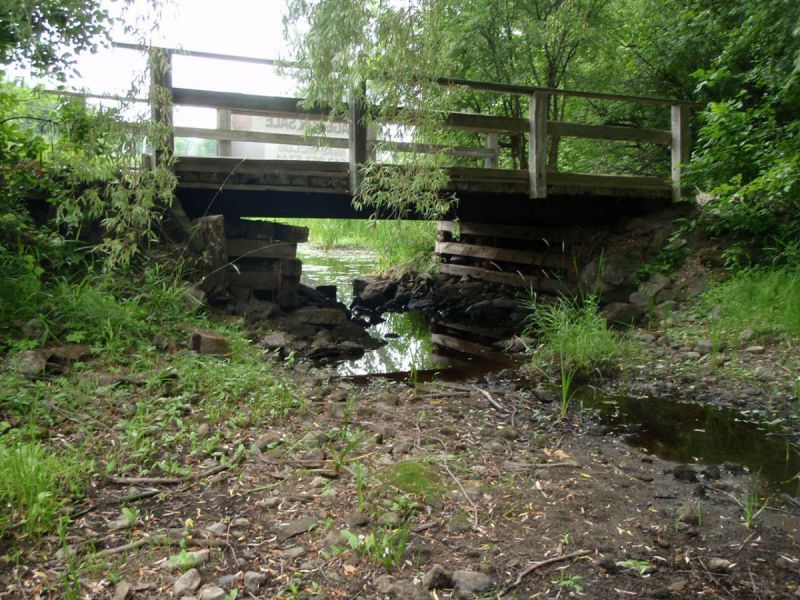
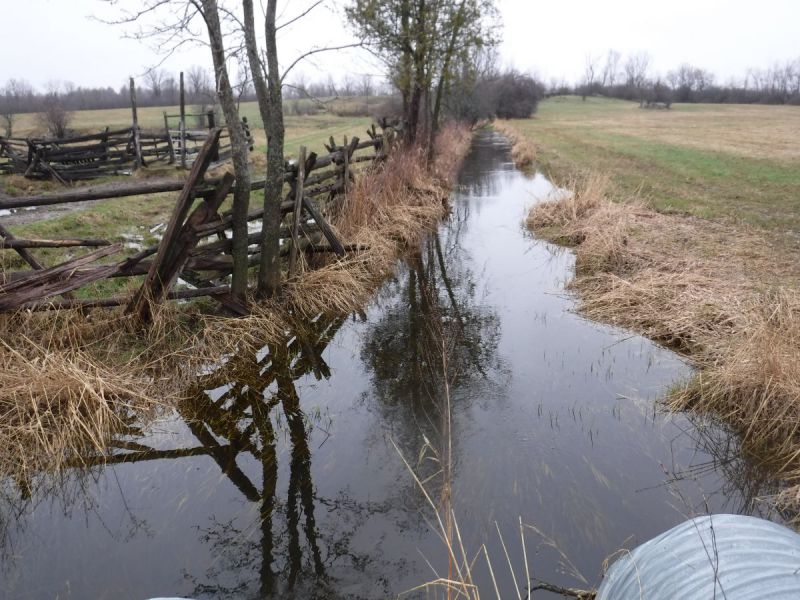
Low water conditions were readily observed throughout the watershed, as many of the streams were highly fragmented or completely dry. Aquatic species such as amphibians, fish and macroinvertebrates were affected, as suitable habitat may have been limited. Fragmentation of habitat was observed along Blueberry Creek (see photos below).
Private crossing upstream of Hwy. 7 showing the effect of the 2016 drought on Blueberry Creek
Private crossing immediately upstream of Hwy. 7 showing the effect of the 2016 drought on Blueberry Creek
3.1 Blueberry Creek Overbank Zone
3.1.1 Riparian Buffer Evaluation
The quality of the riparian area increases with the width, complexity and linear extent of its vegetation along a stream or creek. A complex riparian community consists of diverse plant species native to the site, with multiple age-classes providing vertical structural diversity along a watercourse.
Here is a list of watershed benefits from a healthy riparian buffer zone:
- Reduces the amount of pollutants that reach the stream from surface runoff
- Helps reduce and mitigates erosion
- Provides a microclimate that is cooler during the summer months providing cooler water for aquatic organisms
- Provides large wood structure from fallen trees and limbs that form instream cover, create pools, stabilize the streambed, and provide habitat for aquatic organisms
- Provides organic material for stream biota that, among other functions, is the base of the food chain in lower order streams
- Provides habitat for terrestrial insects that drop in the stream and become food for fish and travel corridors for other terrestrial animals
- Dissipates energy during flood events
- Often provides the only refuge areas for fish during out-of-bank flows (behind trees, stumps, and logs
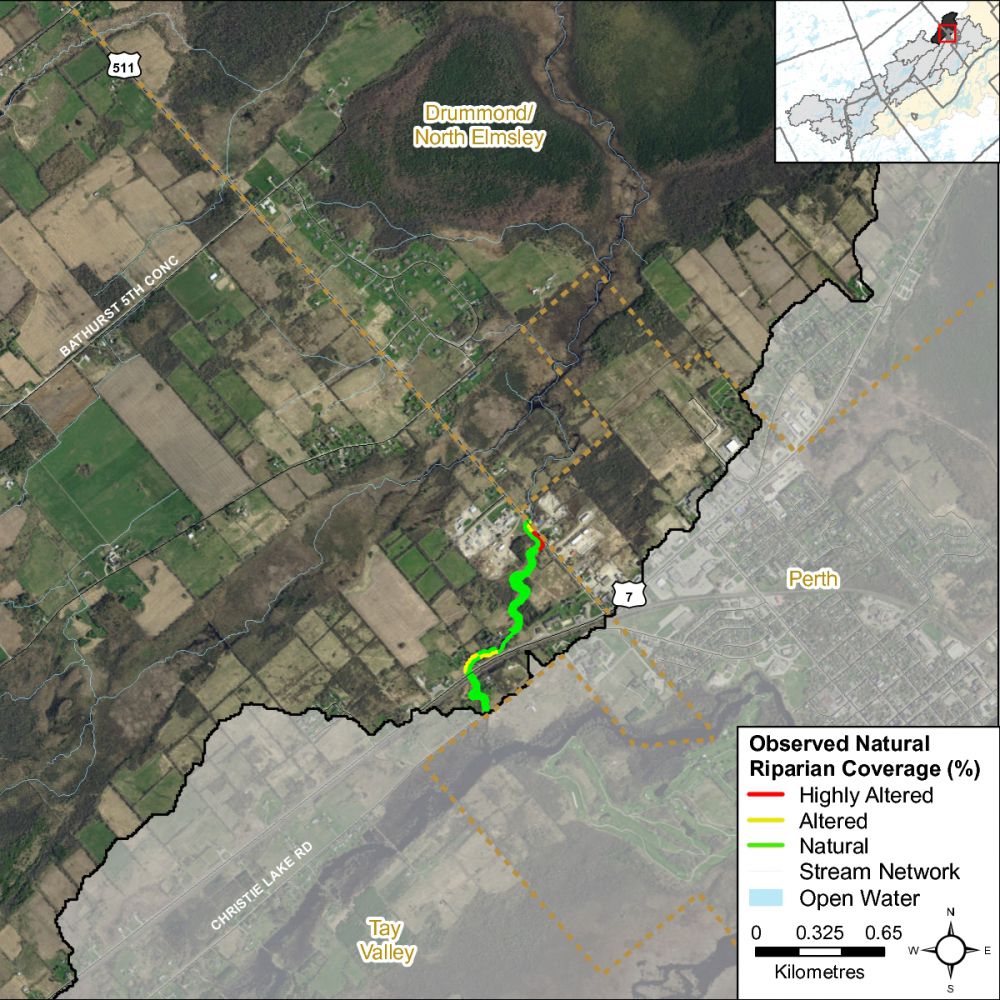
Figure 11 demonstrates the buffer conditions of the left and right banks separately. Blueberry Creek had a buffer of greater than 30 meters along 91 percent of the right bank and 93 percent of the left bank.
Figure 11 Riparian Buffer Evaluation along Blueberry Creek
3.1.2 Riparian Buffer Alterations
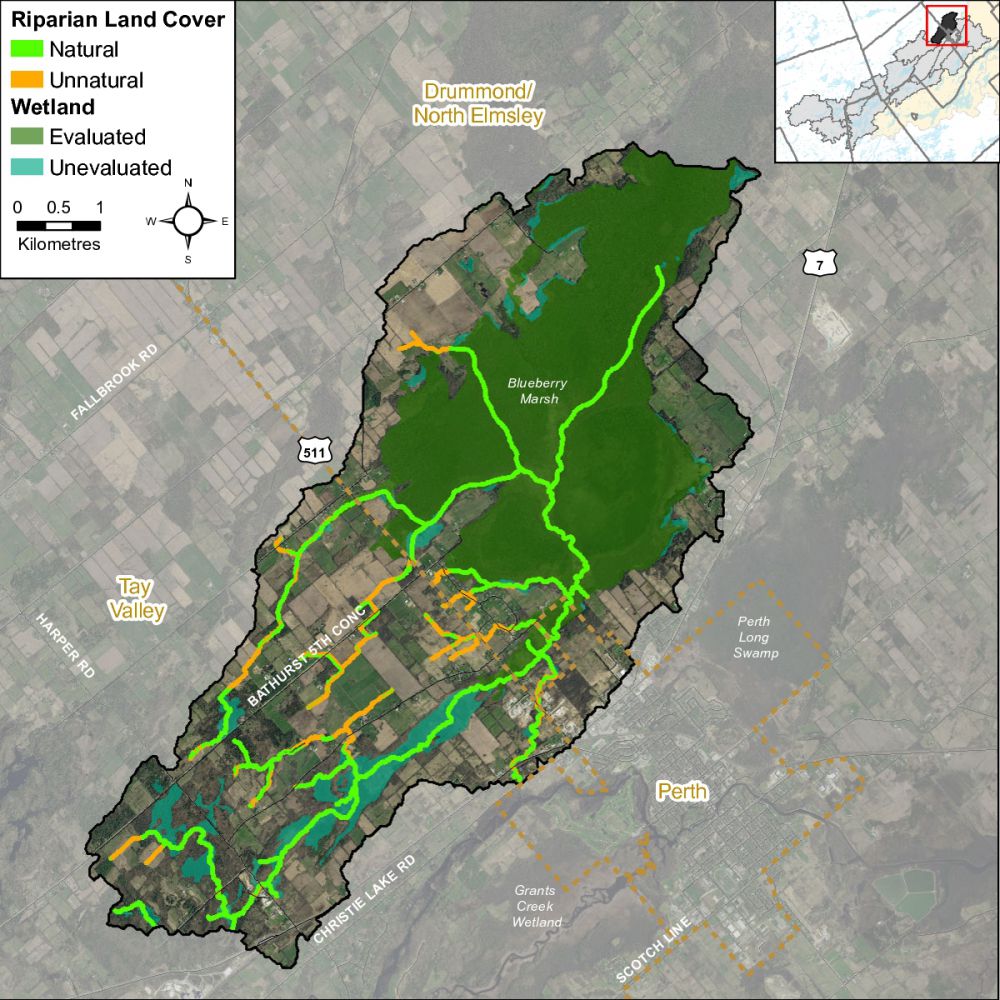
Alterations within the riparian buffer were assessed within three distinct shoreline zones (0-5m, 5-15m, 15-30m), and evaluated based on the dominant vegetative community and/or land cover type (Figure 12). The riparian buffer zone along Blueberry Creek was found to be dominated by natural conditions in the form of forests and wetlands.
Figure 12 Riparian buffer alterations along Blueberry Creek
3.1.3 Adjacent Land Use
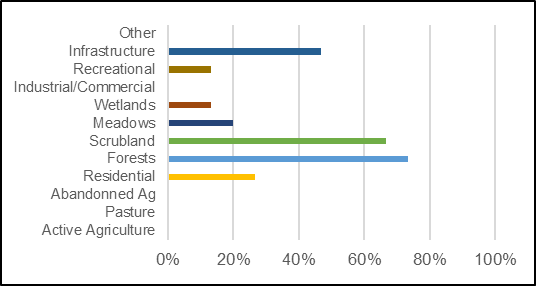
The RVCA’s Stream Characterization Program identifies seven different land uses along Blueberry Creek (Figure 13). Surrounding land use is considered from the beginning to end of the survey section (100m) and up to 100m on each side of the creek. Land use outside of this area is not considered for the surveys but is nonetheless part of the subwatershed and will influence the creek. Natural areas were dominant along Blueberry creek and were characterized by forest, scrubland, meadow and wetland. Forested habitat was dominant in the adjacent lands along Blueberry Creek at 73 percent of the surveyed sections. The remaining land use consisted of recreational, residential and infrastructure in the form of railway and road crossings.
Figure 13 Land Use along Blueberry Creek
3.2 Blueberry Creek Shoreline Zone
3.2.1 Instream Erosion
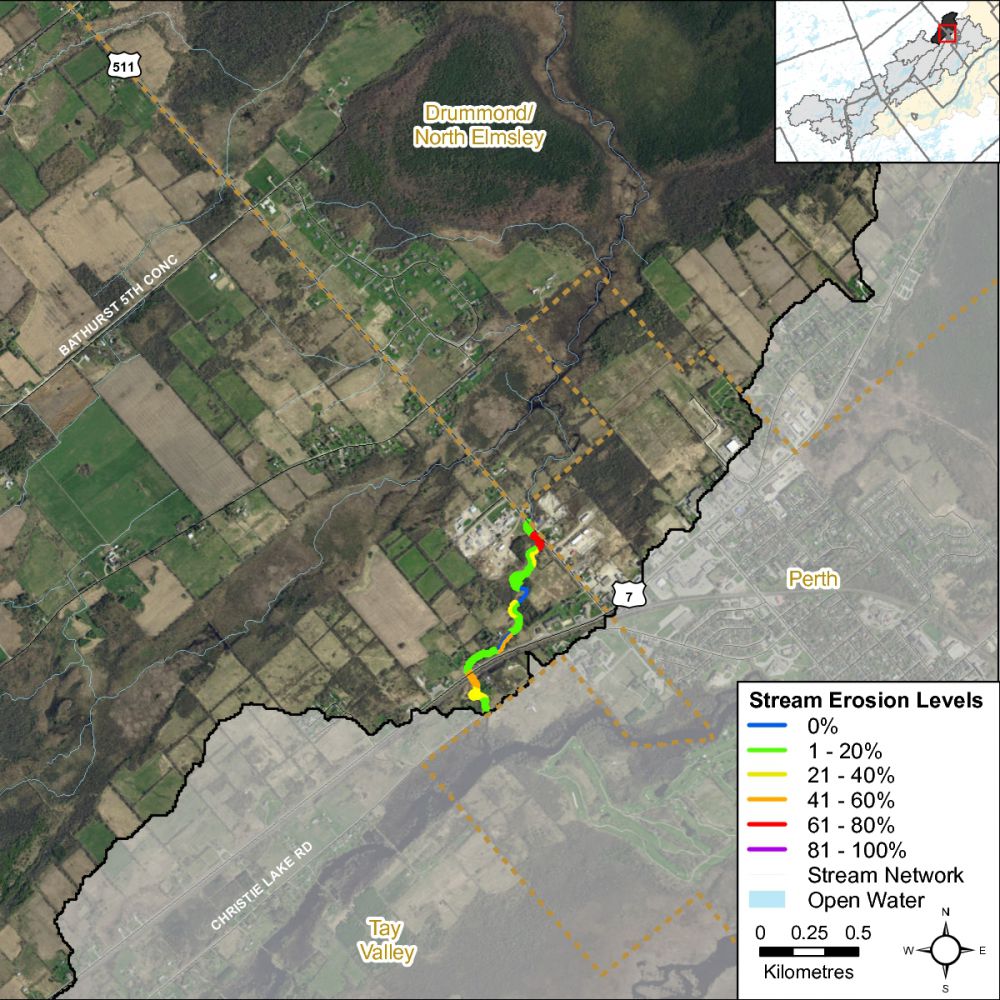
Stream erosion is the process by which water erodes and transports sediments, resulting in dynamic flows and diverse habitat conditions. Excessive erosion can result in drastic environmental changes, as habitat conditions, water quality and aquatic life are all negatively affected. Bank stability was assessed as the overall extent of each section with “unstable” shoreline conditions. These conditions are defined by the presence of significant exposed soils/roots, minimal bank vegetation, severe undercutting, slumping or scour and potential failed erosion measures. The majority of Blueberry Creek had low to moderate levels of erosion with the exception of one location along the system which had high levels of erosion in the upper reaches of the survey (Figure 14).
Figure 14 Erosion levels along Blueberry Creek
3.2.2 Undercut Stream Banks
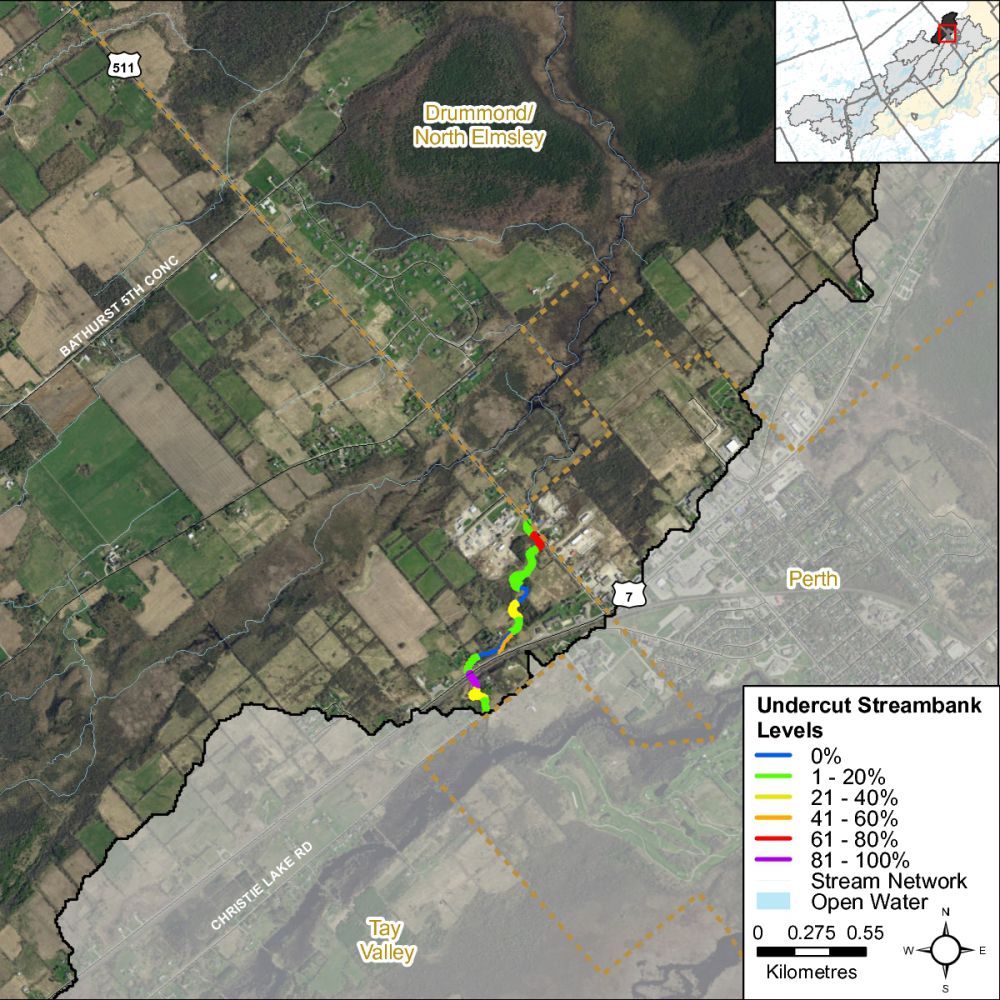
Stream bank undercuts can provide excellent cover habitat for aquatic life, however excessive levels can be an indication of unstable shoreline conditions. Bank undercut was assessed as the overall extent of each surveyed section with overhanging bank cover present. Figure 15 shows that Blueberry Creek had highly variable levels of undercut banks along the system and they typically coincided with areas that were experiencing high levels of erosion.
Figure 15 Undercut stream banks along Blueberry Creek
3.2.3 Stream Shading
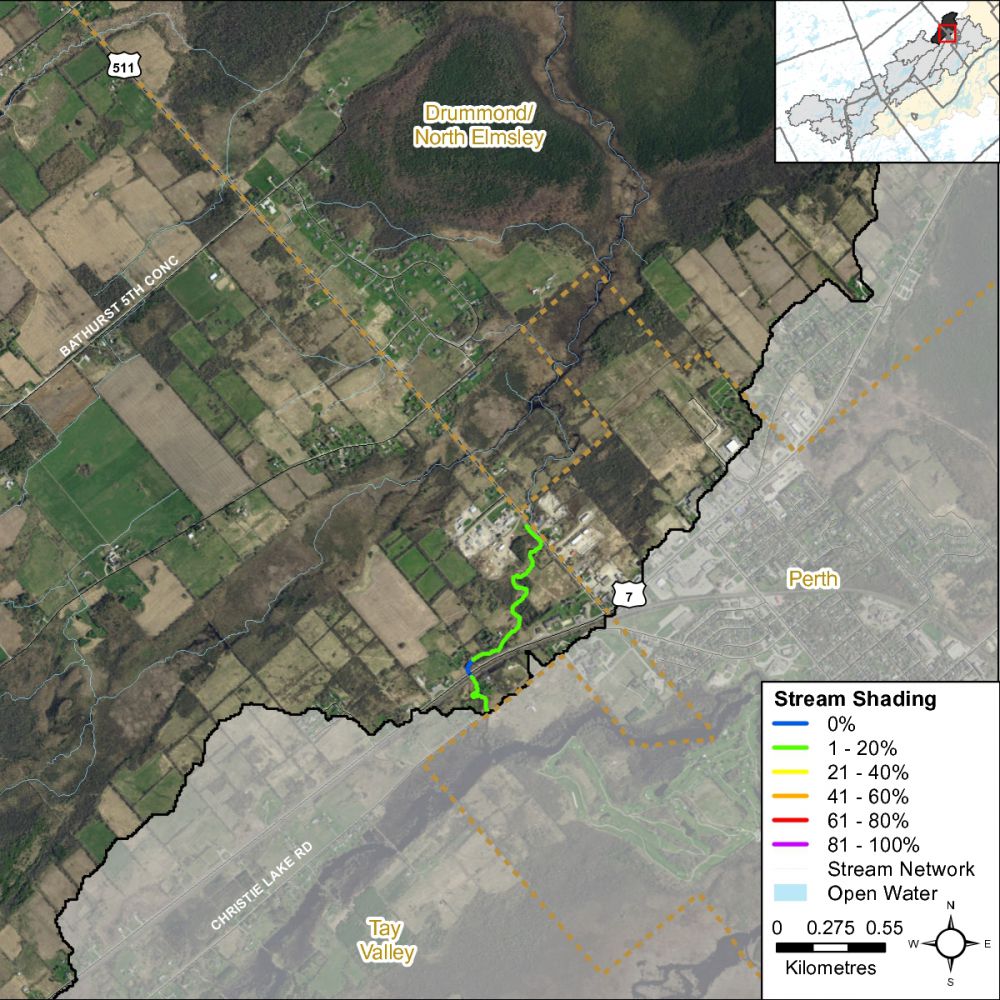
Grasses, shrubs and trees all contribute towards shading a stream. Shade is important in moderating stream temperature, contributing to food supply and helping with nutrient reduction within a stream. Stream cover is assessed as the total coverage area in each section that is shaded by overhanging shrubs/grasses and tree canopy, at greater than 1m above the water surface. Figure 16 shows low levels of stream shading along Blueberry Creek.
Figure 16 Stream shading along Blueberry Creek
3.2.4 Instream Wood Structure
Forested shorelines provide essential complex habitat through the perpetual process of shoreline trees falling into the water. This continuous recruitment of trees creates a wood-based physical structure in the littoral zone that is common on natural systems. Insects, fish, amphibians, birds, and other animals have also evolved with this abundance of near shore wood and it is essential to their life cycles. With increased development along many waterways, forested shorelines have been altered and wood-based physical structure in many waterways has been reduced. It is important to maintain and restore this essential habitat to aquatic ecosystems.
Shoreline Protection
- Protects shorelines by providing a barrier from wind and wave erosion
- Reduces sedimentation of the water caused by shoreline slumping due to bank erosion
- Allows detritus to collect and settle on the lake or creek bed providing the substrate structure required for native aquatic vegetation to establish and outcompete invasive species
Food Source
- Wood complexes are an important food source for invertebrates
- Small fish feed on the abundance of invertebrates that are found around these structures
- Larger fish, waterfowl and shorebirds all benefit from the abundance of invertebrates and small fish feeding around wood structures in the littoral zone
Cover
- Cover from predators is essential for many fish and animals to successfully complete their life cycle
- The nooks and crannies of wood complexes offer organisms safety from predators while at the same time concentrating prey to make predators more efficient
- Wood provides the structure on which many species must lay or attach their eggs, therefore these complexes provide spawning, nesting and rearing habitat
Diversity
- Wood complexes in the littoral zone provide unique edge habitat along the shoreline
- Edge habitats contain more species diversity and higher concentrations of species than the adjoining habitats
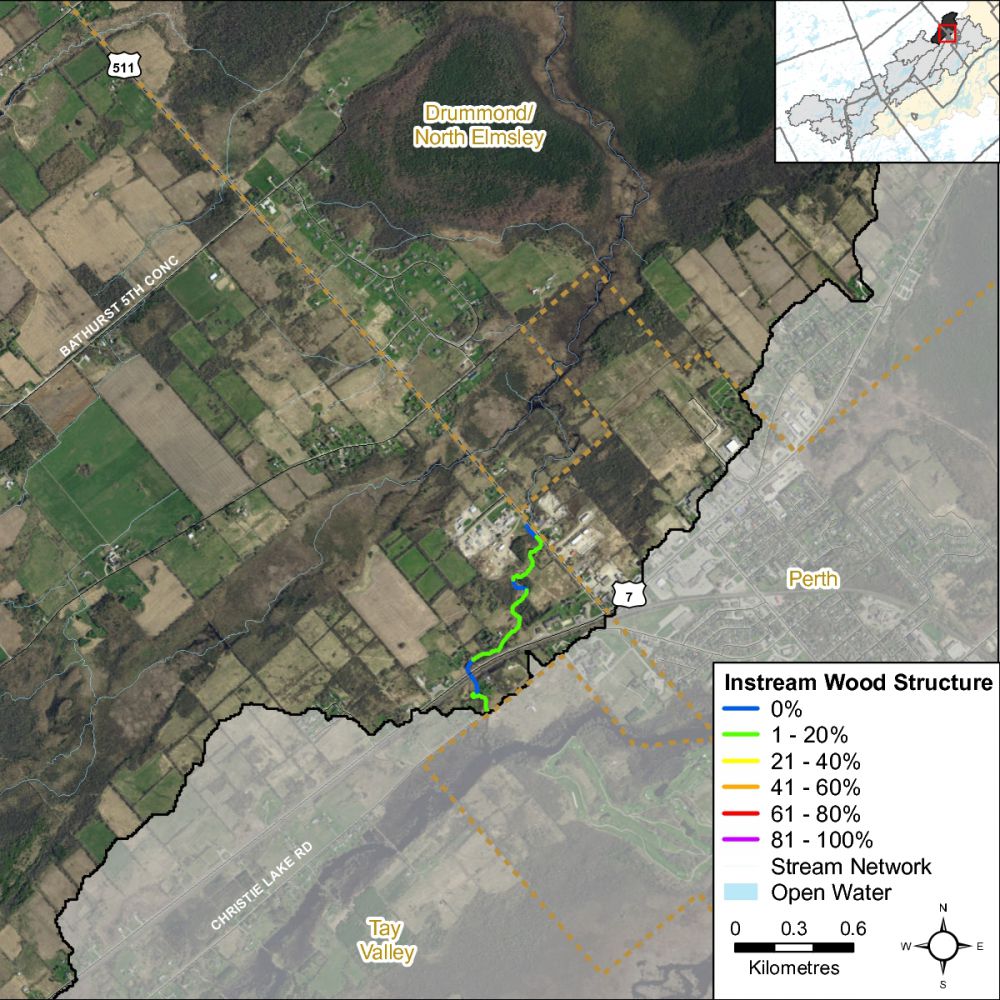
Figure 17 shows that the majority of Blueberry Creek had low levels of instream wood structure in the form of branches and trees along the system.
Figure 17 Instream wood structure along Blueberry Creek
3.2.5 Overhanging Wood Structure
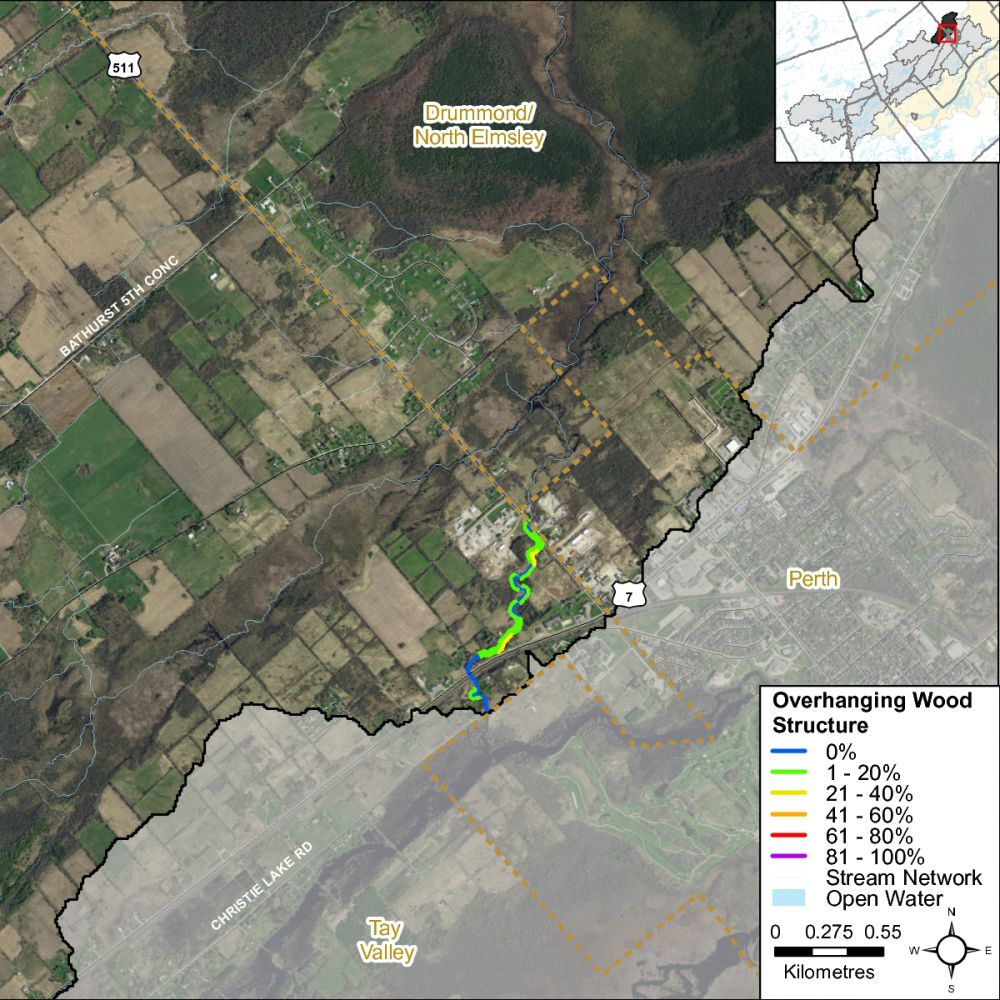
Trees and branches that are less than one meter from the surface of the water are defined as overhanging. Overhanging wood structure provides a food source, nutrients and shade which helps to moderate instream water temperatures. Figure 18 shows the system ranges from low to moderate levels of overhanging wood structure along Blueberry Creek.
Figure 18 Overhanging trees and branches along Blueberry Creek
3.2.6 Anthropogenic Alterations
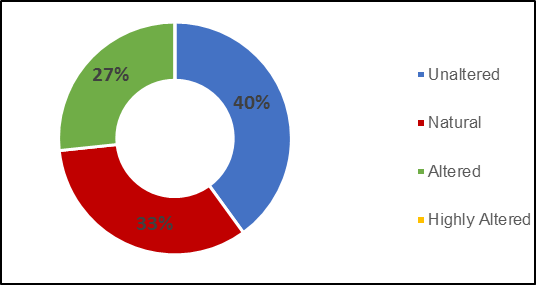
Stream alterations are classified based on specific functional criteria associated with the flow conditions, the riparian buffer and potential human influences. Figure 19 shows 40 percent of the sections surveyed on Blueberry Creek remains “unaltered” with no anthropogenic alterations. Thirty three percent of Blueberry Creek was classified as natural with minor anthropogenic changes, while 27 percent was considered altered. The alterations along Blueberry Creek were in the form of road and railway crossings.
Figure 19 Anthropogenic alterations along Blueberry Creek
3.3 Blueberry Creek Instream Aquatic Habitat
3.3.1 Benthic Invertebrates
Freshwater benthic invertebrates are animals without backbones that live on the stream bottom and include crustaceans such as crayfish, molluscs and immature forms of aquatic insects. Benthos represent an extremely diverse group of aquatic animals and exhibit wide ranges of responses to stressors such as organic pollutants, sediments and toxicants, which allows scientists to use them as bioindicators. As part of the Ontario Benthic Biomonitoring Network (OBBN), the RVCA has been collecting benthic invertebrates at the Highway 7 site on Blueberry Creek since 2011. This site was added in 2011 as result of an identified gap in the network during the previous preparation of the 2011 Tay River Subwatershed Report. Monitoring data is analyzed for each sample site and the results are presented using the Family Biotic Index, Family Richness and percent Ephemeroptera, Plecoptera and Trichoptera. There were no values recorded for the Fall of 2016 due to extreme drought conditions therefore no samples could be collected.
Hilsenhoff Family Biotic Index
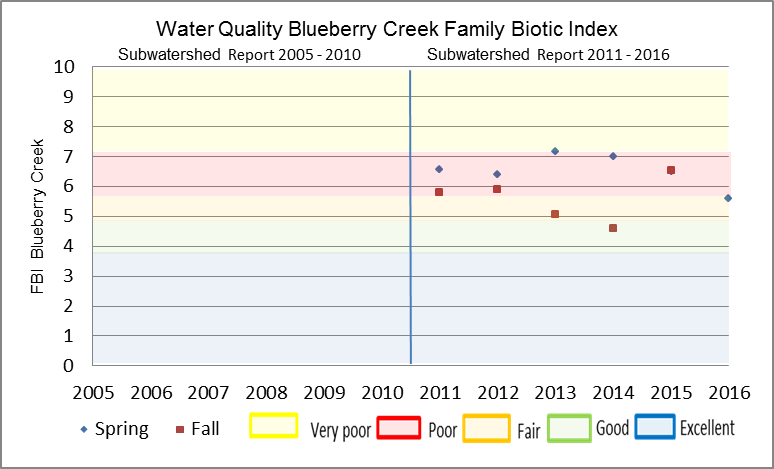
The Hilsenhoff Family Biotic Index (FBI) is an indicator of organic and nutrient pollution and provides an estimate of water quality conditions for each site using established pollution tolerance values for benthic invertebrates. FBI results for the Blueberry Creek catchment sample location at the Highway 7 sample location are summarized by year from 2011 to 2016. “Fair” to “Poor” water quality conditions were observed at the Blueberry Creek sample location (Figure 20) using a grading scheme developed by Conservation Authorities in Ontario for benthic invertebrates.
Figure 20 Hilsenhoff Family Biotic Index at the Highway 7 sample location
Family Richness
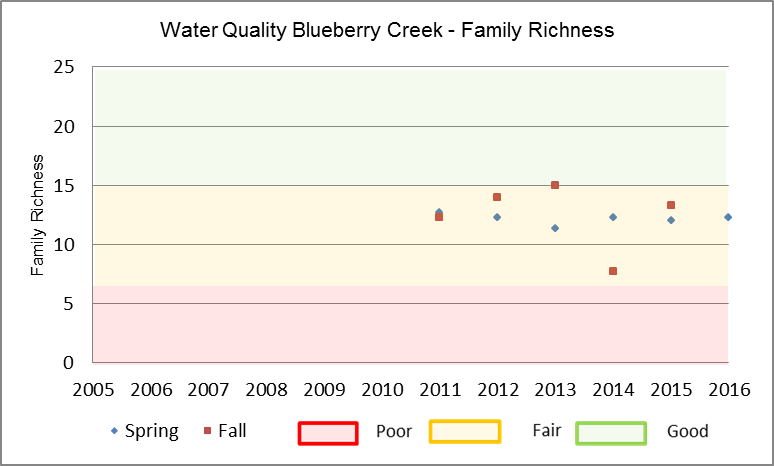
Family Richness measures the health of the community through its diversity and increases with increasing habitat diversity suitability and healthy water quality conditions. Family Richness is equivalent to the total number of benthic invertebrate families found within a sample. The Blueberry Creek site is reported to have “Fair” family richness (Figure 21).
Figure 21 Family Richness at the Highway 7 sample location
EPT
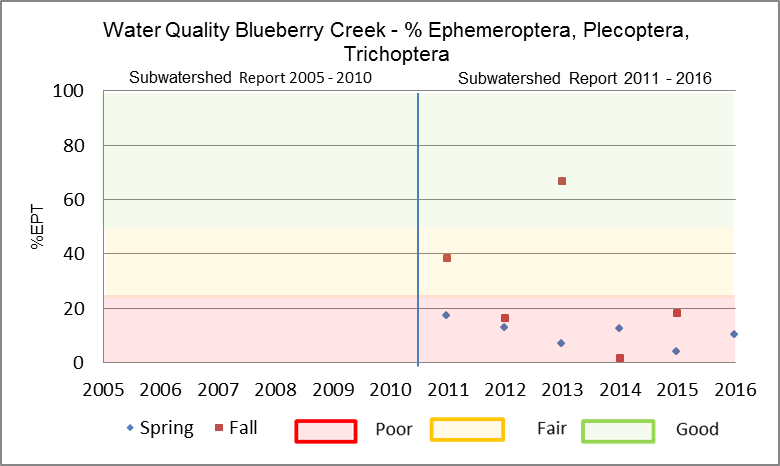
Ephemeroptera (Mayflies), Plecoptera (Stoneflies), and Trichoptera (Caddisflies) are species considered to be very sensitive to poor water quality conditions. High abundance of these organisms is generally an indication of good water quality conditions at a sample location. The community structure is dominated by species that are moderately tolerant and tolerant to poorer water quality conditions. As a result, the EPT indicates that the Blueberry Creek sample location is reported to have “Fair to Poor” water quality (Figure 22) from 2011 to 2016.
Figure 22 EPT results at the Highway 7 sample location
Conclusion
Overall the Blueberry Creek sample location aquatic habitat conditions from a benthic invertebrate perspective is considered “Fair to Poor” from 2011 to 2016 as the samples are dominated by species that are moderately tolerant and tolerant to high organic pollution levels.
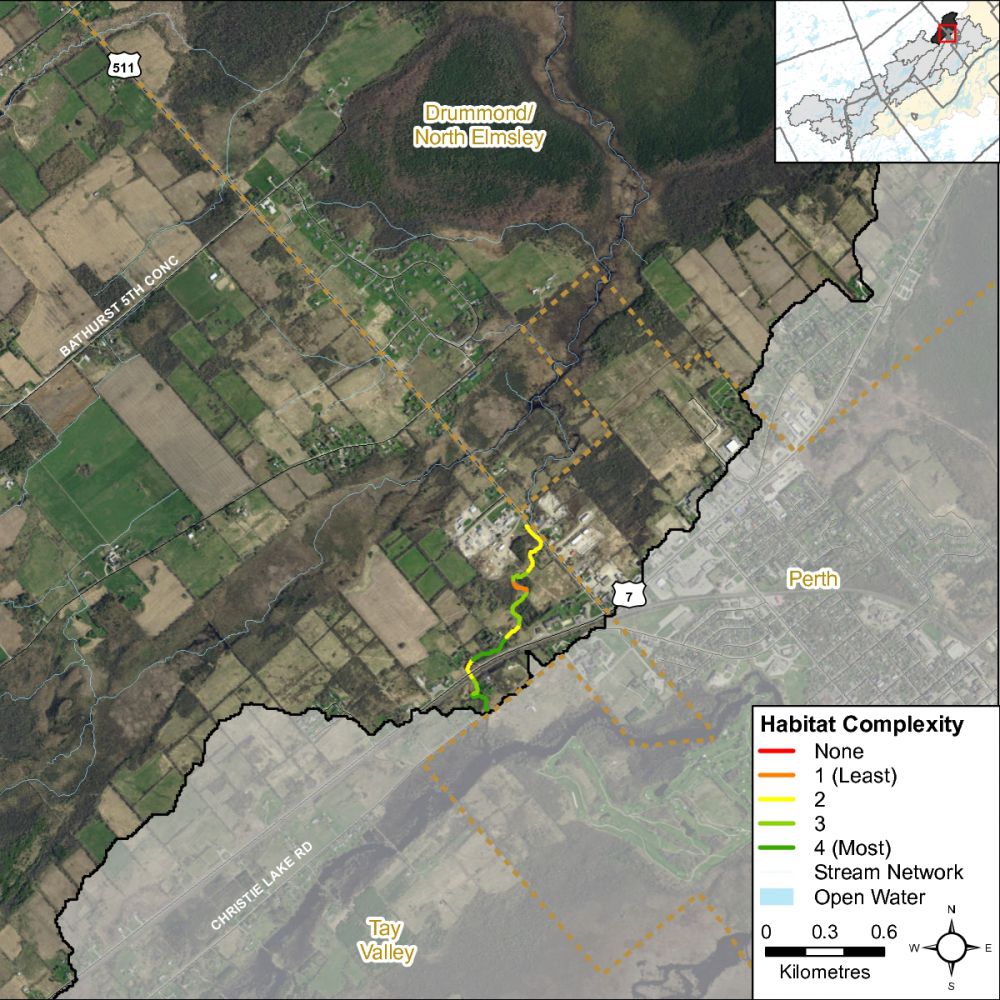
3.3.2 Habitat Complexity
Habitat complexity is a measure of the overall diversity of habitat types and features within a stream. Streams with high habitat complexity support a greater variety of species niches, and therefore contribute to greater diversity. Factors such as substrate, flow conditions (pools, riffles) and cover material (vegetation, wood structure, etc.) all provide crucial habitat to aquatic life. Habitat complexity is assessed based on the presence of boulder, cobble and gravel substrates, as well as the presence of instream wood structure.
Low to high habitat complexity was identified for Blueberry Creek (Figure 23). Regions with increased habitat complexity were observed in the lower and middle reaches of the surveyed sections of the system within the catchment.
Figure 23 Habitat complexity along Blueberry Creek
3.3.3 Instream Substrate
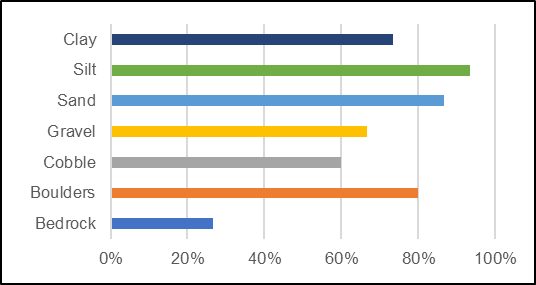
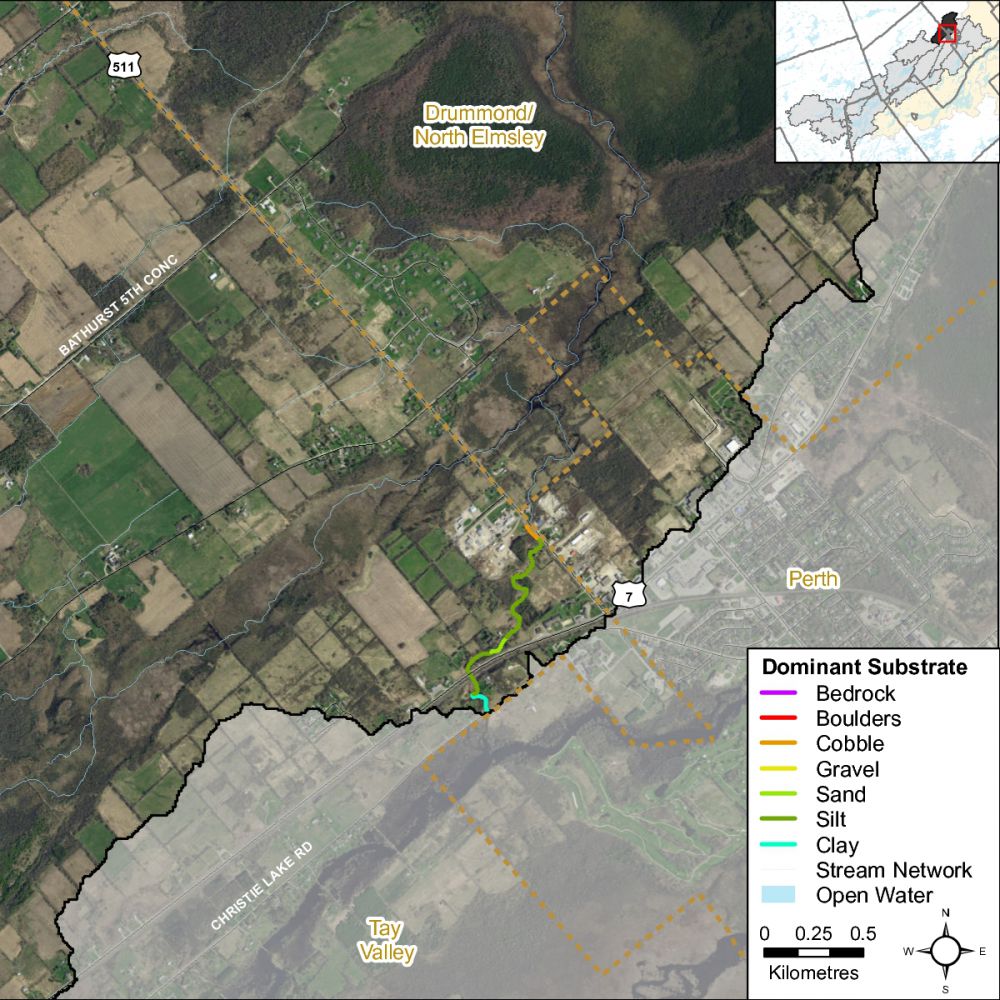
Diverse substrate is important for fish and benthic invertebrate habitat because some species have specific substrate requirements and for example will only reproduce on certain types of substrate. The absence of diverse substrate types may limit the overall diversity of species within a stream. Figure 24 shows the overall presence of various substrate types observed along Blueberry Creek. Substrate conditions were highly diverse along Blueberry Creek with all substrate types being recorded at various locations along the creek. Figure 25 shows the dominant substrate type observed for each section surveyed along Blueberry Creek.
Figure 24 Instream substrate along Blueberry Creek
Figure 25 shows the dominant substrate type along Blueberry Creek
3.3.4 Instream Morphology
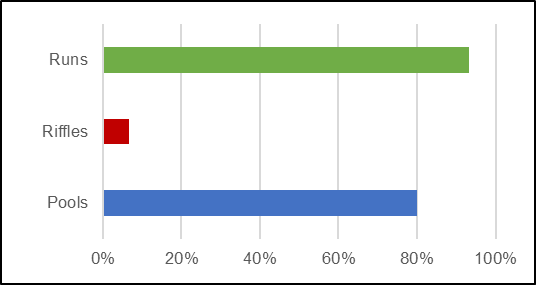
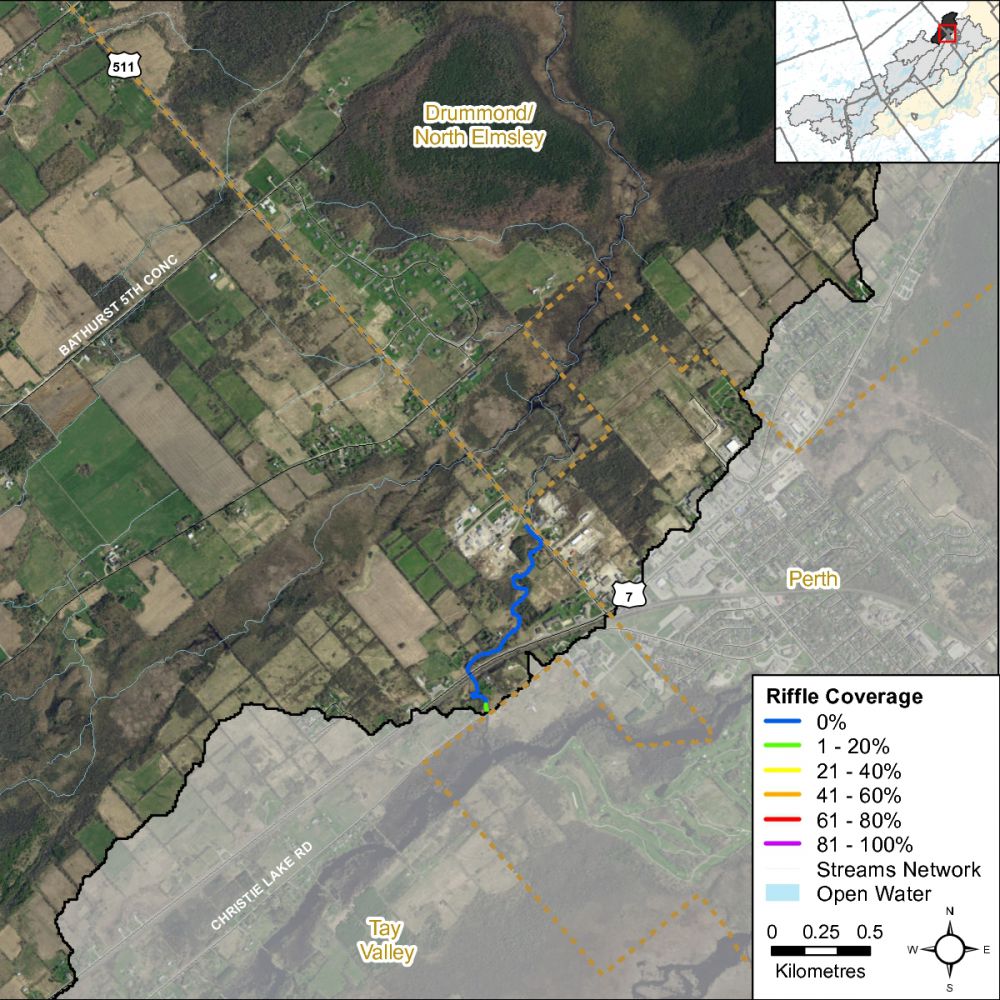
Pools and riffles are important habitat features for aquatic life. Riffles are fast flowing areas characterized by agitation and overturn of the water surface. Riffles thereby play a crucial role in contributing to dissolved oxygen conditions and directly support spawning for some fish species. They are also areas that support high benthic invertebrate populations which are an important food source for many aquatic species. Pools are characterized by minimal flows, with relatively deep water and winter/summer refuge habitat for aquatic species. Runs are moderately shallow, with unagitated surfaces of water and areas where the thalweg (deepest part of the channel) is in the center of the channel. Figure 26 shows that Blueberry Creek is fairly uniform; 93 percent of sections recorded runs, 80 percent pools and seven percent riffles. Figure 27 shows where the limited riffle habitat area was observed in the lower reach of Blueberry Creek.
Figure 26 Instream morphology along Blueberry Creek
Figure 27 Instream riffle habitat along Blueberry Creek
3.3.5 Vegetation Type
Instream vegetation provides a variety of functions and is a critical component of the aquatic ecosystem. Aquatic plants promote stream health by:
- Providing direct riparian/instream habitat
- Stabilizing flows reducing shoreline erosion
- Contributing to dissolved oxygen through photosynthesis
- Maintaining temperature conditions through shading
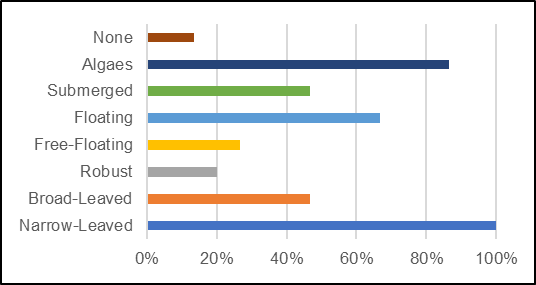
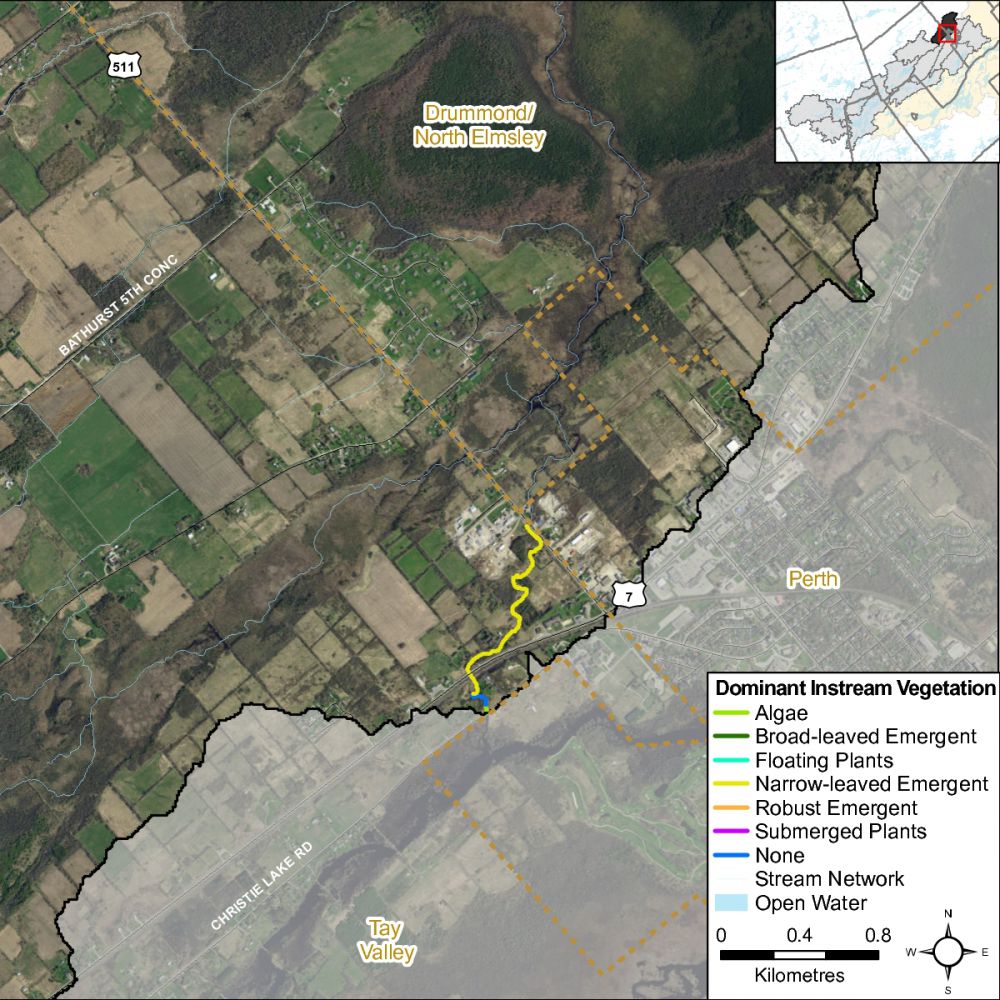
For example emergent plants along the shoreline can provide shoreline protection from wave action and important rearing habitat for species of waterfowl. Submerged plants provide habitat for fish to find shelter from predator fish while they feed. Floating plants such as water lilies shade the water and can keep temperatures cool while reducing algae growth. Narrow leaved emergents were present in 100% of the sections surveyed, algae was observed in 87% of sections, floating plants were observed in 67% of sections surveyed, broad leaved emergent and submerged plants were observed in 47% of sections while robust emergent were documented in 20% of sections surveyed. Figure 28 depicts the plant community structure for Blueberry Creek. Figure 29 shows the dominant vegetation type observed for each section surveyed along the Blueberry Creek catchment.
Figure 28 Vegetation type along Blueberry Creek
Figure 29 Dominant vegetation type along Blueberry Creek
3.3.6 Instream Vegetation Abundance
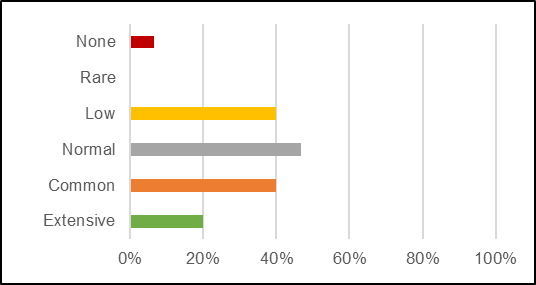
Instream vegetation is an important factor for a healthy stream ecosystem. Vegetation helps to remove contaminants from the water, contributes oxygen to the stream, and provides habitat for fish and wildlife. Too much vegetation can also be detrimental. Figure 30 demonstrates that the Blueberry Creek reach had normal to common levels of vegetation recorded at 47 and 40 percent of stream surveys. Extensive levels of vegetation were observed along 20 percent of the surveyed sections while seven percent of sections had areas with no vegetation.
Figure 30 Instream vegetation abundance along Blueberry Creek
3.3.7 Invasive Species
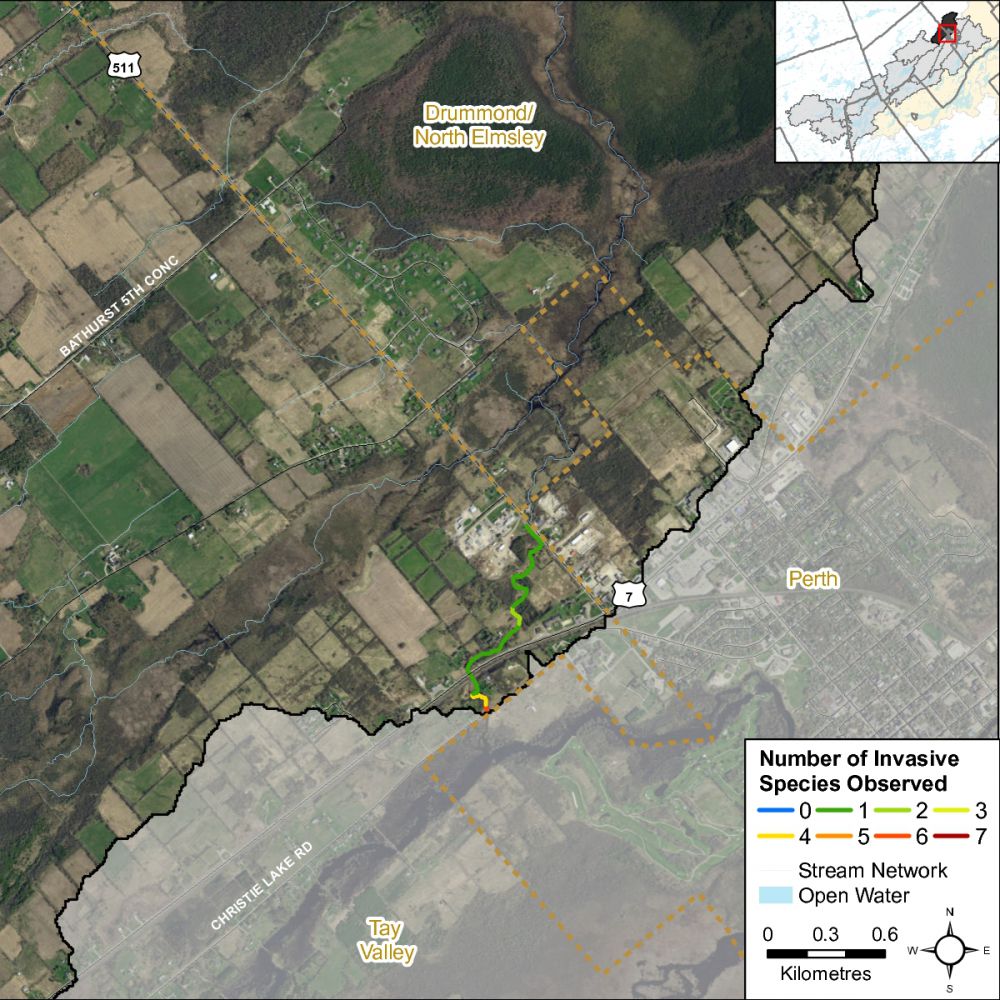
Invasive species can have major implications on streams and species diversity. Invasive species are one of the largest threats to ecosystems throughout Ontario and can out compete native species, having negative effects on local wildlife, fish and plant populations. One hundred percent of the sections surveyed along Blueberry Creek reach had invasive species. The invasive species observed in the Blueberry Creek reach were European frogbit, bull thistle, common/glossy buckthorn, purple loosestrife and poison parsnip. Invasive species abundance (i.e. the number of observed invasive species per section) was assessed to determine the potential range/vector of many of these species (Figure 31).
Figure 31 Invasive species abundance along Blueberry Creek
3.3.8 Water Chemistry
During the stream characterization survey, a YSI probe is used to collect water chemistry information. Dissolved oxygen (DO), specific conductivity (SPC) and pH are measured at the start and end of each section.
3.3.8.1 Dissolved Oxygen
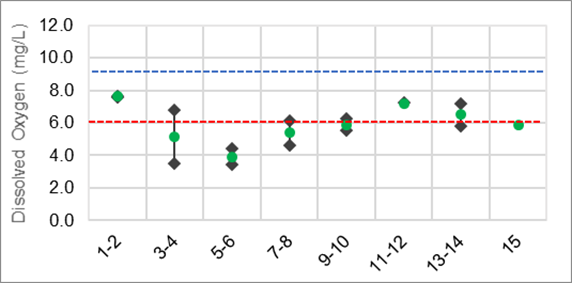
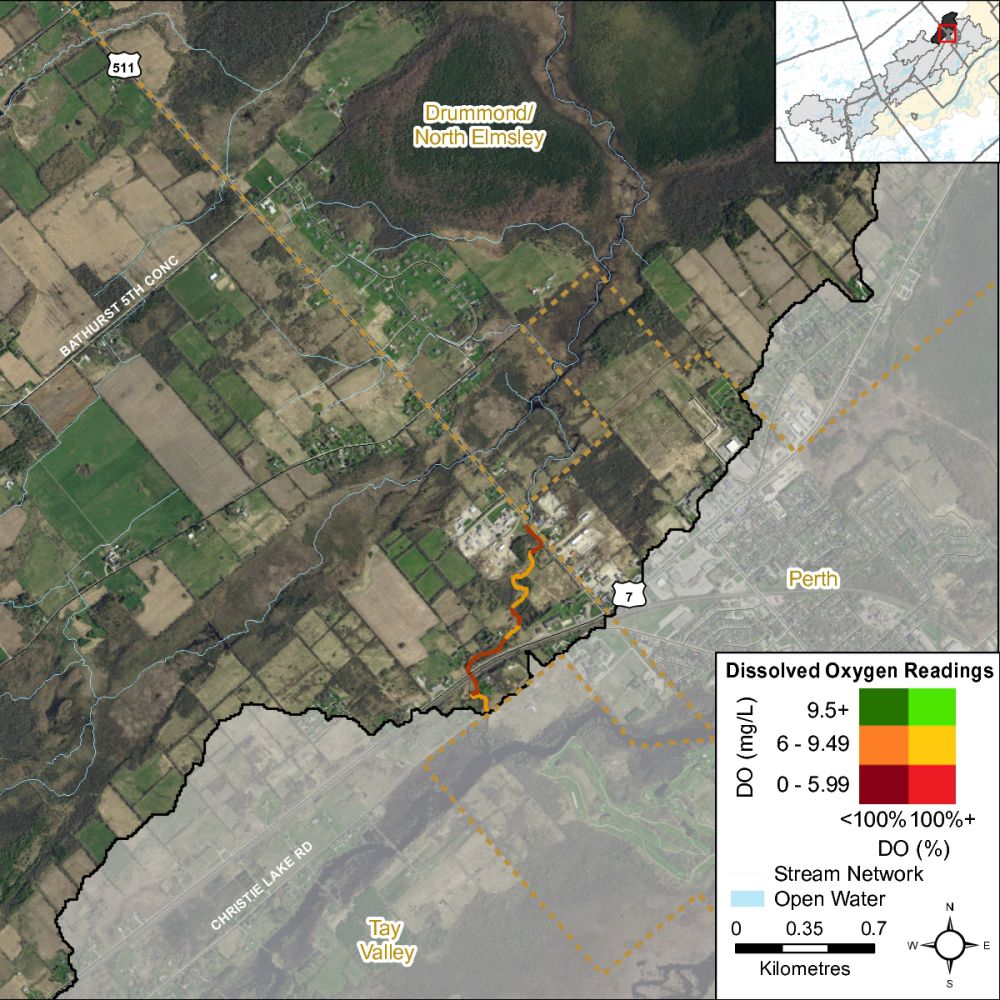
Dissolved oxygen is a measure of the amount of oxygen dissolved in water. The Canadian Environmental Quality Guidelines of the Canadian Council of Ministers of the Environment (CCME) suggest that for the protection of aquatic life the lowest acceptable dissolved oxygen concentration should be 6 mg/L for warmwater biota and 9.5 mg/L for coldwater biota (CCME, 1999). Figure 32 shows that the dissolved oxygen in Blueberry Creek supports warmwater biota and in certain locations is below the recommended levels to support aquatic life. The average dissolved oxygen levels observed within Blueberry Creek was 5.9mg/L which is just below the recommended levels for warmwater biota.
Figure 32 Dissolved oxygen ranges along Blueberry Creek
3.3.8.2 Conductivity
Conductivity in streams is primarily influenced by the geology of the surrounding environment, but can vary drastically as a function of surface water runoff. Currently there are no CCME guideline standards for stream conductivity; however readings which are outside the normal range observed within the system are often an indication of unmitigated discharge and/or stormwater input. The average conductivity observed within the main stem of Blueberry Creek was 540.7 µs/cm. Figure 33 shows the conductivity readings for Blueberry Creek.
Figure 33 Specific conductivity ranges in Blueberry Creek
3.3.8.3 pH
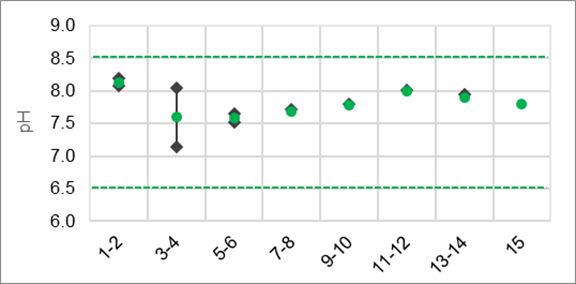
Based on the PWQO for pH, a range of 6.5 to 8.5 should be maintained for the protection of aquatic life. Average pH values for the Blueberry Creek catchment averaged 7.81 thereby meeting the provincial standard (Figure 34).
Figure 34 pH ranges in Blueberry Creek
3.3.8.4 Oxygen Saturation (%)
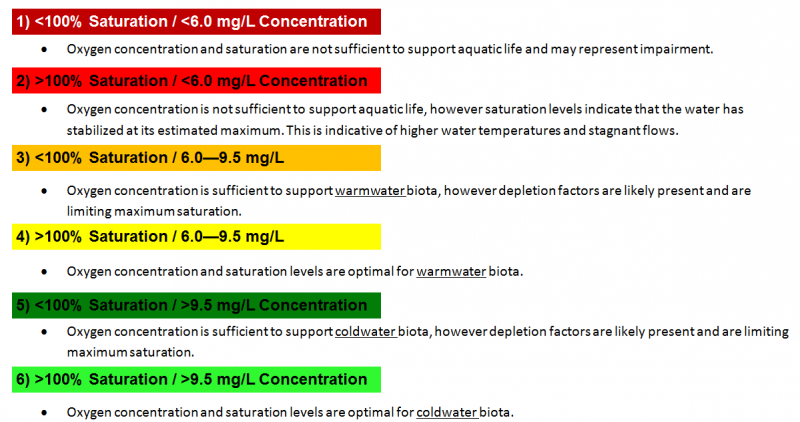
Oxygen saturation is measured as the ratio of dissolved oxygen relative to the maximum amount of oxygen that will dissolve based on the temperature and atmospheric pressure. Well oxygenated water will stabilize at or above 100% saturation, however the presence of decaying matter/pollutants can drastically reduce these levels. Oxygen input through photosynthesis has the potential to increase saturation above 100% to a maximum of 500%, depending on the productivity level of the environment. In order to represent the relationship between concentration and saturation, the measured values have been summarized into 6 classes:
Dissolved oxygen conditions along Blueberry Creek varied along the system with areas below levels to support aquatic life as well as areas that support warmwater species (Figure 35).
Figure 35 A bivariate assessment of dissolved oxygen concentration (mg/L) and saturation (%) in Blueberry Creek
3.3.8.5 Specific Conductivity Assessment
Specific conductivity (SPC) is a standardized measure of electrical conductance, collected at or corrected to a water temperature of 25⁰C. SPC is directly related to the concentration of ions in water, and is commonly influenced by the presence of dissolved salts, alkalis, chlorides, sulfides and carbonate compounds. The higher the concentration of these compounds, the higher the conductivity. Common sources of elevated conductivity include storm water, agricultural inputs and commercial/industrial effluents.
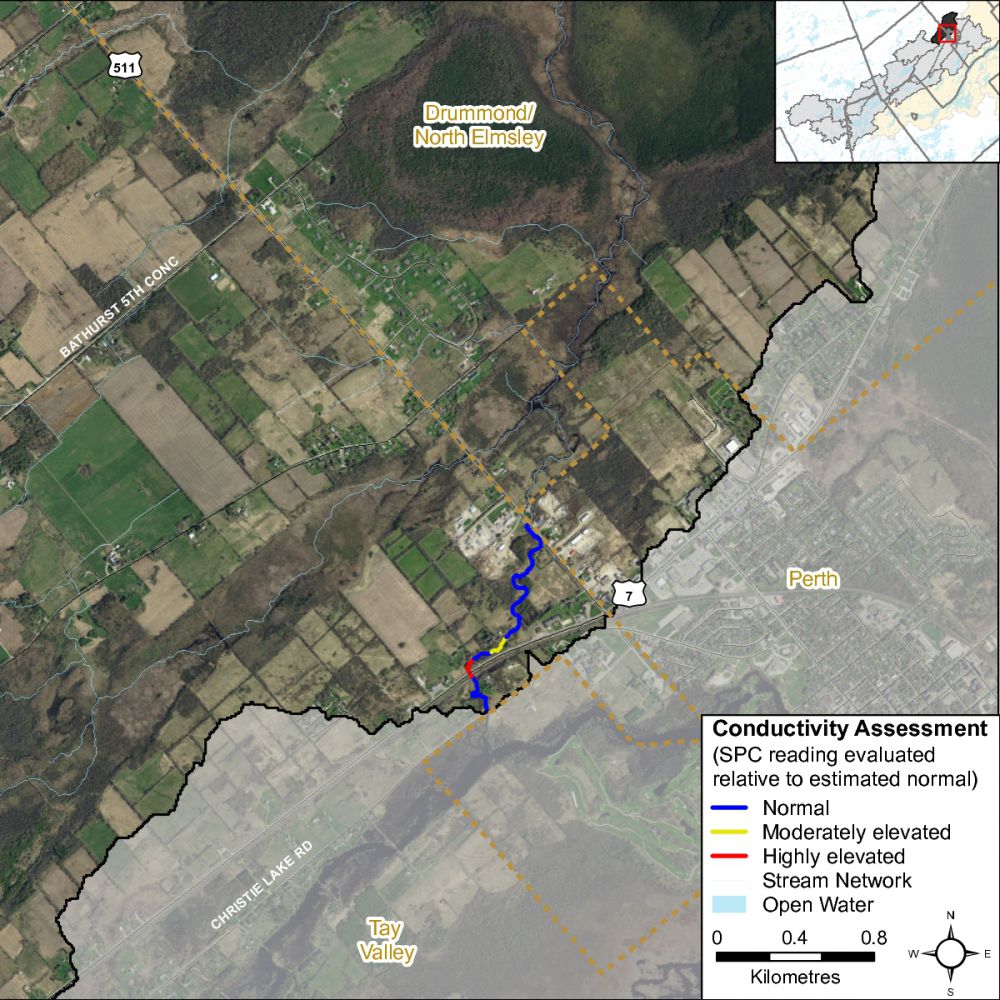
In order to summarize the conditions observed, SPC levels were evaluated as either normal, moderately elevated or highly elevated. These categories correspond directly to the degree of variation (i.e. standard deviation) at each site relative to the average across the system.
Normal levels were maintained along the majority of Blueberry Creek, however there were moderately and highly elevated areas in the middle reaches (Figure 36). The highly elevated area was located at the Highway 7 crossing likely linked to stormwater runoff from the roadway.
Figure 36 Relative specific conductivity levels along Blueberry Creek
3.3.9 Thermal Regime
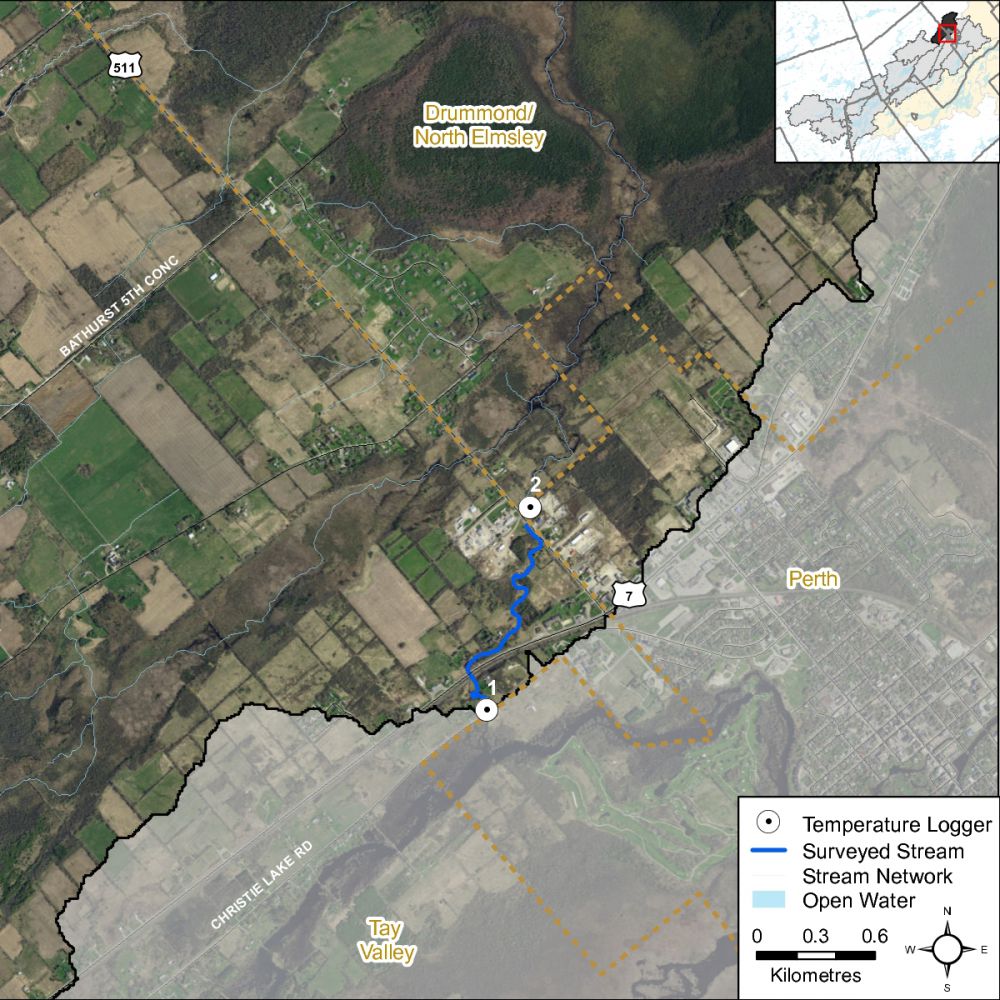
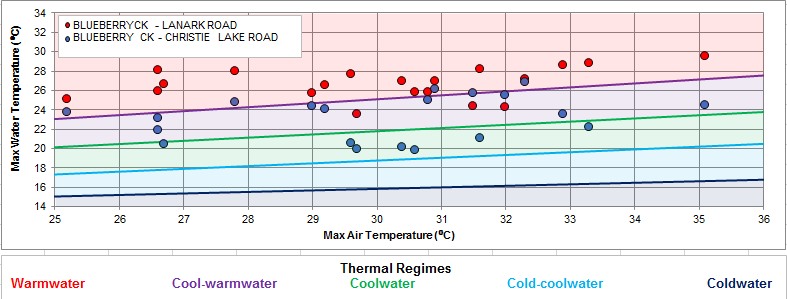
Many factors can influence fluctuations in stream temperature, including springs, tributaries, precipitation runoff, discharge pipes and stream shading from riparian vegetation. Water temperature is used along with the maximum air temperature (using the Stoneman and Jones method) to classify a watercourse as either warm water, cool water or cold water. Figure 37 shows where the thermal sampling sites were located on Blueberry Creek. Analysis of the data collected indicates that Blueberry Creek catchment is classified as a warm water system with cool water reaches (Figure 38).
Figure 37 Temperature logger locations along Blueberry Creek
Figure 38 Temperature logger data for the sites on Blueberry Creek
Each point on the graph represents a temperature that meets the following criteria:
- Sampling dates between July 1st and September 7th
- Sampling date is preceded by two consecutive days above 24.5 °C, with no rain
- Water temperatures are collected at 4pm
- Air temperature is recorded as the max temperature for that day
3.3.10 Groundwater
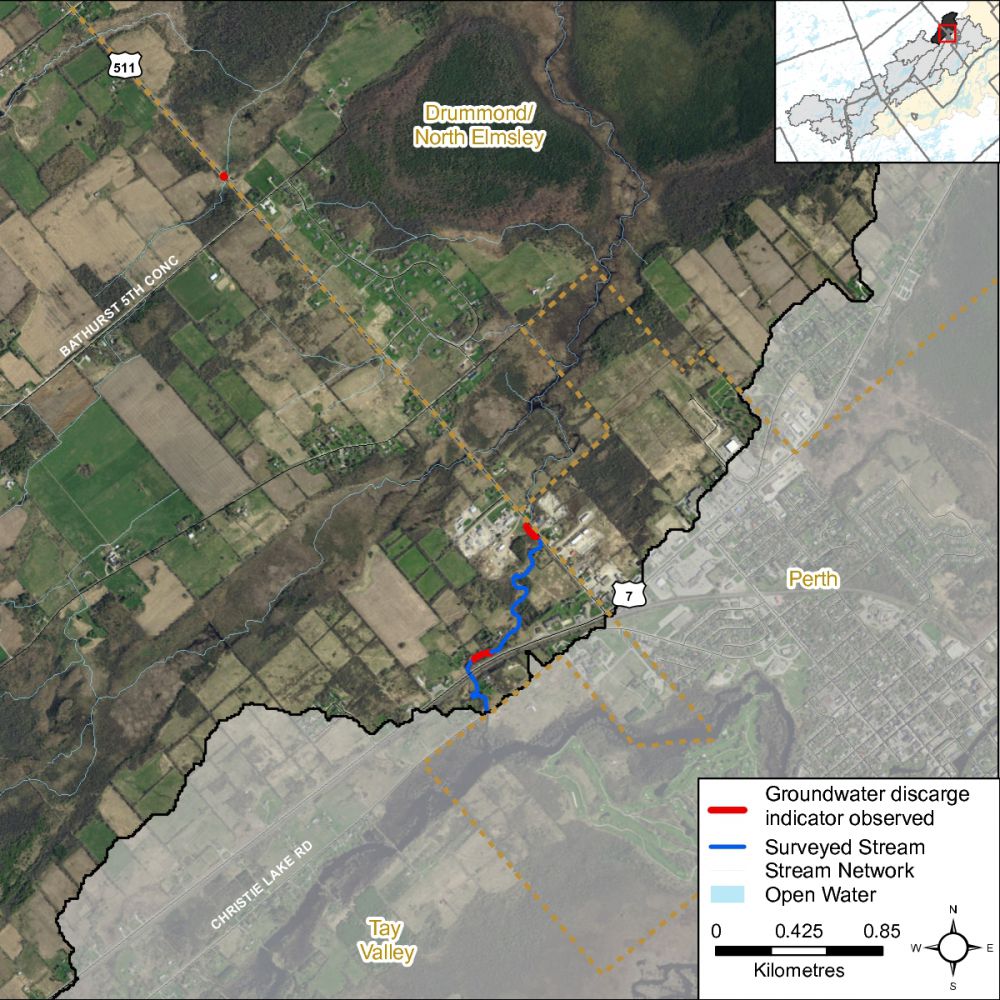
Groundwater discharge areas can influence stream temperature, contribute nutrients, and provide important stream habitat for fish and other biota. During stream surveys, indicators of groundwater discharge are noted when observed. Indicators include: springs/seeps, watercress, iron staining, significant temperature change and rainbow mineral film. Figure 39 shows areas where one or more of the above groundwater indicators were observed during stream surveys and headwater drainage feature assessments.
Figure 39 Groundwater indicators observed in the Blueberry Creek catchment
3.3.11 Fish Community
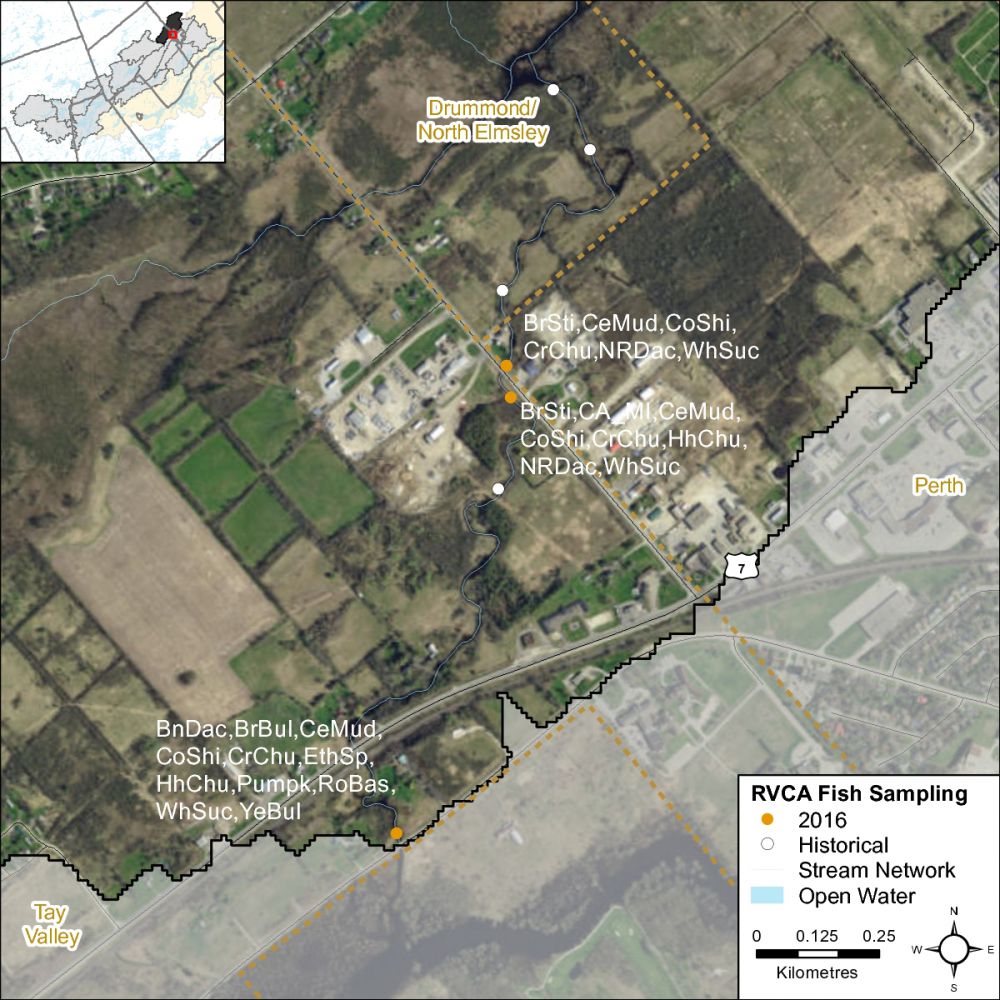
The Blueberry Creek catchment is classified as a mixed community of warm and cool water recreational and baitfish fishery with 14 species observed. Table 7 is a list of species observed historically in the catchment and during the 2016 field sampling season. Figure 40 shows the sampling locations of the fish species identified in the catchment.
Table 7 Fish species observed in the Blueberry Creek catchment
Figure 40 Historical and 2016 fish sampling locations in the catchment.
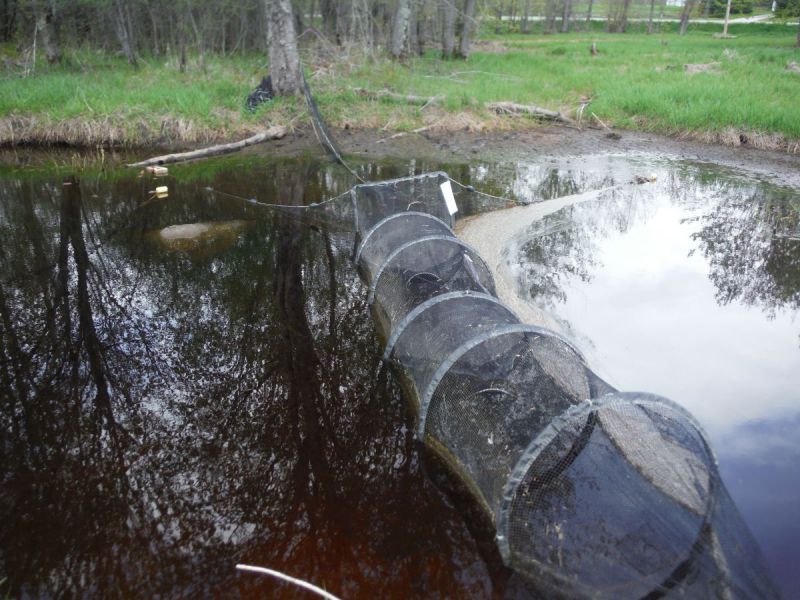
A fyke net set on Blueberry Creek in 2016
3.3.12 Beaver Dams
Overall beaver dams create natural changes in the environment. Some of the benefits include providing habitat for wildlife, flood control, and silt retention. Additional benefits come from bacterial decomposition of woody material used in the dams which removes excess nutrient and toxins. Beaver dams have the potential to flood agricultural areas and can be considered potential barriers to fish migration.
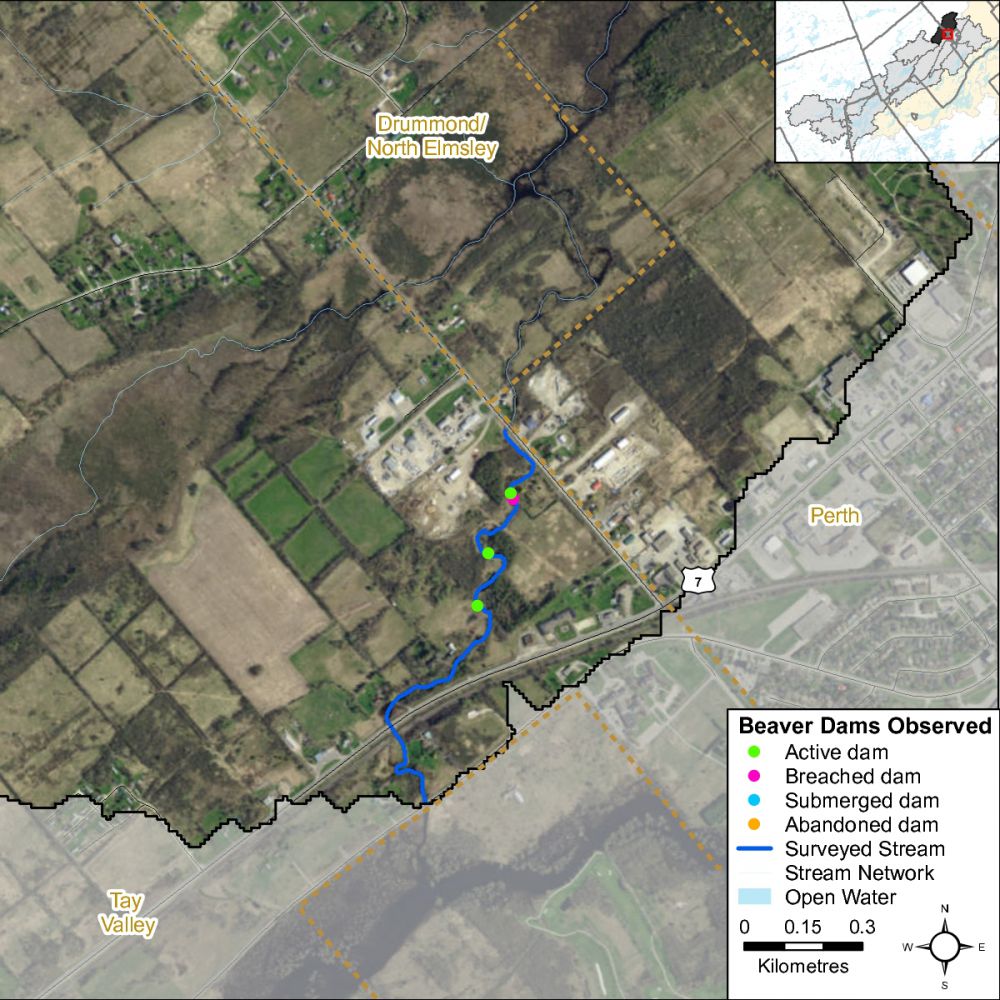
Several beaver dams were identified on the surveyed portions of Blueberry Creek in 2016 (Figure 41).
Figure 41 Beaver Dam type and locations along Blueberry Creek
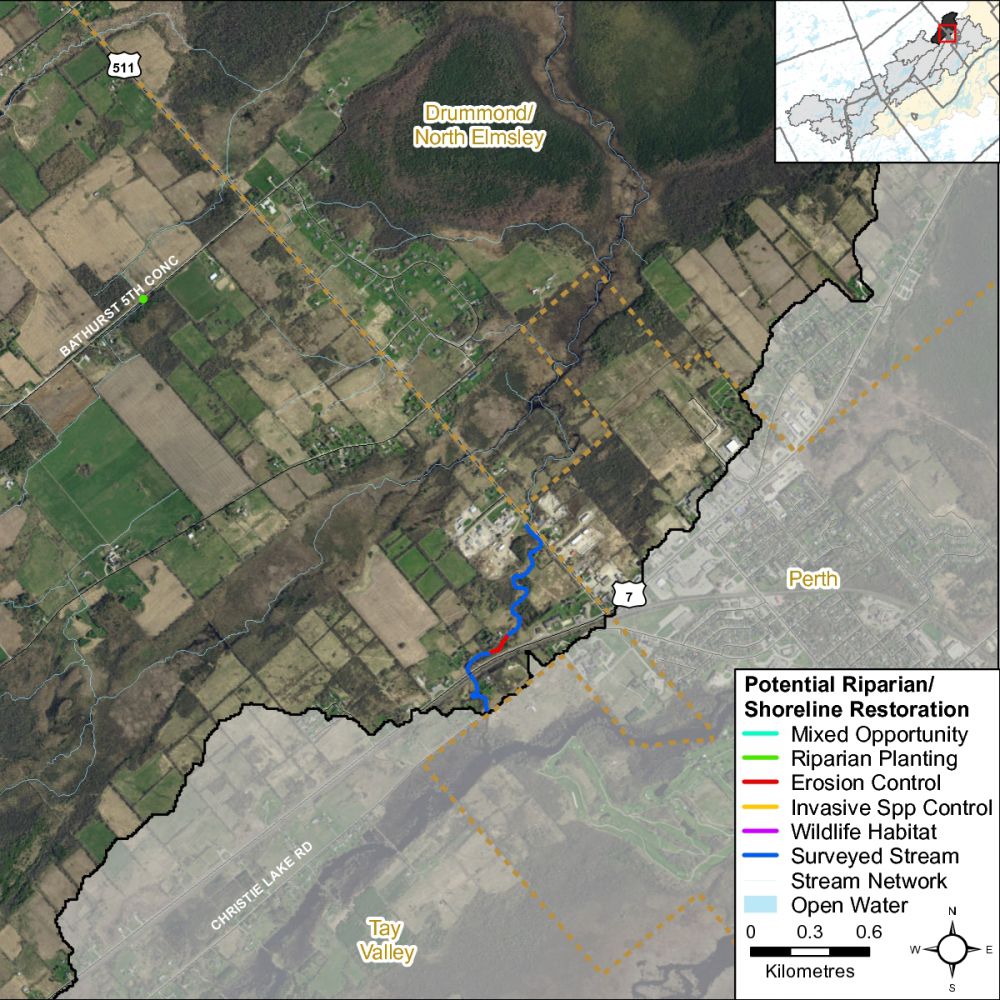
3.3.13 Riparian Restoration
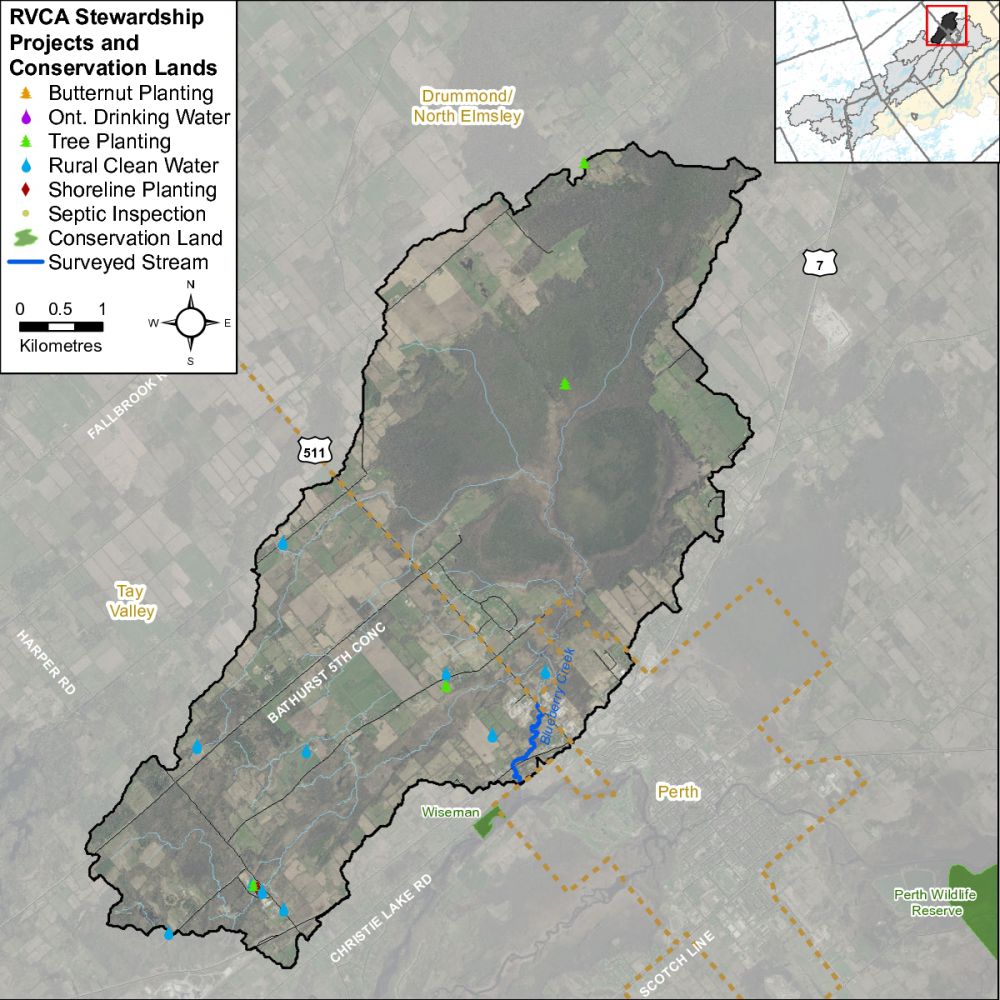
Figure 42 depicts the locations of riparian restoration opportunities as a result of observations made during the stream survey. The project recommended is one that involves streambank erosion mitigation.
Figure 42 Riparian restoration opportunities in the Blueberry Creek catchment
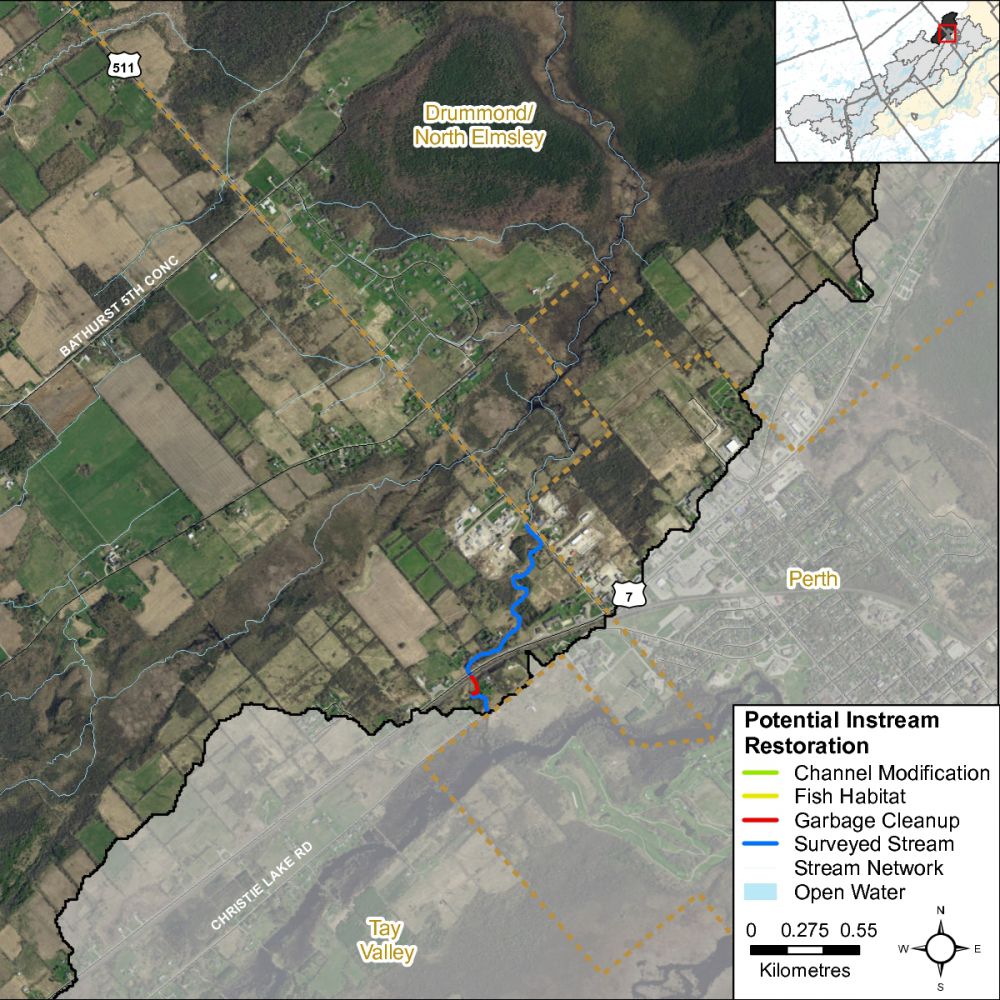
3.3.14 Instream Restoration
Figure 43 depicts the locations of instream restoration opportunities as a result of observations made during the stream survey. The project recommended is a stream garbage cleanup opportunity downstream of Highway 7.
Figure 43 Instream restoration opportunities in the Blueberry Creek catchment
3.4 Headwater Drainage Feature Assessment
3.4.1 Headwaters Sampling Locations
The RVCA Stream Characterization Program assessed Headwater Drainage Features for the Bluberry Creek subwatershed in 2017. This protocol measures zero, first and second order headwater drainage features (HDF). It is a rapid assessment method characterizing the amount of water, sediment transport, and storage capacity within headwater drainage features (HDF). RVCA is working with other Conservation Authorities and the Ministry of Natural Resources and Forestry to implement the protocol with the goal of providing standard datasets to support science development and monitoring of headwater drainage features. An HDF is a depression in the land that conveys surface flow. Additionally, this module provides a means of characterizing the connectivity, form and unique features associated with each HDF (OSAP Protocol, 2013). In 2017 the program sampled 11 sites at road crossings in the Blueberry Creek catchment area (Figure 44).
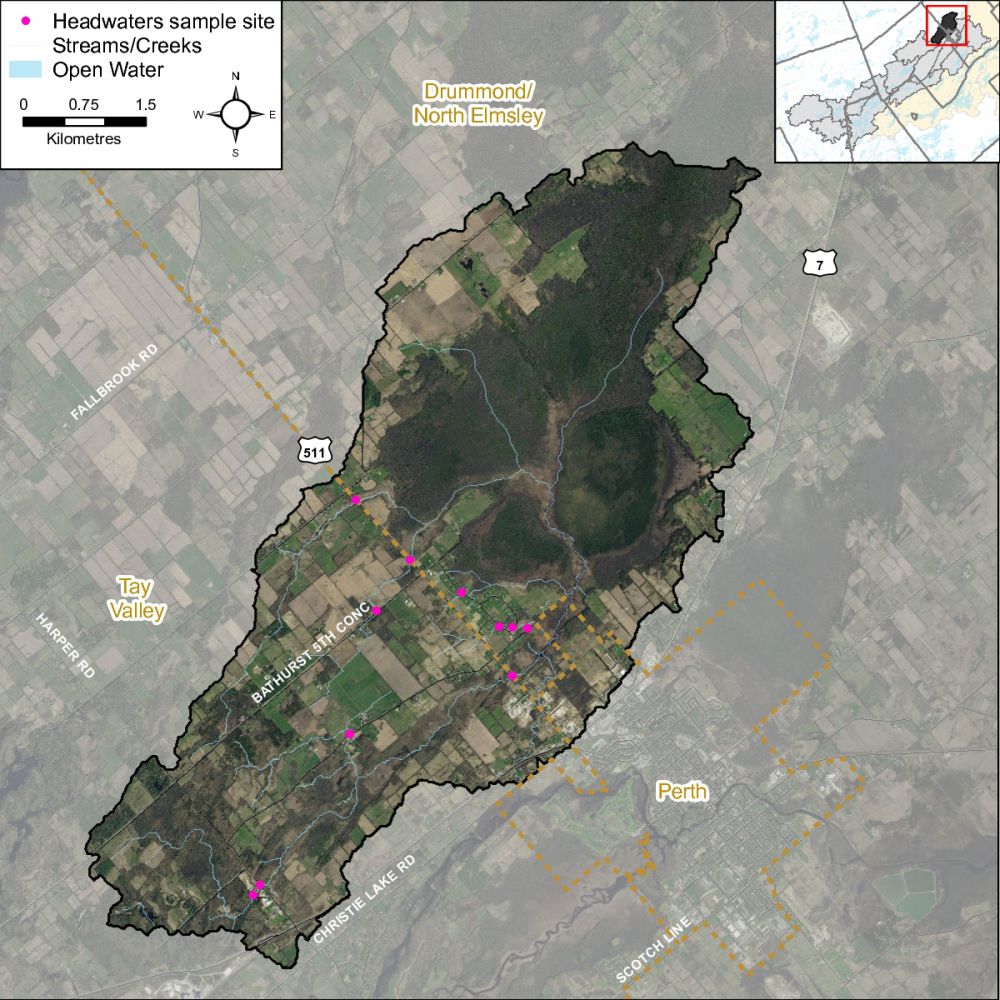
Figure 44 Location of the headwater sampling sites in the Blueberry Creek catchment
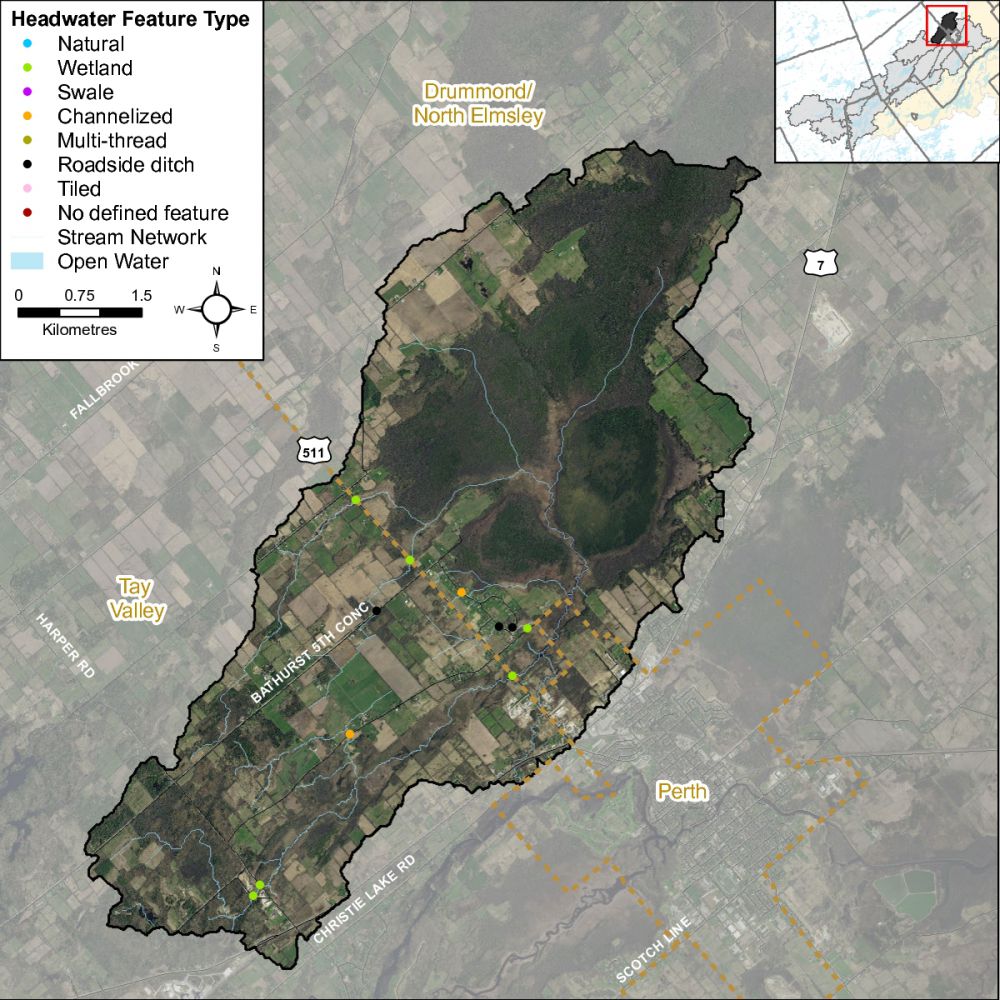
3.4.2 Headwater Feature Type
The headwater sampling protocol assesses the feature type in order to understand the function of each feature. The evaluation includes the following classifications: defined natural channel, channelized or constrained, multi-thread, no defined feature, tiled, wetland, swale, roadside ditch and pond outlet. By assessing the values associated with the headwater drainage features in the catchment area we can understand the ecosystem services that they provide to the watershed in the form of hydrology, sediment transport, and aquatic and terrestrial functions. The headwater drainage features in the Blueberry Creek catchment are primarily classified as wetland for a total of six; three were classified as a road side ditch and two features as channelized. Figure 45 shows the feature type of the primary feature at the sampling locations.
Figure 45 Headwater feature types in the Blueberry Creek catchment
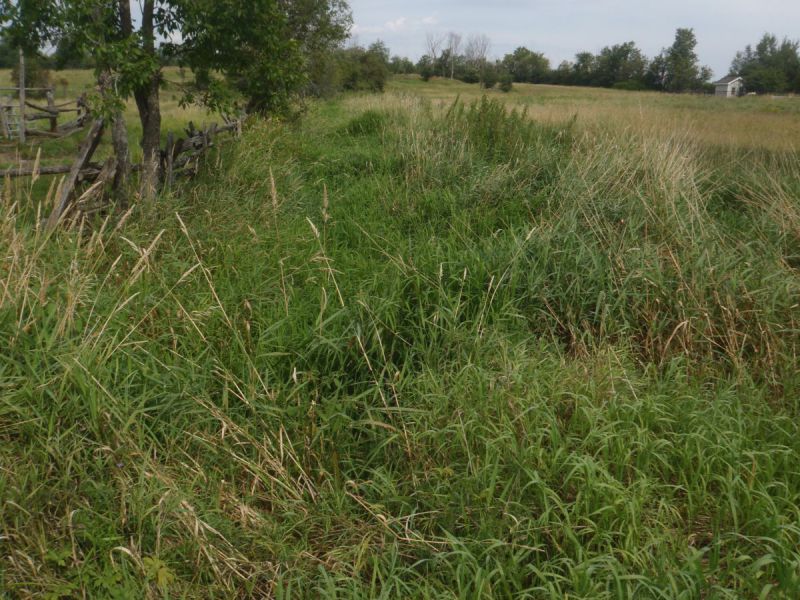
A spring photo of the headwater sample site in the Blueberry Creek catchment located on Clarchris Road
A summer photo of the headwater sample site in the Blueberry Creek catchment located on Clarchris Road
3.4.3 Headwater Feature Flow
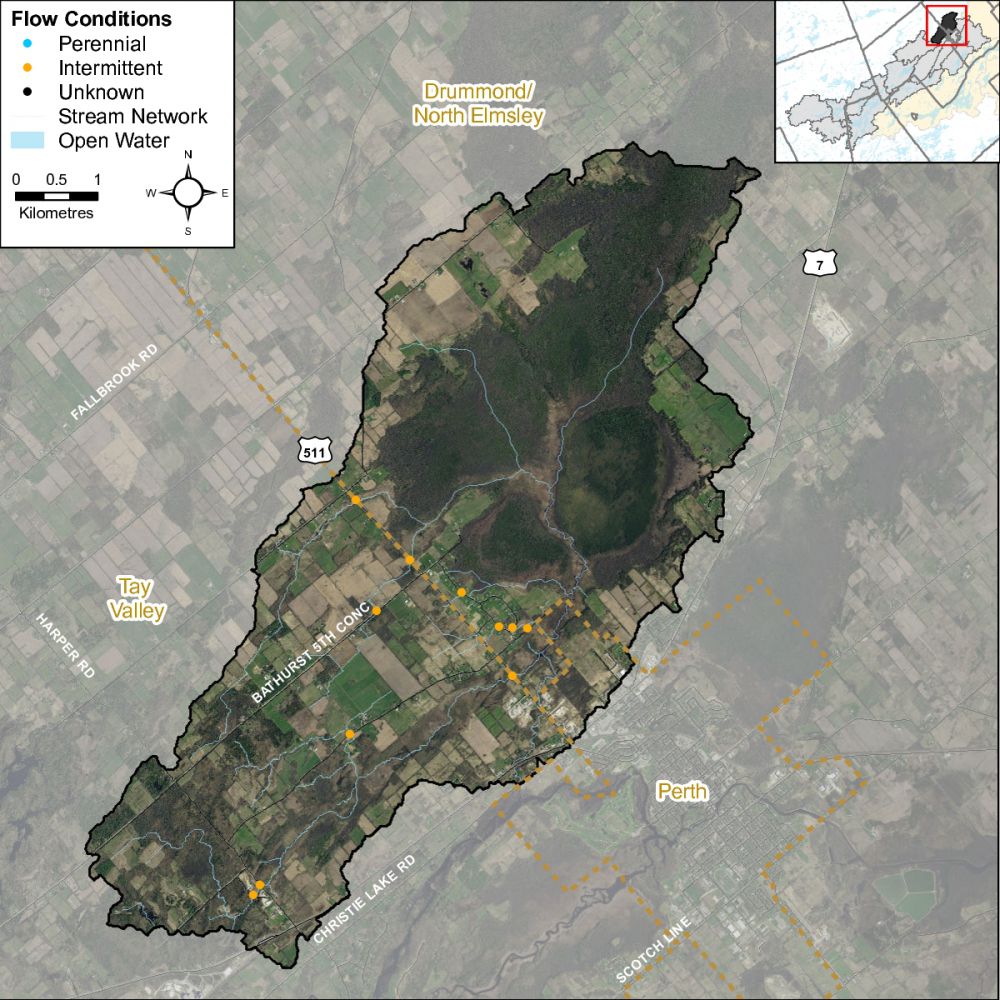
The observed flow condition within headwater drainage features can be highly variable depending on timing relative to the spring freshet, recent rainfall, soil moisture, etc. Flow conditions are assessed in the spring and in the summer to determine if features are perennial and flow year round, if they are intermittent and dry up during the summer months or if they are ephemeral systems that do not flow regularly and generally respond to specific rainstorm events or snowmelt. Flow conditions in headwater systems can change from year to year depending on local precipitation patterns. Figure 46 shows the observed flow condition at the sample locations in the Blueberry Creek catchment in 2017.
Figure 46 Headwater feature flow conditions in the Blueberry Creek catchment
3.4.4 Feature Channel Modifications
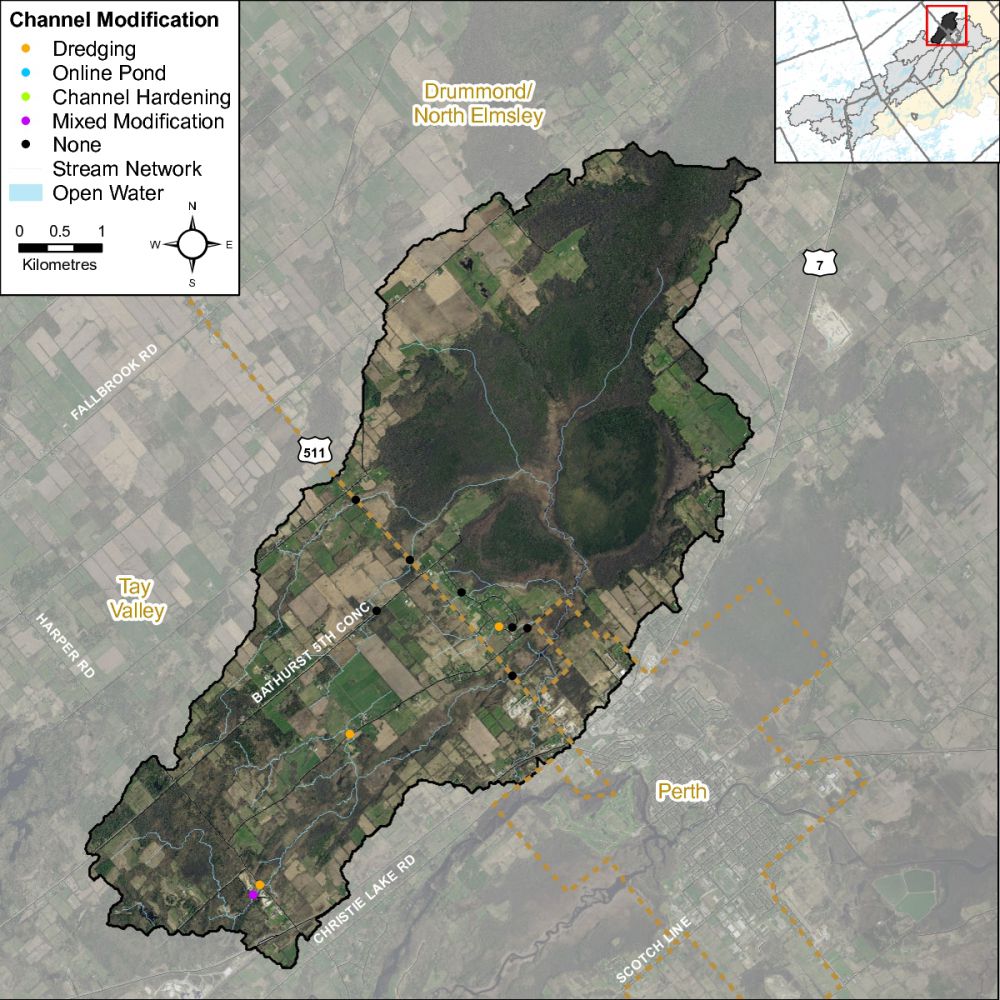
Channel modifications were assessed at each headwater drainage feature sampling location. Modifications include channelization, dredging, hardening and realignments. The Blueberry Creek catchment area had seven with no channel modifications observed, three sites as having been historically straightened/dredged and one location had mixed modifications. Figure 47 shows the channel modifications observed at the sampling locations for Blueberry Creek.
Figure 47 Headwater feature channel modifications in the Blueberry Creek catchment
3.4.5 Headwater Feature Vegetation
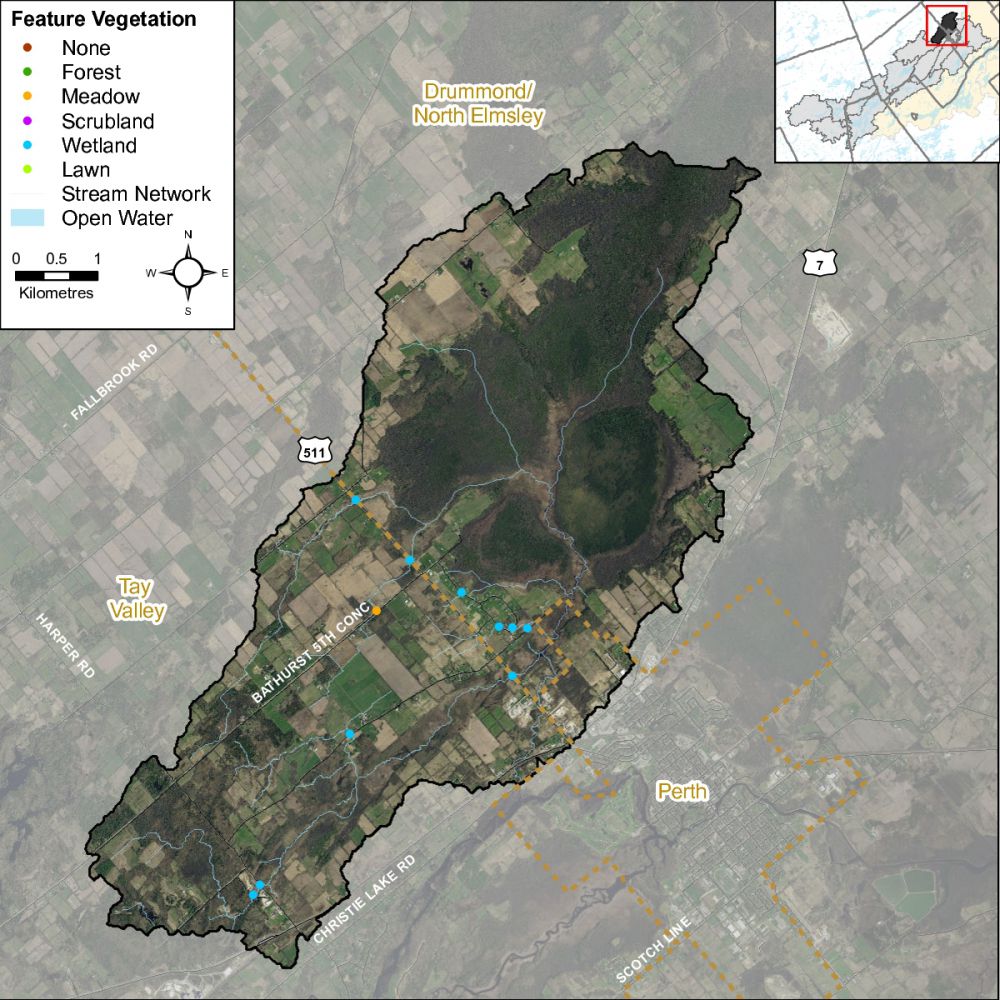
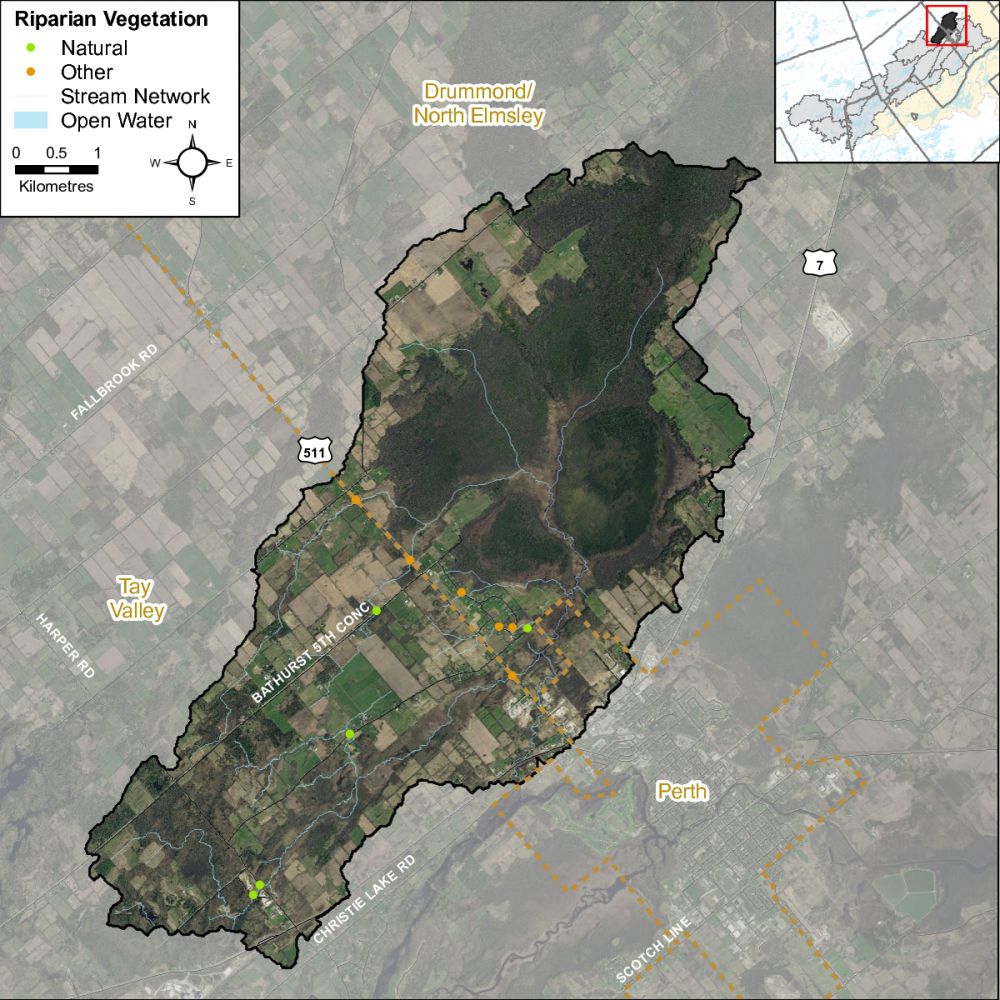
Headwater feature vegetation evaluates the type of vegetation that is found within the drainage feature. The type of vegetated within the channel influences the aquatic and terrestrial ecosystem values that the feature provides. For some types of headwater features the vegetation within the feature plays a very important role in flow and sediment movement and provides wildlife habitat. The following classifications are evaluated no vegetation, lawn, wetland, meadow, scrubland and forest. Figure 48 depicts the dominant vegetation observed at the sampled headwater sites in the Blueberry Creek catchment.
Figure 48 Headwater feature vegetation types in the Blueberry Creek catchment
3.4.6 Headwater Feature Riparian Vegetation
Headwater riparian vegetation evaluates the type of vegetation that is found along the adjacent lands of a headwater drainage feature. The type of vegetation within the riparian corridor influences the aquatic and terrestrial ecosystem values that the feature provides to the watershed. Figure 49 depicts the type of riparian vegetation observed at the sampled headwater sites in the Blueberry Creek catchment.
Figure 49 Headwater feature riparian vegetation types in the Blueberry Creek catchment
3.4.7 Headwater Feature Sediment Deposition
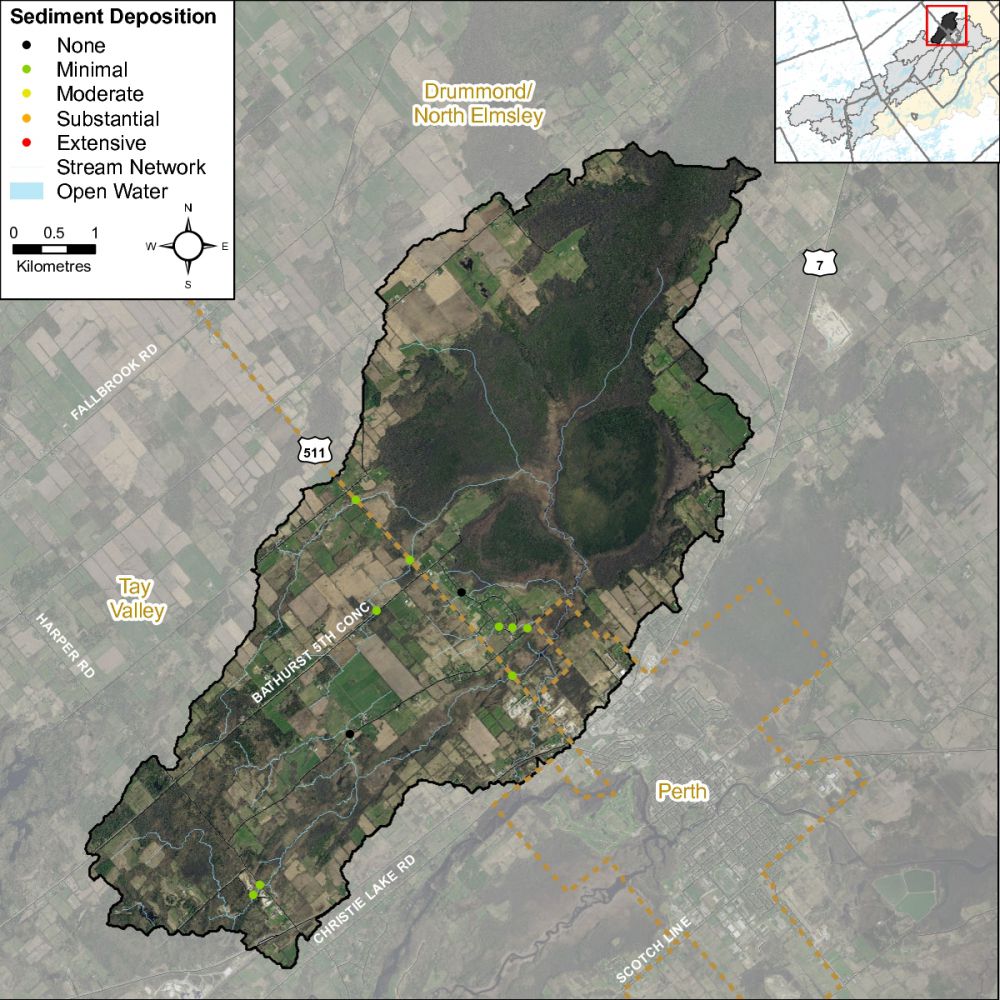
Assessing the amount of recent sediment deposited in a channel provides an index of the degree to which the feature could be transporting sediment to downstream reaches (OSAP, 2013). Evidence of excessive sediment deposition might indicate the requirement to follow up with more detailed targeted assessments upstream of the site location to identify potential best management practices to be implemented. Sediment deposition ranged from none to minimal for the headwater sites sampled in the Blueberry Creek catchment area. Figure 50 depicts the degree of sediment deposition observed at the sampled headwater sites in the Blueberry Creek catchment.
Figure 50 Headwater feature sediment deposition in the Blueberry Creek catchment
3.4.8 Headwater Feature Upstream Roughness
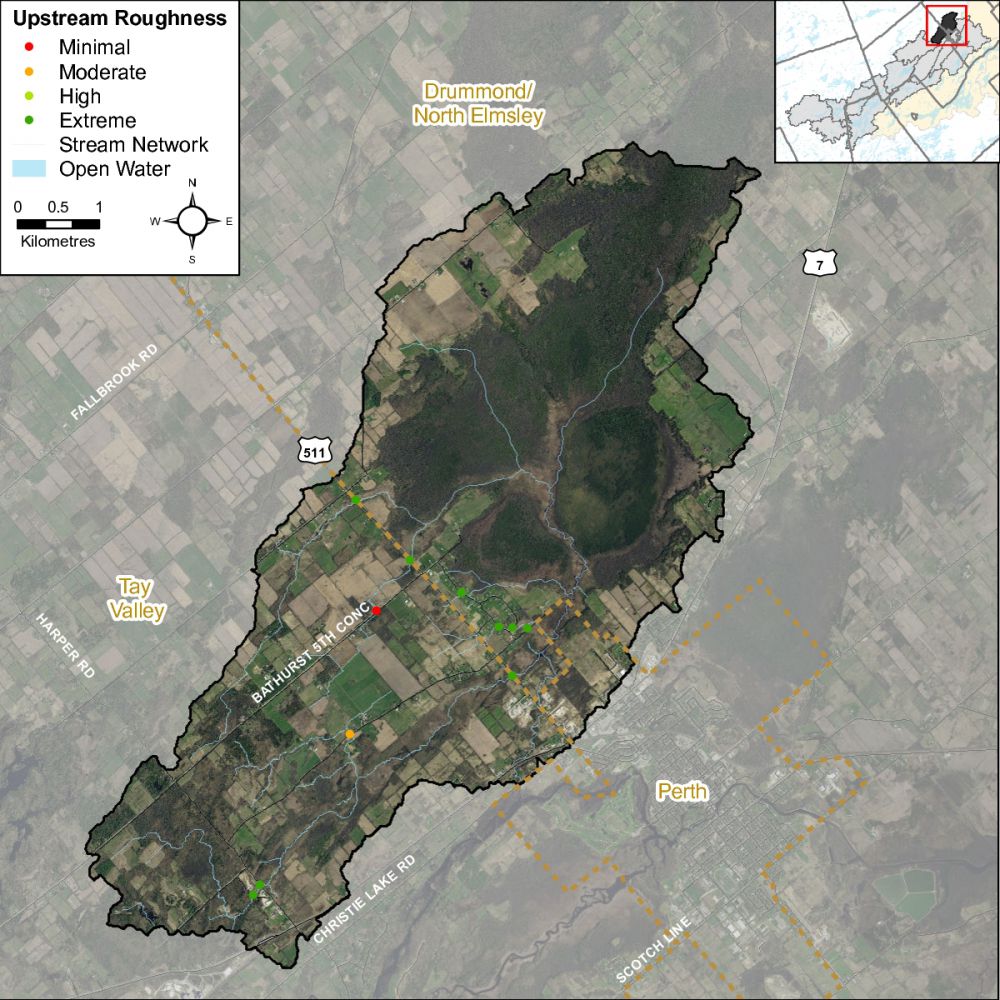
Feature roughness will provide a measure of the amount of materials within the bankfull channel that could slow down the velocity of water flowing within the headwater feature (OSAP, 2013). Materials on the channel bottom that provide roughness include vegetation, wood structure and boulders/cobble substrates. Roughness can provide benefits in mitigating downstream erosion on the headwater drainage feature and the receiving watercourse by reducing velocities. Roughness also provides important habitat conditions for aquatic organisms. Figure 51 shows the feature roughness conditions at the sampling location in the Blueberry Creek catchment.
Figure 51 Headwater feature roughness in the Blueberry Creek catchment
