Tay River Subwatershed Report 2017
PIKE LAKE CATCHMENT
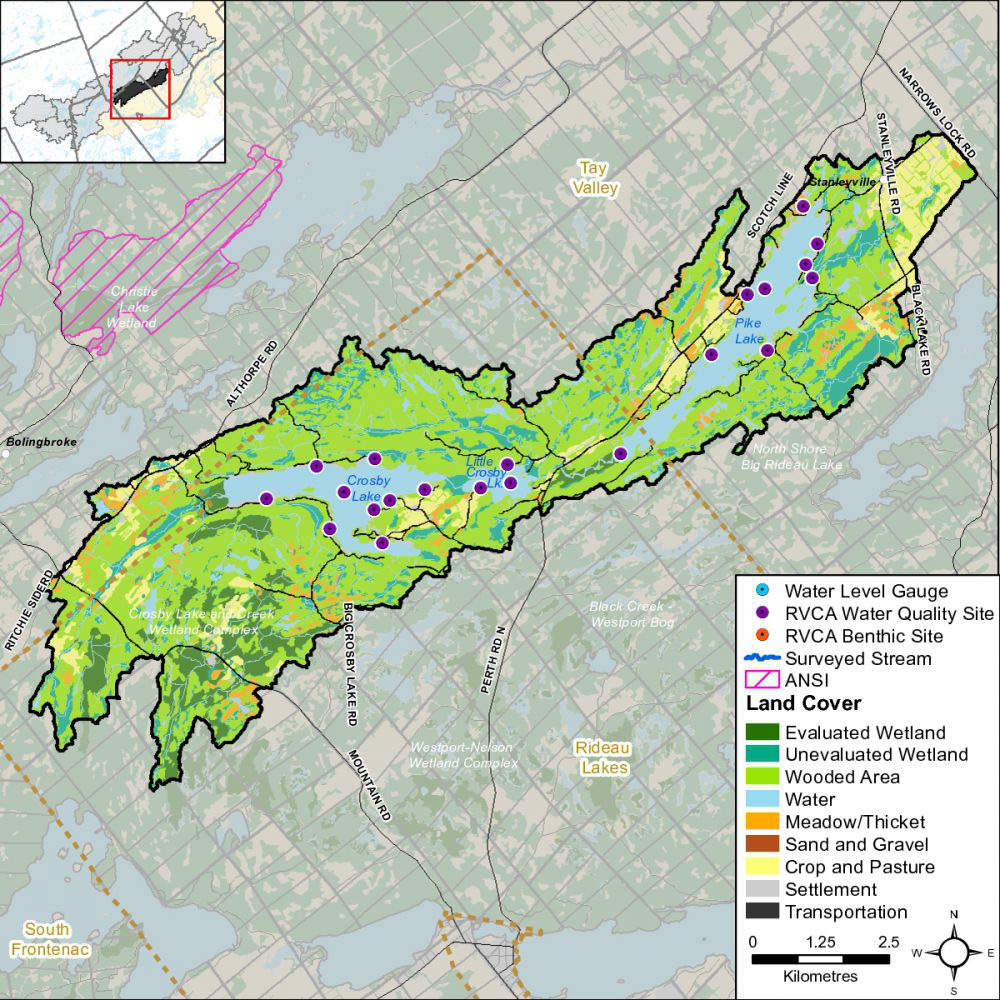 Figure 1
 Land cover in the Pike Lake catchment
The RVCA produces individual reports for 14 catchments in the Tay River subwatershed. Using data collected and analyzed by the RVCA through its watershed monitoring and land cover classification programs, surface water quality and in-stream conditions are reported for the Tay River, Tay Watershed lakes and Tay tributaries along with a summary of environmental conditions for the surrounding countryside every six years, which includes analysis of data collected through the programs along with local information provided by stakeholders up to 2017.
This information is used to better understand the effects of human activity on our water resources, allows us to better track environmental change over time and helps focus watershed management actions where they are needed the most to help sustain the ecosystem services (cultural, aesthetic and recreational values; provisioning of food, fuel and clean water; regulation of erosion/natural hazard protection and water purification; supporting nutrient/water cycling and habitat provision) provided by the catchment’s lands and forests and waters (Millennium Ecosystem Assessment 2005).
The following sections of this report are a compilation of that work for the Pike Lake catchment.
For other Tay River catchments and the Tay River Subwatershed Report, please see Rideau Valley Conservation Authority Subwatershed Reports.
1.0 Pike Lake Catchment: Facts
1.1 General/Physical Geography
Drainage Area
62 square kilometres; occupies eight percent of the Tay River subwatershed; one percent of the Rideau Valley watershed.
Geology/Physiography
The Pike Lake Catchment resides within part of the physiographic region known as the Algonquin Highlands. In the Tay River Subwatershed, this ancient and hilly geologic region is made up of such Precambrian rocks as marble, conglomerates, and dark or colour banded granite-like rocks. A veneer of glacial drift (glacial till, sand etc.) overlies the bedrock.
Municipal Coverage
Rideau Lakes Township: (37 km2; 59% of catchment)
Tay Valley Township: (25 km2; 41% of catchment)
Stream Length
All tributaries (including headwater streams): 198 km
1.2 Vulnerable Areas
Aquifer Vulnerability
Mississippi-Rideau Source Water Protection program has mapped only one very small part of this catchment as a Significant Groundwater Recharge Areas and all of the catchment as a Highly Vulnerable Aquifer (HVA). There are no Well-Head Protection Areas in the catchment.
Wetland Hydrology
A watershed model developed by the RVCA in 2009 was used to study the hydrologic function of wetlands in the Rideau Valley Watershed, including those found in the Pike Lake catchment.
1.3 Conditions at a Glance
Aggregates
One aggregate license within this catchment along with a sand and gravel area of tertiary significance.
Fish Community/Thermal Regime
Warm and cool water recreational and baitfish fishery. The fish community has not been sampled along streams and headwater drainage features in the Pike Lake catchment.
Headwater Drainage Features
Dominated by wetland and natural features with a few features that have been straightened, historically.
Land Cover Change (2008 to 2014)
| Catchment |
Woodland |
Crop-Pasture |
Meadow-Thicket |
Wetland |
Settlement |
| Hectares |
-4 |
-2 |
-1 |
+5 |
+4 |
Land Cover Type (2014)
| Catchment |
Woodland |
Wetland |
Water |
Crop-Pasture |
Meadow-Thicket |
Transportation |
Settlement |
| Percent |
52 |
20 |
11 |
8 |
4 |
3 |
2 |
Shoreline Cover Type (30 m. riparian area; 2014)
| Catchment |
% |
Crosby Lake |
% |
Little Crosby Lake |
% |
Pike Lake |
% |
Streams |
% |
| Woodland |
50 |
Woodland |
56 |
Woodland |
64 |
Woodland |
54 |
Woodland |
47 |
| Wetland |
39 |
Settlement |
41 |
Wetland |
24 |
Settlement |
29 |
Wetland |
44 |
| Settlement |
4 |
Wetland |
2 |
Settlement |
6 |
Wetland |
15 |
Crop-Pasture |
3 |
| Crop-Pasture |
3 |
Transportation |
1 |
Transportation |
3 |
Transportation |
2 |
MeadowThicket |
3 |
| MeadowThicket |
3 |
--- |
--- |
MeadowThicket |
3 |
--- |
--- |
Transportation |
2 |
| Transportation |
1 |
--- |
--- |
--- |
--- |
--- |
--- |
Settlement |
1 |
Significant Natural Features
Black Creek-Westport Bog Provincially Significant Wetland
Crosby Lake and Creek Provincially Significant Wetland (Complex)
Species at Risk (Elemental Occurrence)
| Status |
Species at Risk |
| Threatened |
Blanding's Turtle |
Bobolink |
Eastern Meadowlark |
Least Bittern |
| Special Concern |
Eastern Milksnake |
Eastern Musk Turtle |
Eastern Ribbonsnake |
Snapping Turtle |
Water Quality for the Protection of Aquatic Life (2006 to 2017)
| Crosby Lake |
Little Crosby Lake |
Pike Lake |
Kevan Drain |
| Fair |
Fair to Good |
Very Good |
Poor to Good |
Water Wells
Approximately 250 operational private water wells in the Pike Lake catchment. Groundwater uses are mainly domestic but also include livestock and public water supplies, municipal uses and heating and cooling.
Wetland Cover
Wetlands are reported to have covered 21 percent of the Port Elmsley catchment prior to European settlement, as compared to 20 percent (or 12.2 square kilometres) of the area in 2014. This represents a six percent (or 0.8 square kilometre) loss of historic wetland cover. Thirty-five percent of the remaining wetlands are regulated leaving 65 percent (or 7.9 square kilometers) unregulated.
1.4 Catchment Care
Environmental Management
The Pike Lake Community Association prepared the Draft Report on the State of Pike Lake and its Watershed (2009) to provide a summary of what is currently known about the Pike Lake catchment along with the community’s vision for the lake and a list of its main concerns and actions to address them. This has been followed-up with the release of the Pike Lake Stewardship Handbook in 2011, containing the community’s vision for the lake, along with a list of its main concerns and actions to address them.
Development in, and adjacent to, the Black Creek-Westport Bog Provincially Significant Wetland and Crosby Lake and Creek Provincially Significant Wetland Complex in the catchment is subject to Ontario Regulation 174-06 (entitled “Development, Interference with Wetlands and Alterations to Shorelines and Watercourses”) that protects the hydrologic function of the wetland and also protects landowners and their property from natural hazards (flooding, fluctuating water table, unstable soils) associated with them.
Environmental Monitoring
Chemical surface (in-stream) water quality collection by the RVCA since 2003 (see Section 2 of this report).
Nineteen drainage feature assessments were conducted by the RVCA in 2016 at road crossings in the catchment. The protocol measures zero, first and second order headwater drainage features and is a rapid assessment method characterizing the amount of water, sediment transport, and storage capacity within headwater drainage features (see Section 3.1 of this report).
Classification of Pike Lake catchment land cover types derived by the RVCA from colour aerial photography that was acquired during the spring of 2008 and 2014 (see Section 4.1 of this report).
The Mississippi Rideau Septic System Office has conducted 255 septic system re-inspections (mandatory and voluntary) on 180 properties around Pike Lake from 2004 to 2017 and 61 voluntary septic system re-inspections on 58 properties around Crosby and Little Crosby Lake from 2007 to 2017 (see Section 5.5 of this report).
Groundwater chemistry information is available from the Ontario Geological Survey for one well (#13-AG-001) located in the catchment.
Stewardship
Twenty-five stewardship projects were completed by landowners with assistance from the RVCA (see Section 5 of this report).
2.0 Pike Lake Catchment: Water Quality Conditions
Surface water quality conditions in the Pike Lake catchment are monitored by the Rideau Valley Conservation Authority’s (RVCA) Watershed Watch Program. Watershed Watch monitors watershed lakes to assess nutrient concentrations, water clarity, dissolved oxygen availability and pH. Figure 2 shows the locations of monitoring sites in the catchment.
Figure 2 Water quality monitoring sites on Crosby, Little Crosby and Pike Lakes
Water Quality Rating in the Pike Lake Catchment
The water quality ratings across this catchment range from "Fair to Very Good" (Table 1); with a rating of "Fair” in Crosby Lake, "Fair to Good" in Little Crosby Lake and "Very Good" in Pike Lake, as determined by the Canadian Council of Ministers of the Environment (CCME) Water Quality Index.
A "Fair" rating indicates that water quality is usually protected but is occasionally threatened or impaired; conditions sometimes depart from natural or desirable levels. A rating of "Good" indicates that only a minor degree of threat or impairment is observed and conditions rarely depart from natural or desirable levels. “Very Good" indicates water quality is protected with a virtual absence of threat or impairment; conditions are very close to natural or pristine levels.
Each water quality parameter is evaluated against established guidelines to determine water quality conditions. Those parameters that frequently exceed guidelines are presented below. Data has been analyzed over the 2006-2017 period for general trends and conditions. Table 1 shows the overall rating for the monitored surface water quality sites within the catchment and Table 2 outlines the Water Quality Index (WQI) scores and their corresponding ratings.
Table 1 Water Quality Index ratings for the Pike Lake Catchment
Table 2 Water Quality Index ratings and corresponding index scores (RVCA terminology, original WQI category names in brackets)
2.1 Crosby Lake Water Quality
Surface water quality conditions in Crosby Lake have been monitored by RVCA’s Watershed Watch Program since 2006. Data from the deep point site (DP1) has been used to calculate the WQI rating for Crosby Lake, which averaged “Fair” over the 2006-2017 period (Table 1). Moderate nutrient concentrations, good oxygen availability and clear water all influenced this rating. The following discussion explains how each of the monitored water quality parameters contributes to the lake’s water quality.
This report also considers data from eight additional shoreline sites that are monitored around the lake. These sites have not been included in the calculation of the CCME WQI rating, as they are not monitored with the same frequency as the deep point site. However, they do provide important information on water quality conditions in the near shore areas. For locations of shoreline sites (A-H) please see Figure 2.
2.1.1 Nutrients
Total phosphorus (TP) is used as a primary indicator of excessive nutrient loading and contributes to abundant aquatic vegetation growth and depleted dissolved oxygen levels. The Provincial Water Quality Objective (PWQO) is used as the TP Guideline and states that in lakes, concentrations greater than 0.020 mg/l indicate an excessive amount of TP within the water column. Concentrations below 0.010 mg/l are generally considered to be minimal and unlikely to have problems associated with nutrient loading.
Total Kjeldahl nitrogen (TKN) is used as a secondary indicator of nutrient loading. RVCA uses a guideline of 0.500 mg/l to assess TKN[1] within surface waters.
Nutrients at the Crosby Lake Deep Point
TP and TKN sampling results collected by the RVCA are presented in Figures 3 to 6. Some variability has occurred in the sampled TP concentrations at this site (Figure 3 and 4), and a decreasing trend[2] was observed in the 2006-2017 data set. Eighty-nine percent of samples analyzed for TP were less than the TP guideline and the average concentration was 0.012 mg/l (Table 3). TKN concentration also showed variability though no significant change was observed (Figures 5 and 6). Eighty-nine percent of reported results were below the TKN guideline and the average TKN concentration was 0.396 mg/l (Table 3).
Figure 3 Total phosphorus sampling results at the deep point site (DP1) on Crosby Lake, 2006-2017
Figure 4 Average total phosphorus results at the deep point site (DP1) on Crosby Lake, 2006-2017
Figure 5 Total Kjeldahl nitrogen sampling results at the deep point site (DP1) on Crosby Lake, 2006-2017.
Figure 6 Average total Kjeldahl nitrogen sampling results at the deep point site (DP1) on Crosby Lake, 2006-2017.
Table 3 Summary of nutrient results for Crosby Lake over the monitoring period, 2006-2017
Overall, the data presented indicates that nutrient concentration may be considered low with occasional exceedances in the mid-lake, deep water site on Crosby Lake.
Nutrients around Crosby Lake
The average nutrient concentrations at monitored shoreline sites around the lake vary from year to year (Figures 7 and 8). Please note that in the 2006-2017 monitoring period sites C, E and H were monitored yearly; while sites A, B, D, F, and G were only sampled in 2006, 2011 and 2016.
Average total phosphorous concentrations are below the TP guideline at all of sites. Average TKN concentrations were also below the guideline at all sites (Figure 8). Site G did show elevated concentrations in 2016, though results are comparable to other sites in the years when monitored.
Figure 7 Average total phosphorous concentrations at shoreline monitoring sites on Crosby Lake, 2006-2017
Figure 8 Average total phosphorous concentrations at shoreline monitoring sites on Crosby Lake, 2006-2017
Summary of Crosby Lake Nutrients
Crosby Lake nutrient concentrations are generally below the guidelines, with few exceedances. It is possible that occasional problems with nutrient enrichment (i.e. algal blooms or excessive plant growth) may be observed in shallow, sheltered bays.
Efforts such as the diversion of runoff and enhanced shoreline buffers are important to continue to protect and enhance water quality, and reduce future nutrient increases. Nutrient exceedances may be partially attributed to the natural aging of a lake and basin characteristics. All residents can help minimize their impact on the lake by reducing nutrient inputs through practices such as proper maintenance of septic systems, keeping shorelines natural and using phosphate free soaps and detergents. Promotion of sound stewardship and protection around lake is important to maintain and protect water quality conditions into the future.
2.1.2 Crosby Lake Water Clarity
Water clarity is measured using a Secchi disk during each deep point sample. Table 4 summarizes the recorded depths with an average depth of 4.3 m and shows that all readings have exceeded the minimum PWQO of 2 m indicating that algae in the water column is not at excessive levels (good water clarity). Less than 2 m will indicate overproduction in a lake or significant inputs to the water column that are limiting light availability. Figure 9 shows that no individual reading has been below the guideline and measured depths range from 2.5 m to 8.5 m. A decreasing trend was observed within the 2006-2017 data set, indicating that Secchi depths have been reduced over this period.
Table 4 Summary of Secchi depths recorded at the deep point site (DP1) on Crosby Lake, 2006-2017.
Figure 9 Recorded Secchi depths at the deep point site (DP1) on Crosby Lake, 2006-2017.
Summary of Crosby Lake Water Clarity
Waters in Crosby Lake are very clear and sufficient sunlight is able to penetrate the water column to support aquatic life and provide sufficient visibility for safe recreational use (boating, swimming).
2.1.3 Crosby Lake Fish Habitat
Two other factors, dissolved oxygen/temperature and pH were also assessed to provide an overall sense of the health of Crosby Lake from a fish habitat perspective.
2.1.3.1 Crosby Lake Dissolved Oxygen and Temperature
The red bars in Figure 10 show the depths where suitable conditions exist for warm water fish species (temperature less than 25°C and dissolved oxygen greater than 4 mg/l) at the deep point site. The vertical axis represents the total lake depth at each site where the profile is taken. Suitable conditions typically decline throughout the summer to about 12 m of the water column. Overall, no significant change was noted in conditions through the 2006-2017 period.
Figure 10 Depths suitable for warm water fish species at deep point site (DP1) on Crosby Lake, 2006-2017.
2.1.3.2 Crosby Lake pH
pH is a basic water quality parameter used to assess the acidity of water, an important factor for aquatic life. Figure 11 shows monitored pH values over the 2006-2017 period.
Figure 11 pH concentrations at the deep point site on Crosby Lake, 2006-2017
The majority of samples for both time periods were within guidelines established by the Canadian Council of Minister's of the Environment which state that pH should be between 6.5 and 9 to protect aquatic life (Table 5). Surface water’s that are found to be more alkaline (higher pH) are common in many regions of the Tay River subwatershed and can generally be attributed to the geology rather than anthropogenic activities. Biological activities such as increased photosynthesis from algal blooms and plant growth may also influence pH.
Table 5 Summary of pH results at the deep point site (DP1) on Crosby Lake, 2006-2017.
Summary of Water Quality for Fish Habitat in Crosby Lake
Overall the water chemistry data at the deep point describes suitable habitat conditions for warm water fish species such as yellow perch, walleye and pike. There is some evidence that the warming of the water column in the late summer/fall may limit the amount of habitat for some sensitive species. pH conditions are typically on the upper end of the range recommended for the protection of aquatic life. Overall, the data indicates a healthy environment for aquatic species.
2.1.4 Crosby Lake E. Coli
E. coli is sampled at monitored shoreline sites twice each sampling season. E. coli data was not used in the calculations of the WQI rating for the lake due to differences in sampling frequency and site locations. E. coli data has been summarized in Table 6. Throughout the 2006-2017 period 100 percent of samples collected by RVCA were below the E. coli guideline of 100 colony forming units (CFU) per 100 ml set by the PWQO; across the lake the count at the geometric mean was 3 CFU/100ml (Table 6). This provides support that there is little indication of bacterial contamination around the lake.
Table 6 Summary of E. coli results for Crosby Lake, 2006-2017.
Figure 12 Geometric mean of shoreline sites monitored on Crosby Lake, 2006-2017.
Figure 12 show the distribution of counts across all shoreline sites. All sites fell well below the guideline of 100 CFU/100ml.
Summary of Crosby Lake Bacterial Contamination
The results presented above indicate that bacterial contamination is not a significant concern in Crosby Lake and the water should be safe for recreational use such as swimming and boating.
2.2 Little Crosby Lake Water Quality
Surface water quality conditions in Little Crosby Lake have been monitored by RVCA’s Watershed Watch Program since 2006. Data from the deep point site (DP1) has been used to calculate the WQI rating for Little Crosby Lake, which averaged “Fair-Good” over the 2006-2017 period (Table 1). Moderate nutrient concentrations, good oxygen availability and clear water all influenced this rating. The following discussion explains how each of the monitored water quality parameters contributes to the lake’s water quality.
This report also considers data from two additional shoreline sites that are monitored around the lake. These sites have not been included in the calculation of the CCME WQI rating, as they are not monitored with the same frequency as the deep point site. However, they do provide important information on water quality conditions in the near shore areas. For locations of shoreline sites (A and B) please see Figure 2.
2.2.1 Little Crosby Lake Nutrients
Total phosphorus (TP) is used as a primary indicator of excessive nutrient loading and contributes to abundant aquatic vegetation growth and depleted dissolved oxygen levels. The Provincial Water Quality Objective (PWQO) is used as the TP Guideline and states that in lakes, concentrations greater than 0.020 mg/l indicate an excessive amount of TP within the water column. Concentrations below 0.010 mg/l are generally considered to be minimal and unlikely to have problems associated with nutrient loading.
Total Kjeldahl nitrogen (TKN) is used as a secondary indicator of nutrient loading. RVCA uses a guideline of 0.500 mg/l to assess TKN[1] within surface waters.
Nutrients at the Little Crosby Lake Deep Point
TP and TKN sampling results collected by the RVCA are presented in Figures 13 to 16. Some variability has occurred in the sampled TP concentrations at this site (Figure 13 and 14), and a decreasing trend[2] was observed in the 2006-2017 dataset. Eighty-five percent of samples analyzed for TP were less than the TP guideline and the average concentration was 0.014 mg/l (Table 7). TKN concentrations were more consistent, with no significant trend through the monitoring period (Figures 15 and 16). Eighty-nine percent of reported results were below the TKN guideline and the average TKN concentration was 0.390 mg/l (Table 7).
Figure 13 Total phosphorus sampling results at the deep point site (DP1) on Little Crosby Lake, 2006-2017
Figure 14 Average total phosphorus results at the deep point site (DP1) on Little Crosby Lake, 2006-2017
Figure 15 Total Kjeldahl nitrogen sampling results at the deep point site (DP1) on Little Crosby Lake, 2006-2017.
Figure 16 Average total Kjeldahl nitrogen sampling results at the deep point site (DP1) on Little Crosby Lake, 2006-2017.
Table 7 Summary of nutrient results for Little Crosby Lake over the monitoring period, 2006-2017
Overall, the data presented indicates that nutrient concentration may be considered low with few exceedances in the mid-lake, deep water site on Little Crosby Lake
Nutrients around Little Crosby Lake
The average nutrient concentrations at monitored shoreline sites around the lake vary from year to year (Figures 17 and 18). Please note that in the 2006-2017 monitoring period sites A and B were only sampled in 2006, 2011 and 2016.
Average total phosphorous concentrations varied across the three years of monitoring data. Site B reported very high results in 2016 as well as elevated results in 2011 (Figure 17). This site is influenced by agricultural lands which may influence concentrations; particularly during runoff events. Average TKN concentrations were generally below the guideline, with the exception of site B in 2016 (Figure 18); as noted in the discussion regarding TP results this results may be attributed to the surrounding landscape.
Figure 17 Average total phosphorous concentrations at shoreline monitoring sites on Little Crosby Lake, 2006-2017
Figure 18 Average total phosphorous concentrations at shoreline monitoring sites on Little Crosby Lake, 2006-2017
Summary of Little Crosby Lake Nutrients
Little Crosby Lake nutrient concentrations are generally below the guidelines, with few exceedances. It is possible that occasional problems with nutrient enrichment (i.e. algal blooms or excessive plant growth) may be observed in shallow, sheltered bays.
Efforts such as the diversion of runoff and enhanced shoreline buffers are important to continue to protect and enhance water quality, and reduce future nutrient increases. Nutrient exceedances may be partially attributed to the natural aging of a lake and basin characteristics. All residents can help minimize their impact on the lake by reducing nutrient inputs through practices such as proper maintenance of septic systems, keeping shorelines natural and using phosphate free soaps and detergents. Promotion of sound stewardship and protection around lake is important to maintain and protect water quality conditions into the future.
2.2.2 Little Crosby Lake Water Clarity
Water clarity is measured using a Secchi disk during each deep point sample. Table 8 summarizes the recorded depths with an average depth of 4.3 m and shows that all readings have exceeded the minimum PWQO of 2 m indicating that algae in the water column is not at excessive levels (good water clarity). Less than 2 m will indicate overproduction in a lake or significant inputs to the water column that are limiting light availability. Figure 19 shows that no individual reading has been below the guideline and measured depths range from 2 m to 7.5 m. A decreasing trend was observed within the 2006-2017 data set, indicating that Secchi depths have been reduced over this period.
Table 8 Summary of Secchi depths recorded at the deep point site (DP1) on Little Crosby Lake, 2006-2017.
Figure 19 Recorded Secchi depths at the deep point site (DP1) on Little Crosby Lake, 2006-2017.
Summary of Little Crosby Lake Water Clarity
Waters in Crosby Lake are very clear and sufficient sunlight is able to penetrate the water column to support aquatic life and provide sufficient visibility for safe recreational use (boating, swimming).
2.2.3 Little Crosby Lake Fish Habitat
Two other factors, dissolved oxygen/temperature and pH were also assessed to provide an overall sense of the health of Little Crosby Lake from a fish habitat perspective.
2.2.3.1 Dissolved Oxygen and Temperature
The red bars in Figure 20 show the depths where suitable conditions exist for warm water fish species (temperature less than 25°C and dissolved oxygen greater than 4 mg/l) at the deep point site. The vertical axis represents the total lake depth at each site where the profile is taken. Suitable conditions typically decline throughout the summer to about 7 m of the water column. Overall, no significant change was noted in conditions through the 2006-2017 period.
Figure 20 Depths suitable for warm water fish species at deep point site (DP1) on Little Crosby Lake, 2006-2017.
2.2.3.2 Little Crosby Lake pH
pH is a basic water quality parameter used to assess the acidity of water, an important factor for aquatic life. Figure 21 shows monitored pH values over the 2006-2017 period.
Figure 21 pH concentrations at the deep point site on Little Crosby Lake, 2006-2017
The majority of samples for both time periods were within guidelines established by the Canadian Council of Minister's of the Environment which state that pH should be between 6.5 and 9 to protect aquatic life (Table 9). Surface water’s that are found to be more alkaline (higher pH) are common in many regions of the Tay River subwatershed and can generally be attributed to the geology rather than anthropogenic activities. Biological activities such as increased photosynthesis from algal blooms and plant growth may also influence pH.
Table 9 Summary of pH results at the deep point site (DP1) on Little Crosby Lake, 2006-2017.
Summary of Water Quality for Fish Habitat in Little Crosby Lake
Overall the water chemistry data at the deep point describes suitable habitat conditions for warm water fish species such as yellow perch, walleye and pike. There is some evidence that the warming of the water column in the late summer/fall may limit the amount of habitat for some sensitive species in this shallow lake. pH conditions are typically within the range recommended for the protection of aquatic life. Overall, the data indicates a healthy environment for aquatic species.
2.2.4 Little Crosby Lake E. Coli
E. coli is sampled at monitored shoreline sites twice each sampling season. E. coli data was not used in the calculations of the WQI rating for the lake due to differences in sampling frequency and site locations. E. coli data has been summarized in Table 10. Throughout the 2006-2017 period 100 percent of samples collected by RVCA were below the E. coli guideline of 100 colony forming units (CFU) per 100 ml set by the PWQO; across the lake the count at the geometric mean was 4 CFU/100ml (Table 10). This provides support that there is little indication of bacterial contamination around the lake.
Table 10 Summary of E. coli results for Little Crosby Lake, 2006-2017.
Figure 22 Geometric mean of shoreline sites monitored on Little Crosby Lake, 2006-2017.
Figure 22 show the distribution of counts across all shoreline sites. All sites fell well below the guideline of 100 CFU/100ml.
Summary of Little Crosby Lake Bacterial Contamination
The results presented above indicate that bacterial contamination is not a significant concern in Little Crosby Lake and the water should be safe for recreational use such as swimming and boating.
2.3 Pike Lake Water Quality
Surface water quality conditions in Pike Lake have been monitored by RVCA’s Watershed Watch Program since 2006. Data from the deep point site (DP1) has been used to calculate the WQI rating for Pike Lake, which averaged “Very Good" over the 2006-2017 period (Table 1). Low nutrient concentrations, good oxygen availability and clear water all influenced this rating. The following discussion explains how each of the monitored water quality parameters contributes to the lake’s water quality.
This report also considers data from eight additional shoreline sites that are monitored around the lake. These sites have not been included in the calculation of the CCME WQI rating, as they are not monitored with the same frequency as the deep point site. However, they do provide important information on water quality conditions in the near shore areas. For locations of shoreline sites (A-H, K) please see Figure 1.
2.3.1 Pike Lake Nutrients
Total phosphorus (TP) is used as a primary indicator of excessive nutrient loading and contributes to abundant aquatic vegetation growth and depleted dissolved oxygen levels. The Provincial Water Quality Objective (PWQO) is used as the TP Guideline and states that in lakes, concentrations greater than 0.020 mg/l indicate an excessive amount of TP within the water column. Concentrations below 0.010 mg/l are generally considered to be minimal and unlikely to have problems associated with nutrient loading.
Total Kjeldahl nitrogen (TKN) is used as a secondary indicator of nutrient loading. RVCA uses a guideline of 0.500 mg/l to assess TKN[1] within surface waters.
Nutrients at the Pike Lake Deep Point
TP and TKN sampling results collected by the RVCA are presented in Figures 23 to 26. Some variability has occurred in the sampled TP concentrations at this site (Figure 23 and 24), with no significant trend[2] was observed in the 2006-2017 data set. Ninety-eight percent of samples analyzed for TP were less than the TP guideline and the average concentration was 0.011 mg/l (Table 11). TKN concentration also showed variability though no significant change was observed (Figures 25 and 26). Ninety-eight percent of reported results were also below the TKN guideline and the average TKN concentration was 0.371 mg/l (Table 11).
Figure 23 Total phosphorus sampling results at the deep point site (DP1) on Pike Lake, 2006-2017
Figure 24 Average total phosphorus results at the deep point site (DP1) on Pike Lake, 2006-2017
Figure 25 Total Kjeldahl nitrogen sampling results at the deep point site (DP1) on Pike Lake, 2006-2017.
Figure 26 Average total Kjeldahl nitrogen sampling results at the deep point site (DP1) on Pike Lake, 2006-2017.
Table 11 Summary of nutrient results for Pike Lake over the monitoring period, 2006-2017
Overall, the data presented indicates that nutrient concentration may be considered low with occasional exceedances in the mid-lake, deep water site on Pike Lake.
Nutrients around Pike Lake
The average nutrient concentrations at monitored shoreline sites around the lake vary from year to year (Figures 27 and 28). Please note that in the 2006-2017 monitoring period sites A, D, F and G were monitored yearly; while sites B, C, E, G, H and K were only sampled in 2006, 2011 and 2016.
Average total phosphorous concentrations are below the TP guideline at all of sites, with the exception of site D. Site D drains a significant wetland area and Stanleyville dump, this location has previously been investigated due to consistently elevated nutrient concentrations at this location. At that time nothing was found to explain the elevated results other than the influence of nutrient attenuation by the wetlands. Similar results were also observed in TKN concentrations, which were also below the guideline at all sites with the exception of site D (Figure 28).
Figure 27 Average total phosphorous concentrations at shoreline monitoring sites on Pike Lake, 2006-2017
Figure 28 Average total phosphorous concentrations at shoreline monitoring sites on Pike Lake, 2006-2017
Summary of Pike Lake Nutrients
Pike Lake nutrient concentrations are generally below the guidelines, with few exceedances. It is possible that occasional problems with nutrient enrichment (i.e. algal blooms or excessive plant growth) may be observed in shallow, sheltered bays such as site D.
Efforts such as the diversion of runoff and enhanced shoreline buffers are important to continue to protect and enhance water quality, and reduce future nutrient increases. Nutrient exceedances may be partially attributed to the natural aging of a lake and basin characteristics. All residents can help minimize their impact on the lake by reducing nutrient inputs through practices such as proper maintenance of septic systems, keeping shorelines natural and using phosphate free soaps and detergents. Promotion of sound stewardship and protection around lake is important to maintain and protect water quality conditions into the future.
2.3.2 Pike Lake Water Clarity
Water clarity is measured using a Secchi disk during each deep point sample. Table 12 summarizes the recorded depths with an average depth of 4.5 m and shows that all readings have exceeded the minimum PWQO of 2 m indicating that algae in the water column is not at excessive levels (good water clarity). Less than 2 m will indicate overproduction in a lake or significant inputs to the water column that are limiting light availability. Figure 9 shows that no individual reading has been below the guideline and measured depths range from 2.0 m to 7.0 m. A decreasing trend was observed within the 2006-2017 data set, indicating that Secchi depths have been reduced over this period.
Table 12 Summary of Secchi depths recorded at the deep point site (DP1) on Pike Lake, 2006-2017.
Figure 29 Recorded Secchi depths at the deep point site (DP1) on Pike Lake, 2006-2017.
Summary of Pike Lake Water Clarity
Waters in Pike Lake are very clear and sufficient sunlight is able to penetrate the water column to support aquatic life and provide sufficient visibility for safe recreational use (boating, swimming).
2.3.3 Pike Lake Fish Habitat
Two other factors, dissolved oxygen/temperature and pH were also assessed to provide an overall sense of the health of Pike Lake from a fish habitat perspective.
2.3.3.1 Pike Lake Dissolved Oxygen and Temperature
The red bars in Figure 30 show the depths where suitable conditions exist for warm water fish species (temperature less than 25°C and dissolved oxygen greater than 4 mg/l) at the deep point site. The vertical axis represents the total lake depth at each site where the profile is taken. Suitable conditions typically decline throughout the summer to about 20 m of the water column. Overall, no significant change was noted in conditions through the 2006-2017 period.
Figure 30 Depths suitable for warm water fish species at deep point site (DP1) on Pike Lake, 2006-2017.
2.3.3.2 Pike Lake pH
pH is a basic water quality parameter used to assess the acidity of water, an important factor for aquatic life. Figure 31 shows monitored pH values over the 2006-2017 period.
Figure 31 pH concentrations at the deep point site on Pike Lake, 2006-2017
The majority of samples for both time periods were within guidelines established by the Canadian Council of Minister's of the Environment which state that pH should be between 6.5 and 9 to protect aquatic life (Table 5). Surface water’s that are found to be more alkaline (higher pH) are common in many regions of the Tay River subwatershed and can generally be attributed to the geology rather than anthropogenic activities. Biological activities such as increased photosynthesis from algal blooms and plant growth may also influence pH.
Table 13 Summary of pH results at the deep point site (DP1) on Pike Lake, 2006-2017.
Summary of Water Quality for Fish Habitat in Pike Lake
Overall the water chemistry data at the deep point describes suitable habitat conditions for warm water fish species such as yellow perch, walleye and pike. There is some evidence that the warming of the water column in the late summer/fall may limit the amount of habitat for some sensitive species. pH conditions are within the range recommended for the protection of aquatic life. Overall, the data indicates a healthy environment for aquatic species.
2.3.4 Pike Lake E. Coli
E. coli is sampled at monitored shoreline sites twice each sampling season. E. coli data was not used in the calculations of the WQI rating for the lake due to differences in sampling frequency and site locations. E. coli data has been summarized in Table 14. Throughout the 2006-2017 period 100 percent of samples collected by RVCA were below the E. coli guideline of 100 colony forming units (CFU) per 100 ml set by the PWQO; across the lake the count at the geometric mean was 4 CFU/100ml (Table 14). This provides support that there is little indication of bacterial contamination around the lake.
Table 14 Summary of E. coli results for Pike Lake, 2006-2017.
Figure 32 Geometric mean of shoreline sites monitored on Pike Lake, 2006-2017.
Figure 32 shows the distribution of E. coli counts across all shoreline sites. All sites fell well below the guideline of 100 CFU/100ml.
Summary of Pike Lake Bacterial Contamination
The results presented above indicate that bacterial contamination is not a significant concern in Pike Lake and the water should be safe for recreational use such as swimming and boating.
[1] No Ontario guideline for TKN is presently available; however, waters not influenced by excessive organic inputs typically range from 0.100 to 0.500 mg/l, Environment Canada (1979) Water Quality Sourcebook, A Guide to Water Quality Parameters, Inland Waters Directorate, Water Quality Branch, Ottawa, Canada
[2] Trends in the data were assessed using the Mann-Kendall trend test and Sens slope statistic.
[3] A type of mean or average, which indicates the central tendency or typical value of a set of numbers by using the product of their values (as opposed to the arithmetic mean which uses their sum). It is often used to summarize a variable that varies over several orders of magnitude, such as E. coli counts.
3.0 Pike Lake Catchment: Riparian Conditions
3.1 Pike Lake Headwater Drainage Features Assessment
3.1.1 Headwater Sampling Locations
The RVCA Stream Characterization program assessed Headwater Drainage Features for the Pike Lake catchment in 2017. This protocol measures zero, first and second order headwater drainage features (HDF). It is a rapid assessment method characterizing the amount of water, sediment transport, and storage capacity within headwater drainage features (HDF). RVCA is working with other Conservation Authorities and the Ministry of Natural Resources and Forestry to implement the protocol with the goal of providing standard datasets to support science development and monitoring of headwater drainage features. An HDF is a depression in the land that conveys surface flow. Additionally, this module provides a means of characterizing the connectivity, form and unique features associated with each HDF (OSAP Protocol, 2013). In 2017 the program sampled 19 sites at road crossings in the Pike Lake catchment area (Figure 33).
Figure 33 Location of the headwater sampling sites in the Pike Lake catchment
3.1.2 Headwater Feature Type
The headwater sampling protocol assesses the feature type in order to understand the function of each feature. The evaluation includes the following classifications: defined natural channel, channelized or constrained, multi-thread, no defined feature, tiled, wetland, swale, roadside ditch and pond outlet. By assessing the values associated with the headwater drainage features in the catchment area we can understand the ecosystem services that they provide to the watershed in the form of hydrology, sediment transport, and aquatic and terrestrial functions. The headwater drainage features in the Pike Lake catchment are predominantly natural and wetland features. Figure 34 shows the feature type of the primary feature at the sampling locations.
Figure 34 Headwater feature types in the Pike Lake catchment
3.1.3 Headwater Feature Flow
The observed flow condition within headwater drainage features can be highly variable depending on timing relative to the spring freshet, recent rainfall, soil moisture, etc. Flow conditions are assessed in the spring and in the summer to determine if features are perennial and flow year round, if they are intermittent and dry up during the summer months or if they are ephemeral systems that do not flow regularly and generally respond to specific rainstorm events or snowmelt. Flow conditions in headwater systems can change from year to year depending on local precipitation patterns. Figure 35 shows the observed flow condition at the sampling locations in the Pike Lake catchment in 2017.
Figure 35 Headwater feature flow conditions in the Pike Lake catchment
A spring photo of the headwater sample site in the Pike Lake catchment located on Stanleyville Road
A summer photo of the headwater sample site in the Pike Lake catchment located on Stanleyville Road
3.1.4 Headwater Feature Channel Modifications
Channel modifications were assessed at each headwater drainage feature sampling location. Modifications include channelization, dredging, hardening and realignments. The Pike Lake catchment area had a majority of features with no channel modifications observed, two locations had mixed modifications and one had been historically channelized. Figure 36 shows the channel modifications observed at the sampling locations for the Pike Lake catchment.
Figure 36 Headwater feature channel modifications in the Pike Lake catchment
3.1.5 Headwater Feature Vegetation
Headwater feature vegetation evaluates the type of vegetation that is found within the drainage feature. The type of vegetated within the channel influences the aquatic and terrestrial ecosystem values that the feature provides. For some types of headwater features the vegetation within the feature plays a very important role in flow and sediment movement and provides fish/wildlife habitat. The following classifications are evaluated no vegetation, lawn, wetland, meadow, scrubland and forest. Figure 37 depicts the dominant vegetation observed at the sampled headwater sites in the Pike Lake catchment.
Figure 37 Headwater feature vegetation types in the Pike Lake catchment
3.1.6 Headwater Feature Riparian Vegetation
Headwater riparian vegetation evaluates the type of vegetation that is found along the adjacent lands of a headwater drainage feature. The type of vegetation within the riparian corridor influences the aquatic and terrestrial ecosystem values that the feature provides to the watershed. Figure 38 depicts the type of riparian vegetation observed at the sampled headwater sites in the Pike Lake catchment. The majority of the headwater drainage features are classified as having natural riparian vegetation with only four features having altered vegetation typically in the form of ornamental grass or agricultural crops in the riparian zone.
Figure 38 Headwater feature riparian vegetation types in the Pike Lake catchment
3.1.7 Headwater Feature Sediment Deposition
Assessing the amount of recent sediment deposited in a channel provides an index of the degree to which the feature could be transporting sediment to downstream reaches (OSAP, 2013). Evidence of excessive sediment deposition might indicate the requirement to follow up with more detailed targeted assessments upstream of the site location to identify potential best management practices to be implemented. Sediment deposition ranged from none to substantial for the headwater sites sampled in the Pike Lake catchment area. Figure 39 depicts the degree of sediment deposition observed at the sampled headwater sites in the Pike Lake catchment. Sediment deposition conditions ranged from no sediment deposition to substantial levels of deposition.
Figure 39 Headwater feature sediment deposition in the Pike Lake catchment
3.1.8 Headwater Feature Upstream Roughness
Feature roughness will provide a measure of the amount of materials within the bankfull channel that could slow down the velocity of water flowing within the headwater feature (OSAP, 2013). Materials on the channel bottom that provide roughness include vegetation, wood structure and boulders/cobble substrates. Roughness can provide benefits in mitigating downstream erosion on the headwater drainage feature and the receiving watercourse by reducing velocities. Roughness also provides important habitat conditions for aquatic organisms. Figure 40 shows that the feature roughness conditions at the sampling locations in the Pike Lake catchment were variable ranging from moderate to extreme roughness conditions.
Figure 40 Headwater feature roughness in the Pike Lake catchment
4.0 Pike Lake Catchment: Land Cover
Land cover and any change in coverage that has occurred over a six year period is summarized for the Pike Lake catchment using spatially continuous vector data representing the catchment during the spring of 2008 and 2014. This dataset was developed by the RVCA through heads-up digitization of 20cm DRAPE ortho-imagery at a 1:4000 scale and details the surrounding landscape using 10 land cover classes.
4.1 Pike Lake Catchment Change
As shown in Table 15 and Figure 1, the dominant land cover type across the Pike Lake catchment drainage basin in 2014 is woodland.
Table 15 Land cover in the Pike Lake catchment (2008 vs. 2014)
* Does not include treed swamps ** Includes treed swamps
From 2008 to 2014, there was an overall change of eight hectares (from one land cover class to another). Most of the change in the Pike Lake catchment is a result of the conversion of crop and pastureland to settlement and woodland reverting to wetland (Figure 41).
Figure 41 Land cover change in the Pike Lake catchment (2014)
Table 16 provides a detailed breakdown of all land cover change that has taken place in the Pike Lake catchment between 2008 and 2014.
Table 16 Land cover change in the Pike Lake catchment (2008 to 2014)
4.2 Woodland Cover
In the Environment Canada Guideline (Third Edition) entitled “How Much Habitat Is Enough?” (hereafter referred to as the “Guideline”) the opening narrative under the Forest Habitat Guidelines section states that prior to European settlement, forest was the predominant habitat in the Mixedwood Plains ecozone. The remnants of this once vast forest now exist in a fragmented state in many areas (including the Rideau Valley watershed) with woodland patches of various sizes distributed across the settled landscape along with higher levels of forest cover associated with features such as the Frontenac Axis (within the on-Shield areas of the Rideau Lakes and Tay River subwatersheds). The forest legacy, in terms of the many types of wildlife species found, overall species richness, ecological functions provided and ecosystem complexity is still evident in the patches and regional forest matrices (found in the Tay River subwatershed and elsewhere in the Rideau Valley watershed). These ecological features are in addition to other influences which forests have on water quality and stream hydrology including reducing soil erosion, producing oxygen, storing carbon along with many other ecological services that are essential not only for wildlife but for human well-being.
The Guideline also notes that forests provide a great many habitat niches that are in turn occupied by a great diversity of plant and animal species. They provide food, water and shelter for these species - whether they are breeding and resident locally or using forest cover to help them move across the landscape. This diversity of species includes many that are considered to be species at risk. Furthermore, from a wildlife perspective, there is increasing evidence that the total forest cover in a given area is a major predictor of the persistence and size of bird populations, and it is possible or perhaps likely that this pattern extends to other flora and fauna groups. The overall effect of a decrease in forest cover on birds in fragmented landscapes is that certain species disappear and many of the remaining ones become rare, or fail to reproduce, while species adapted to more open and successional habitats, as well as those that are more tolerant to human-induced disturbances in general, are able to persist and in some cases thrive. Species with specialized-habitat requirements are most likely to be adversely affected. The overall pattern of distribution of forest cover, the shape, area and juxtaposition of remaining forest patches and the quality of forest cover also play major roles in determining how valuable forests will be to wildlife and people alike.
The current science generally supports minimum forest habitat requirements between 30 and 50 percent, with some limited evidence that the upper limit may be even higher, depending on the organism/species phenomenon under investigation or land-use/resource management planning regime being considered/used.
As shown in Figure 42, 52 percent of the Pike Lake catchment contains 3247 hectares of upland forest and 35 hectares of lowland forest (treed swamps) versus the 47 percent of woodland cover in the Tay River subwatershed. This is greater than the 30 percent of forest cover that is identified as the minimum threshold required to sustain forest birds according to the Guideline and which may only support less than one half of potential species richness and marginally healthy aquatic systems. When forest cover drops below 30 percent, forest birds tend to disappear as breeders across the landscape.
Figure 42 Woodland cover and forest interior in the Pike Lake catchment (2014)
4.2.1 Woodland (Patch) Size
According to the Ministry of Natural Resources’ Natural Heritage Reference Manual (Second Edition), larger woodlands are more likely to contain a greater diversity of plant and animal species and communities than smaller woodlands and have a greater relative importance for mobile animal species such as forest birds.
Bigger forests often provide a different type of habitat. Many forest birds breed far more successfully in larger forests than they do in smaller woodlots and some rely heavily on forest interior conditions. Populations are often healthier in regions with more forest cover and where forest fragments are grouped closely together or connected by corridors of natural habitat. Small forests support small numbers of wildlife. Some species are “area-sensitive” and tend not to inhabit small woodlands, regardless of forest interior conditions. Fragmented habitat also isolates local populations, especially small mammals, amphibians and reptiles with limited mobility. This reduces the healthy mixing of genetic traits that helps populations survive over the long run (Conserving the Forest Interior. Ontario Extension Notes, 2000).
The Environment Canada Guideline also notes that for forest plants that do not disperse broadly or quickly, preservation of some relatively undisturbed large forest patches is needed to sustain them because of their restricted dispersal abilities and specialized habitat requirements and to ensure continued seed or propagation sources for restored or regenerating areas nearby.
The Natural Heritage Reference Manual continues by stating that a larger size also allows woodlands to support more resilient nutrient cycles and food webs and to be big enough to permit different and important successional stages to co-exist. Small, isolated woodlands are more susceptible to the effects of blowdown, drought, disease, insect infestations, and invasions by predators and non-indigenous plants. It is also known that the viability of woodland wildlife depends not only on the characteristics of the woodland in which they reside, but also on the characteristics of the surrounding landscape where the woodland is situated. Additionally, the percentage of forest cover in the surrounding landscape, the presence of ecological barriers such as roads, the ability of various species to cross the matrix surrounding the woodland and the proximity of adjacent habitats interact with woodland size in influencing the species assemblage within a woodland.
In the Pike Lake catchment (in 2014), one hundred and ninety (59 percent) of the 323 woodland patches are very small, being less than one hectare in size. Another 108 (33 percent) of the woodland patches ranging from one to less than 20 hectares in size tend to be dominated by edge-tolerant bird species. The remaining 25 (eight percent of) woodland patches range between 20 and 513 hectares in size. Eighteen of these patches contain woodland between 20 and 100 hectares and may support a few area-sensitive species and some edge intolerant species, but will be dominated by edge tolerant species.
Conversely, seven (two percent) of the 323 woodland patches in the drainage area exceed the 100 plus hectare size needed to support most forest dependent, area sensitive birds and are large enough to support approximately 60 percent of edge-intolerant species. Three patches top 200 hectares, which according to the Environment Canada Guideline will support 80 percent of edge-intolerant forest bird species (including most area sensitive species) that prefer interior forest habitat conditions.
Table 17 presents a comparison of woodland patch size in 2008 and 2014 along with any changes that have occurred over that time. A decrease (of five hectares) has been observed in the overall woodland patch area between the two reporting periods.
Table 17 Woodland patches in the Pike Lake catchment (2008 and 2014)
*Includes treed swamps
4.2.2 Woodland (Forest) Interior Habitat
The forest interior is habitat deep within woodlands. It is a sheltered, secluded environment away from the influence of forest edges and open habitats. Some people call it the “core” or the “heart” of a woodland. The presence of forest interior is a good sign of woodland health, and is directly related to the woodland’s size and shape. Large woodlands with round or square outlines have the greatest amount of forest interior. Small, narrow woodlands may have no forest interior conditions at all. Forest interior habitat is a remnant natural environment, reminiscent of the extensive, continuous forests of the past. This increasingly rare forest habitat is now a refuge for certain forest-dependent wildlife; they simply must have it to survive and thrive in a fragmented forest landscape (Conserving the Forest Interior. Ontario Extension Notes, 2000).
The Natural Heritage Reference Manual states that woodland interior habitat is usually defined as habitat more than 100 metres from the edge of the woodland and provides for relative seclusion from outside influences along with a moister, more sheltered and productive forest habitat for certain area sensitive species. Woodlands with interior habitat have centres that are more clearly buffered against the edge effects of agricultural activities or more harmful urban activities than those without.
In the Pike Lake catchment (in 2014), the 323 woodland patches contain 28 forest interior patches (Figure 42) that occupy four percent (271 ha.) of the catchment land area (which is less than the five percent of interior forest in the Tay River Subwatershed). This is below the ten percent figure referred to in the Environment Canada Guideline that is considered to be the minimum threshold for supporting edge intolerant bird species and other forest dwelling species in the landscape.
Most patches (22) have less than 10 hectares of interior forest, 12 of which have small areas of interior forest habitat less than one hectare in size. The remaining six patches contain interior forest between 11 and 84 hectares in area. A decrease (of two hectares) has been observed in the overall area of woodland interior between 2008 and 2014, as shown in Table 18.
Table 18 Woodland interior in the Pike Lake catchment (2008 and 2014)
4.3 Wetland Cover
Wetlands are habitats forming the interface between aquatic and terrestrial systems. They are among the most productive and biologically diverse habitats on the planet. By the 1980s, according to the Natural Heritage Reference Manual, 68 percent of the original wetlands south of the Precambrian Shield in Ontario had been lost through encroachment, land clearance, drainage and filling.
Wetlands perform a number of important ecological and hydrological functions and provide an array of social and economic benefits that society values. Maintaining wetland cover in a watershed provides many ecological, economic, hydrological and social benefits that are listed in the Reference Manual and which may include:
- contributing to the stabilization of shorelines and to the reduction of erosion damage through the mitigation of water flow and soil binding by plant roots
- mitigating surface water flow by storing water during periods of peak flow (such as spring snowmelt and heavy rainfall events) and releasing water during periods of low flow (this mitigation of water flow also contributes to a reduction of flood damage)
- contributing to an improved water quality through the trapping of sediments, the removal and/or retention of excess nutrients, the immobilization and/or degradation of contaminants and the removal of bacteria
- providing renewable harvesting of timber, fuel wood, fish, wildlife and wild rice
- contributing to a stable, long-term water supply in areas of groundwater recharge and discharge
- providing a high diversity of habitats that support a wide variety of plants and animals
- acting as “carbon sinks” making a significant contribution to carbon storage
- providing opportunities for recreation, education, research and tourism
Historically, the overall wetland coverage within the Great Lakes basin exceeded 10 percent, but there was significant variability among watersheds and jurisdictions, as stated in the Environment Canada Guideline. In the Rideau Valley Watershed, it has been estimated that pre-settlement wetland cover averaged 35 percent using information provided by Ducks Unlimited Canada (2010) versus the 21 percent of wetland cover existing in 2014 derived from DRAPE imagery analysis.
Figure 43 Wetland cover in the Pike Lake catchment (Historic to 2014)
This decline in wetland cover is also evident in the Pike Lake catchment (as seen in Figure 43 and summarized in Table 19), where wetland was reported to cover 21 percent of the area prior to settlement, as compared to 20 percent in 2014. This represents a six percent loss of historic wetland cover. To maintain critical hydrological, ecological functions along with related recreational and economic benefits provided by these wetland habitats in the catchment, a “no net loss” of currently existing wetlands should be employed to ensure the continued provision of tangible benefits accruing from them to landowners and surrounding communities.
Table 19 Wetland cover in the Pike Lake catchment (Historic to 2014)
4.4 Shoreline Cover
The riparian or shoreline zone is that special area where the land meets the water. Well-vegetated shorelines are critically important in protecting water quality and creating healthy aquatic habitats, lakes and rivers. Natural shorelines intercept sediments and contaminants that could impact water quality conditions and harm fish habitat in streams. Well established buffers protect the banks against erosion, improve habitat for fish by shading and cooling the water and provide protection for birds and other wildlife that feed and rear young near water. A recommended target (from the Environment Canada Guideline) is to maintain a minimum 30 metre wide vegetated buffer along at least 75 percent of the length of both sides of rivers, creeks and streams.
Figure 44 shows the extent of the ‘Natural’ vegetated riparian zone (predominantly wetland/woodland features) and ‘Other’ anthropogenic cover (crop/pastureland, roads/railways, settlements) along a 30-metre-wide area of land around Crosby, Little Crosby and Pike Lake and along both sides of the shoreline of the many unnamed watercourses (including headwater streams) found in the Pike Lake catchment.
Figure 44 Natural and other riparian land cover in the Pike Lake catchment
This analysis shows that the Pike Lake catchment riparian buffer is composed of woodland (50 percent),wetland (39 percent), settlement areas (four percent), crop and pastureland (three percent), meadow-thicket (three percent) and roads (one percent). Along the many watercourses (including headwater streams) flowing into Crosby, Little Crosby and Pike Lakes, the riparian buffer is composed of woodland (47 percent), wetland (44 percent), crop and pastureland (three percent), meadow-thicket (three percent), roads (two percent), and settlement areas (one percent).
Around Pike Lake itself, the shoreline buffer is dominated by woodland (54 percent) and cottages, houses and camps (29 percent) with the remainder comprised of wetland (15 percent) and roads (two percent). Similarly, the shoreline buffer around Crosby Lake is dominated by woodland (56 percent) and cottages, houses and camps (41percent) with the remainder comprised of wetland (two percent) and roads (one percent). Around Little Crosby Lake, the shoreline buffer is dominated by woodland (64 percent) and wetland (24 percent) with only six percent occupied by cottages and houses and the remainder comprised of roads (three percent) and meadow-thicket (three percent) .
Additional statistics for the Pike Lake catchment and Crosby, Little Crosby and Pike Lake itself are presented in Tables 20 to 24 and show that there has been very little change in shoreline cover from 2008 to 2014.
Table 20 Riparian land cover in the Pike Lake catchment (2008 vs. 2014)
Table 21 Riparian land cover around Pike Lake (2008 vs. 2014)
Table 22 Riparian land cover around Crosby Lake (2008 vs. 2014)
Table 23 Riparian land cover around Little Crosby Lake (2008 vs. 2014)
Table 24 Riparian land cover along streams in the Pike Lake Catchment (2008 vs. 2014)
5.0 Pike Lake Catchment: Stewardship and Water Resources Protection
The RVCA and its partners are working to protect and enhance environmental conditions in the Tay River Watershed. Figure 45 shows the location of all stewardship projects completed in the Pike Lake catchment.
Figure 45 Stewardship site locations in the Pike Lake catchment
5.1 Rural Clean Water
The Rural Clean Water Program provides technical and financial assistance to farmers and other rural landowners, to aid in the implementation of projects that protect water quality. Funding is granted to those projects that support best management practices for application in the protection and improvement of surface and ground water resources. The program also supports climate change adaptation and low impact development projects as well as educating rural landowners about environmental stewardship of private property. Examples of supported projects include livestock exclusion fencing, controlled tile drainage, cover crops, erosion control, well related projects, and many more. For a list of eligible projects and to apply for funding, see Rural Clean Water.
In the Pike Lake catchment from 2011 to 2016, two septic system repairs, two erosion control projects, two windbreaks/buffers, one well upgrade and one fuel storage and handling facility were completed; prior to this, seven septic system repairs and two well upgrades had been completed. When combined, these projects are keeping 4.81 kilograms of Phosphorus out of our lakes, rivers and streams every year. Total value of all 17 projects is $128,554 with $18,779 of that amount funded through grant dollars from the RVCA.
5.2 Private Land Forestry
Forest cover and tree planting continues to be one of the most widely supported strategies to improve our environment. The many benefits of forest cover include carbon sequestration, flood mitigation and water quality improvement as well as providing wildlife habitat.
Through the RVCA's Trees for Tomorrow Program (and its predecessors), 11,000 trees were planted at two sites from 2011 to 2016; prior to this, 10,930 trees were planted at three sites. In total, 21,930 trees have been planted resulting in the reforestation of 12 hectares. Total project value of all five projects in the Pike Lake catchment is $49,735 with $44,549 of that amount coming from fundraising sources. For more information about the Program and landowner eligibility, please see the following: Tree Planting in the Rideau Valley Watershed and Trees for Tomorrow.
An additional 110 butternut trees were planted through the RVCA Butternut Recovery Program as part of efforts to introduce healthy seedlings from tolerant butternuts into various locations across Eastern Ontario.
5.3 Shoreline Naturalization
Natural shoreline buffers rich in native plants are critically important to protecting the health of our lakes, rivers and streams. Shoreline vegetation protects water quality and aquatic habitat by intercepting potentially harmful contaminants such as nutrients, pollutants and sediment, regulating water temperatures, slowing runoff and providing important fish and wildlife habitat. Natural shorelines also help improve climate change resiliency by increasing flood storage and providing protection from erosion during extreme weather events.
Though the RVCA’s Shoreline Naturalization Program, landowners (private and public property owners) have naturalized more than 2.3 kilometres of shoreline in the Tay Watershed by planting over 10,563 native trees and shrubs at 96 sites since 2008.
In the Pike Lake catchment, 814 native trees and shrubs have been planted along 180 metres of shoreline for a total project value of $9,507.
5.4 Septic System Re-inspection
Septic system re-inspection is provided by the RVCA through the Mississippi Rideau Septic System Office at the request of Rideau Lakes and Tay Valley Townships. From 2004 to 2017, the service has performed 316 mandatory and voluntary septic system re-inspections on 237 properties in the Pike Lake catchment, of which, 61 voluntary re-inspections were conducted on 58 properties around Crosby and Little Crosby Lake along with 255 mandatory re-inspections at 180 properties around Pike Lake.
Remedial/maintenance work (i.e. pump outs and baffle replacements that generally do not require a permit) was advocated for 34 of the Crosby and Little Crosby Lake re-inspections with more information being requested during four other inspections; no septic system replacements were identified as being needed at the Crosby and Little Crosby Lake inspections. On Pike Lake, remedial/maintenance work was recommended during 64 inspections, septic system replacements required at eight inspections along with more information being requested during another seven inspections.
5.5 Fish Habitat Improvement
Three fish habitat projects have been completed in Pike Lake with funding provided by the Ministry of Natural Resources Community Fisheries and Wildlife Involvement Program. The Pike Lake Community Association applied for and received $4000.00 for these improvements in 2012.
5.6 Valley, Stream, Wetland and Hazard Lands
The Pike Lake catchment covers 62 square kilometres with 11.6 square kilometres (or 19 percent) of the drainage area being within the regulation limit of Ontario Regulation 174/06 (Figure 46), giving protection to wetland areas and river or stream valleys that are affected by flooding and erosion hazards.
Wetlands occupy 12 square kilometres (or 23 percent) of the catchment. Of these wetlands, four square kilometres (or 33 percent) are designated as provincially significant and included within the RVCA regulation limit. This leaves the remaining 8 sq. km (or 67 percent) of wetlands in the catchment outside the regulated area limit.
Of the 197.7 kilometres of stream in the catchment, regulation limit mapping has been plotted along 39.7 kilometers of streams (representing 20 percent of all streams in the catchment). Some of these regulated streams (27.9 km) flow through regulated wetlands; the remaining 11.9 kilometres of regulated streams are located outside of those wetlands. Plotting of the regulation limit on the remaining 157.9 kilometres (or 80 percent) of streams requires identification of flood and erosion hazards and valley systems.
Within those areas of the Pike Lake catchment subject to the regulation (limit), efforts (have been made and) continue through RVCA planning and regulations input and review to manage the impact of development (and other land management practices) in areas where “natural hazards” are associated with rivers, streams, valley lands and wetlands. For areas beyond the regulation limit, protection of the catchment’s watercourses is only provided through the “alteration to waterways” provision of the regulation.
Figure 46 Regulated natural features and hazards in the Pike Lake catchment
5.7 Vulnerable Drinking Water Areas
Mississippi-Rideau Source Water Protection Program has mapped only one very small part of the Pike Lake catchment as a Significant Groundwater Recharge Areas and all of the catchment as a Highly Vulnerable Aquifer. This means that the nature of the overburden (thin soils, fractured bedrock) does not provide a high level of protection for the underlying groundwater making the aquifer more vulnerable to contaminants released on the surface. There are no Well-Head Protection Areas in the catchment.
The Mississippi-Rideau Source Protection Plan includes policies that focus on the protection of groundwater region-wide due to the fact that most of the region, which encompasses the Mississippi and Rideau watersheds, is considered Highly Vulnerable Aquifer. For detailed maps and policies that have been developed to protect drinking water sources, visit the Mississippi-Rideau Source Protection Region website.
6.0 Pike Lake Catchment: Accomplishments
Developed by the Pike Lake Community Association and volunteers, the Report on the State of Pike Lake and its Watershed (2009) and the Keeping Pike Lake Healthy Stewardship Handbook (2011) provide information on many aspects of the lake environment, as well as issues of concern and actions to be taken to maintain and improve the long-term health of the lake. The following list includes some of the accomplishments of the Pike Lake Community Association and residents that have implications for the well-being of the land and water resources of the lake ecosystem. Specific achievements of the Pike Lake community are indicated by an asterisk.
Pike Lake and Catchment Health
Invasive Species
Pike Lake Community Association applied for and received funding from the Ministry of Natural Resources (MNR) and installed signage at the public boat launch to raise awareness about practices to reduce the spread of invasive species.*
Septic Inspections
Pike Lake Community Association promotes the importance of proper septic system maintenance in news articles and stewardship reports in the Pike Lake Post and at the Pike Lake AGM.*
Pike Lake Community Association sponsored and promoted a free workshop, “Be Septic Savvy” (2012) in partnership with Tay Valley Township, the Mississippi Valley Conservation Authority, the Lake Networking Group and the Otty Lake Association.*
316 mandatory and voluntary septic system re-inspections have been conducted by the Mississippi-Rideau Septic System Office on 237 properties in the Pike Lake catchment as a service provided to Rideau Lakes and Tay Valley Townships, since 2004.
Shoreline Naturalization
Importance of keeping shorelines natural is intertwined with news articles and stewardship reports in the Pike Lake Post and at the Pike Lake AGM. Examples include information articles on “Naturalized Shoreline” and grant opportunities featured in the 2011, 2012 and 2013 Pike Lake Post.*
814 native trees and shrubs have been planted at 13 project sites by the RVCA Shoreline Naturalization Program at an average buffer width of three metres along 180 metres of shoreline.
Tree Planting
21930 trees have been planted at five sites in the Pike Lake catchment by the RVCA Private Land Forestry Program, resulting in the reforestation of 12 hectares.
Water Quality
Pike Lake Community Association (PLCA) has participated annually in the RVCA Watershed Watch Program since it began in 2001.*
Pike Lake Steward has provided annual reports of water quality at the PLCA Annual General Meeting and prepared a summary report of water quality results from 2001-2010 in the 2011 Pike Lake Post newsletter, along with a feature article on water quality testing in the 2015 newsletter.*
Pike Lake water quality monitoring data from 2001-2015 is posted on pikelake.ca.*
Pike Lake Community Association promoted the use of phosphate-free soaps and cleaners in the Lake Steward’s report at the 2013 Pike Lake AGM.*
Crosby Lake, Elbow Lake and little Crosby Lake are each sampled yearly by the RVCA for five parameters, four times a year.
Seven Rural Clean Water Program projects were completed by the RVCA Rural Clean Water Program.
Pike Lake and Catchment Habitat
Fish Habitat
Pike Lake Community Association applied for and received $4000.00 through the Ministry of Natural Resources Community Fisheries and Wildlife Involvement Program to create three walleye spawning beds (2012).*
In-Water Habitat
Pike Lake Community Association article on research into algae and aquatic plant growth featured in the 2015 Pike Lake Post. PLCA invited the RVCA to speak about Algae Watch (Aquatic Vegetation Research Project) and learn about potentially harmful algae blooms (2013). An interactive display board on algae was featured at the 2016 Pike Lake Boatilla.*
Nineteen headwaters sites are sampled once every six years by the RVCA Stream Characterisation Program.
Island Habitat
Pike Lake Community Association worked with the Ministry of Natural Resources to identify suitable campsites on Pike Lake crown land islands. PLCA applied for and received funding from MNR and installed signage at boat launch promoting responsible camping. Installed tent symbol sign on Big Island where camping is permitted and no camping signs for islands MNR advises are too small for healthy camping.*
Loon Survey
Pike Lake Community Association participated in the Canadian Lakes Loon Survey (2012-present) and promotes responsible loon viewing following survey protocols and reports the observations in the Pike Lake Post and at the Pike Lake AGM. Survey results promote discussion of threats to loons and other waterfowl.*
Pike Lake Association Leadership
Municipal Liaison
Pike Lake Community Association invited the Reeve of Tay Valley Township to the Pike Lake AGM every year to speak about municipal issues and events affecting Pike Lake residents.*
Pike Lake Community Association provided input based on Lake Stewardship Handbook to Tay Valley Township’s Official Plan Review (2014) with a copy included in 2014 Pike Lake Post.*
Pike Lake Education
Pike Lake Community Association established a sub-committee which presented a guide, “Watch your Wake” included with 2013 Pike Lake Post and on the PLCA website. This has been distributed and shared as an example for boaters on Pike Lake and other lakes.*
Private donor on Pike Lake funded “slow” signs at sensitive locations with input from MNR and Transport Canada. Obtained funding from MNR for signage at public boat launch (2012).*
Pike Lake Community Association hosted “Bug Talk” at Boatilla 2015, where participants young and old learned about the invertebrates that live at the shoreline.*
Pike Lake Community Association raised awareness about Eurasian Milfoil and how it can spread as part of the Pike Lake Steward’s report at the 2014 Pike Lake AGM.*
Each year, the Pike Lake Post includes a feature article in the “Science for the Family” section: the Northern Pike (2012), Canadian Beaver (2013), Common Loon (2014), Great Blue Heron (2015) and Ticks and Lyme Disease (2016).*
Copies of the Pike Lake Post, Pike Lake State of the Lake Report, and of “Keeping Pike Lake Healthy” are available on the PLCA website for easy access and reprinting.*
Lake Planning
Pike Lake Community Association prepared the State of Pike Lake and its Watershed (2009) report that provides a summary of what is currently known about the Pike Lake watershed and which describes how that information relates to the issues that are important to people who enjoy the lake. Members of the Pike Lake community will use this information to develop actions and recommendations that help ensure the long-term health of Pike Lake and its watershed.*
Pike Lake Community Association prepared the Pike Lake Stewardship Handbook "Keeping Pike Lake Healthy" (2011) that provides an overview of Pike Lake, a summary of the key issues facing Pike Lake, and simple, inexpensive, and effective actions residents - individually and collectively - can take to keep Pike Lake healthy for present and future generations. It draws on the outcomes of the several-year process in which Pike Lakers identified issues affecting the present and future quality of the water and the Pike Lake environment more generally, and discusses how to preserve and improve the water quality and the lake environment.*
Pike Lake Community Association summarized the actions taken by the lake association in the report "Pike Lake Stewardship Update 2011-2016" that provides suggestions of potential actions to take moving forward. Since 2011, the PLCA has undertaken stewardship actions each year that have addressed the three priorities of water quality, natural environment and development pressures.*
7.0 Pike Lake Catchment: Challenges/Issues
Developed by the Pike Lake Community Association and volunteers, the Report on the State of Pike Lake and its Watershed (2009) and the Keeping Pike Lake Healthy Stewardship Handbook (2011) provide information on many aspects of the lake environment, as well as issues of concern identified by the lake community that could threaten the long-term health of the lake. The following list includes some of those identified issues that have implications for the land and water resources of the lake ecosystem. Specific issues noted by the lake community are indicated by an asterisk.
Development
Potential impacts to the lake environment from secondary shoreline development (i.e. second tier) is an ongoing concern.*
Waterfront property development is occurring primarily through the transformation of traditional, seasonal cottages into larger year-round dwellings. This transition is taking place either through re-development of an existing cottage lot or incremental alterations (additions, sleeping cabins, gazebos, decks, sheds, boat houses, garages, lawns, shoreline modifications, docks), all of which may put additional stress on the sensitive shoreline zone and the lake along with potential, added septic system loading.
Many waterfront properties contain existing non-conforming dwellings with respect to minimum water frontage and lot area and are often located within 30 metres of the water that require minor variances for expansion and/or reconstruction of dwellings where standard development setbacks from water are difficult to achieve. In these cases, of which there are many, staff at Rideau Lakes and Tay Valley Townships and the Conservation Authority often meet with resistance and push back when attempts are made to implement standards for development setbacks, vegetated shorelines and septic systems.
Monitoring implementation of conditions of planning and regulatory approvals is challenging due to a lack of resources.
Headwaters/In-Water Habitat/Shorelines
Introduction of invasive species (e.g., Eurasian Milfoil, Zebra Mussel) to Pike Lake and the control of their spread.*
Pike Lake has 69 percent of its shoreline composed of natural vegetation. This is below the 75 percent target that is recommended by experts for the protection of the catchment’s waterbodies and watercourses, 30 metres back from the shoreline of streams, rivers and lakes (see Section 4.4 of this report).
Crosby Lake has 58 percent of its shoreline composed of natural vegetation. This is below the 75 percent target that is recommended by experts for the protection of the catchment’s waterbodies and watercourses, 30 metres back from the shoreline of streams, rivers and lakes (see Section 4.4 of this report).
Little Crosby Lake has seen a small increase in the area of settlement (0.21 ha.) along its shoreline between 2008 and 2014, due to a loss of woodland (see Section 4.4 of this report).
Pike Lake has seen a small increase in the area of settlement (0.09 ha.) along its shoreline between 2008 and 2014, due to a loss of woodland (see Section 4.4 of this report).
Four of nineteen sampled headwater sites in the catchment have been modified (three are channelized; one is a roadside ditch)(see Section 3.4.2 of this report).
Littoral zone mapping identifying substrate type, vegetation and habitat features along with opportunities for shoreline enhancement is unavailable for Crosby, Little Crosby and Pike Lakes.
Lake Planning
Nine key issues identified by lake residents in the Report on the State of Pike Lake and its Watershed (2009): 1) Water quality 2) Development pressures 3) Conservation and protection of the natural environment 4) Impacts of motor vehicles 5) Crown land 6) Mining concerns 7) Aquatic vegetation 8) Water levels 9) Fisheries health.*
Land Cover
Land cover has changed across the catchment (2008 to 2014) largely as a result of an increase in the area of wetland (5 ha.) and settlement (4 ha.) and loss of woodland (4 ha.), crop and pastureland (2 ha.) and meadow-thicket (1 ha.)(see Section 4.1 of this report).
Wetlands have declined by six percent since European pre-settlement and now cover 20 percent (1220 ha.) of the catchment (in 2014). Sixty-five percent (792 ha.) of these wetlands remain unevaluated and unregulated and although they are not under imminent threat from development activity, they do remain vulnerable to drainage and land clearing activities in the absence of any regulatory and planning controls that would otherwise protect them for the many important hydrological, social, biological and ecological functions/services/values they provide to landowners and the surrounding community (see Section 4.3 of this report).
Mis/overuse of the Crown Land islands in the lake, including fire danger and garbage from camping activity.*
Water Levels
Management of water levels on Pike Lake for waterfront property owners; in particular, flooding in the spring and late fall and the lack of adequate drainage at its outlet to Grants Creek.*
Water Quality
Algal blooms are a source of concern for Pike Lake residents.*
Stanleyville Dump remains a concern to residents of Pike Lake for its potential impact on surface and groundwater quality.*
Crosby Lake surface chemistry water quality rating ranges from Fair to Good (see Section 2.1 of this report).
Little Crosby Lake surface chemistry water quality rating is Fair. The score at this site is largely influenced by occasional high nutrient concentrations, bacterial pollution and metal (aluminum) exceedances (see Section 2.2 of this report).
Pike Lake surface chemistry water quality does not exhibit any sampling concerns (see Section 2.3 of this report).
Seventy-two (of 255) Tay Valley Township mandatory septic system inspections conducted from 2004 to 2017 on Pike Lake revealed the need for remedial work (on 64 systems) and replacements (of eight systems) to be performed. An additional seven inspections require more information to be provided to landowners. Those properties with concerns are identified in the yearly report submitted by the Mississippi Rideau Septic System Office to the Township.
Thirty-four (of 61) Rideau Lakes Township voluntary septic system re-inspections conducted from 2007 to 2017 on Crosby and Little Crosby Lake revealed the need for remedial/maintenance work to be performed on 34 septic systems and no replacements. An additional four inspections require more information to be provided to landowners. Those properties with concerns are identified in the yearly report submitted by the Mississippi Rideau Septic System Office to the Township.
Wildlife
Protection of the Pike Lake loon population from human activity (e.g., from watercraft incursions; fishing and hunting residues).*
8.0 Pike Lake Catchment: Actions/Opportunities
Developed by the Pike Lake Community Association and its partners, the Report on the State of Pike Lake and its Watershed (2009) and the Keeping Pike Lake Healthy Stewardship Handbook (2011) provide information on many aspects of the lake environment, as well as actions and opportunities to maintain and improve the long-term health of the lake. The following list includes some of those identified actions and opportunities that have implications for the land and water resources of the lake ecosystem. Specific actions and opportunities noted by the Pike Lake community are indicated by an asterisk.
Pike Lake and Catchment Health
Development
Work with approval authorities (Lanark County, Leeds Grenville and Lanark District Health Unit, Mississippi Rideau Septic System Office, Rideau Lakes and Tay Valley Townships) and waterfront property owners (including the Crosby Lake Association, Little Crosby Lake community, Pike Lake Community Association and RVCA) to consistently implement current land use planning and development policies for water quality and shoreline protection adjacent to Crosby, Little Crosby and Pike Lakes and headwater streams in the catchment (i.e., a minimum 30 metre development setback from water).
Explore ways and means to more effectively enforce and implement conditions of land-use planning and development approval to achieve net environmental gains (particularly with respect to rehabilitating or protecting naturally vegetated shorelines and water quality).
Encourage Committees of Adjustment to take advantage of technical and environmental information and recommendations forthcoming from planning and environmental professionals.
Municipalities in the Tay Watershed are encouraged to strengthen natural heritage and water resources official plan policies and zoning provisions (pertaining to water setbacks, frontage and naturalized shorelines and wetland protection) where deemed appropriate.
Work with Lanark County, Rideau Lakes and Tay Valley Townships and agencies to ensure that development approvals around lakes and along watercourses take into consideration the protection of fish habitat (including the near-shore nursery and spawning habitat).
Municipal and agency planners together with development proponents are to use the 2014 Site Evaluation Guidelines to inform decision-making about the application of development setbacks on lots with shallow soils/bedrock, steep slopes and sparse vegetation cover along with the use of the appropriate, development related, best management practices.
Utilize RVCA subwatershed and catchment reports to help develop/revise official plan policies to protect surface water resources and the natural environment (including woodlands, wetlands and shoreline cover).
Establish RVCA regulation limits around the 65 percent (792 ha.) of wetlands in the catchment that are unevaluated. Doing this will help protect landowners from natural hazards including mitigating surface water flow by storing water during periods of peak flow (such as spring snowmelt and heavy rainfall events) and releasing water during periods of low flow (this mitigation of water flow reduces flood damage), as well as contributing to the stabilization of shorelines and to the reduction of soil erosion damage through water flow mitigation and plant soil binding/retention.
Shorelines
Pike Lake Community Association will continue to promote the RVCA Shoreline Naturalization Program because well-vegetated shorelines are one of the most effective ways to protect water quality. Planting shrubs and plants - which won’t block the lake view - will:*
- trap runoff and excess nutrients
- discourage growth of algae and aquatic plants
- provide shelter and food for wildlife
- support spawning beds for fish
- shade and cool water
- reduce erosion
Identify possible demonstration sites (i.e., crown or private land volunteered by landowner) for shoreline naturalization. Pike Lake Community Association could provide volunteers to do the plantings and follow-up monitoring.*
Host plant day to promote naturalized shorelines and to make native plants accessible to the Pike Lake Community Association membership.*
Take advantage of the RVCA Shoreline Naturalization Program to re-naturalize altered creek, lake and stream shoreline identified in this report as “Unnatural Riparian Land Cover". Concentrate stewardship efforts on Crosby Lake and Pike Lake waterfront properties shown in orange on the Riparian Land Cover map (see Figure 44 in Section 4.4 of this report). Other stewardship opportunities in the catchment may be determined based on septic system inspections and surface water quality monitoring results.
Promote the use of bioengineering methods (using native shrub/tree planting, fascines, live stakes) as a shoreline erosion mitigation measure as well as a cost effective alternative to shoreline hardening (with rip rap, armour stone, gabion baskets, walls)
Educate landowners about the value and importance of natural shorelines and property best management practices with respect to shoreline use and development, septic system installation and maintenance and, shoreline vegetation retention and enhancement (Crosby Lake Association, Lanark County, Leeds Grenville and Lanark District Health Unit, Little Crosby Lake community, Mississippi Rideau Septic System Office, Pike Lake Community Association, RVCA, Rideau Lakes and Tay Valley Townships).
Water Quality
Pike Lake Community Association (PLCA) will continue to work with the RVCA Watershed Watch Program to collect and analyse water samples every summer - a critical tool in tracking the health of the lake - and report the results to the PLCA through the Pike Lake Post and the PLCA website. A follow-up on the results will occur as appropriate, as well as examining the merits of increasing the number of sites sampled.*
Continue to educate landowners about the causes of excessive algae and aquatic vegetation growth and the need to reduce total phosphorus inputs to Pike Lake through good stewardship practices.*
Examine value of further partnering with a data management organisation (e.g., Water Rangers) to have data mapped and easily accessible to Pike Lake Community Association membership and the public.*
Provide a summary of outcomes of voluntary and mandatory septic re-inspection programs on catchment lakes over a five year period.*
Consider further investigation of the 1) Fair surface chemistry water quality rating on Little Crosby Lake and 2) Fair to Good surface chemistry water quality rating on Crosby Lake as part of a review of RVCA's Watershed Watch, Baseline and Benthic Invertebrate surface water quality monitoring.
Promote the septic system re-inspection program offered by the Mississippi Rideau Septic System Office on behalf of Rideau Lakes and Tay Valley Townships.
Offer funding provided by the RVCA Rural Clean Water Program to landowners with potential projects that could improve water quality on Crosby, Little Crosby and Pike Lakes and their tributaries (e.g., livestock fencing, septic system repair/replacement and streambank erosion control/stabilisation). Concentrate efforts at septic systems requiring remedial work or replacement, including the 106 identified as needing additional maintenance/remedial/replacement work since 2004.
Educate waterfront property owners about septic system care by providing information about sewage system maintenance (i.e., when to pump out septic systems and holding talks) through initiatives such as the Septic Savvy Workshop and services provided by the Mississippi Rideau Septic System Office.
Reduce pollutant loadings to Crosby, Little Crosby and Pike Lakes through education about the application of shoreline, stormwater and agricultural best management practices; also consider using low impact development (LID) methods to improve the quality and reduce the amount of stormwater runoff directly reaching the lake ecosystem. This will be particularly beneficial in areas with extensive impervious surfaces (i.e., asphalt, concrete, buildings, and severely compacted soils) or on sensitive waterfront properties (with steep slopes/banks, shallow/impermeable soils).
Pike Lake and Catchment Habitat
Aquatic Habitat/Fisheries/Wildlife
Raise awareness about risks of invasive species in the Pike Lake Post and website (e.g., feature article) and at special events.*
Carry-on with annual clean-up of crown owned islands in Pike Lake and check-up of camp sites. Install additional signage about camping etiquette, permissions and restrictions, as required.*
Promote participation in Canadian Lakes Loon Survey and other Bird Survey programs to increase robustness of observations at Pike Lake. Should findings indicate three successive years of no nesting, consider installing loon nesting platforms to provide suitable habitat.*
Install the third outstanding walleye spawning bed, off Wilson Island in Pike Lake.*
Educate waterfront property owners about: 1) fish habitat requirements, spawning timing and near-shore and in-water activities that can disturb or destroy fish habitat and spawning sites 2) the causes of excessive algae and aquatic vegetation growth (see the RVCA publication entitled Algae and Aquatic Plant Educational Manual) and 3) healthy lake ecosystems and associated water level fluctuations in a natural environment.
Crosby and Pike Lake Association Leadership
Lake Planning
Pike Lake Association is leading the implementation of the many "Possible Next Steps" listed in the report "Pike Lake Stewardship Update 2011-2016" that provides suggestions of potential actions to take moving forward. Since 2011, the Pike Lake Community Association has undertaken stewardship actions each year that have addressed the three priorities of water quality, natural environment and development pressures.*
Use the information contained in the Tay River Subwatershed Report 2017 and Pike Lake Catchment Report 2017 to assist with a review/update of the State of Pike Lake and its Watershed (2009) report.
Crosby Lake Association may wish to consider a lake planning process to develop a Lake Plan that: • Is an action plan developed by a lake community that identifies and preserves the natural and social characteristics that are valued by the lake community for future generations • Helps to promote community discussion, education and action • Sets goals and objectives for the protection and enhancement of the lake • Recommends land use policies/practices that influence development on the lake • Promotes stewardship actions to improve the environmental conditions of a lake so it can be enjoyed by future generations.
Municipal Liason
Invite the Reeve of Tay Valley Township to the Pike Lake AGM to speak about municipal issues and events affecting Pike Lake residents.*
Pike Lake Education
Review Pike Lake signage to identify other sensitive areas and hazards for potential marking, and mark as appropriate.*
Host workshops and facilitate naturalist activities promoting knowledge of the Pike Lake environment. Note that the Boatilla (or a similar event) is an excellent venue for such activities.*
Continue to solicit input and article ideas from Pike Lake Community Association membership and include features in the “Science for the Family” section of the Pike Lake Post.*
Invite special guest speakers to the Pike Lake AGM to talk about lake health and protection.*
Promote environmentally friendly boating with the “Watch your Wake” guide prepared by the Pike Lake Community Association.*
Make copies of the Pike Lake Post, Pike Lake State of the Lake Report and Keeping Pike Lake Healthy accessible on the Pike Lake Community Association website.*
 Figure 1 Land cover in the Pike Lake catchment
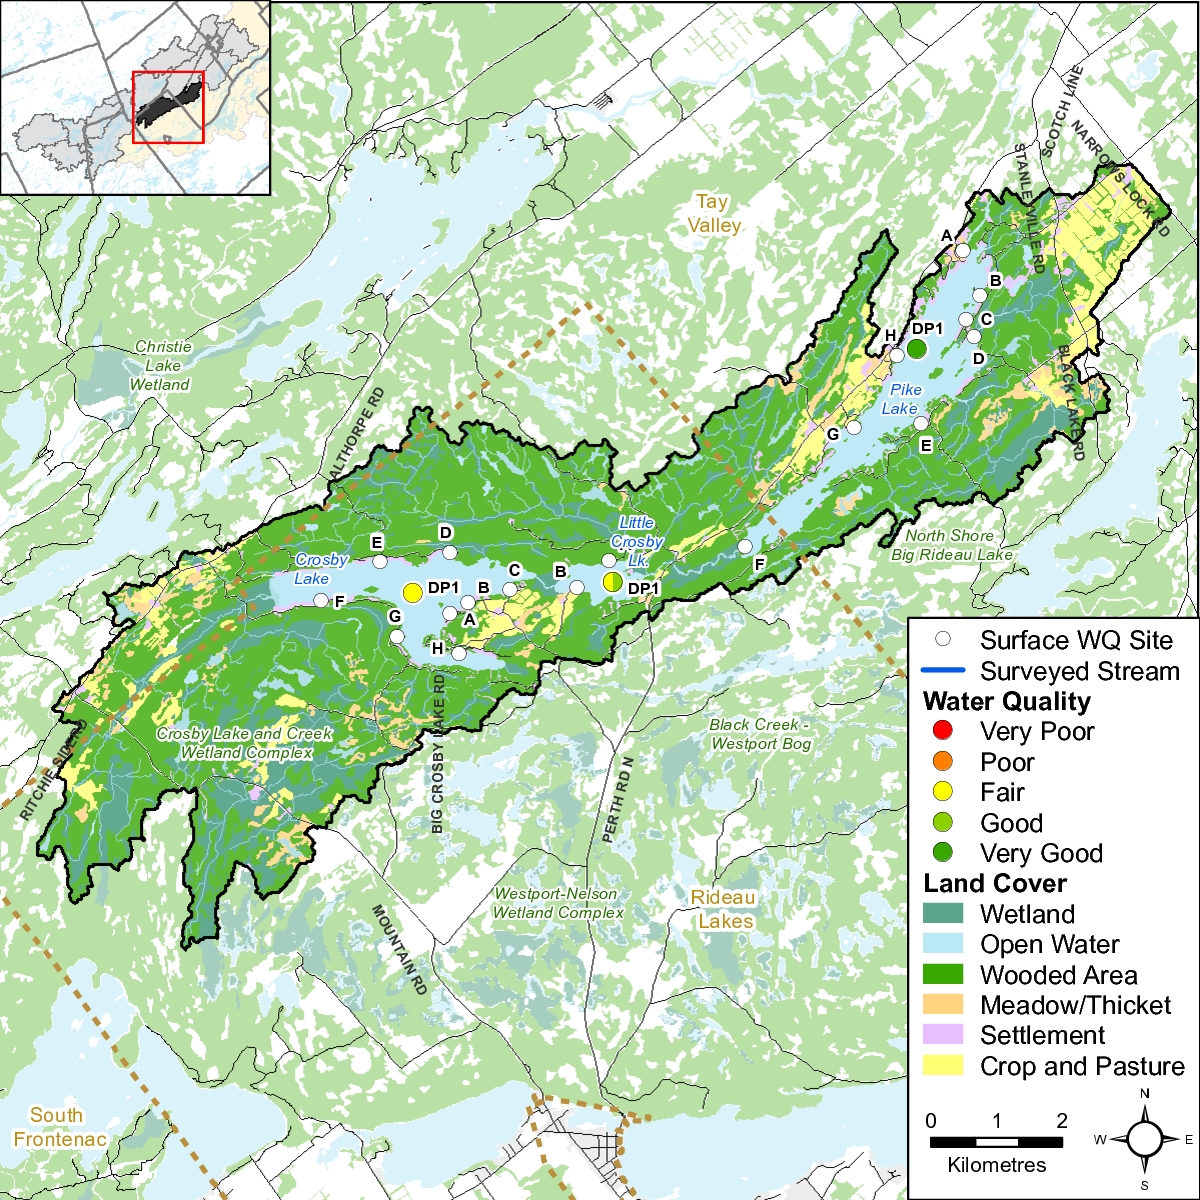
 on Crosby Lake, 2006-2017.")
 on Crosby Lake, 2006-2017")
 on Crosby Lake, 2006-2017.")
 on Crosby Lake, 2006-2017.")


 on Crosby Lake, 2006-2017")
 on Crosby Lake, 2006-2017")
 on Crosby Lake, 2006-2017")

 on Little Crosby Lake, 2006-2017")
 on Little Crosby Lake, 2006-2017")
 on Little Crosby Lake, 2006-2017.")
 on Little Crosby Lake, 2006-2017.")


 on Little Crosby Lake, 2006-2017.")
 on Little Crosby Lake, 2006-2017.")
 on Little Crosby Lake, 2006-2017.")

 on Pike Lake, 2006-2017")
 on Pike Lake, 2006-2017")
 on Pike Lake, 2006-2017.")
 on Pike Lake, 2006-2017.] Figure 25 Total Kjeldahl nitrogen sampling results at the deep point site (DP1) on Pike Lake, 2006-2017. Figure 26 Average total Kjeldahl nitrogen sampling results at the deep point site (DP1) on Pike Lake, 2006-2017.")


 on Pike Lake, 2006-2017.")
 on Pike Lake, 2006-2017.")


")
")


